Zip Codes with the Highest Percentage of Population with a Degree in Liberal Arts and History in Pearland, TX
RELATED REPORTS & OPTIONS
Liberal Arts and History
Pearland
Compare Zip Codes
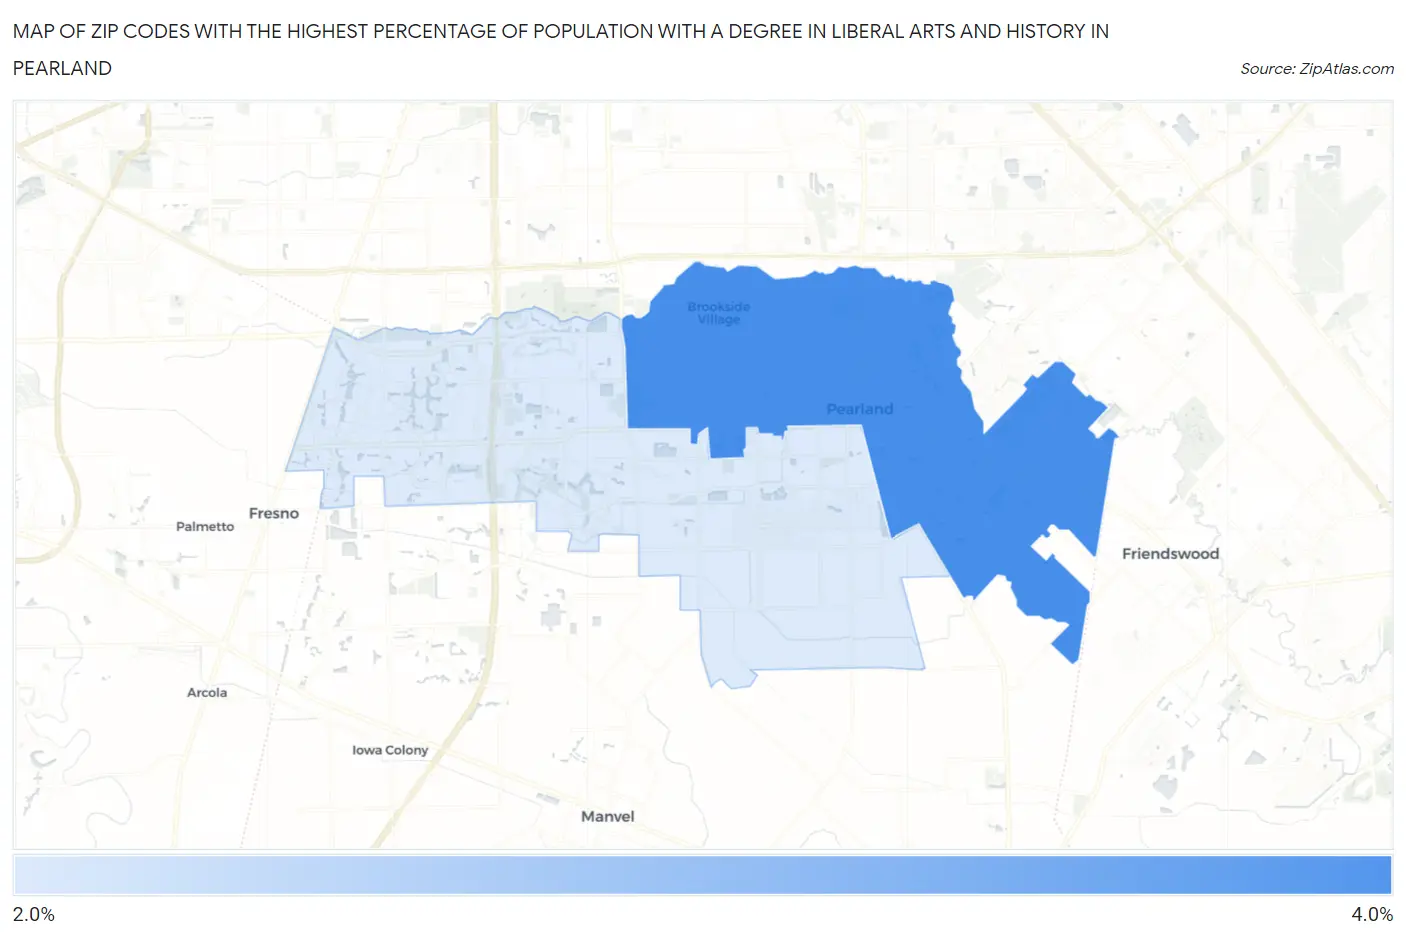
Map of Zip Codes with the Highest Percentage of Population with a Degree in Liberal Arts and History in Pearland
2.9%
3.6%
Zip Codes with the Highest Percentage of Population with a Degree in Liberal Arts and History in Pearland, TX
| Zip Code | % Graduates | vs State | vs National | |
| 1. | 77581 | 3.6% | 4.2%(-0.547)#873 | 4.9%(-1.27)#16,246 |
| 2. | 77584 | 2.9% | 4.2%(-1.24)#1,038 | 4.9%(-1.96)#18,674 |
1
Common Questions
What are the Top Zip Codes with the Highest Percentage of Population with a Degree in Liberal Arts and History in Pearland, TX?
Top Zip Codes with the Highest Percentage of Population with a Degree in Liberal Arts and History in Pearland, TX are:
What zip code has the Highest Percentage of Population with a Degree in Liberal Arts and History in Pearland, TX?
77581 has the Highest Percentage of Population with a Degree in Liberal Arts and History in Pearland, TX with 3.6%.
What is the Percentage of Population with a Degree in Liberal Arts and History in Pearland, TX?
Percentage of Population with a Degree in Liberal Arts and History in Pearland is 3.3%.
What is the Percentage of Population with a Degree in Liberal Arts and History in Texas?
Percentage of Population with a Degree in Liberal Arts and History in Texas is 4.2%.
What is the Percentage of Population with a Degree in Liberal Arts and History in the United States?
Percentage of Population with a Degree in Liberal Arts and History in the United States is 4.9%.