Zip Codes with the Highest Percentage of Population with a Degree in Liberal Arts and History in Georgetown, TX
RELATED REPORTS & OPTIONS
Liberal Arts and History
Georgetown
Compare Zip Codes
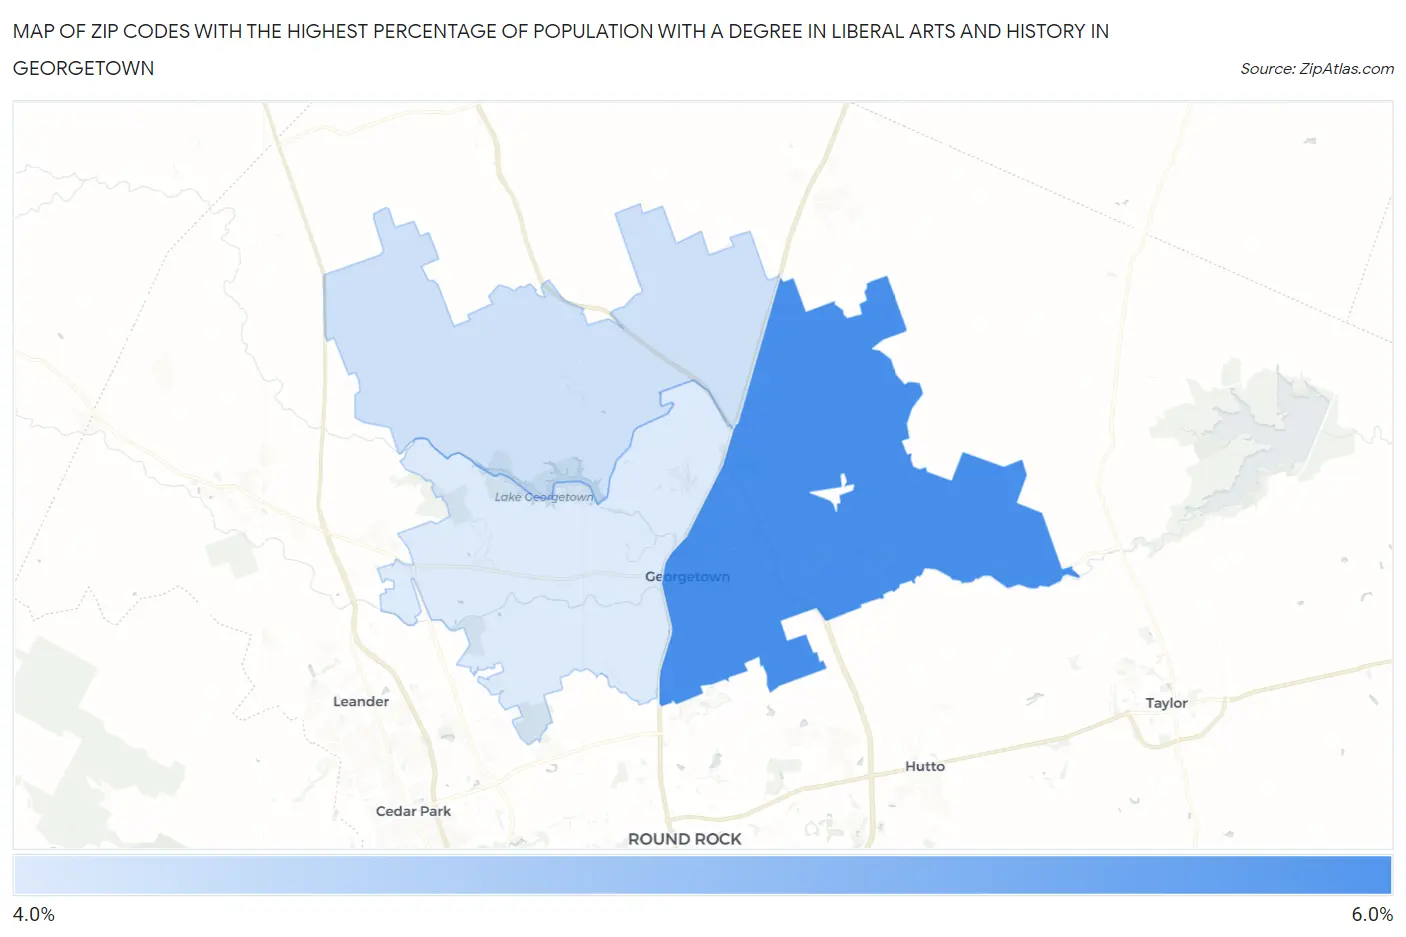
Map of Zip Codes with the Highest Percentage of Population with a Degree in Liberal Arts and History in Georgetown
4.1%
5.4%
Zip Codes with the Highest Percentage of Population with a Degree in Liberal Arts and History in Georgetown, TX
| Zip Code | % Graduates | vs State | vs National | |
| 1. | 78626 | 5.4% | 4.2%(+1.22)#517 | 4.9%(+0.498)#10,206 |
| 2. | 78633 | 4.2% | 4.2%(+0.067)#725 | 4.9%(-0.654)#13,938 |
| 3. | 78628 | 4.1% | 4.2%(-0.048)#763 | 4.9%(-0.769)#14,393 |
1
Common Questions
What are the Top Zip Codes with the Highest Percentage of Population with a Degree in Liberal Arts and History in Georgetown, TX?
Top Zip Codes with the Highest Percentage of Population with a Degree in Liberal Arts and History in Georgetown, TX are:
What zip code has the Highest Percentage of Population with a Degree in Liberal Arts and History in Georgetown, TX?
78626 has the Highest Percentage of Population with a Degree in Liberal Arts and History in Georgetown, TX with 5.4%.
What is the Percentage of Population with a Degree in Liberal Arts and History in Georgetown, TX?
Percentage of Population with a Degree in Liberal Arts and History in Georgetown is 4.8%.
What is the Percentage of Population with a Degree in Liberal Arts and History in Texas?
Percentage of Population with a Degree in Liberal Arts and History in Texas is 4.2%.
What is the Percentage of Population with a Degree in Liberal Arts and History in the United States?
Percentage of Population with a Degree in Liberal Arts and History in the United States is 4.9%.