Zip Codes with the Highest Percentage of Population with a Degree in Liberal Arts and History in Amarillo, TX
RELATED REPORTS & OPTIONS
Liberal Arts and History
Amarillo
Compare Zip Codes
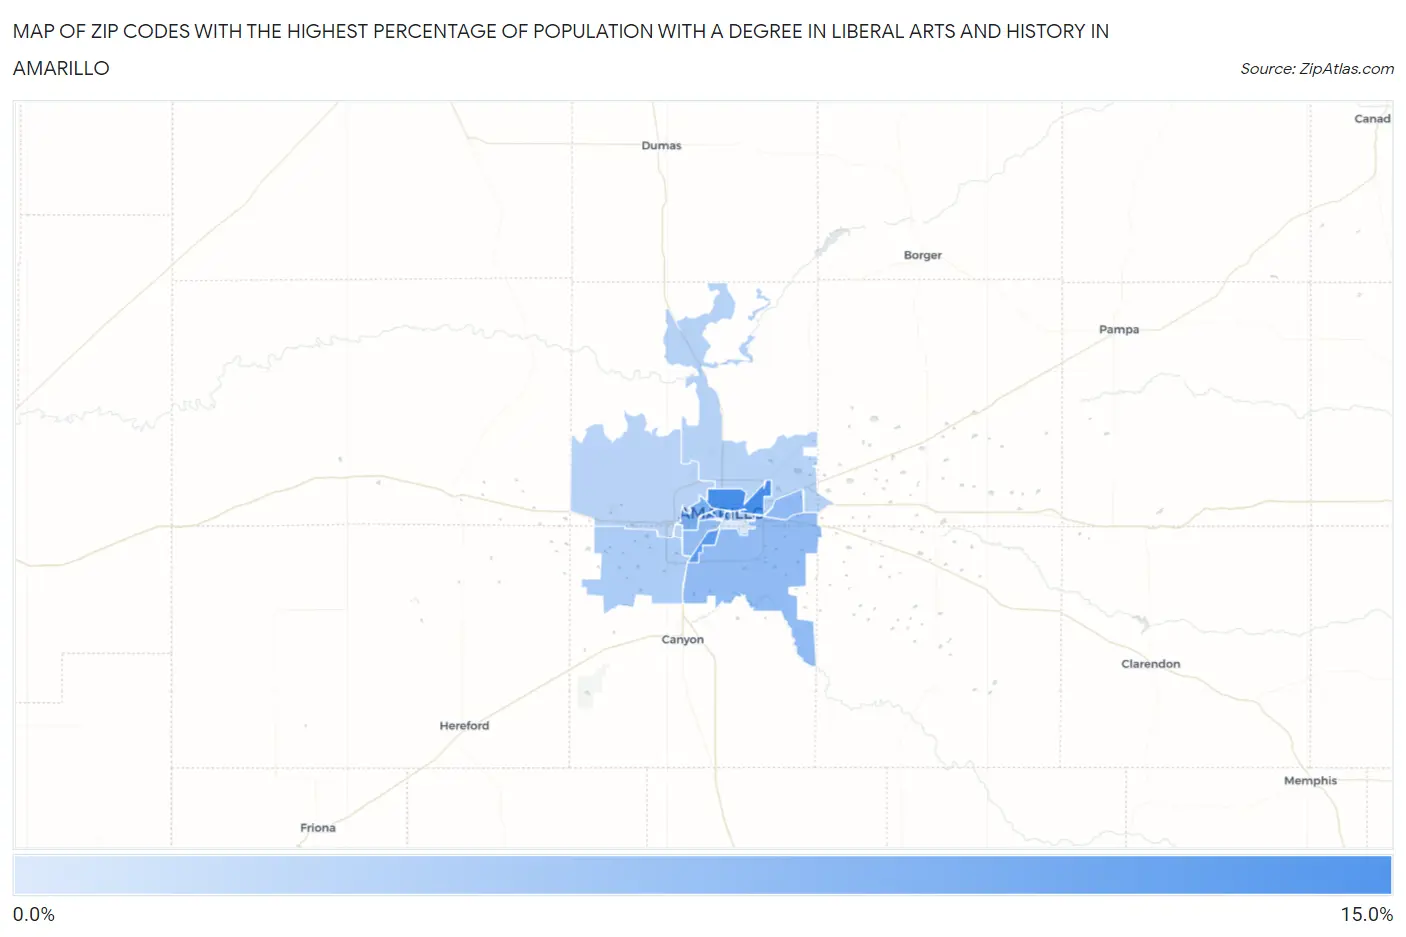
Map of Zip Codes with the Highest Percentage of Population with a Degree in Liberal Arts and History in Amarillo
1.9%
12.9%
Zip Codes with the Highest Percentage of Population with a Degree in Liberal Arts and History in Amarillo, TX
| Zip Code | % Graduates | vs State | vs National | |
| 1. | 79107 | 12.9% | 4.2%(+8.79)#91 | 4.9%(+8.07)#1,925 |
| 2. | 79110 | 11.3% | 4.2%(+7.14)#115 | 4.9%(+6.42)#2,437 |
| 3. | 79101 | 9.3% | 4.2%(+5.13)#176 | 4.9%(+4.41)#3,622 |
| 4. | 79102 | 8.9% | 4.2%(+4.78)#190 | 4.9%(+4.06)#3,916 |
| 5. | 79106 | 8.8% | 4.2%(+4.61)#202 | 4.9%(+3.89)#4,070 |
| 6. | 79111 | 7.6% | 4.2%(+3.42)#269 | 4.9%(+2.70)#5,475 |
| 7. | 79118 | 7.3% | 4.2%(+3.16)#285 | 4.9%(+2.44)#5,870 |
| 8. | 79109 | 7.2% | 4.2%(+3.09)#291 | 4.9%(+2.37)#5,977 |
| 9. | 79119 | 5.3% | 4.2%(+1.14)#527 | 4.9%(+0.415)#10,476 |
| 10. | 79104 | 5.0% | 4.2%(+0.877)#563 | 4.9%(+0.156)#11,268 |
| 11. | 79108 | 4.6% | 4.2%(+0.438)#647 | 4.9%(-0.283)#12,672 |
| 12. | 79124 | 4.5% | 4.2%(+0.340)#671 | 4.9%(-0.382)#12,998 |
| 13. | 79121 | 4.0% | 4.2%(-0.147)#783 | 4.9%(-0.868)#14,760 |
| 14. | 79103 | 1.9% | 4.2%(-2.29)#1,260 | 4.9%(-3.01)#21,696 |
1
Common Questions
What are the Top 10 Zip Codes with the Highest Percentage of Population with a Degree in Liberal Arts and History in Amarillo, TX?
Top 10 Zip Codes with the Highest Percentage of Population with a Degree in Liberal Arts and History in Amarillo, TX are:
What zip code has the Highest Percentage of Population with a Degree in Liberal Arts and History in Amarillo, TX?
79107 has the Highest Percentage of Population with a Degree in Liberal Arts and History in Amarillo, TX with 12.9%.
What is the Percentage of Population with a Degree in Liberal Arts and History in Amarillo, TX?
Percentage of Population with a Degree in Liberal Arts and History in Amarillo is 7.6%.
What is the Percentage of Population with a Degree in Liberal Arts and History in Texas?
Percentage of Population with a Degree in Liberal Arts and History in Texas is 4.2%.
What is the Percentage of Population with a Degree in Liberal Arts and History in the United States?
Percentage of Population with a Degree in Liberal Arts and History in the United States is 4.9%.