Zip Codes with the Highest Percentage of Population with a Degree in Liberal Arts and History in San Antonio, TX
RELATED REPORTS & OPTIONS
Liberal Arts and History
San Antonio
Compare Zip Codes
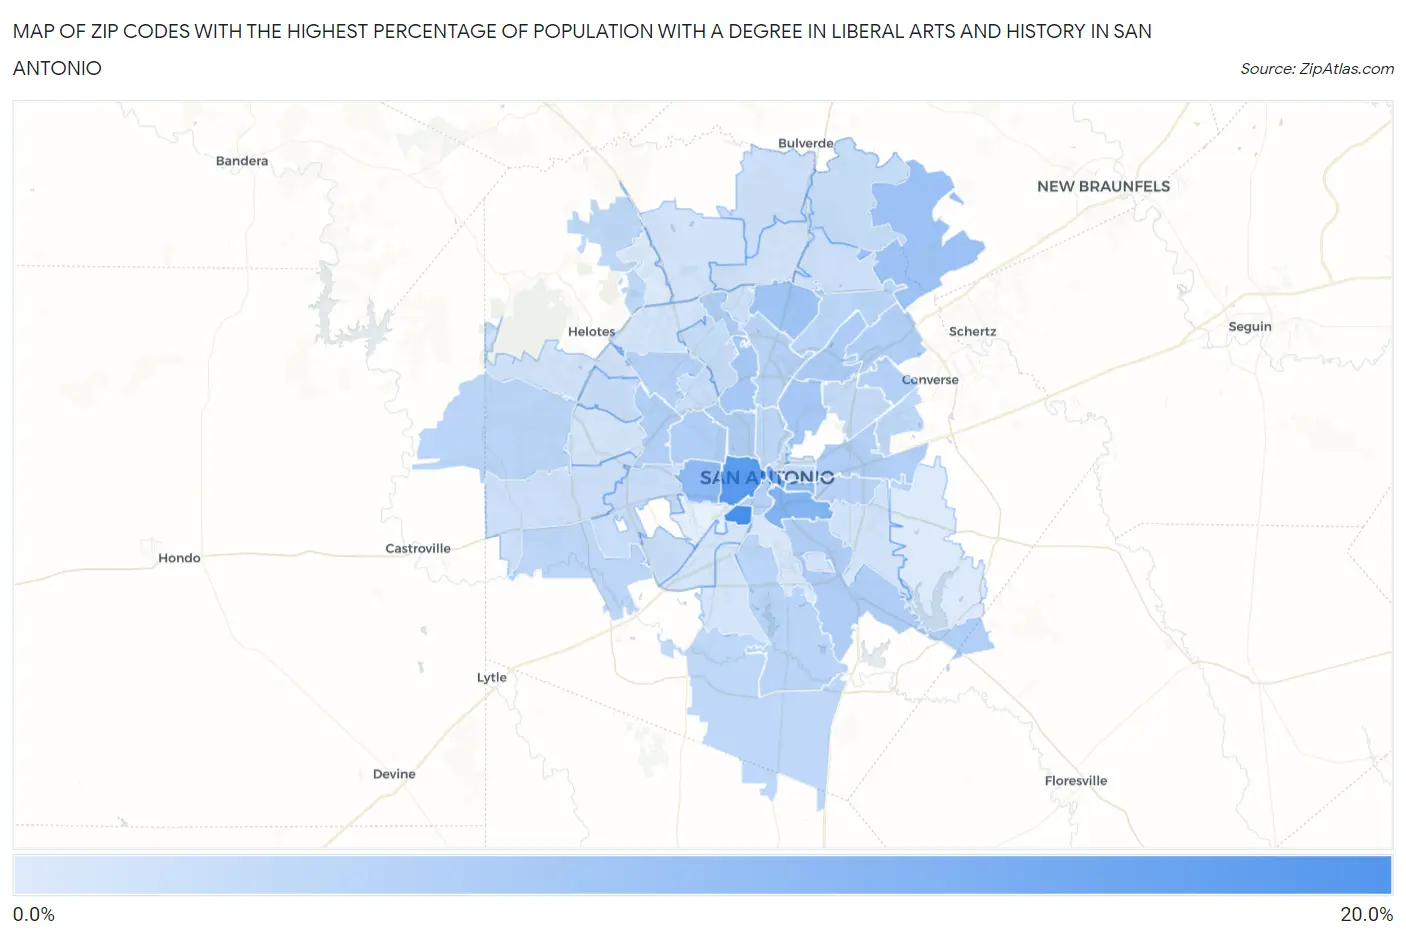
Map of Zip Codes with the Highest Percentage of Population with a Degree in Liberal Arts and History in San Antonio
1.4%
17.1%
Zip Codes with the Highest Percentage of Population with a Degree in Liberal Arts and History in San Antonio, TX
| Zip Code | % Graduates | vs State | vs National | |
| 1. | 78225 | 17.1% | 4.2%(+13.0)#56 | 4.9%(+12.3)#1,122 |
| 2. | 78207 | 15.4% | 4.2%(+11.3)#64 | 4.9%(+10.5)#1,339 |
| 3. | 78205 | 12.5% | 4.2%(+8.31)#97 | 4.9%(+7.59)#2,062 |
| 4. | 78210 | 10.5% | 4.2%(+6.37)#138 | 4.9%(+5.65)#2,810 |
| 5. | 78237 | 9.3% | 4.2%(+5.18)#175 | 4.9%(+4.46)#3,577 |
| 6. | 78203 | 8.9% | 4.2%(+4.73)#192 | 4.9%(+4.01)#3,961 |
| 7. | 78266 | 8.0% | 4.2%(+3.81)#240 | 4.9%(+3.09)#4,946 |
| 8. | 78232 | 7.7% | 4.2%(+3.51)#263 | 4.9%(+2.79)#5,364 |
| 9. | 78213 | 6.9% | 4.2%(+2.78)#327 | 4.9%(+2.06)#6,505 |
| 10. | 78209 | 6.8% | 4.2%(+2.70)#338 | 4.9%(+1.98)#6,643 |
| 11. | 78217 | 6.5% | 4.2%(+2.34)#364 | 4.9%(+1.62)#7,357 |
| 12. | 78231 | 6.1% | 4.2%(+1.93)#417 | 4.9%(+1.20)#8,324 |
| 13. | 78223 | 6.0% | 4.2%(+1.83)#428 | 4.9%(+1.11)#8,559 |
| 14. | 78233 | 5.9% | 4.2%(+1.73)#443 | 4.9%(+1.00)#8,852 |
| 15. | 78201 | 5.8% | 4.2%(+1.69)#449 | 4.9%(+0.964)#8,949 |
| 16. | 78228 | 5.8% | 4.2%(+1.67)#451 | 4.9%(+0.948)#8,988 |
| 17. | 78219 | 5.8% | 4.2%(+1.66)#452 | 4.9%(+0.938)#9,011 |
| 18. | 78238 | 5.8% | 4.2%(+1.65)#454 | 4.9%(+0.933)#9,023 |
| 19. | 78239 | 5.6% | 4.2%(+1.49)#474 | 4.9%(+0.768)#9,456 |
| 20. | 78240 | 5.4% | 4.2%(+1.26)#511 | 4.9%(+0.538)#10,106 |
| 21. | 78204 | 5.2% | 4.2%(+1.09)#533 | 4.9%(+0.372)#10,613 |
| 22. | 78216 | 5.1% | 4.2%(+0.998)#545 | 4.9%(+0.277)#10,876 |
| 23. | 78220 | 5.1% | 4.2%(+0.916)#556 | 4.9%(+0.195)#11,140 |
| 24. | 78247 | 4.9% | 4.2%(+0.746)#586 | 4.9%(+0.025)#11,645 |
| 25. | 78253 | 4.8% | 4.2%(+0.675)#604 | 4.9%(-0.047)#11,901 |
| 26. | 78221 | 4.8% | 4.2%(+0.615)#617 | 4.9%(-0.107)#12,077 |
| 27. | 78212 | 4.7% | 4.2%(+0.558)#628 | 4.9%(-0.164)#12,295 |
| 28. | 78252 | 4.5% | 4.2%(+0.382)#658 | 4.9%(-0.339)#12,875 |
| 29. | 78264 | 4.4% | 4.2%(+0.275)#686 | 4.9%(-0.446)#13,210 |
| 30. | 78255 | 4.4% | 4.2%(+0.251)#688 | 4.9%(-0.471)#13,288 |
| 31. | 78244 | 4.3% | 4.2%(+0.140)#710 | 4.9%(-0.581)#13,671 |
| 32. | 78202 | 4.1% | 4.2%(-0.080)#770 | 4.9%(-0.801)#14,509 |
| 33. | 78218 | 3.8% | 4.2%(-0.320)#823 | 4.9%(-1.04)#15,414 |
| 34. | 78261 | 3.8% | 4.2%(-0.337)#826 | 4.9%(-1.06)#15,467 |
| 35. | 78230 | 3.7% | 4.2%(-0.478)#859 | 4.9%(-1.20)#15,991 |
| 36. | 78227 | 3.5% | 4.2%(-0.640)#894 | 4.9%(-1.36)#16,549 |
| 37. | 78250 | 3.5% | 4.2%(-0.660)#900 | 4.9%(-1.38)#16,628 |
| 38. | 78242 | 3.5% | 4.2%(-0.701)#919 | 4.9%(-1.42)#16,783 |
| 39. | 78229 | 3.4% | 4.2%(-0.772)#938 | 4.9%(-1.49)#17,047 |
| 40. | 78245 | 3.1% | 4.2%(-1.04)#991 | 4.9%(-1.76)#17,965 |
| 41. | 78248 | 3.0% | 4.2%(-1.14)#1,009 | 4.9%(-1.86)#18,329 |
| 42. | 78259 | 3.0% | 4.2%(-1.17)#1,015 | 4.9%(-1.89)#18,435 |
| 43. | 78260 | 2.9% | 4.2%(-1.22)#1,028 | 4.9%(-1.94)#18,608 |
| 44. | 78215 | 2.7% | 4.2%(-1.43)#1,075 | 4.9%(-2.15)#19,237 |
| 45. | 78257 | 2.6% | 4.2%(-1.51)#1,100 | 4.9%(-2.23)#19,527 |
| 46. | 78235 | 2.6% | 4.2%(-1.53)#1,103 | 4.9%(-2.26)#19,595 |
| 47. | 78258 | 2.5% | 4.2%(-1.62)#1,128 | 4.9%(-2.34)#19,889 |
| 48. | 78254 | 2.5% | 4.2%(-1.68)#1,144 | 4.9%(-2.40)#20,084 |
| 49. | 78222 | 2.4% | 4.2%(-1.70)#1,150 | 4.9%(-2.42)#20,149 |
| 50. | 78208 | 2.4% | 4.2%(-1.77)#1,163 | 4.9%(-2.49)#20,316 |
| 51. | 78211 | 2.4% | 4.2%(-1.79)#1,171 | 4.9%(-2.52)#20,393 |
| 52. | 78249 | 2.3% | 4.2%(-1.81)#1,174 | 4.9%(-2.53)#20,445 |
| 53. | 78224 | 2.3% | 4.2%(-1.84)#1,184 | 4.9%(-2.56)#20,524 |
| 54. | 78251 | 2.3% | 4.2%(-1.90)#1,198 | 4.9%(-2.62)#20,688 |
| 55. | 78214 | 1.8% | 4.2%(-2.31)#1,265 | 4.9%(-3.03)#21,735 |
| 56. | 78256 | 1.5% | 4.2%(-2.61)#1,311 | 4.9%(-3.33)#22,424 |
| 57. | 78263 | 1.4% | 4.2%(-2.72)#1,323 | 4.9%(-3.44)#22,628 |
1
Common Questions
What are the Top 10 Zip Codes with the Highest Percentage of Population with a Degree in Liberal Arts and History in San Antonio, TX?
Top 10 Zip Codes with the Highest Percentage of Population with a Degree in Liberal Arts and History in San Antonio, TX are:
What zip code has the Highest Percentage of Population with a Degree in Liberal Arts and History in San Antonio, TX?
78225 has the Highest Percentage of Population with a Degree in Liberal Arts and History in San Antonio, TX with 17.1%.
What is the Percentage of Population with a Degree in Liberal Arts and History in San Antonio, TX?
Percentage of Population with a Degree in Liberal Arts and History in San Antonio is 4.4%.
What is the Percentage of Population with a Degree in Liberal Arts and History in Texas?
Percentage of Population with a Degree in Liberal Arts and History in Texas is 4.2%.
What is the Percentage of Population with a Degree in Liberal Arts and History in the United States?
Percentage of Population with a Degree in Liberal Arts and History in the United States is 4.9%.