Bonney, TX Map & Demographics
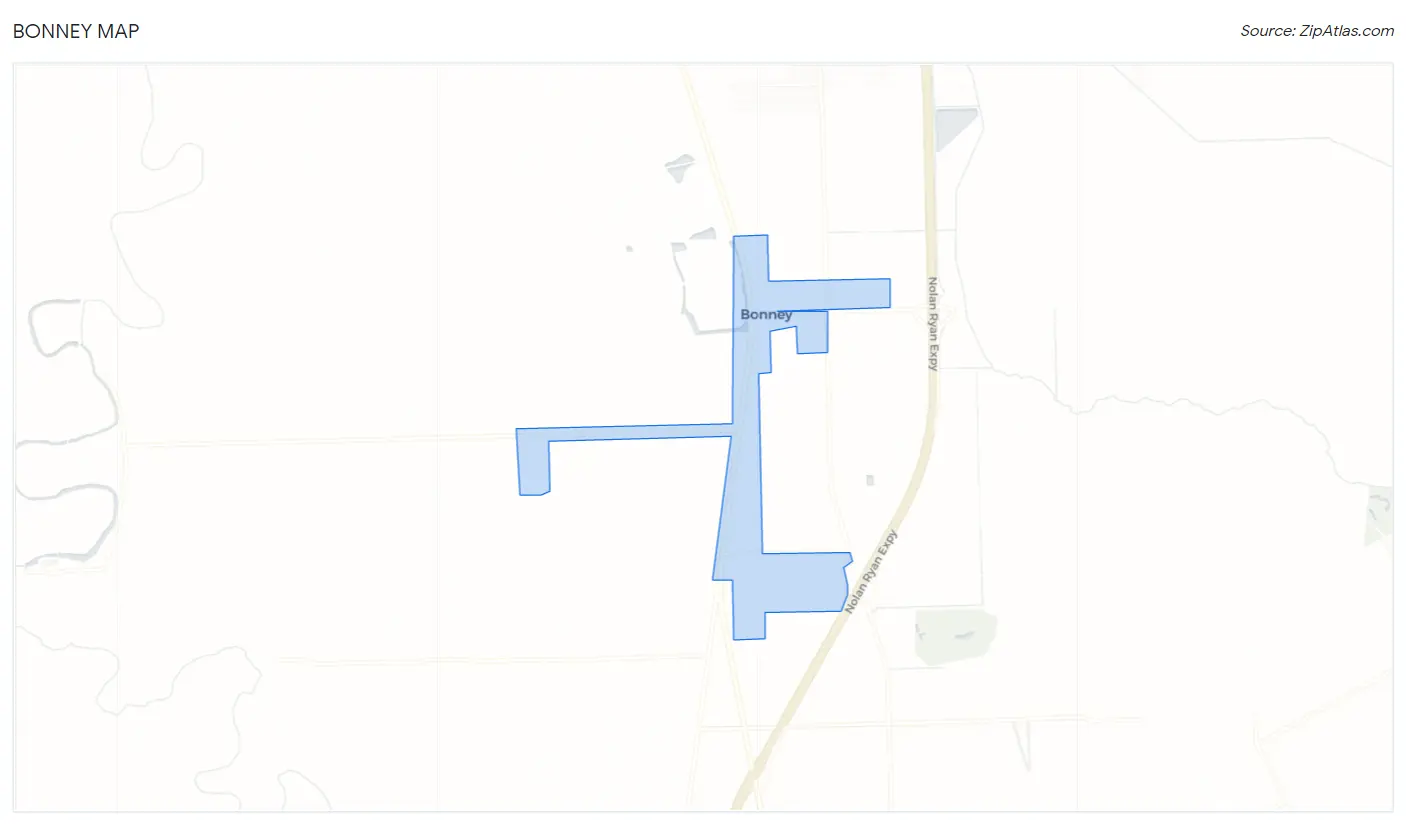
Bonney Map
Bonney Overview
$46,363
PER CAPITA INCOME
$89,167
AVG HOUSEHOLD INCOME
0.34
INEQUALITY / GINI INDEX
197
TOTAL POPULATION
108
MALE POPULATION
89
FEMALE POPULATION
121.35
MALES / 100 FEMALES
82.41
FEMALES / 100 MALES
43.6
MEDIAN AGE
2.8
AVG FAMILY SIZE
2.4
AVG HOUSEHOLD SIZE
134
LABOR FORCE [ PEOPLE ]
79.3%
PERCENT IN LABOR FORCE
18.7%
UNEMPLOYMENT RATE
Income in Bonney
Income Overview in Bonney
| Characteristic | Number | Measure |
| Per Capita Income | 197 | $46,363 |
| Median Family Income | 57 | $0 |
| Mean Family Income | 57 | $135,975 |
| Median Household Income | 84 | $89,167 |
| Mean Household Income | 84 | $110,390 |
| Income Deficit | 57 | $0 |
| Wage / Income Gap (%) | 197 | 0.00% |
| Wage / Income Gap ($) | 197 | 100.00¢ per $1 |
| Gini / Inequality Index | 197 | 0.34 |
Earnings by Sex in Bonney
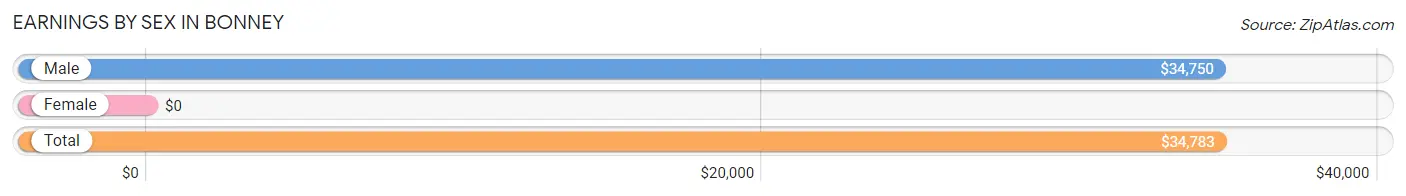
| Sex | Number | Average Earnings |
| Male | 71 (48.6%) | $34,750 |
| Female | 75 (51.4%) | $0 |
| Total | 146 (100.0%) | $34,783 |
Earnings by Sex by Income Bracket in Bonney
The most common earnings brackets in Bonney are $12,500 to $14,999 for men (23 | 32.4%) and $30,000 to $34,999 for women (21 | 28.0%).
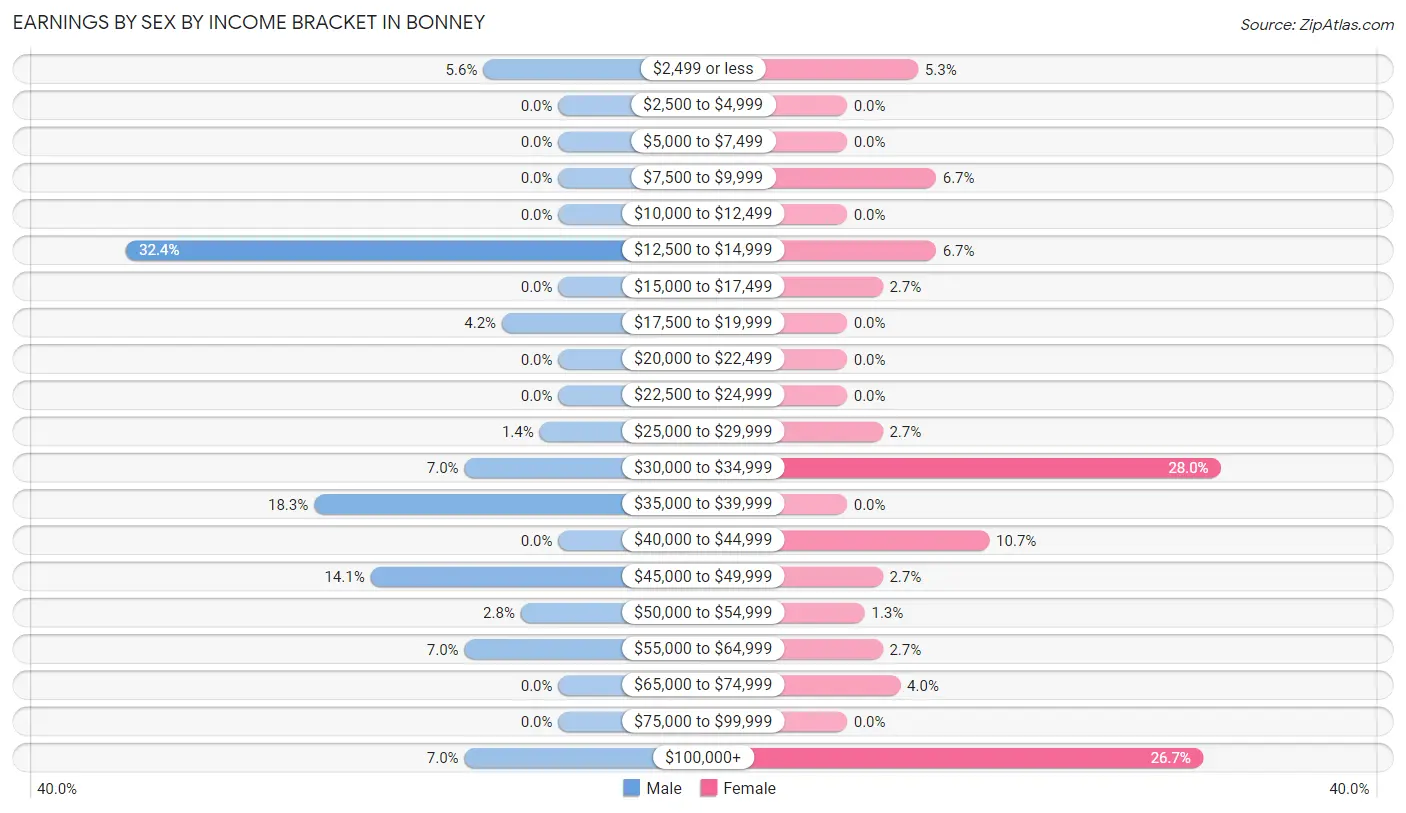
| Income | Male | Female |
| $2,499 or less | 4 (5.6%) | 4 (5.3%) |
| $2,500 to $4,999 | 0 (0.0%) | 0 (0.0%) |
| $5,000 to $7,499 | 0 (0.0%) | 0 (0.0%) |
| $7,500 to $9,999 | 0 (0.0%) | 5 (6.7%) |
| $10,000 to $12,499 | 0 (0.0%) | 0 (0.0%) |
| $12,500 to $14,999 | 23 (32.4%) | 5 (6.7%) |
| $15,000 to $17,499 | 0 (0.0%) | 2 (2.7%) |
| $17,500 to $19,999 | 3 (4.2%) | 0 (0.0%) |
| $20,000 to $22,499 | 0 (0.0%) | 0 (0.0%) |
| $22,500 to $24,999 | 0 (0.0%) | 0 (0.0%) |
| $25,000 to $29,999 | 1 (1.4%) | 2 (2.7%) |
| $30,000 to $34,999 | 5 (7.0%) | 21 (28.0%) |
| $35,000 to $39,999 | 13 (18.3%) | 0 (0.0%) |
| $40,000 to $44,999 | 0 (0.0%) | 8 (10.7%) |
| $45,000 to $49,999 | 10 (14.1%) | 2 (2.7%) |
| $50,000 to $54,999 | 2 (2.8%) | 1 (1.3%) |
| $55,000 to $64,999 | 5 (7.0%) | 2 (2.7%) |
| $65,000 to $74,999 | 0 (0.0%) | 3 (4.0%) |
| $75,000 to $99,999 | 0 (0.0%) | 0 (0.0%) |
| $100,000+ | 5 (7.0%) | 20 (26.7%) |
| Total | 71 (100.0%) | 75 (100.0%) |
Earnings by Sex by Educational Attainment in Bonney
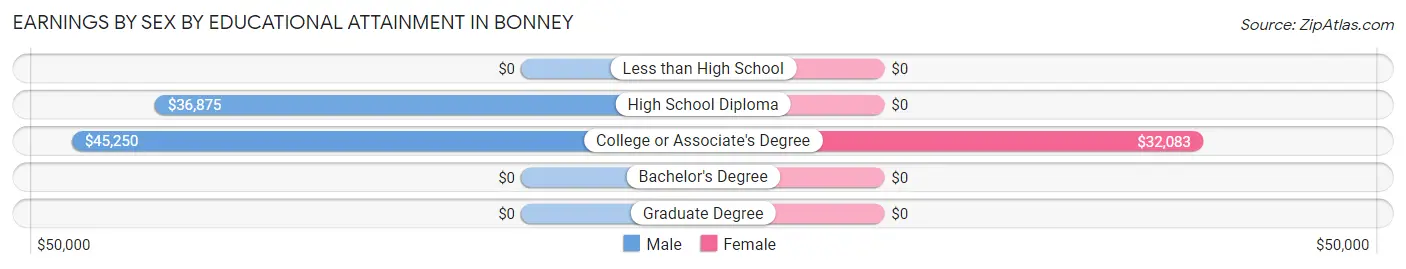
| Educational Attainment | Male Income | Female Income |
| Less than High School | - | - |
| High School Diploma | $36,875 | $0 |
| College or Associate's Degree | $45,250 | $32,083 |
| Bachelor's Degree | - | - |
| Graduate Degree | - | - |
| Total | $36,563 | $0 |
Family Income in Bonney
Family Income Brackets in Bonney
According to the Bonney family income data, there are 21 families falling into the $200,000+ income range, which is the most common income bracket and makes up 36.8% of all families.
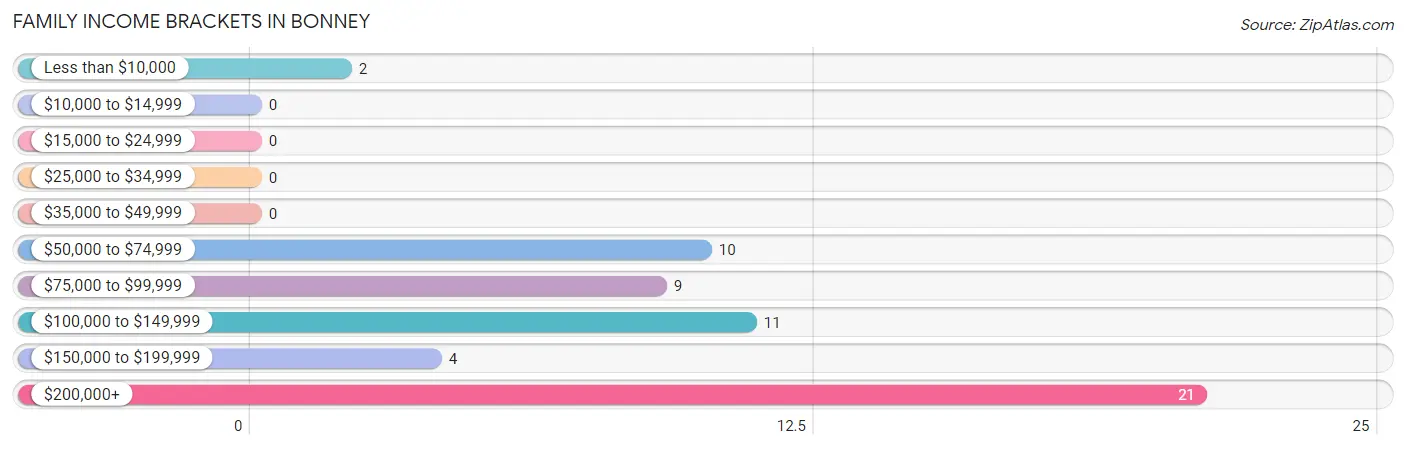
| Income Bracket | # Families | % Families |
| Less than $10,000 | 2 | 3.5% |
| $10,000 to $14,999 | 0 | 0.0% |
| $15,000 to $24,999 | 0 | 0.0% |
| $25,000 to $34,999 | 0 | 0.0% |
| $35,000 to $49,999 | 0 | 0.0% |
| $50,000 to $74,999 | 10 | 17.5% |
| $75,000 to $99,999 | 9 | 15.8% |
| $100,000 to $149,999 | 11 | 19.3% |
| $150,000 to $199,999 | 4 | 7.0% |
| $200,000+ | 21 | 36.8% |
Family Income by Famaliy Size in Bonney
2-person families (33 | 57.9%) account for the highest median family income in Bonney with $203,036 per family, while 2-person families (33 | 57.9%) have the highest median income of $101,518 per family member.
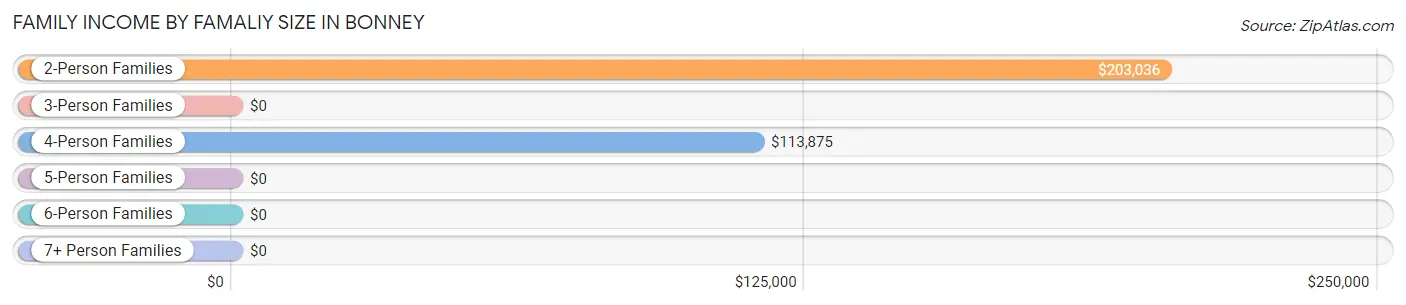
| Income Bracket | # Families | Median Income |
| 2-Person Families | 33 (57.9%) | $203,036 |
| 3-Person Families | 7 (12.3%) | $0 |
| 4-Person Families | 15 (26.3%) | $113,875 |
| 5-Person Families | 2 (3.5%) | $0 |
| 6-Person Families | 0 (0.0%) | $0 |
| 7+ Person Families | 0 (0.0%) | $0 |
| Total | 57 (100.0%) | $0 |
Family Income by Number of Earners in Bonney
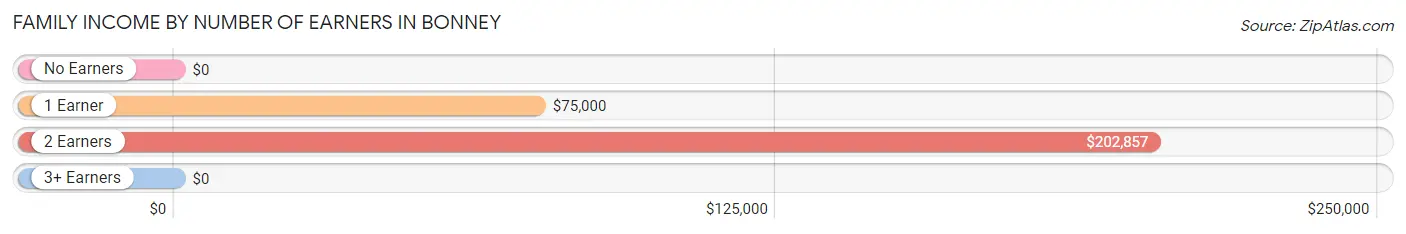
| Number of Earners | # Families | Median Income |
| No Earners | 2 (3.5%) | $0 |
| 1 Earner | 6 (10.5%) | $75,000 |
| 2 Earners | 36 (63.2%) | $202,857 |
| 3+ Earners | 13 (22.8%) | $0 |
| Total | 57 (100.0%) | $0 |
Household Income in Bonney
Household Income Brackets in Bonney
With 21 households falling in the category, the $200,000+ income range is the most frequent in Bonney, accounting for 25.0% of all households.
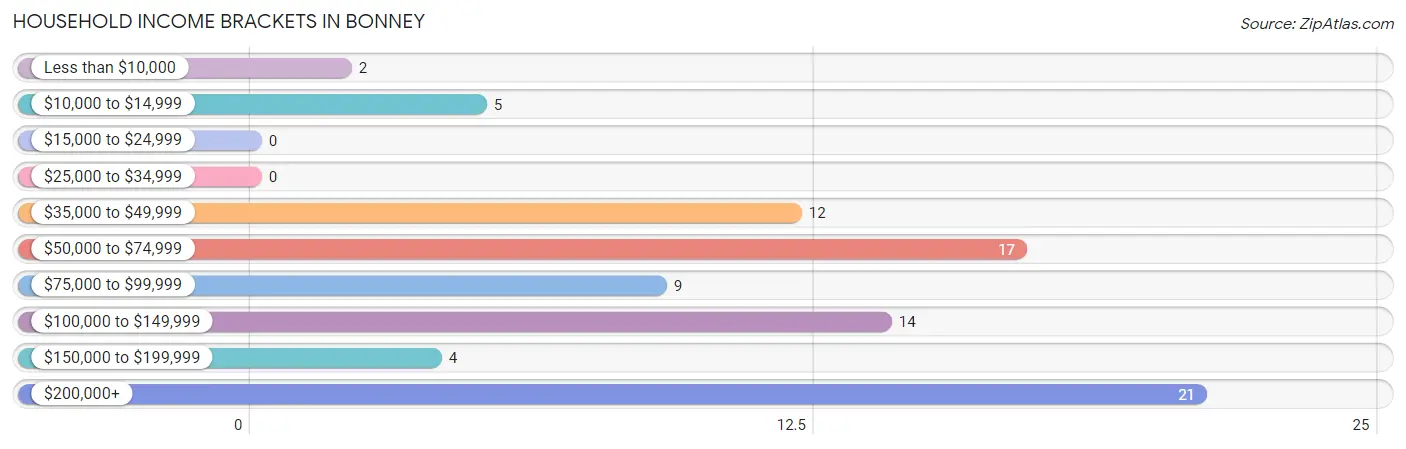
| Income Bracket | # Households | % Households |
| Less than $10,000 | 2 | 2.4% |
| $10,000 to $14,999 | 5 | 6.0% |
| $15,000 to $24,999 | 0 | 0.0% |
| $25,000 to $34,999 | 0 | 0.0% |
| $35,000 to $49,999 | 12 | 14.3% |
| $50,000 to $74,999 | 17 | 20.2% |
| $75,000 to $99,999 | 9 | 10.7% |
| $100,000 to $149,999 | 14 | 16.7% |
| $150,000 to $199,999 | 4 | 4.8% |
| $200,000+ | 21 | 25.0% |
Household Income by Householder Age in Bonney
The median household income in Bonney is $89,167, with the highest median household income of $203,500 found in the 25 to 44 years age bracket for the primary householder. A total of 24 households (28.6%) fall into this category.
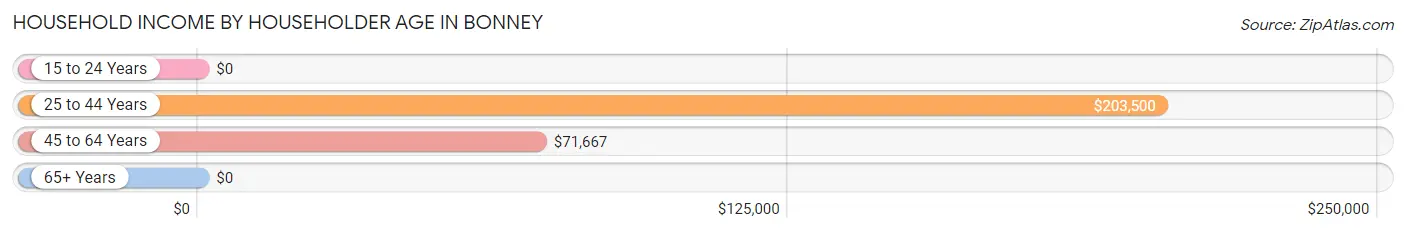
| Income Bracket | # Households | Median Income |
| 15 to 24 Years | 0 (0.0%) | $0 |
| 25 to 44 Years | 24 (28.6%) | $203,500 |
| 45 to 64 Years | 52 (61.9%) | $71,667 |
| 65+ Years | 8 (9.5%) | $0 |
| Total | 84 (100.0%) | $89,167 |
Poverty in Bonney
Income Below Poverty by Sex and Age in Bonney
With 13.9% poverty level for males and 7.9% for females among the residents of Bonney, 15 year old males and 55 to 64 year old females are the most vulnerable to poverty, with 2 males (100.0%) and 5 females (26.3%) in their respective age groups living below the poverty level.
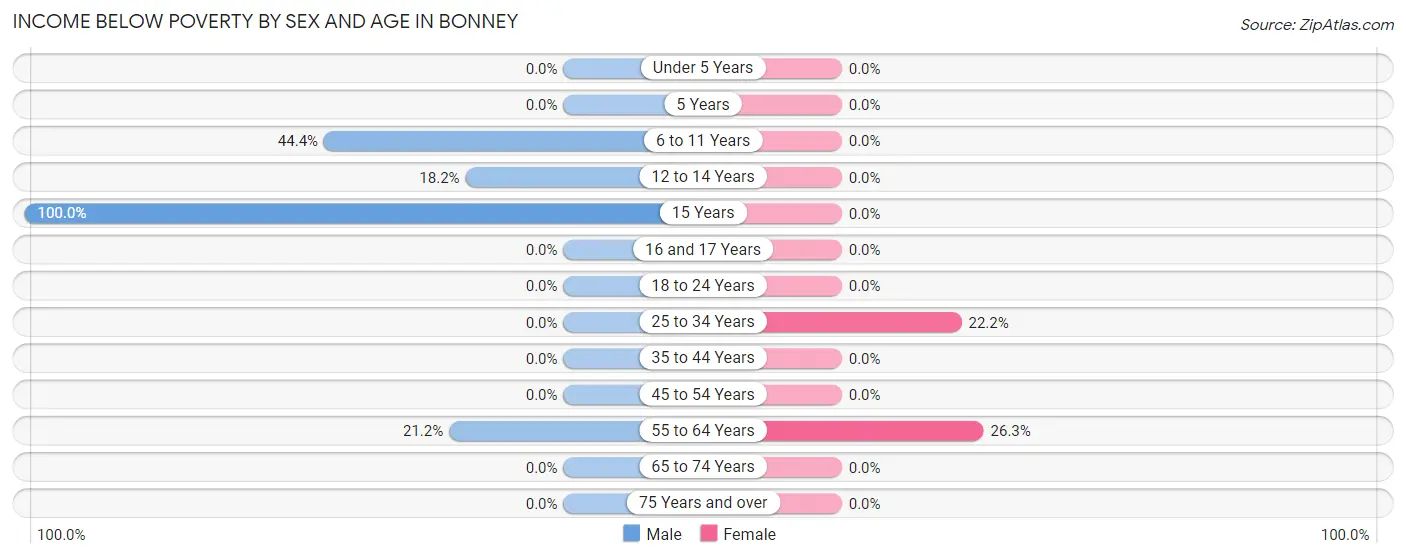
| Age Bracket | Male | Female |
| Under 5 Years | 0 (0.0%) | 0 (0.0%) |
| 5 Years | 0 (0.0%) | 0 (0.0%) |
| 6 to 11 Years | 4 (44.4%) | 0 (0.0%) |
| 12 to 14 Years | 2 (18.2%) | 0 (0.0%) |
| 15 Years | 2 (100.0%) | 0 (0.0%) |
| 16 and 17 Years | 0 (0.0%) | 0 (0.0%) |
| 18 to 24 Years | 0 (0.0%) | 0 (0.0%) |
| 25 to 34 Years | 0 (0.0%) | 2 (22.2%) |
| 35 to 44 Years | 0 (0.0%) | 0 (0.0%) |
| 45 to 54 Years | 0 (0.0%) | 0 (0.0%) |
| 55 to 64 Years | 7 (21.2%) | 5 (26.3%) |
| 65 to 74 Years | 0 (0.0%) | 0 (0.0%) |
| 75 Years and over | 0 (0.0%) | 0 (0.0%) |
| Total | 15 (13.9%) | 7 (7.9%) |
Income Above Poverty by Sex and Age in Bonney
According to the poverty statistics in Bonney, males aged 18 to 24 years and females aged under 5 years are the age groups that are most secure financially, with 100.0% of males and 100.0% of females in these age groups living above the poverty line.
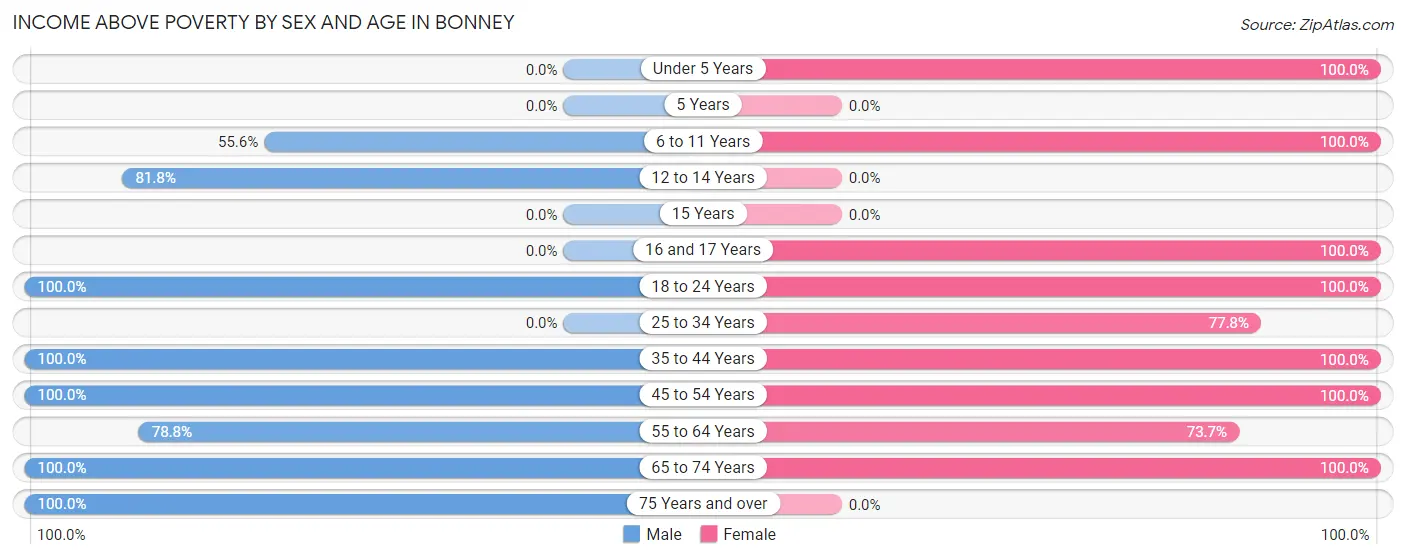
| Age Bracket | Male | Female |
| Under 5 Years | 0 (0.0%) | 3 (100.0%) |
| 5 Years | 0 (0.0%) | 0 (0.0%) |
| 6 to 11 Years | 5 (55.6%) | 3 (100.0%) |
| 12 to 14 Years | 9 (81.8%) | 0 (0.0%) |
| 15 Years | 0 (0.0%) | 0 (0.0%) |
| 16 and 17 Years | 0 (0.0%) | 4 (100.0%) |
| 18 to 24 Years | 6 (100.0%) | 10 (100.0%) |
| 25 to 34 Years | 0 (0.0%) | 7 (77.8%) |
| 35 to 44 Years | 25 (100.0%) | 28 (100.0%) |
| 45 to 54 Years | 11 (100.0%) | 9 (100.0%) |
| 55 to 64 Years | 26 (78.8%) | 14 (73.7%) |
| 65 to 74 Years | 5 (100.0%) | 4 (100.0%) |
| 75 Years and over | 6 (100.0%) | 0 (0.0%) |
| Total | 93 (86.1%) | 82 (92.1%) |
Income Below Poverty Among Married-Couple Families in Bonney
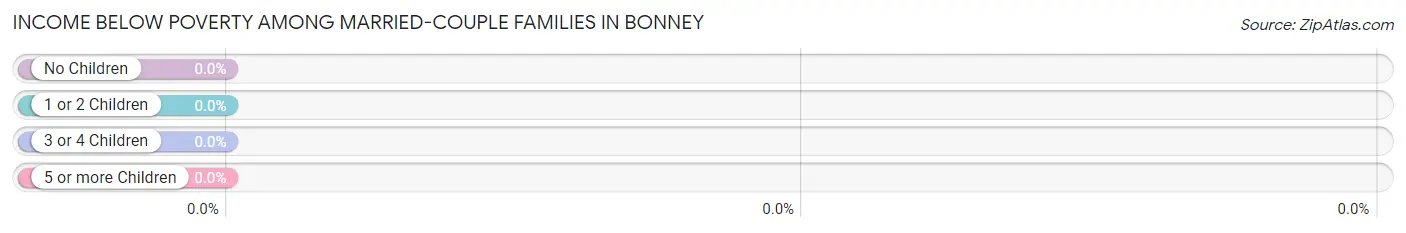
| Children | Above Poverty | Below Poverty |
| No Children | 33 (100.0%) | 0 (0.0%) |
| 1 or 2 Children | 19 (100.0%) | 0 (0.0%) |
| 3 or 4 Children | 0 (0.0%) | 0 (0.0%) |
| 5 or more Children | 0 (0.0%) | 0 (0.0%) |
| Total | 52 (100.0%) | 0 (0.0%) |
Income Below Poverty Among Single-Parent Households in Bonney
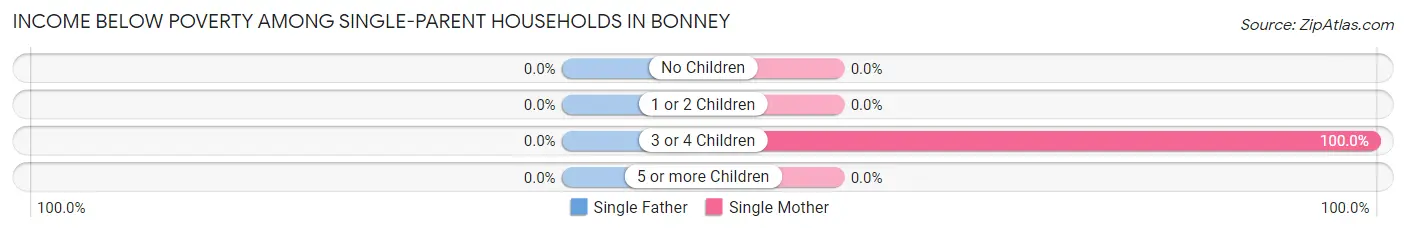
| Children | Single Father | Single Mother |
| No Children | 0 (0.0%) | 0 (0.0%) |
| 1 or 2 Children | 0 (0.0%) | 0 (0.0%) |
| 3 or 4 Children | 0 (0.0%) | 2 (100.0%) |
| 5 or more Children | 0 (0.0%) | 0 (0.0%) |
| Total | 0 (0.0%) | 2 (100.0%) |
Income Below Poverty Among Married-Couple vs Single-Parent Households in Bonney
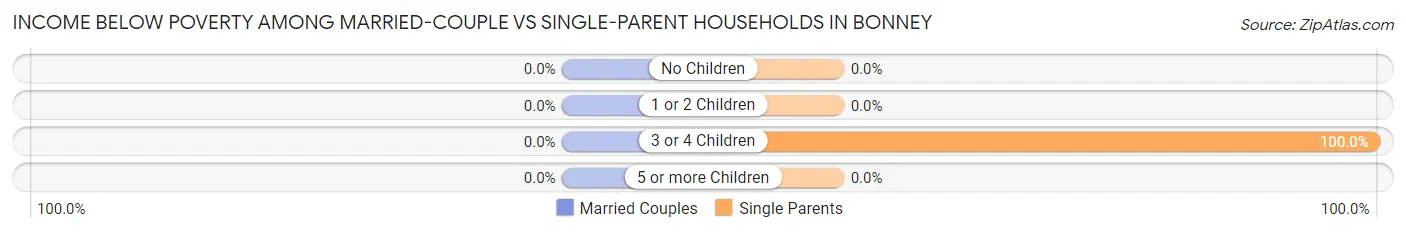
| Children | Married-Couple Families | Single-Parent Households |
| No Children | 0 (0.0%) | 0 (0.0%) |
| 1 or 2 Children | 0 (0.0%) | 0 (0.0%) |
| 3 or 4 Children | 0 (0.0%) | 2 (100.0%) |
| 5 or more Children | 0 (0.0%) | 0 (0.0%) |
| Total | 0 (0.0%) | 2 (40.0%) |
Race in Bonney
The most populous races in Bonney are Hispanic or Latino (133 | 67.5%), White / Caucasian (123 | 62.4%), and Two or more Races (46 | 23.4%).
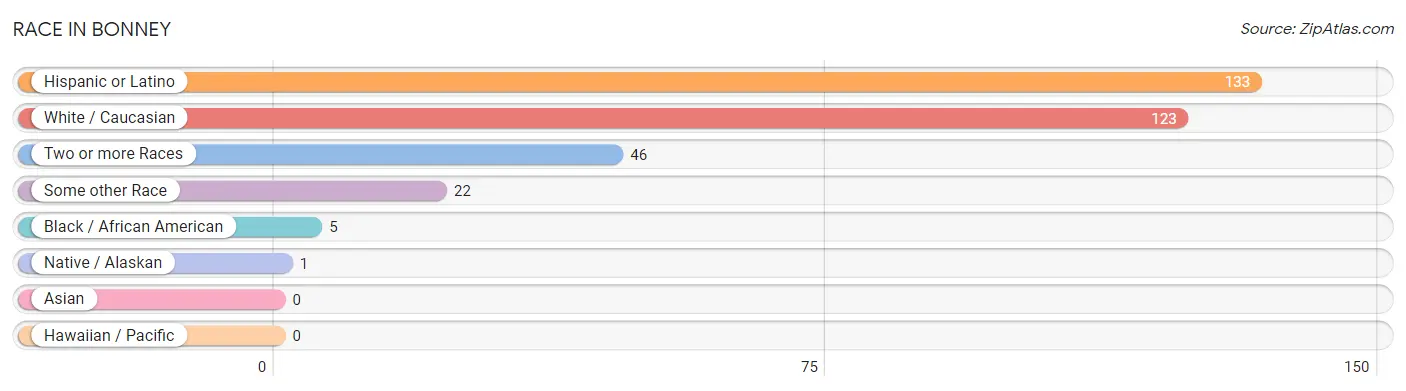
| Race | # Population | % Population |
| Asian | 0 | 0.0% |
| Black / African American | 5 | 2.5% |
| Hawaiian / Pacific | 0 | 0.0% |
| Hispanic or Latino | 133 | 67.5% |
| Native / Alaskan | 1 | 0.5% |
| White / Caucasian | 123 | 62.4% |
| Two or more Races | 46 | 23.4% |
| Some other Race | 22 | 11.2% |
| Total | 197 | 100.0% |
Ancestry in Bonney
The most populous ancestries reported in Bonney are Mexican (112 | 56.9%), American (15 | 7.6%), English (14 | 7.1%), Colombian (10 | 5.1%), and South American (10 | 5.1%), together accounting for 81.7% of all Bonney residents.
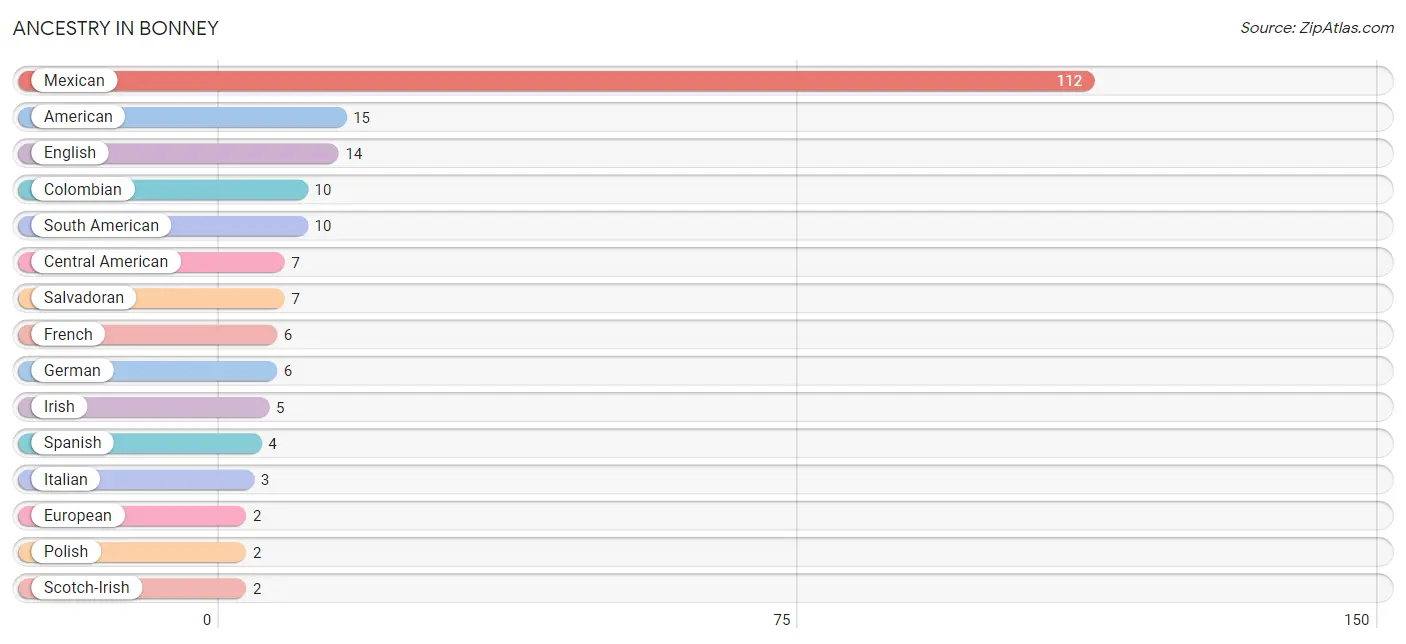
| Ancestry | # Population | % Population |
| American | 15 | 7.6% |
| Central American | 7 | 3.5% |
| Cherokee | 1 | 0.5% |
| Colombian | 10 | 5.1% |
| Dutch | 1 | 0.5% |
| English | 14 | 7.1% |
| European | 2 | 1.0% |
| French | 6 | 3.0% |
| German | 6 | 3.0% |
| Irish | 5 | 2.5% |
| Italian | 3 | 1.5% |
| Mexican | 112 | 56.9% |
| Polish | 2 | 1.0% |
| Salvadoran | 7 | 3.5% |
| Scotch-Irish | 2 | 1.0% |
| South American | 10 | 5.1% |
| Spanish | 4 | 2.0% | View All 17 Rows |
Immigrants in Bonney
The most numerous immigrant groups reported in Bonney came from Latin America (12 | 6.1%), Central America (7 | 3.5%), El Salvador (7 | 3.5%), Colombia (5 | 2.5%), and South America (5 | 2.5%), together accounting for 18.3% of all Bonney residents.
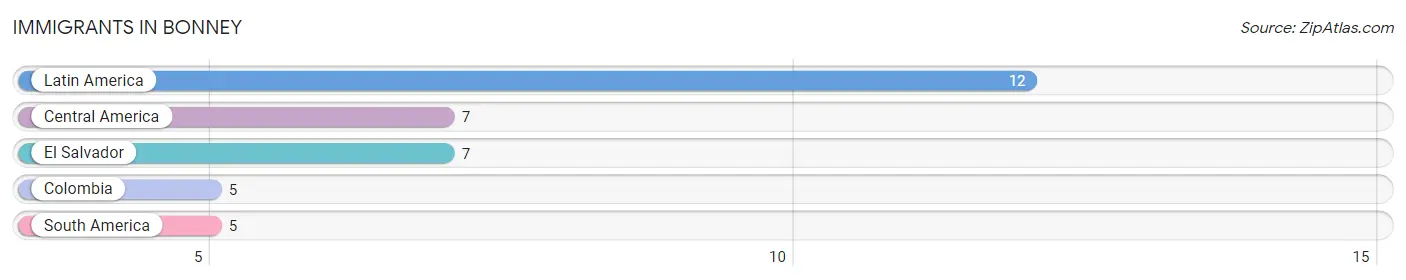
| Immigration Origin | # Population | % Population |
| Central America | 7 | 3.5% |
| Colombia | 5 | 2.5% |
| El Salvador | 7 | 3.5% |
| Latin America | 12 | 6.1% |
| South America | 5 | 2.5% | View All 5 Rows |
Sex and Age in Bonney
Sex and Age in Bonney
The most populous age groups in Bonney are 40 to 44 Years (25 | 23.2%) for men and 40 to 44 Years (22 | 24.7%) for women.
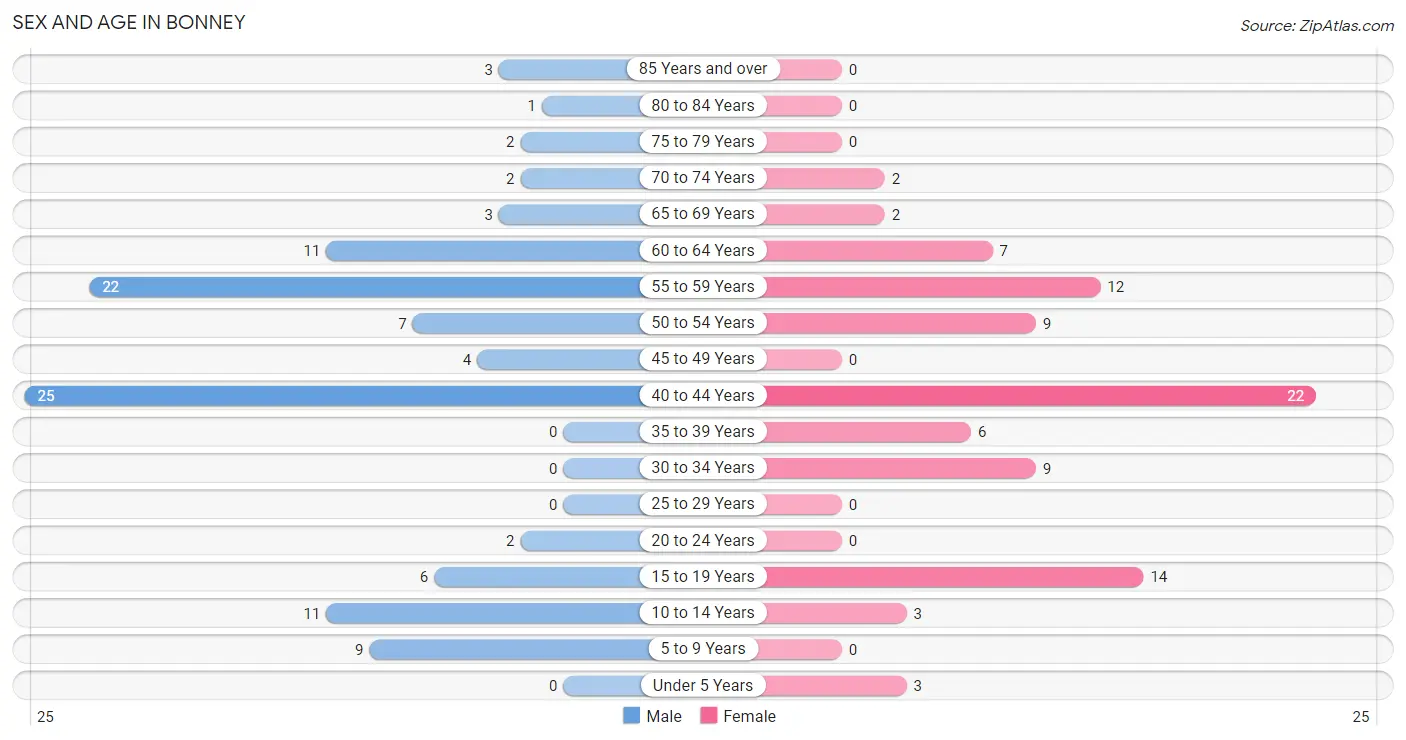
| Age Bracket | Male | Female |
| Under 5 Years | 0 (0.0%) | 3 (3.4%) |
| 5 to 9 Years | 9 (8.3%) | 0 (0.0%) |
| 10 to 14 Years | 11 (10.2%) | 3 (3.4%) |
| 15 to 19 Years | 6 (5.6%) | 14 (15.7%) |
| 20 to 24 Years | 2 (1.8%) | 0 (0.0%) |
| 25 to 29 Years | 0 (0.0%) | 0 (0.0%) |
| 30 to 34 Years | 0 (0.0%) | 9 (10.1%) |
| 35 to 39 Years | 0 (0.0%) | 6 (6.7%) |
| 40 to 44 Years | 25 (23.2%) | 22 (24.7%) |
| 45 to 49 Years | 4 (3.7%) | 0 (0.0%) |
| 50 to 54 Years | 7 (6.5%) | 9 (10.1%) |
| 55 to 59 Years | 22 (20.4%) | 12 (13.5%) |
| 60 to 64 Years | 11 (10.2%) | 7 (7.9%) |
| 65 to 69 Years | 3 (2.8%) | 2 (2.2%) |
| 70 to 74 Years | 2 (1.8%) | 2 (2.2%) |
| 75 to 79 Years | 2 (1.8%) | 0 (0.0%) |
| 80 to 84 Years | 1 (0.9%) | 0 (0.0%) |
| 85 Years and over | 3 (2.8%) | 0 (0.0%) |
| Total | 108 (100.0%) | 89 (100.0%) |
Families and Households in Bonney
Median Family Size in Bonney
The median family size in Bonney is 2.79 persons per family, with single female/mother families (2 | 3.5%) accounting for the largest median family size of 5 persons per family. On the other hand, single male/father families (3 | 5.3%) represent the smallest median family size with 2.33 persons per family.
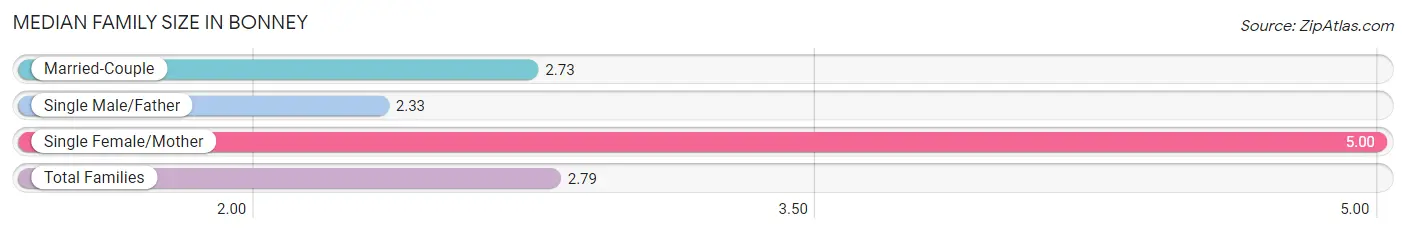
| Family Type | # Families | Family Size |
| Married-Couple | 52 (91.2%) | 2.73 |
| Single Male/Father | 3 (5.3%) | 2.33 |
| Single Female/Mother | 2 (3.5%) | 5.00 |
| Total Families | 57 (100.0%) | 2.79 |
Median Household Size in Bonney
The median household size in Bonney is 2.35 persons per household, with single female/mother households (2 | 2.4%) accounting for the largest median household size of 5 persons per household. non-family households (27 | 32.1%) represent the smallest median household size with 1.15 persons per household.
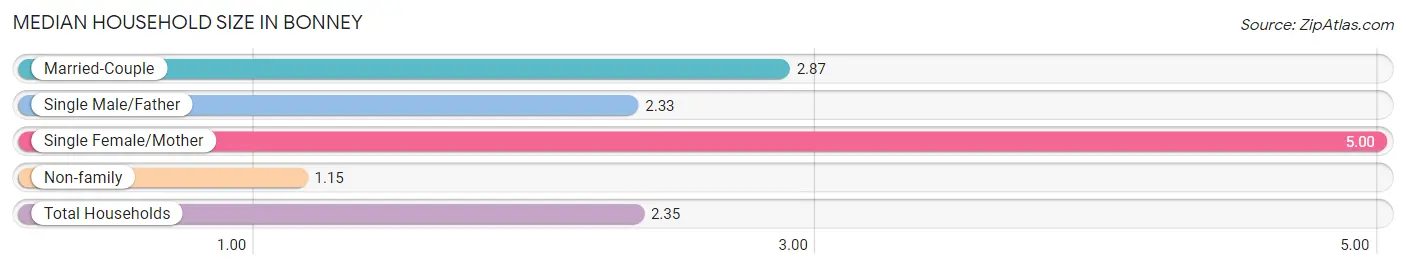
| Household Type | # Households | Household Size |
| Married-Couple | 52 (61.9%) | 2.87 |
| Single Male/Father | 3 (3.6%) | 2.33 |
| Single Female/Mother | 2 (2.4%) | 5.00 |
| Non-family | 27 (32.1%) | 1.15 |
| Total Households | 84 (100.0%) | 2.35 |
Household Size by Marriage Status in Bonney
Out of a total of 84 households in Bonney, 57 (67.9%) are family households, while 27 (32.1%) are nonfamily households. The most numerous type of family households are 2-person households, comprising 33, and the most common type of nonfamily households are 1-person households, comprising 23.
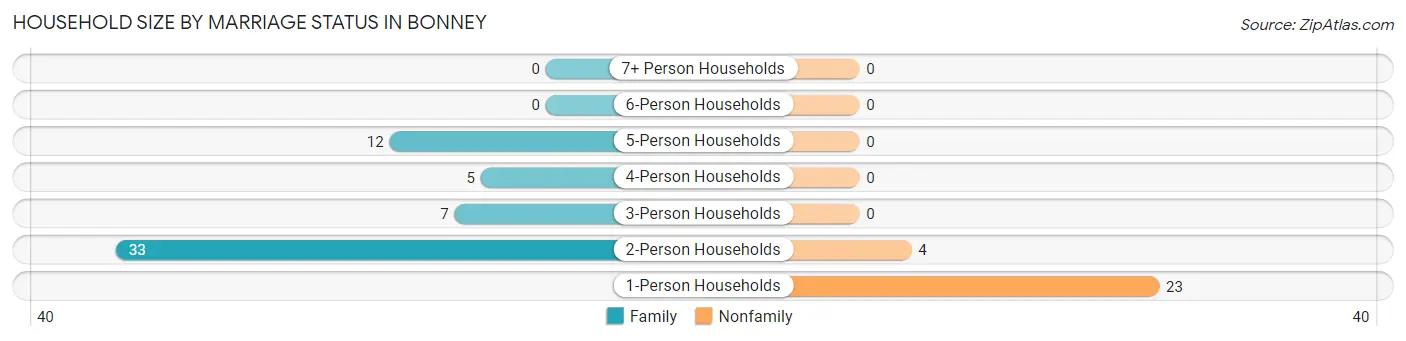
| Household Size | Family Households | Nonfamily Households |
| 1-Person Households | - | 23 (27.4%) |
| 2-Person Households | 33 (39.3%) | 4 (4.8%) |
| 3-Person Households | 7 (8.3%) | 0 (0.0%) |
| 4-Person Households | 5 (5.9%) | 0 (0.0%) |
| 5-Person Households | 12 (14.3%) | 0 (0.0%) |
| 6-Person Households | 0 (0.0%) | 0 (0.0%) |
| 7+ Person Households | 0 (0.0%) | 0 (0.0%) |
| Total | 57 (67.9%) | 27 (32.1%) |
Female Fertility in Bonney
Fertility by Age in Bonney
| Age Bracket | Women with Births | Births / 1,000 Women |
| 15 to 19 years | 0 (0.0%) | 0.0 |
| 20 to 34 years | 0 (0.0%) | 0.0 |
| 35 to 50 years | 0 (0.0%) | 0.0 |
| Total | 0 (0.0%) | 0.0 |
Fertility by Age by Marriage Status in Bonney
| Age Bracket | Married | Unmarried |
| 15 to 19 years | 0 (0.0%) | 0 (0.0%) |
| 20 to 34 years | 0 (0.0%) | 0 (0.0%) |
| 35 to 50 years | 0 (0.0%) | 0 (0.0%) |
| Total | 0 (0.0%) | 0 (0.0%) |
Fertility by Education in Bonney
| Educational Attainment | Women with Births | Births / 1,000 Women |
| Less than High School | 0 (0.0%) | 0.0 |
| High School Diploma | 0 (0.0%) | 0.0 |
| College or Associate's Degree | 0 (0.0%) | 0.0 |
| Bachelor's Degree | 0 (0.0%) | 0.0 |
| Graduate Degree | 0 (0.0%) | 0.0 |
| Total | 0 (0.0%) | 0.0 |
Fertility by Education by Marriage Status in Bonney
| Educational Attainment | Married | Unmarried |
| Less than High School | 0 (0.0%) | 0 (0.0%) |
| High School Diploma | 0 (0.0%) | 0 (0.0%) |
| College or Associate's Degree | 0 (0.0%) | 0 (0.0%) |
| Bachelor's Degree | 0 (0.0%) | 0 (0.0%) |
| Graduate Degree | 0 (0.0%) | 0 (0.0%) |
| Total | 0 (0.0%) | 0 (0.0%) |
Employment Characteristics in Bonney
Employment by Class of Employer in Bonney
Among the 107 employed individuals in Bonney, private company employees (60 | 56.1%), state government employees (32 | 29.9%), and local government employees (10 | 9.3%) make up the most common classes of employment.
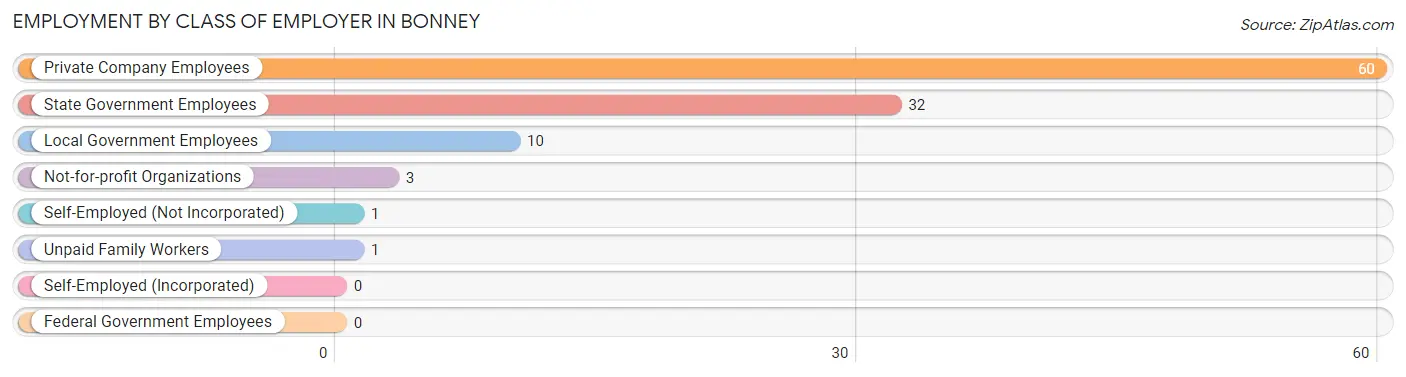
| Employer Class | # Employees | % Employees |
| Private Company Employees | 60 | 56.1% |
| Self-Employed (Incorporated) | 0 | 0.0% |
| Self-Employed (Not Incorporated) | 1 | 0.9% |
| Not-for-profit Organizations | 3 | 2.8% |
| Local Government Employees | 10 | 9.3% |
| State Government Employees | 32 | 29.9% |
| Federal Government Employees | 0 | 0.0% |
| Unpaid Family Workers | 1 | 0.9% |
| Total | 107 | 100.0% |
Employment Status by Age in Bonney
According to the labor force statistics for Bonney, out of the total population over 16 years of age (169), 79.3% or 134 individuals are in the labor force, with 18.7% or 25 of them unemployed. The age group with the highest labor force participation rate is 20 to 24 years, with 100.0% or 2 individuals in the labor force. Within the labor force, the 30 to 34 years age range has the highest percentage of unemployed individuals, with 71.4% or 5 of them being unemployed.
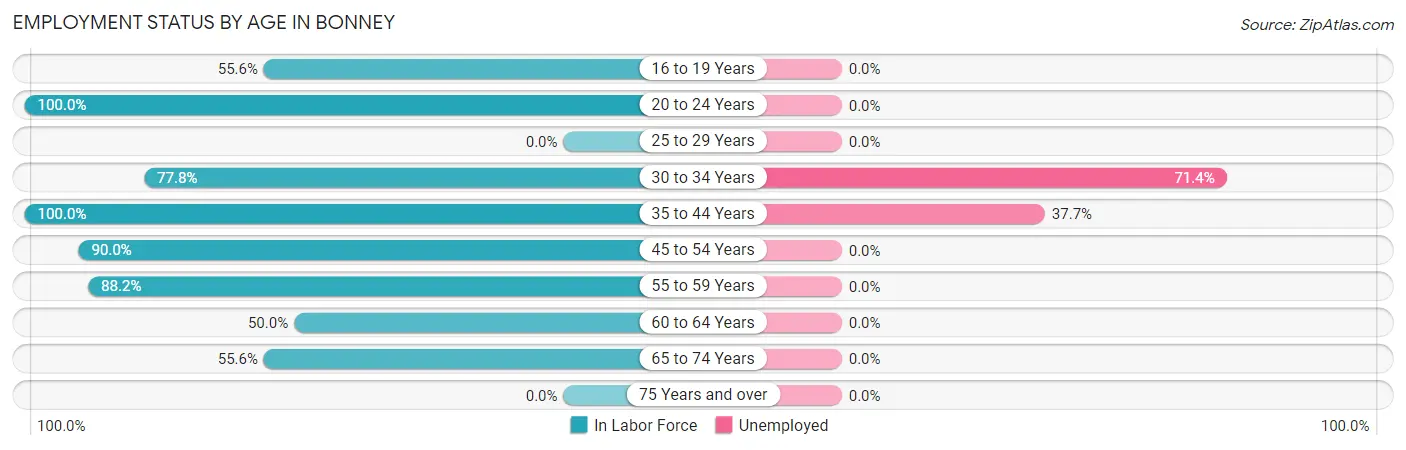
| Age Bracket | In Labor Force | Unemployed |
| 16 to 19 Years | 10 (55.6%) | 0 (0.0%) |
| 20 to 24 Years | 2 (100.0%) | 0 (0.0%) |
| 25 to 29 Years | 0 (0.0%) | 0 (0.0%) |
| 30 to 34 Years | 7 (77.8%) | 5 (71.4%) |
| 35 to 44 Years | 53 (100.0%) | 20 (37.7%) |
| 45 to 54 Years | 18 (90.0%) | 0 (0.0%) |
| 55 to 59 Years | 30 (88.2%) | 0 (0.0%) |
| 60 to 64 Years | 9 (50.0%) | 0 (0.0%) |
| 65 to 74 Years | 5 (55.6%) | 0 (0.0%) |
| 75 Years and over | 0 (0.0%) | 0 (0.0%) |
| Total | 134 (79.3%) | 25 (18.7%) |
Employment Status by Educational Attainment in Bonney
According to labor force statistics for Bonney, 87.3% of individuals (117) out of the total population between 25 and 64 years of age (134) are in the labor force, with 21.4% or 25 of them being unemployed. The group with the highest labor force participation rate are those with the educational attainment of bachelor's degree or higher, with 100.0% or 6 individuals in the labor force. Within the labor force, individuals with high school diploma education have the highest percentage of unemployment, with 54.1% or 20 of them being unemployed.
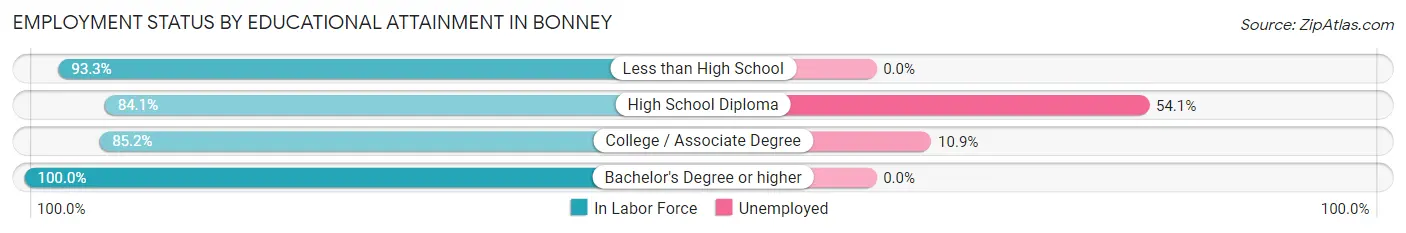
| Educational Attainment | In Labor Force | Unemployed |
| Less than High School | 28 (93.3%) | 0 (0.0%) |
| High School Diploma | 37 (84.1%) | 24 (54.1%) |
| College / Associate Degree | 46 (85.2%) | 6 (10.9%) |
| Bachelor's Degree or higher | 6 (100.0%) | 0 (0.0%) |
| Total | 117 (87.3%) | 29 (21.4%) |
Employment Occupations by Sex in Bonney
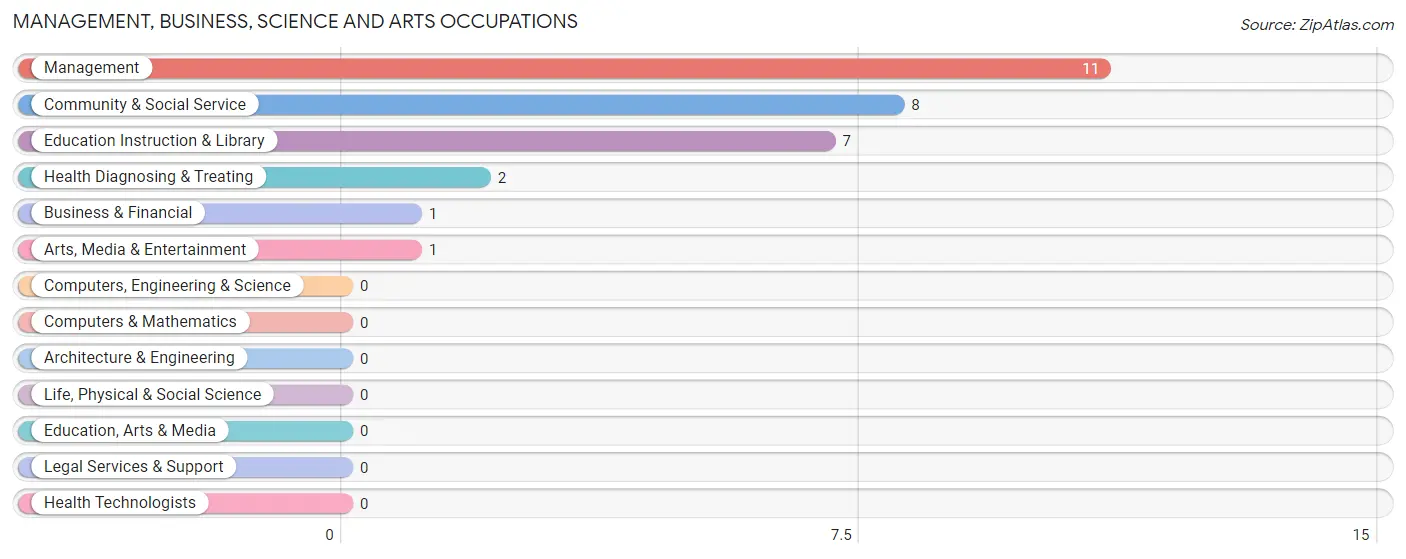
Management, Business, Science and Arts Occupations
The most common Management, Business, Science and Arts occupations in Bonney are Management (11 | 10.1%), Community & Social Service (8 | 7.3%), Education Instruction & Library (7 | 6.4%), Health Diagnosing & Treating (2 | 1.8%), and Business & Financial (1 | 0.9%).
Management, Business, Science and Arts Occupations by Sex
Within the Management, Business, Science and Arts occupations in Bonney, the most male-oriented occupations are Business & Financial (100.0%), Arts, Media & Entertainment (100.0%), and Management (54.5%), while the most female-oriented occupations are Education Instruction & Library (100.0%), Health Diagnosing & Treating (100.0%), and Community & Social Service (87.5%).
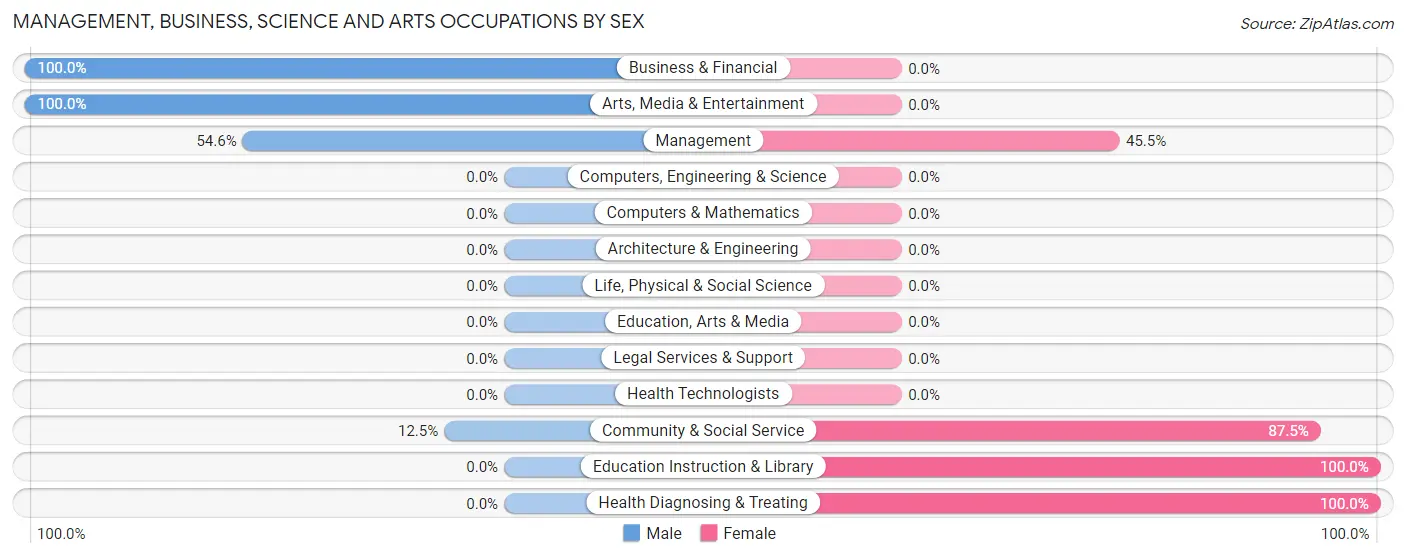
| Occupation | Male | Female |
| Management | 6 (54.5%) | 5 (45.5%) |
| Business & Financial | 1 (100.0%) | 0 (0.0%) |
| Computers, Engineering & Science | 0 (0.0%) | 0 (0.0%) |
| Computers & Mathematics | 0 (0.0%) | 0 (0.0%) |
| Architecture & Engineering | 0 (0.0%) | 0 (0.0%) |
| Life, Physical & Social Science | 0 (0.0%) | 0 (0.0%) |
| Community & Social Service | 1 (12.5%) | 7 (87.5%) |
| Education, Arts & Media | 0 (0.0%) | 0 (0.0%) |
| Legal Services & Support | 0 (0.0%) | 0 (0.0%) |
| Education Instruction & Library | 0 (0.0%) | 7 (100.0%) |
| Arts, Media & Entertainment | 1 (100.0%) | 0 (0.0%) |
| Health Diagnosing & Treating | 0 (0.0%) | 2 (100.0%) |
| Health Technologists | 0 (0.0%) | 0 (0.0%) |
| Total (Category) | 8 (36.4%) | 14 (63.6%) |
| Total (Overall) | 64 (58.7%) | 45 (41.3%) |
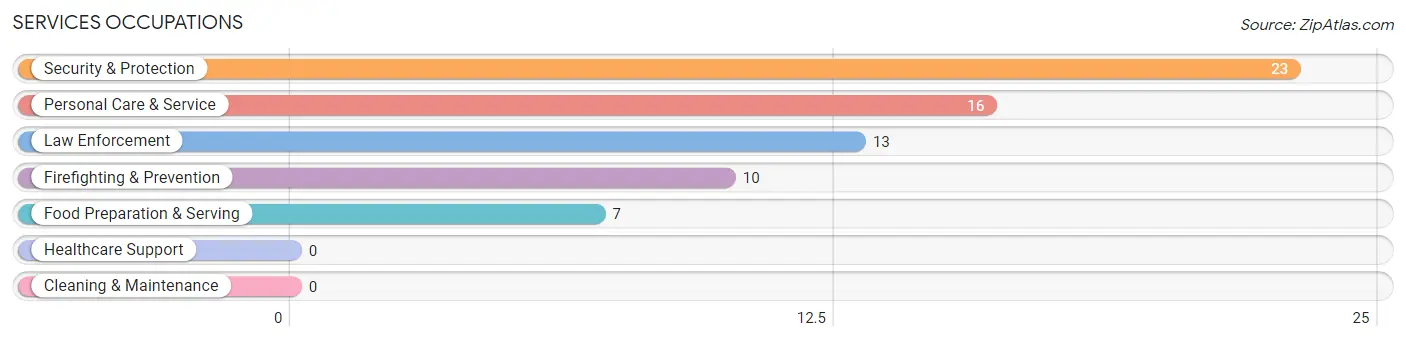
Services Occupations
The most common Services occupations in Bonney are Security & Protection (23 | 21.1%), Personal Care & Service (16 | 14.7%), Law Enforcement (13 | 11.9%), Firefighting & Prevention (10 | 9.2%), and Food Preparation & Serving (7 | 6.4%).
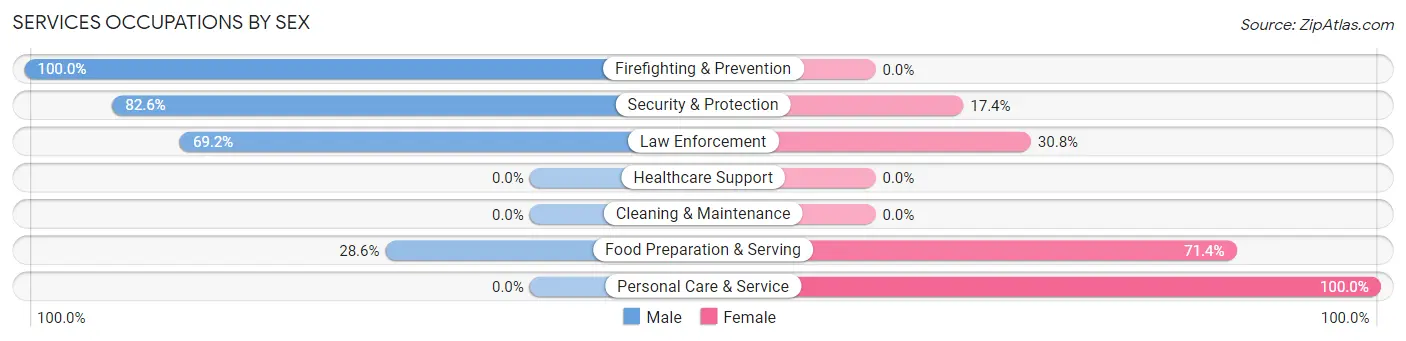
Services Occupations by Sex
Within the Services occupations in Bonney, the most male-oriented occupations are Firefighting & Prevention (100.0%), Security & Protection (82.6%), and Law Enforcement (69.2%), while the most female-oriented occupations are Personal Care & Service (100.0%), Food Preparation & Serving (71.4%), and Law Enforcement (30.8%).
| Occupation | Male | Female |
| Healthcare Support | 0 (0.0%) | 0 (0.0%) |
| Security & Protection | 19 (82.6%) | 4 (17.4%) |
| Firefighting & Prevention | 10 (100.0%) | 0 (0.0%) |
| Law Enforcement | 9 (69.2%) | 4 (30.8%) |
| Food Preparation & Serving | 2 (28.6%) | 5 (71.4%) |
| Cleaning & Maintenance | 0 (0.0%) | 0 (0.0%) |
| Personal Care & Service | 0 (0.0%) | 16 (100.0%) |
| Total (Category) | 21 (45.7%) | 25 (54.3%) |
| Total (Overall) | 64 (58.7%) | 45 (41.3%) |
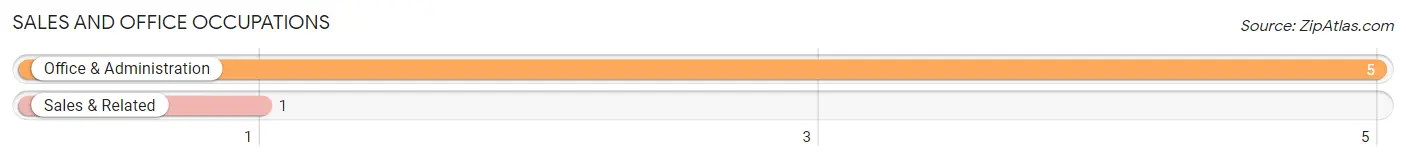
Sales and Office Occupations
The most common Sales and Office occupations in Bonney are Office & Administration (5 | 4.6%), and Sales & Related (1 | 0.9%).
Sales and Office Occupations by Sex
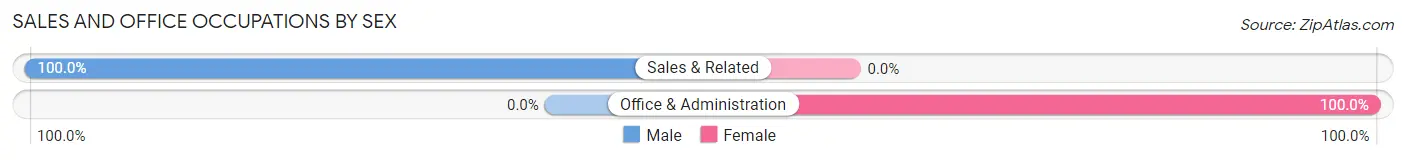
| Occupation | Male | Female |
| Sales & Related | 1 (100.0%) | 0 (0.0%) |
| Office & Administration | 0 (0.0%) | 5 (100.0%) |
| Total (Category) | 1 (16.7%) | 5 (83.3%) |
| Total (Overall) | 64 (58.7%) | 45 (41.3%) |
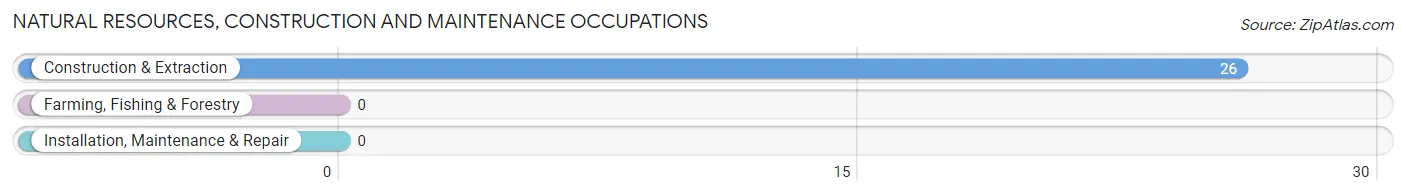
Natural Resources, Construction and Maintenance Occupations
The most common Natural Resources, Construction and Maintenance occupations in Bonney are , and Construction & Extraction (26 | 23.8%).
Natural Resources, Construction and Maintenance Occupations by Sex
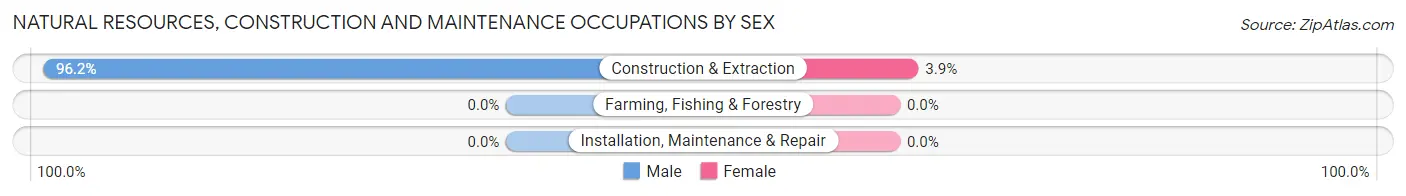
| Occupation | Male | Female |
| Farming, Fishing & Forestry | 0 (0.0%) | 0 (0.0%) |
| Construction & Extraction | 25 (96.2%) | 1 (3.8%) |
| Installation, Maintenance & Repair | 0 (0.0%) | 0 (0.0%) |
| Total (Category) | 25 (96.2%) | 1 (3.8%) |
| Total (Overall) | 64 (58.7%) | 45 (41.3%) |
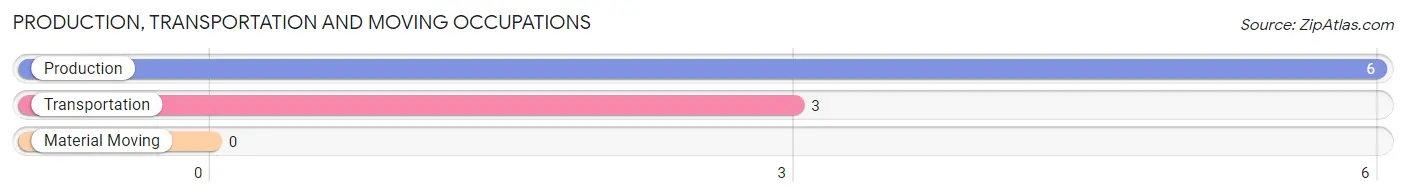
Production, Transportation and Moving Occupations
The most common Production, Transportation and Moving occupations in Bonney are Production (6 | 5.5%), and Transportation (3 | 2.8%).
Production, Transportation and Moving Occupations by Sex
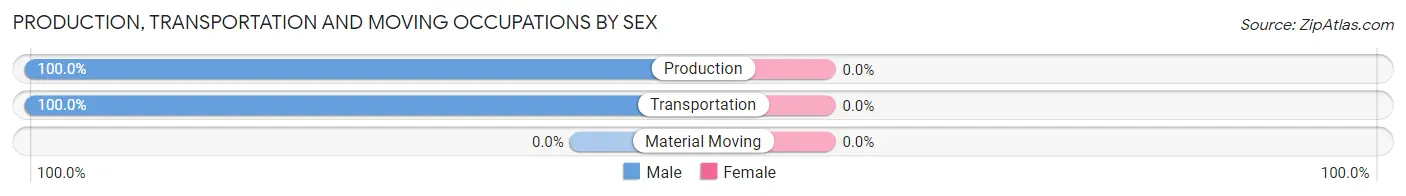
| Occupation | Male | Female |
| Production | 6 (100.0%) | 0 (0.0%) |
| Transportation | 3 (100.0%) | 0 (0.0%) |
| Material Moving | 0 (0.0%) | 0 (0.0%) |
| Total (Category) | 9 (100.0%) | 0 (0.0%) |
| Total (Overall) | 64 (58.7%) | 45 (41.3%) |
Employment Industries by Sex in Bonney
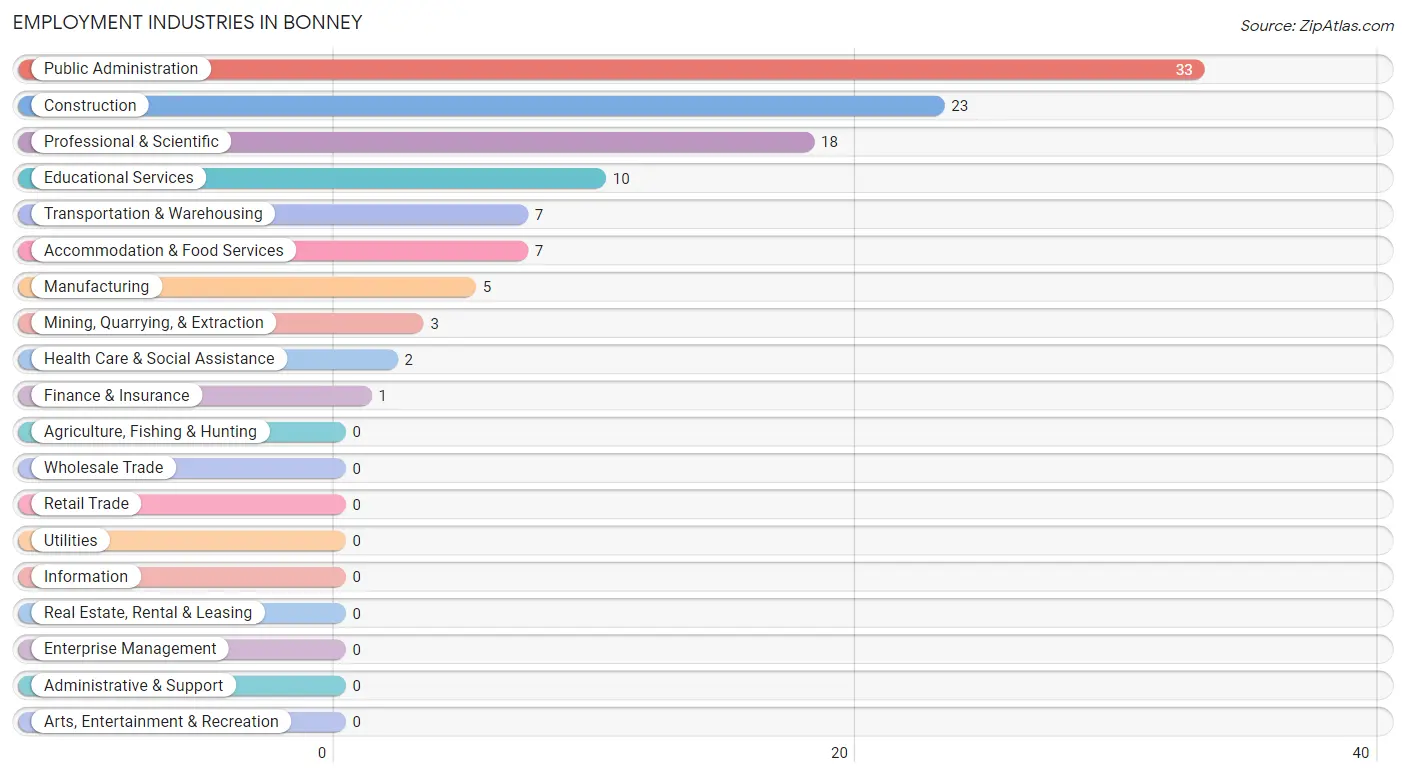
Employment Industries in Bonney
The major employment industries in Bonney include Public Administration (33 | 30.3%), Construction (23 | 21.1%), Professional & Scientific (18 | 16.5%), Educational Services (10 | 9.2%), and Transportation & Warehousing (7 | 6.4%).
Employment Industries by Sex in Bonney
The Bonney industries that see more men than women are Mining, Quarrying, & Extraction (100.0%), Construction (100.0%), and Transportation & Warehousing (100.0%), whereas the industries that tend to have a higher number of women are Educational Services (100.0%), Health Care & Social Assistance (100.0%), and Professional & Scientific (88.9%).
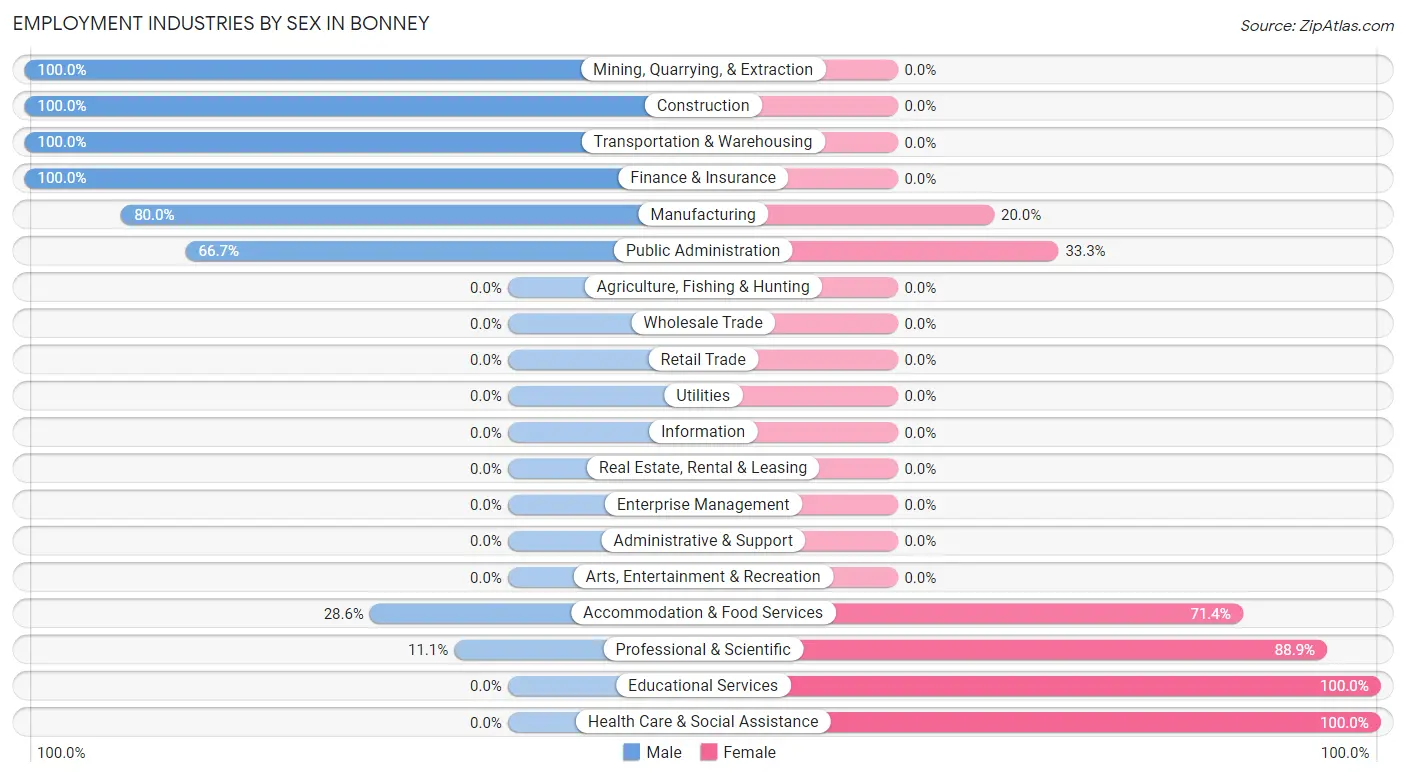
| Industry | Male | Female |
| Agriculture, Fishing & Hunting | 0 (0.0%) | 0 (0.0%) |
| Mining, Quarrying, & Extraction | 3 (100.0%) | 0 (0.0%) |
| Construction | 23 (100.0%) | 0 (0.0%) |
| Manufacturing | 4 (80.0%) | 1 (20.0%) |
| Wholesale Trade | 0 (0.0%) | 0 (0.0%) |
| Retail Trade | 0 (0.0%) | 0 (0.0%) |
| Transportation & Warehousing | 7 (100.0%) | 0 (0.0%) |
| Utilities | 0 (0.0%) | 0 (0.0%) |
| Information | 0 (0.0%) | 0 (0.0%) |
| Finance & Insurance | 1 (100.0%) | 0 (0.0%) |
| Real Estate, Rental & Leasing | 0 (0.0%) | 0 (0.0%) |
| Professional & Scientific | 2 (11.1%) | 16 (88.9%) |
| Enterprise Management | 0 (0.0%) | 0 (0.0%) |
| Administrative & Support | 0 (0.0%) | 0 (0.0%) |
| Educational Services | 0 (0.0%) | 10 (100.0%) |
| Health Care & Social Assistance | 0 (0.0%) | 2 (100.0%) |
| Arts, Entertainment & Recreation | 0 (0.0%) | 0 (0.0%) |
| Accommodation & Food Services | 2 (28.6%) | 5 (71.4%) |
| Public Administration | 22 (66.7%) | 11 (33.3%) |
| Total | 64 (58.7%) | 45 (41.3%) |
Education in Bonney
School Enrollment in Bonney
The most common levels of schooling among the 36 students in Bonney are high school (19 | 52.8%), elementary school (9 | 25.0%), and middle school (5 | 13.9%).
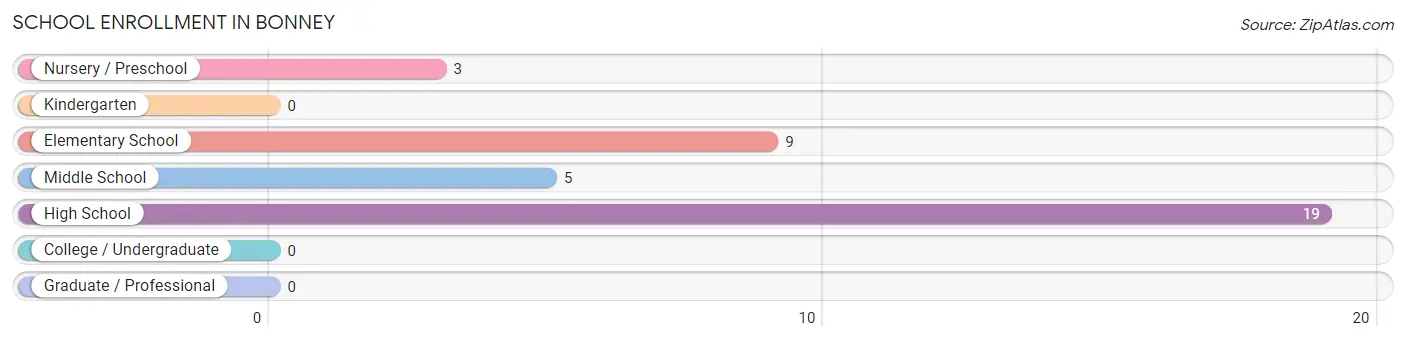
| School Level | # Students | % Students |
| Nursery / Preschool | 3 | 8.3% |
| Kindergarten | 0 | 0.0% |
| Elementary School | 9 | 25.0% |
| Middle School | 5 | 13.9% |
| High School | 19 | 52.8% |
| College / Undergraduate | 0 | 0.0% |
| Graduate / Professional | 0 | 0.0% |
| Total | 36 | 100.0% |
School Enrollment by Age by Funding Source in Bonney
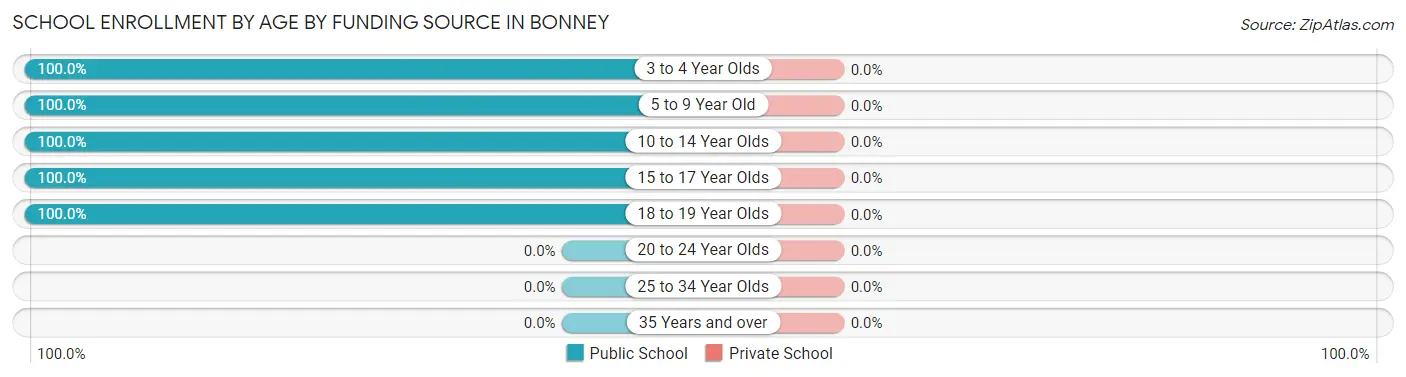
| Age Bracket | Public School | Private School |
| 3 to 4 Year Olds | 3 (100.0%) | 0 (0.0%) |
| 5 to 9 Year Old | 9 (100.0%) | 0 (0.0%) |
| 10 to 14 Year Olds | 14 (100.0%) | 0 (0.0%) |
| 15 to 17 Year Olds | 6 (100.0%) | 0 (0.0%) |
| 18 to 19 Year Olds | 4 (100.0%) | 0 (0.0%) |
| 20 to 24 Year Olds | 0 (0.0%) | 0 (0.0%) |
| 25 to 34 Year Olds | 0 (0.0%) | 0 (0.0%) |
| 35 Years and over | 0 (0.0%) | 0 (0.0%) |
| Total | 36 (100.0%) | 0 (0.0%) |
Educational Attainment by Field of Study in Bonney
Business (3 | 33.3%), liberal arts & history (3 | 33.3%), science & technology (1 | 11.1%), education (1 | 11.1%), and arts & humanities (1 | 11.1%) are the most common fields of study among 9 individuals in Bonney who have obtained a bachelor's degree or higher.
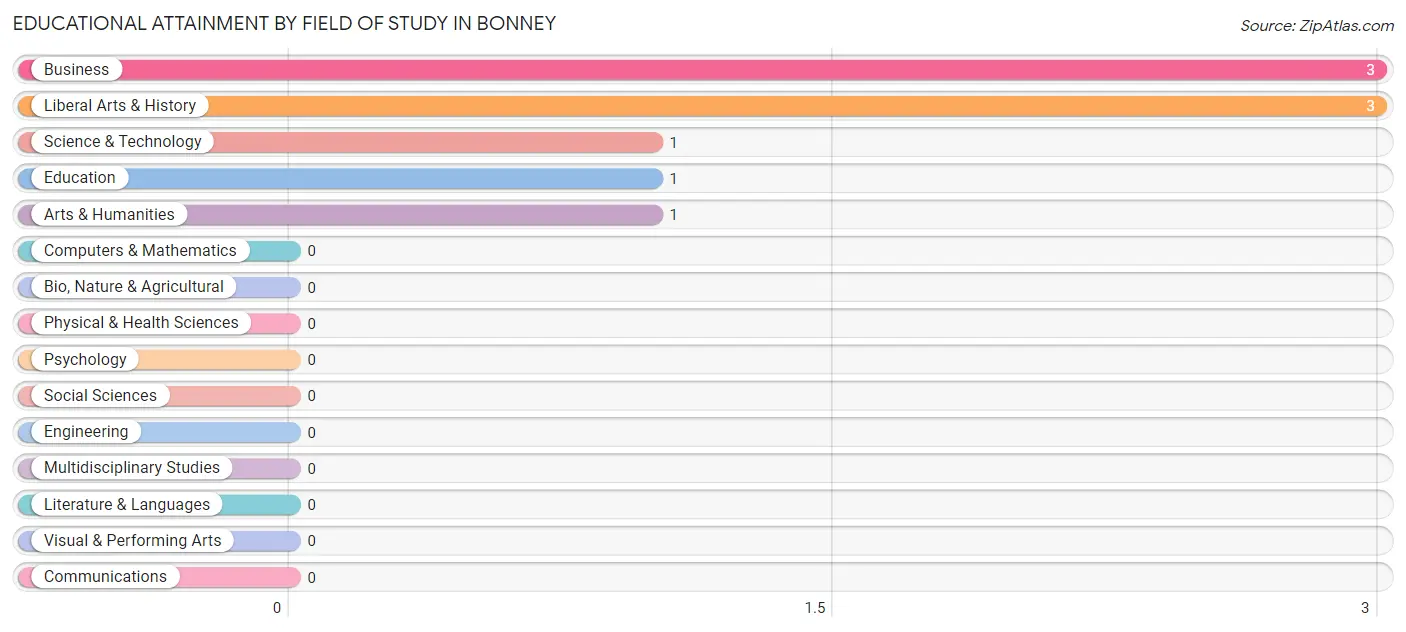
| Field of Study | # Graduates | % Graduates |
| Computers & Mathematics | 0 | 0.0% |
| Bio, Nature & Agricultural | 0 | 0.0% |
| Physical & Health Sciences | 0 | 0.0% |
| Psychology | 0 | 0.0% |
| Social Sciences | 0 | 0.0% |
| Engineering | 0 | 0.0% |
| Multidisciplinary Studies | 0 | 0.0% |
| Science & Technology | 1 | 11.1% |
| Business | 3 | 33.3% |
| Education | 1 | 11.1% |
| Literature & Languages | 0 | 0.0% |
| Liberal Arts & History | 3 | 33.3% |
| Visual & Performing Arts | 0 | 0.0% |
| Communications | 0 | 0.0% |
| Arts & Humanities | 1 | 11.1% |
| Total | 9 | 100.0% |
Transportation & Commute in Bonney
Vehicle Availability by Sex in Bonney
The most prevalent vehicle ownership categories in Bonney are males with 2 vehicles (43, accounting for 69.4%) and females with 2 vehicles (31, making up 95.6%).
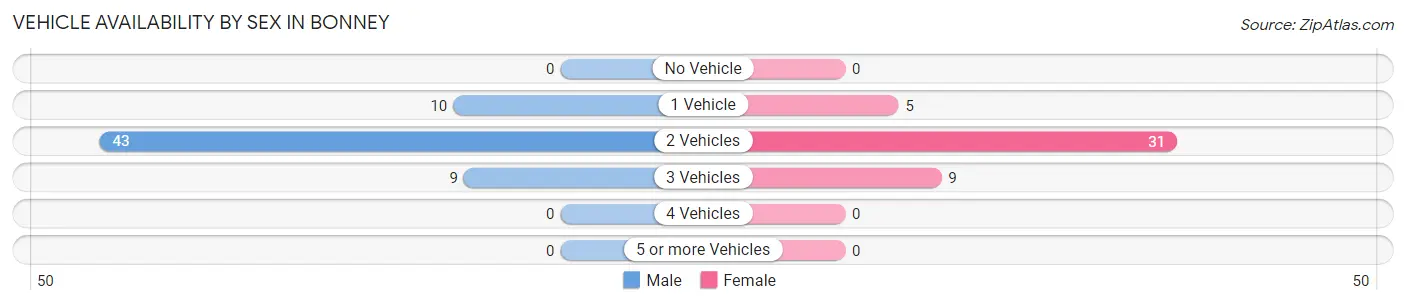
| Vehicles Available | Male | Female |
| No Vehicle | 0 (0.0%) | 0 (0.0%) |
| 1 Vehicle | 10 (16.1%) | 5 (11.1%) |
| 2 Vehicles | 43 (69.4%) | 31 (68.9%) |
| 3 Vehicles | 9 (14.5%) | 9 (20.0%) |
| 4 Vehicles | 0 (0.0%) | 0 (0.0%) |
| 5 or more Vehicles | 0 (0.0%) | 0 (0.0%) |
| Total | 62 (100.0%) | 45 (100.0%) |
Commute Time in Bonney
The most frequently occuring commute durations in Bonney are 15 to 19 minutes (33 commuters, 30.8%), 20 to 24 minutes (24 commuters, 22.4%), and 10 to 14 minutes (17 commuters, 15.9%).
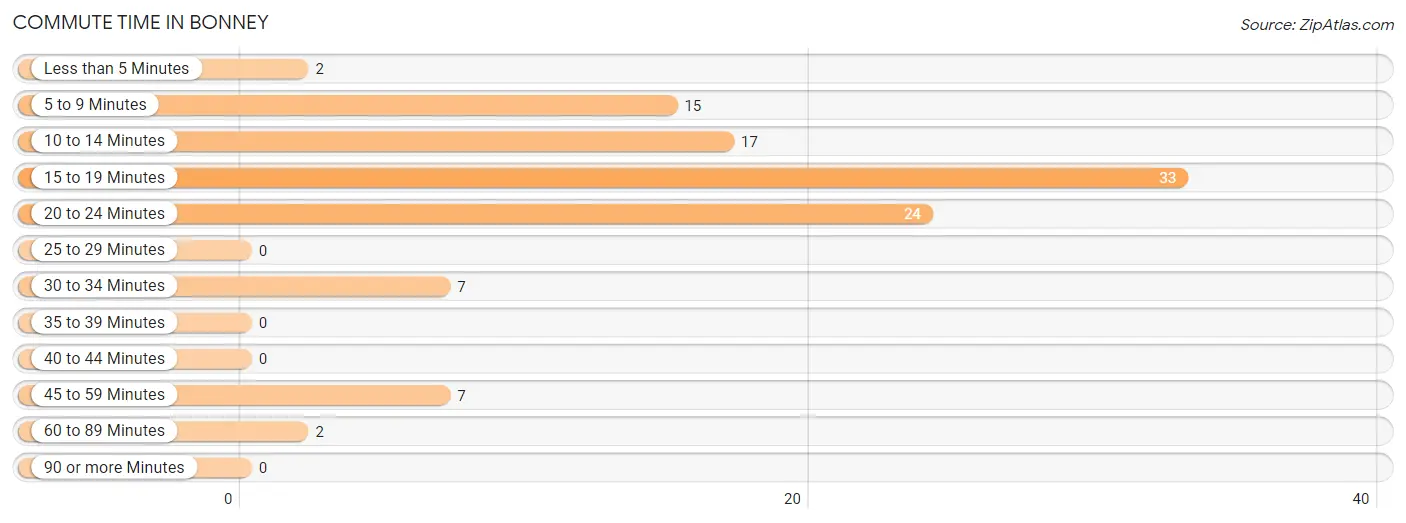
| Commute Time | # Commuters | % Commuters |
| Less than 5 Minutes | 2 | 1.9% |
| 5 to 9 Minutes | 15 | 14.0% |
| 10 to 14 Minutes | 17 | 15.9% |
| 15 to 19 Minutes | 33 | 30.8% |
| 20 to 24 Minutes | 24 | 22.4% |
| 25 to 29 Minutes | 0 | 0.0% |
| 30 to 34 Minutes | 7 | 6.5% |
| 35 to 39 Minutes | 0 | 0.0% |
| 40 to 44 Minutes | 0 | 0.0% |
| 45 to 59 Minutes | 7 | 6.5% |
| 60 to 89 Minutes | 2 | 1.9% |
| 90 or more Minutes | 0 | 0.0% |
Commute Time by Sex in Bonney
The most common commute times in Bonney are 20 to 24 minutes (24 commuters, 38.7%) for males and 15 to 19 minutes (20 commuters, 44.4%) for females.
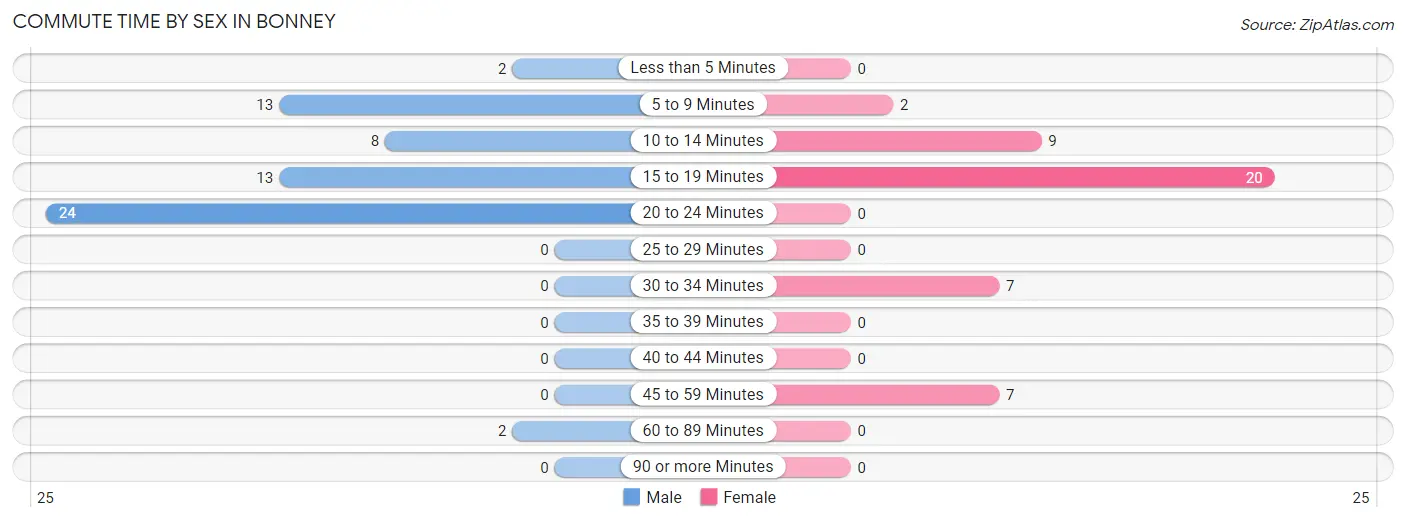
| Commute Time | Male | Female |
| Less than 5 Minutes | 2 (3.2%) | 0 (0.0%) |
| 5 to 9 Minutes | 13 (21.0%) | 2 (4.4%) |
| 10 to 14 Minutes | 8 (12.9%) | 9 (20.0%) |
| 15 to 19 Minutes | 13 (21.0%) | 20 (44.4%) |
| 20 to 24 Minutes | 24 (38.7%) | 0 (0.0%) |
| 25 to 29 Minutes | 0 (0.0%) | 0 (0.0%) |
| 30 to 34 Minutes | 0 (0.0%) | 7 (15.6%) |
| 35 to 39 Minutes | 0 (0.0%) | 0 (0.0%) |
| 40 to 44 Minutes | 0 (0.0%) | 0 (0.0%) |
| 45 to 59 Minutes | 0 (0.0%) | 7 (15.6%) |
| 60 to 89 Minutes | 2 (3.2%) | 0 (0.0%) |
| 90 or more Minutes | 0 (0.0%) | 0 (0.0%) |
Time of Departure to Work by Sex in Bonney
The most frequent times of departure to work in Bonney are 7:00 AM to 7:29 AM (24, 38.7%) for males and 7:30 AM to 7:59 AM (17, 37.8%) for females.
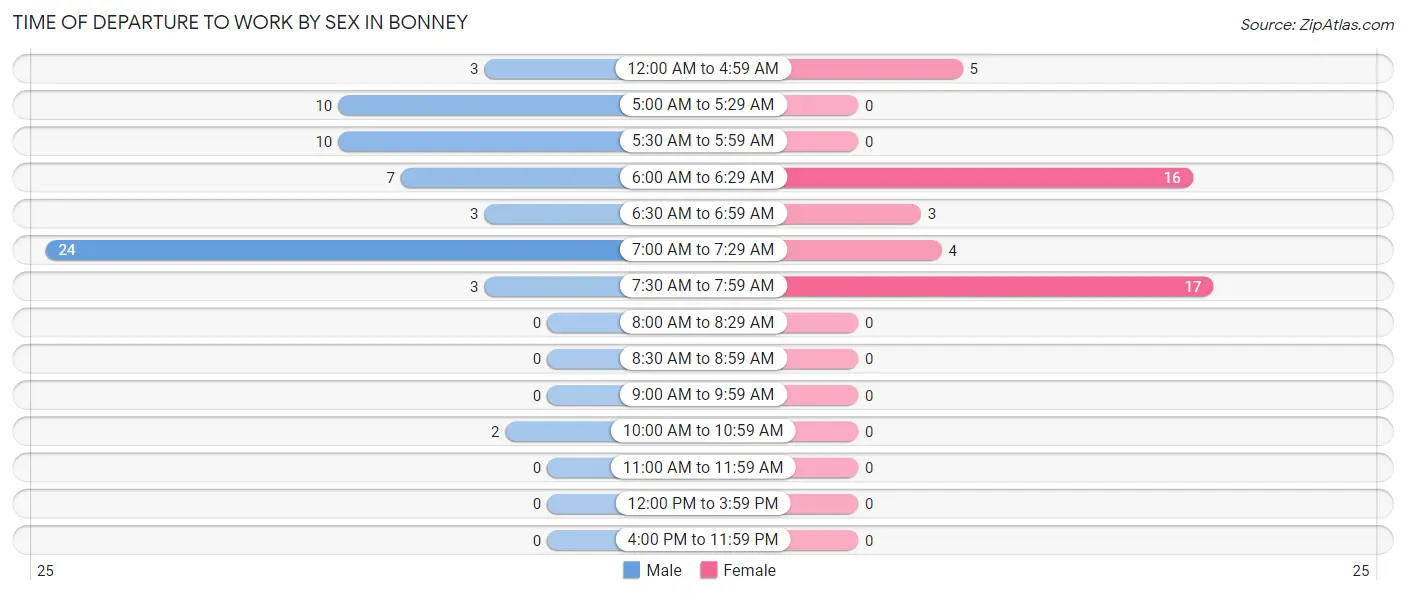
| Time of Departure | Male | Female |
| 12:00 AM to 4:59 AM | 3 (4.8%) | 5 (11.1%) |
| 5:00 AM to 5:29 AM | 10 (16.1%) | 0 (0.0%) |
| 5:30 AM to 5:59 AM | 10 (16.1%) | 0 (0.0%) |
| 6:00 AM to 6:29 AM | 7 (11.3%) | 16 (35.6%) |
| 6:30 AM to 6:59 AM | 3 (4.8%) | 3 (6.7%) |
| 7:00 AM to 7:29 AM | 24 (38.7%) | 4 (8.9%) |
| 7:30 AM to 7:59 AM | 3 (4.8%) | 17 (37.8%) |
| 8:00 AM to 8:29 AM | 0 (0.0%) | 0 (0.0%) |
| 8:30 AM to 8:59 AM | 0 (0.0%) | 0 (0.0%) |
| 9:00 AM to 9:59 AM | 0 (0.0%) | 0 (0.0%) |
| 10:00 AM to 10:59 AM | 2 (3.2%) | 0 (0.0%) |
| 11:00 AM to 11:59 AM | 0 (0.0%) | 0 (0.0%) |
| 12:00 PM to 3:59 PM | 0 (0.0%) | 0 (0.0%) |
| 4:00 PM to 11:59 PM | 0 (0.0%) | 0 (0.0%) |
| Total | 62 (100.0%) | 45 (100.0%) |
Housing Occupancy in Bonney
Occupancy by Ownership in Bonney
Of the total 84 dwellings in Bonney, owner-occupied units account for 40 (47.6%), while renter-occupied units make up 44 (52.4%).
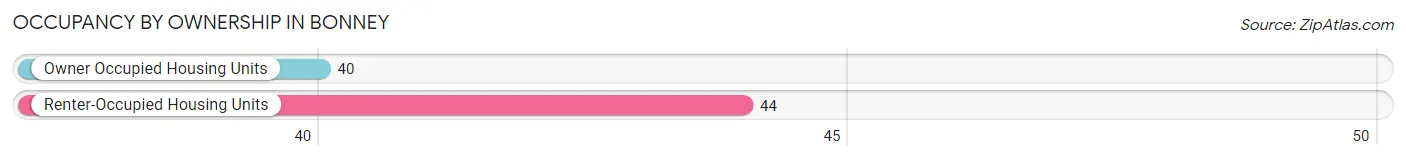
| Occupancy | # Housing Units | % Housing Units |
| Owner Occupied Housing Units | 40 | 47.6% |
| Renter-Occupied Housing Units | 44 | 52.4% |
| Total Occupied Housing Units | 84 | 100.0% |
Occupancy by Household Size in Bonney
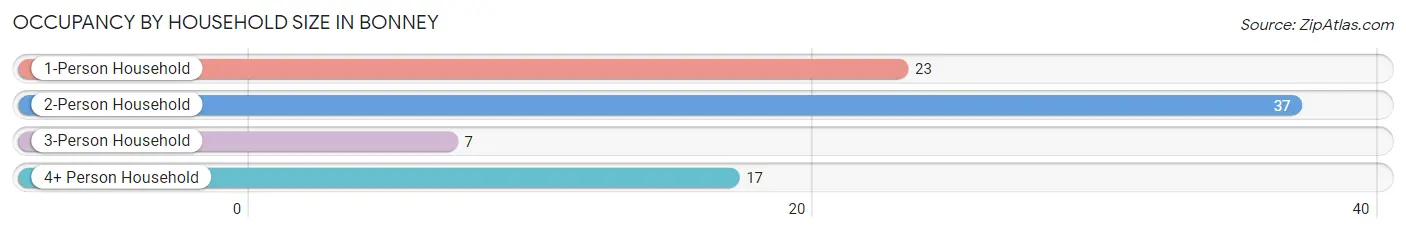
| Household Size | # Housing Units | % Housing Units |
| 1-Person Household | 23 | 27.4% |
| 2-Person Household | 37 | 44.1% |
| 3-Person Household | 7 | 8.3% |
| 4+ Person Household | 17 | 20.2% |
| Total Housing Units | 84 | 100.0% |
Occupancy by Ownership by Household Size in Bonney
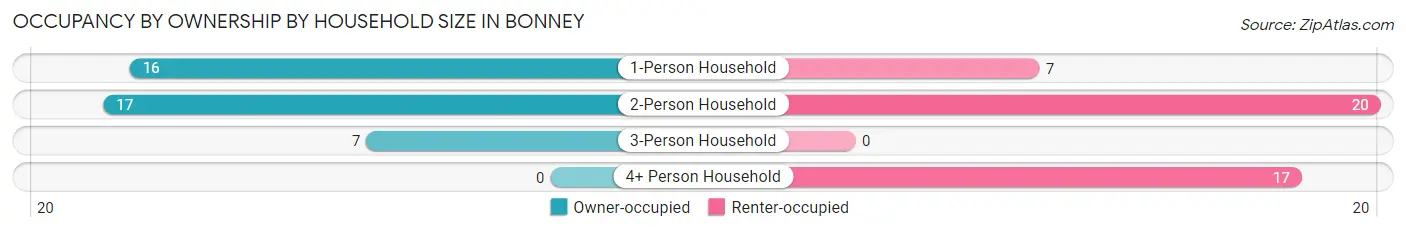
| Household Size | Owner-occupied | Renter-occupied |
| 1-Person Household | 16 (69.6%) | 7 (30.4%) |
| 2-Person Household | 17 (46.0%) | 20 (54.0%) |
| 3-Person Household | 7 (100.0%) | 0 (0.0%) |
| 4+ Person Household | 0 (0.0%) | 17 (100.0%) |
| Total Housing Units | 40 (47.6%) | 44 (52.4%) |
Occupancy by Educational Attainment in Bonney
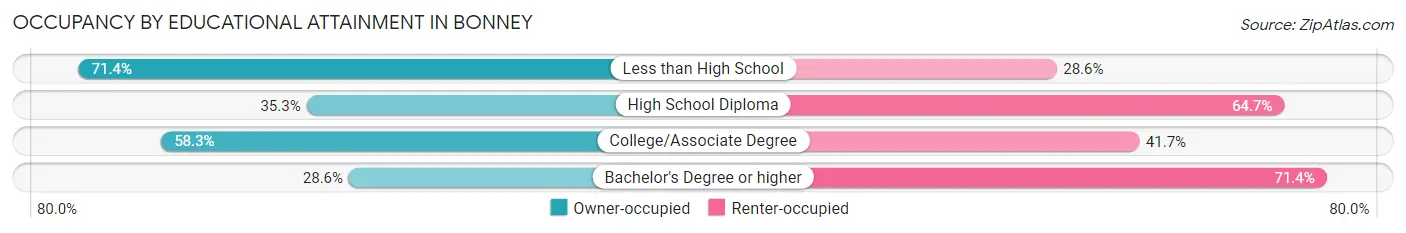
| Household Size | Owner-occupied | Renter-occupied |
| Less than High School | 5 (71.4%) | 2 (28.6%) |
| High School Diploma | 12 (35.3%) | 22 (64.7%) |
| College/Associate Degree | 21 (58.3%) | 15 (41.7%) |
| Bachelor's Degree or higher | 2 (28.6%) | 5 (71.4%) |
Occupancy by Age of Householder in Bonney
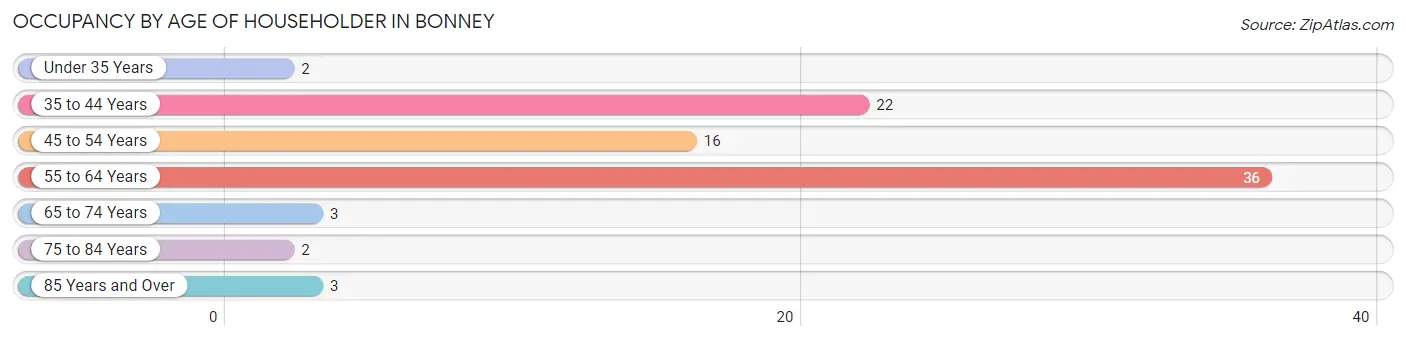
| Age Bracket | # Households | % Households |
| Under 35 Years | 2 | 2.4% |
| 35 to 44 Years | 22 | 26.2% |
| 45 to 54 Years | 16 | 19.1% |
| 55 to 64 Years | 36 | 42.9% |
| 65 to 74 Years | 3 | 3.6% |
| 75 to 84 Years | 2 | 2.4% |
| 85 Years and Over | 3 | 3.6% |
| Total | 84 | 100.0% |
Housing Finances in Bonney
Median Income by Occupancy in Bonney
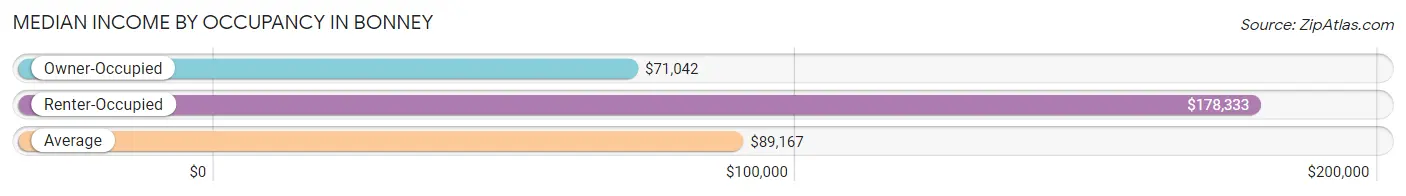
| Occupancy Type | # Households | Median Income |
| Owner-Occupied | 40 (47.6%) | $71,042 |
| Renter-Occupied | 44 (52.4%) | $178,333 |
| Average | 84 (100.0%) | $89,167 |
Occupancy by Householder Income Bracket in Bonney
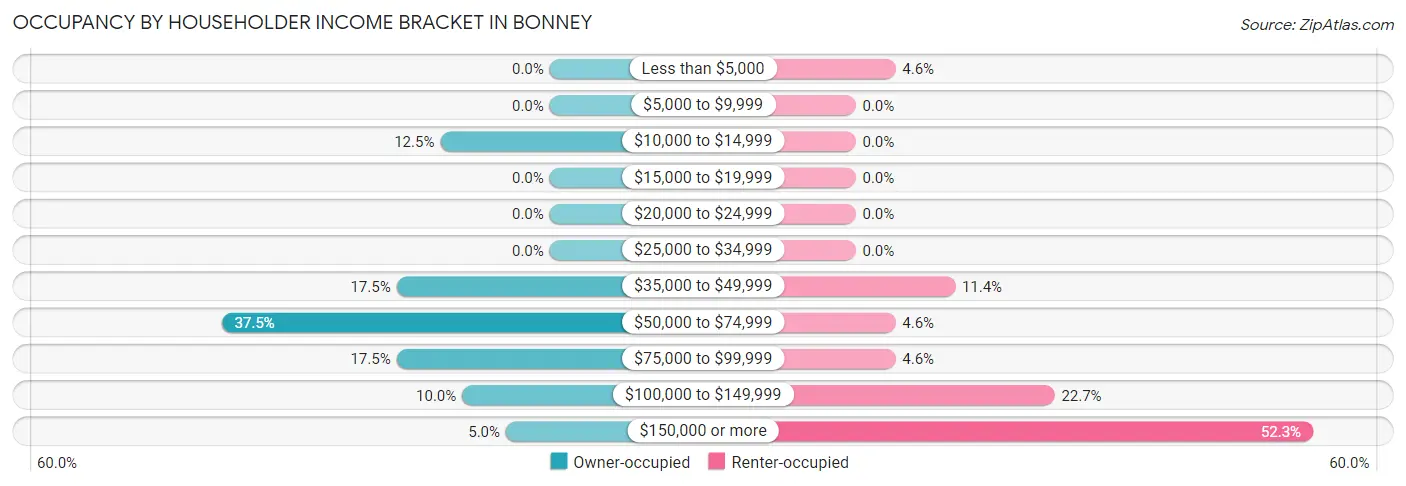
| Income Bracket | Owner-occupied | Renter-occupied |
| Less than $5,000 | 0 (0.0%) | 2 (4.5%) |
| $5,000 to $9,999 | 0 (0.0%) | 0 (0.0%) |
| $10,000 to $14,999 | 5 (12.5%) | 0 (0.0%) |
| $15,000 to $19,999 | 0 (0.0%) | 0 (0.0%) |
| $20,000 to $24,999 | 0 (0.0%) | 0 (0.0%) |
| $25,000 to $34,999 | 0 (0.0%) | 0 (0.0%) |
| $35,000 to $49,999 | 7 (17.5%) | 5 (11.4%) |
| $50,000 to $74,999 | 15 (37.5%) | 2 (4.5%) |
| $75,000 to $99,999 | 7 (17.5%) | 2 (4.5%) |
| $100,000 to $149,999 | 4 (10.0%) | 10 (22.7%) |
| $150,000 or more | 2 (5.0%) | 23 (52.3%) |
| Total | 40 (100.0%) | 44 (100.0%) |
Monthly Housing Cost Tiers in Bonney
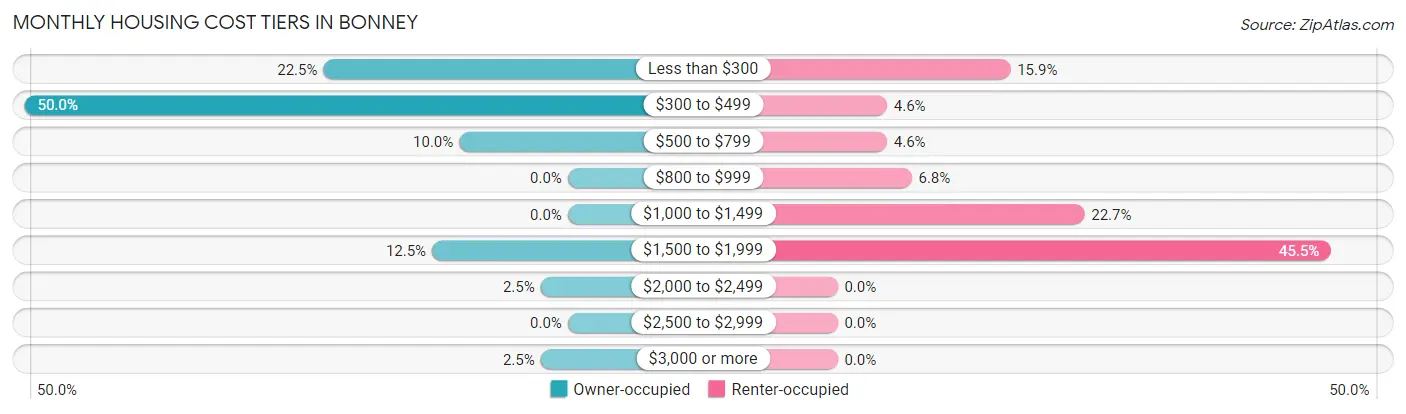
| Monthly Cost | Owner-occupied | Renter-occupied |
| Less than $300 | 9 (22.5%) | 7 (15.9%) |
| $300 to $499 | 20 (50.0%) | 2 (4.5%) |
| $500 to $799 | 4 (10.0%) | 2 (4.5%) |
| $800 to $999 | 0 (0.0%) | 3 (6.8%) |
| $1,000 to $1,499 | 0 (0.0%) | 10 (22.7%) |
| $1,500 to $1,999 | 5 (12.5%) | 20 (45.5%) |
| $2,000 to $2,499 | 1 (2.5%) | 0 (0.0%) |
| $2,500 to $2,999 | 0 (0.0%) | 0 (0.0%) |
| $3,000 or more | 1 (2.5%) | 0 (0.0%) |
| Total | 40 (100.0%) | 44 (100.0%) |
Physical Housing Characteristics in Bonney
Housing Structures in Bonney
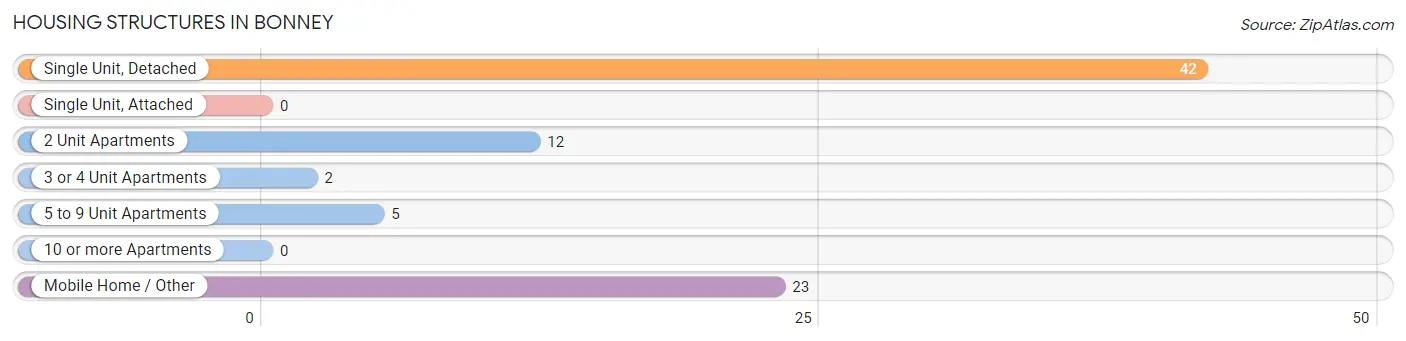
| Structure Type | # Housing Units | % Housing Units |
| Single Unit, Detached | 42 | 50.0% |
| Single Unit, Attached | 0 | 0.0% |
| 2 Unit Apartments | 12 | 14.3% |
| 3 or 4 Unit Apartments | 2 | 2.4% |
| 5 to 9 Unit Apartments | 5 | 5.9% |
| 10 or more Apartments | 0 | 0.0% |
| Mobile Home / Other | 23 | 27.4% |
| Total | 84 | 100.0% |
Housing Structures by Occupancy in Bonney
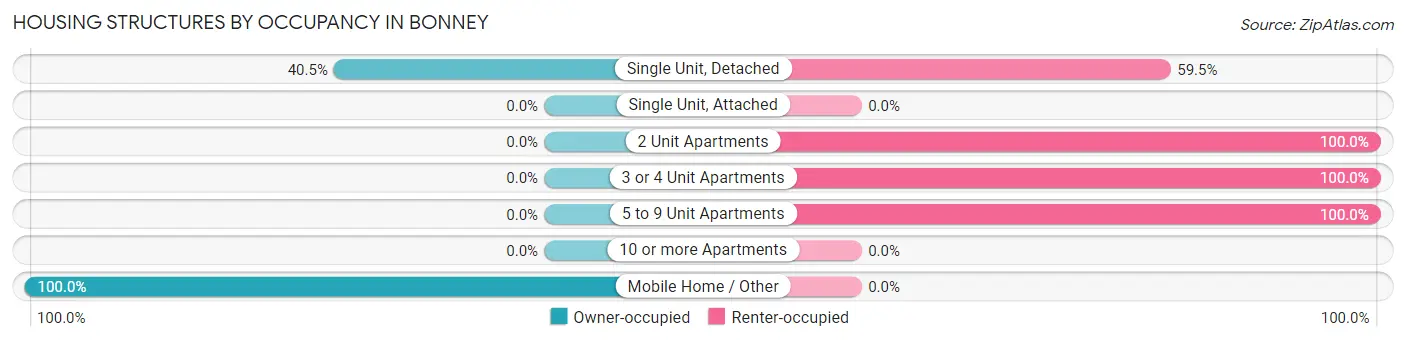
| Structure Type | Owner-occupied | Renter-occupied |
| Single Unit, Detached | 17 (40.5%) | 25 (59.5%) |
| Single Unit, Attached | 0 (0.0%) | 0 (0.0%) |
| 2 Unit Apartments | 0 (0.0%) | 12 (100.0%) |
| 3 or 4 Unit Apartments | 0 (0.0%) | 2 (100.0%) |
| 5 to 9 Unit Apartments | 0 (0.0%) | 5 (100.0%) |
| 10 or more Apartments | 0 (0.0%) | 0 (0.0%) |
| Mobile Home / Other | 23 (100.0%) | 0 (0.0%) |
| Total | 40 (47.6%) | 44 (52.4%) |
Housing Structures by Number of Rooms in Bonney
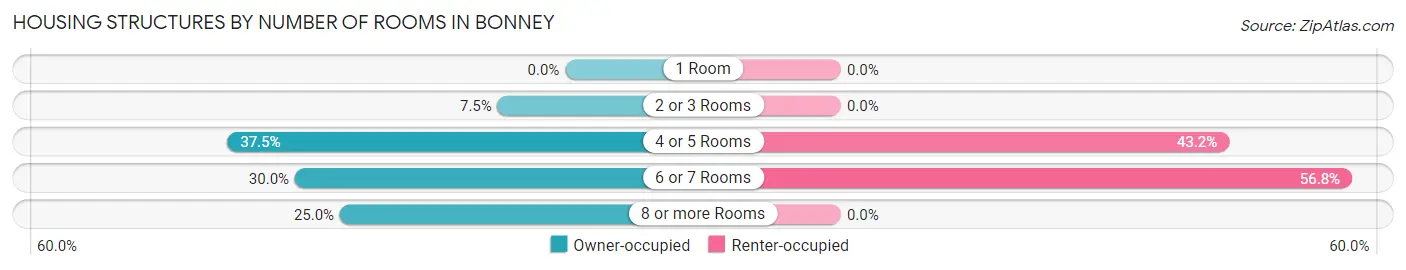
| Number of Rooms | Owner-occupied | Renter-occupied |
| 1 Room | 0 (0.0%) | 0 (0.0%) |
| 2 or 3 Rooms | 3 (7.5%) | 0 (0.0%) |
| 4 or 5 Rooms | 15 (37.5%) | 19 (43.2%) |
| 6 or 7 Rooms | 12 (30.0%) | 25 (56.8%) |
| 8 or more Rooms | 10 (25.0%) | 0 (0.0%) |
| Total | 40 (100.0%) | 44 (100.0%) |
Housing Structure by Heating Type in Bonney
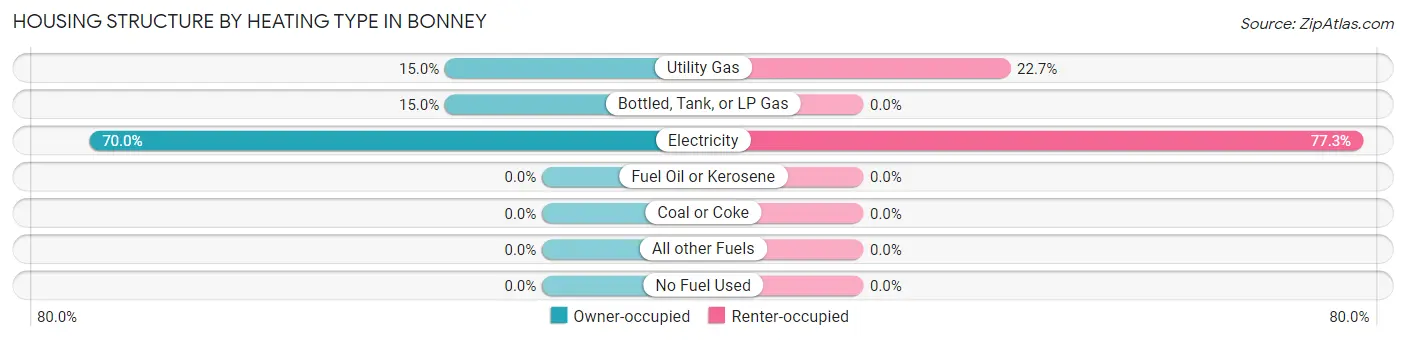
| Heating Type | Owner-occupied | Renter-occupied |
| Utility Gas | 6 (15.0%) | 10 (22.7%) |
| Bottled, Tank, or LP Gas | 6 (15.0%) | 0 (0.0%) |
| Electricity | 28 (70.0%) | 34 (77.3%) |
| Fuel Oil or Kerosene | 0 (0.0%) | 0 (0.0%) |
| Coal or Coke | 0 (0.0%) | 0 (0.0%) |
| All other Fuels | 0 (0.0%) | 0 (0.0%) |
| No Fuel Used | 0 (0.0%) | 0 (0.0%) |
| Total | 40 (100.0%) | 44 (100.0%) |
Household Vehicle Usage in Bonney
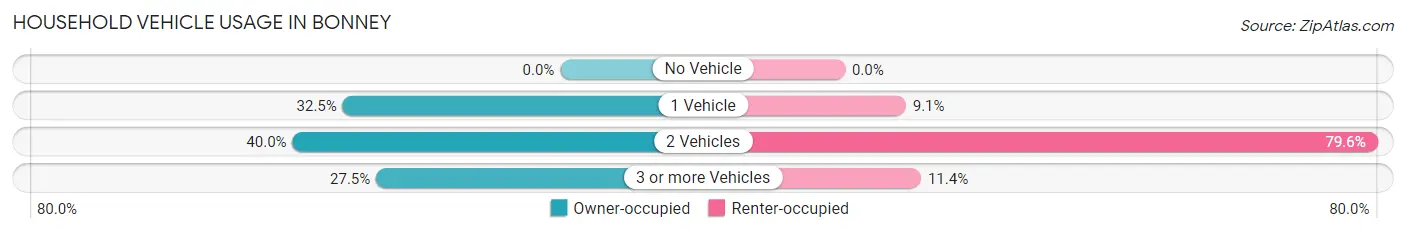
| Vehicles per Household | Owner-occupied | Renter-occupied |
| No Vehicle | 0 (0.0%) | 0 (0.0%) |
| 1 Vehicle | 13 (32.5%) | 4 (9.1%) |
| 2 Vehicles | 16 (40.0%) | 35 (79.5%) |
| 3 or more Vehicles | 11 (27.5%) | 5 (11.4%) |
| Total | 40 (100.0%) | 44 (100.0%) |
Real Estate & Mortgages in Bonney
Real Estate and Mortgage Overview in Bonney
| Characteristic | Without Mortgage | With Mortgage |
| Housing Units | 35 | 5 |
| Median Property Value | - | - |
| Median Household Income | $70,938 | $2 |
| Monthly Housing Costs | $343 | $1 |
| Real Estate Taxes | - | - |
Property Value by Mortgage Status in Bonney
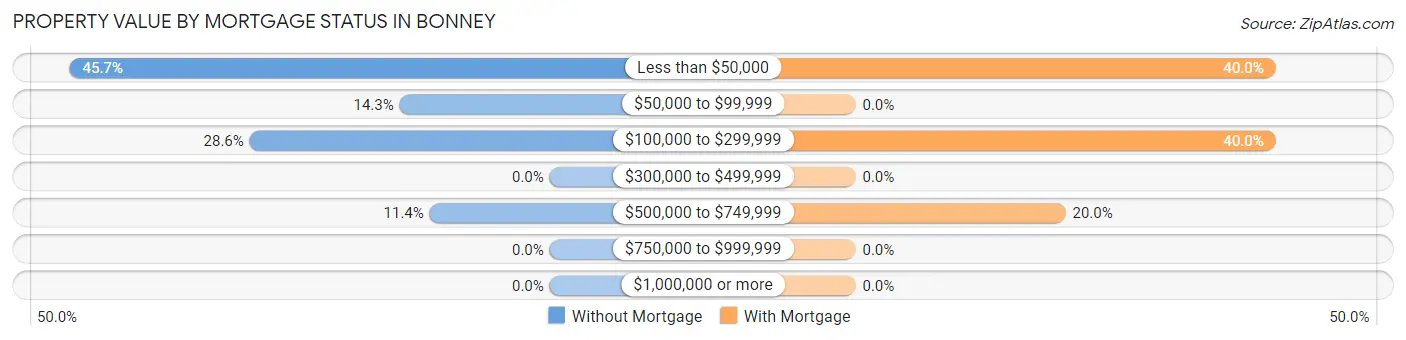
| Property Value | Without Mortgage | With Mortgage |
| Less than $50,000 | 16 (45.7%) | 2 (40.0%) |
| $50,000 to $99,999 | 5 (14.3%) | 0 (0.0%) |
| $100,000 to $299,999 | 10 (28.6%) | 2 (40.0%) |
| $300,000 to $499,999 | 0 (0.0%) | 0 (0.0%) |
| $500,000 to $749,999 | 4 (11.4%) | 1 (20.0%) |
| $750,000 to $999,999 | 0 (0.0%) | 0 (0.0%) |
| $1,000,000 or more | 0 (0.0%) | 0 (0.0%) |
| Total | 35 (100.0%) | 5 (100.0%) |
Household Income by Mortgage Status in Bonney
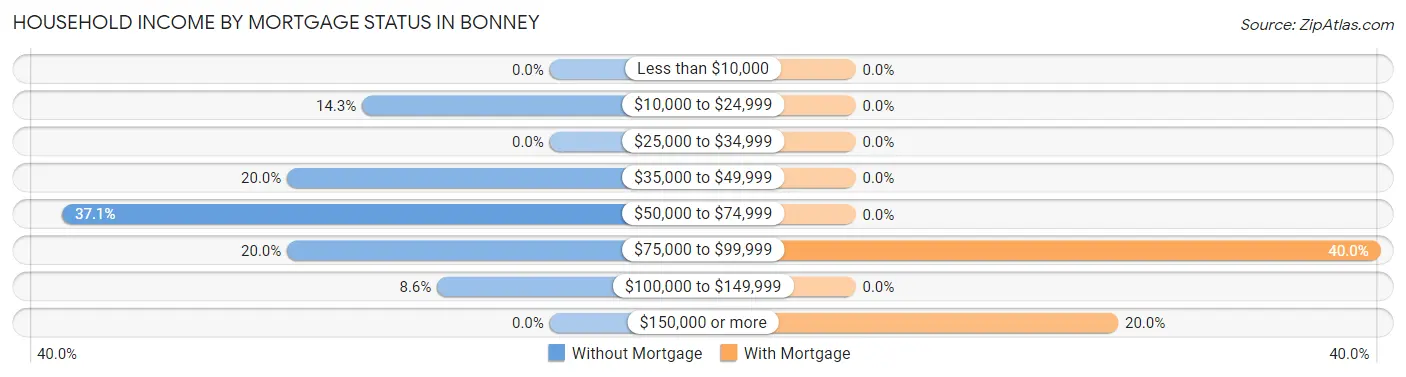
| Household Income | Without Mortgage | With Mortgage |
| Less than $10,000 | 0 (0.0%) | 0 (0.0%) |
| $10,000 to $24,999 | 5 (14.3%) | 0 (0.0%) |
| $25,000 to $34,999 | 0 (0.0%) | 0 (0.0%) |
| $35,000 to $49,999 | 7 (20.0%) | 0 (0.0%) |
| $50,000 to $74,999 | 13 (37.1%) | 0 (0.0%) |
| $75,000 to $99,999 | 7 (20.0%) | 2 (40.0%) |
| $100,000 to $149,999 | 3 (8.6%) | 0 (0.0%) |
| $150,000 or more | 0 (0.0%) | 1 (20.0%) |
| Total | 35 (100.0%) | 5 (100.0%) |
Property Value to Household Income Ratio in Bonney
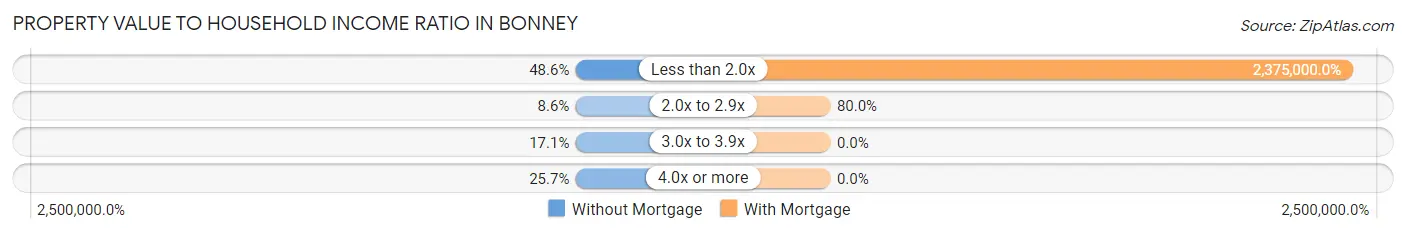
| Value-to-Income Ratio | Without Mortgage | With Mortgage |
| Less than 2.0x | 17 (48.6%) | 118,750 (2,375,000.0%) |
| 2.0x to 2.9x | 3 (8.6%) | 4 (80.0%) |
| 3.0x to 3.9x | 6 (17.1%) | 0 (0.0%) |
| 4.0x or more | 9 (25.7%) | 0 (0.0%) |
| Total | 35 (100.0%) | 5 (100.0%) |
Real Estate Taxes by Mortgage Status in Bonney
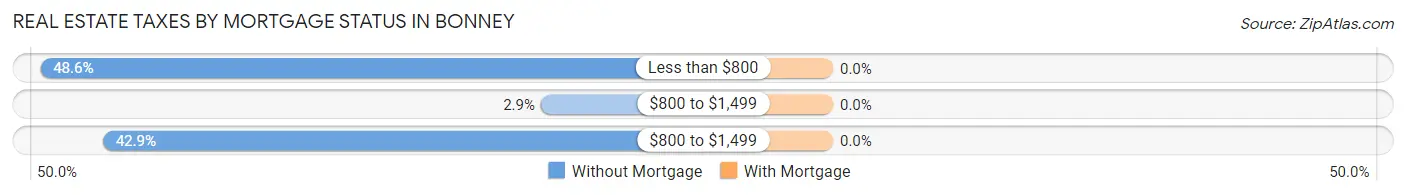
| Property Taxes | Without Mortgage | With Mortgage |
| Less than $800 | 17 (48.6%) | 0 (0.0%) |
| $800 to $1,499 | 1 (2.9%) | 0 (0.0%) |
| $800 to $1,499 | 15 (42.9%) | 0 (0.0%) |
| Total | 35 (100.0%) | 5 (100.0%) |
Health & Disability in Bonney
Health Insurance Coverage by Age in Bonney
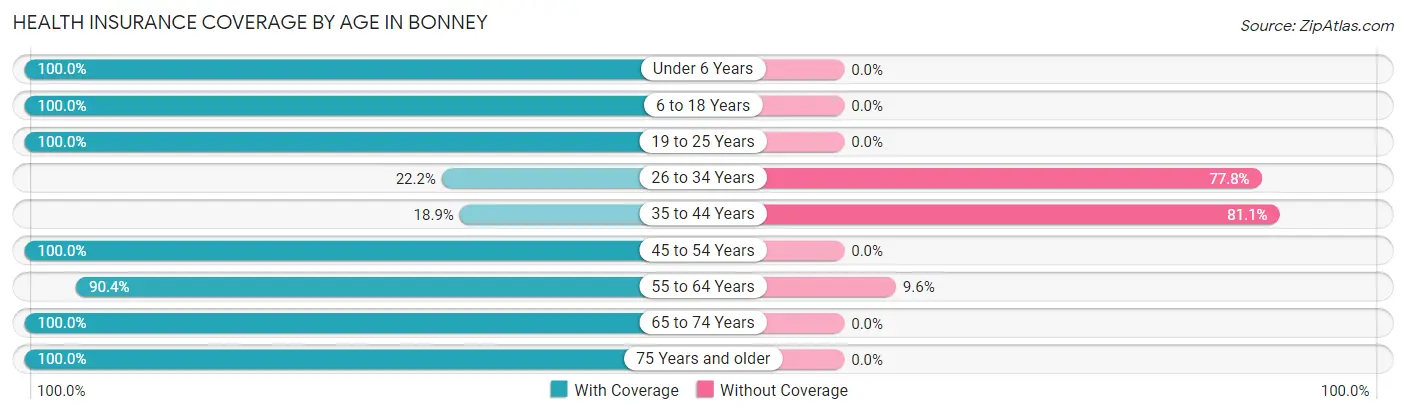
| Age Bracket | With Coverage | Without Coverage |
| Under 6 Years | 3 (100.0%) | 0 (0.0%) |
| 6 to 18 Years | 33 (100.0%) | 0 (0.0%) |
| 19 to 25 Years | 12 (100.0%) | 0 (0.0%) |
| 26 to 34 Years | 2 (22.2%) | 7 (77.8%) |
| 35 to 44 Years | 10 (18.9%) | 43 (81.1%) |
| 45 to 54 Years | 20 (100.0%) | 0 (0.0%) |
| 55 to 64 Years | 47 (90.4%) | 5 (9.6%) |
| 65 to 74 Years | 9 (100.0%) | 0 (0.0%) |
| 75 Years and older | 6 (100.0%) | 0 (0.0%) |
| Total | 142 (72.1%) | 55 (27.9%) |
Health Insurance Coverage by Citizenship Status in Bonney
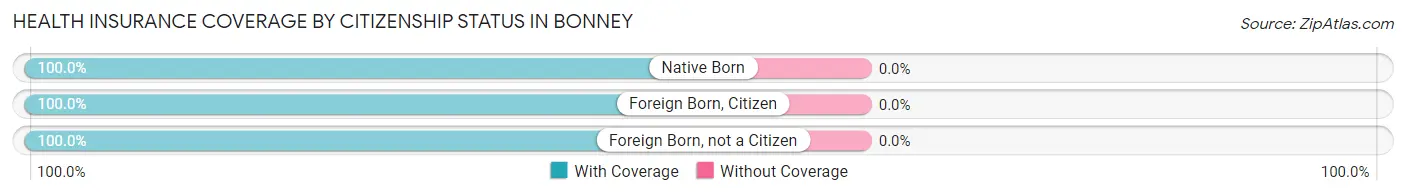
| Citizenship Status | With Coverage | Without Coverage |
| Native Born | 3 (100.0%) | 0 (0.0%) |
| Foreign Born, Citizen | 33 (100.0%) | 0 (0.0%) |
| Foreign Born, not a Citizen | 12 (100.0%) | 0 (0.0%) |
Health Insurance Coverage by Household Income in Bonney
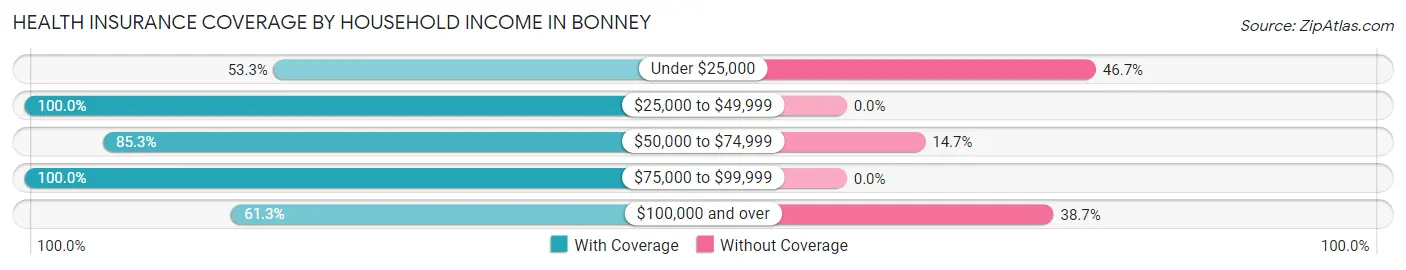
| Household Income | With Coverage | Without Coverage |
| Under $25,000 | 8 (53.3%) | 7 (46.7%) |
| $25,000 to $49,999 | 12 (100.0%) | 0 (0.0%) |
| $50,000 to $74,999 | 29 (85.3%) | 5 (14.7%) |
| $75,000 to $99,999 | 25 (100.0%) | 0 (0.0%) |
| $100,000 and over | 68 (61.3%) | 43 (38.7%) |
Public vs Private Health Insurance Coverage by Age in Bonney
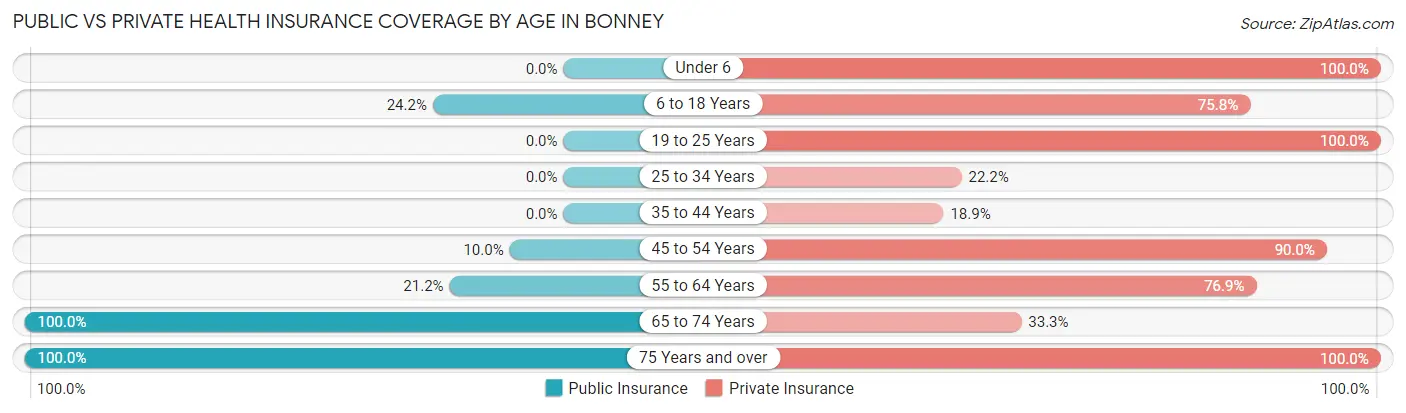
| Age Bracket | Public Insurance | Private Insurance |
| Under 6 | 0 (0.0%) | 3 (100.0%) |
| 6 to 18 Years | 8 (24.2%) | 25 (75.8%) |
| 19 to 25 Years | 0 (0.0%) | 12 (100.0%) |
| 25 to 34 Years | 0 (0.0%) | 2 (22.2%) |
| 35 to 44 Years | 0 (0.0%) | 10 (18.9%) |
| 45 to 54 Years | 2 (10.0%) | 18 (90.0%) |
| 55 to 64 Years | 11 (21.1%) | 40 (76.9%) |
| 65 to 74 Years | 9 (100.0%) | 3 (33.3%) |
| 75 Years and over | 6 (100.0%) | 6 (100.0%) |
| Total | 36 (18.3%) | 119 (60.4%) |
Disability Status by Sex by Age in Bonney
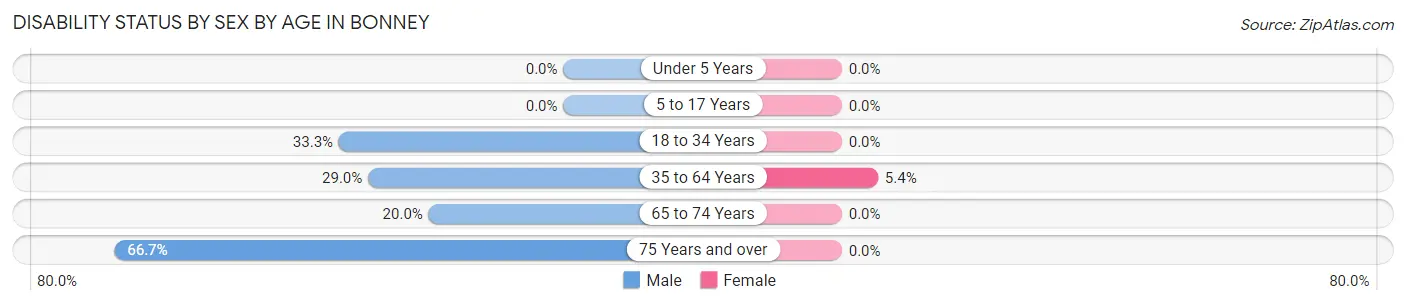
| Age Bracket | Male | Female |
| Under 5 Years | 0 (0.0%) | 0 (0.0%) |
| 5 to 17 Years | 0 (0.0%) | 0 (0.0%) |
| 18 to 34 Years | 2 (33.3%) | 0 (0.0%) |
| 35 to 64 Years | 20 (29.0%) | 3 (5.4%) |
| 65 to 74 Years | 1 (20.0%) | 0 (0.0%) |
| 75 Years and over | 4 (66.7%) | 0 (0.0%) |
Disability Class by Sex by Age in Bonney
Disability Class: Hearing Difficulty
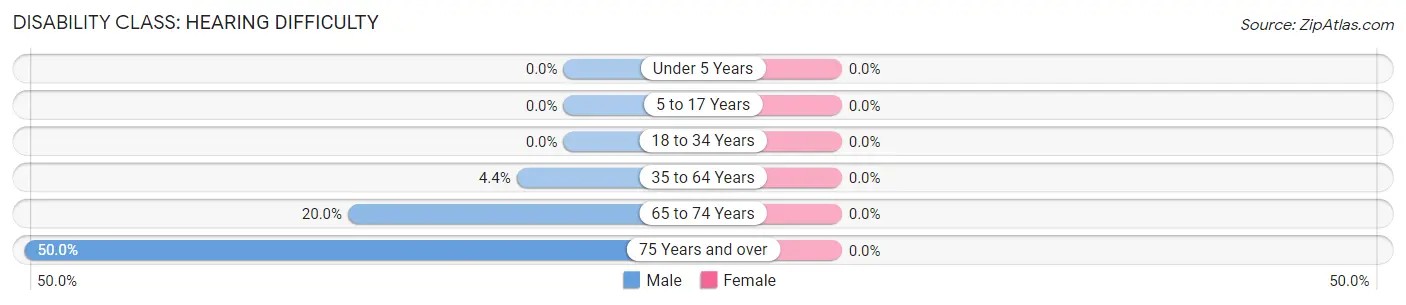
| Age Bracket | Male | Female |
| Under 5 Years | 0 (0.0%) | 0 (0.0%) |
| 5 to 17 Years | 0 (0.0%) | 0 (0.0%) |
| 18 to 34 Years | 0 (0.0%) | 0 (0.0%) |
| 35 to 64 Years | 3 (4.3%) | 0 (0.0%) |
| 65 to 74 Years | 1 (20.0%) | 0 (0.0%) |
| 75 Years and over | 3 (50.0%) | 0 (0.0%) |
Disability Class: Vision Difficulty
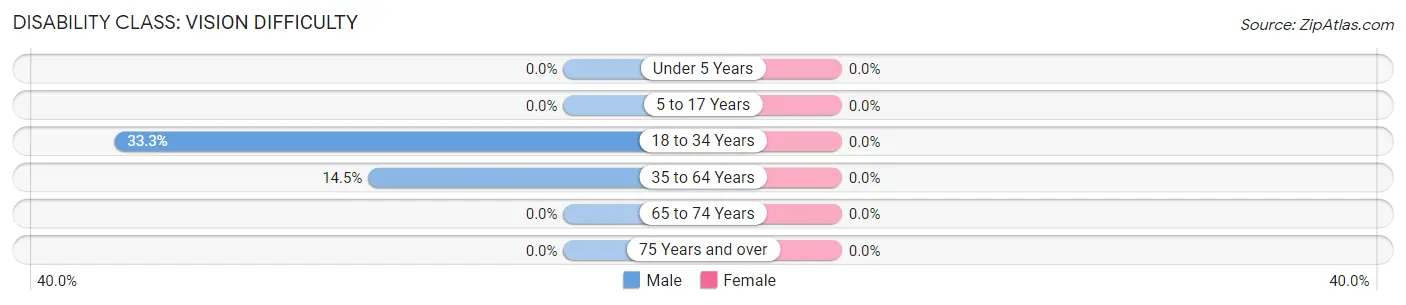
| Age Bracket | Male | Female |
| Under 5 Years | 0 (0.0%) | 0 (0.0%) |
| 5 to 17 Years | 0 (0.0%) | 0 (0.0%) |
| 18 to 34 Years | 2 (33.3%) | 0 (0.0%) |
| 35 to 64 Years | 10 (14.5%) | 0 (0.0%) |
| 65 to 74 Years | 0 (0.0%) | 0 (0.0%) |
| 75 Years and over | 0 (0.0%) | 0 (0.0%) |
Disability Class: Cognitive Difficulty
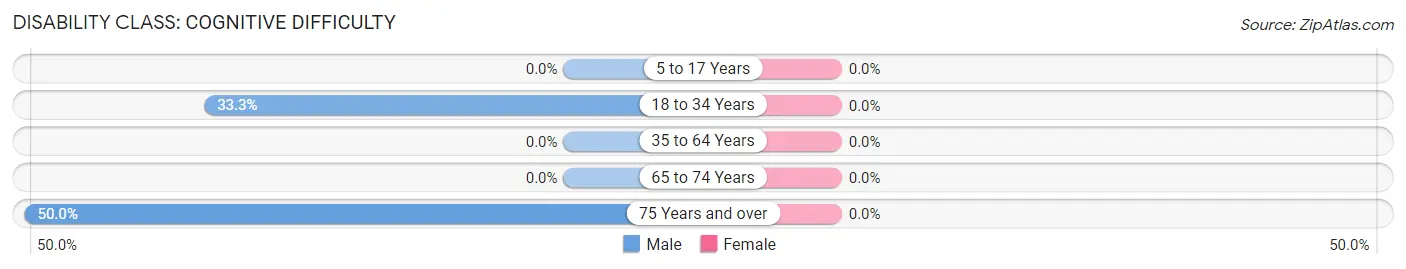
| Age Bracket | Male | Female |
| 5 to 17 Years | 0 (0.0%) | 0 (0.0%) |
| 18 to 34 Years | 2 (33.3%) | 0 (0.0%) |
| 35 to 64 Years | 0 (0.0%) | 0 (0.0%) |
| 65 to 74 Years | 0 (0.0%) | 0 (0.0%) |
| 75 Years and over | 3 (50.0%) | 0 (0.0%) |
Disability Class: Ambulatory Difficulty
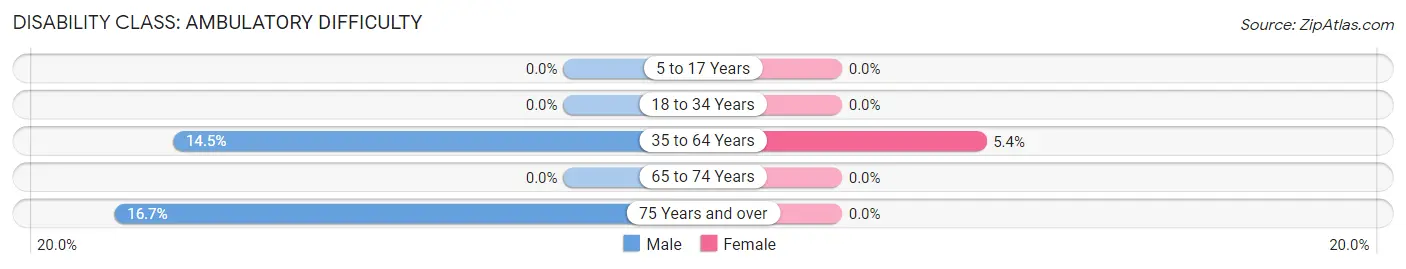
| Age Bracket | Male | Female |
| 5 to 17 Years | 0 (0.0%) | 0 (0.0%) |
| 18 to 34 Years | 0 (0.0%) | 0 (0.0%) |
| 35 to 64 Years | 10 (14.5%) | 3 (5.4%) |
| 65 to 74 Years | 0 (0.0%) | 0 (0.0%) |
| 75 Years and over | 1 (16.7%) | 0 (0.0%) |
Disability Class: Self-Care Difficulty
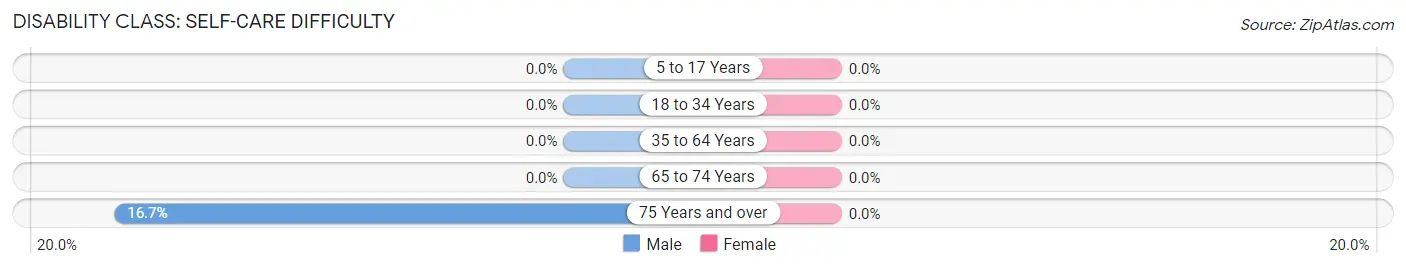
| Age Bracket | Male | Female |
| 5 to 17 Years | 0 (0.0%) | 0 (0.0%) |
| 18 to 34 Years | 0 (0.0%) | 0 (0.0%) |
| 35 to 64 Years | 0 (0.0%) | 0 (0.0%) |
| 65 to 74 Years | 0 (0.0%) | 0 (0.0%) |
| 75 Years and over | 1 (16.7%) | 0 (0.0%) |
Technology Access in Bonney
Computing Device Access in Bonney
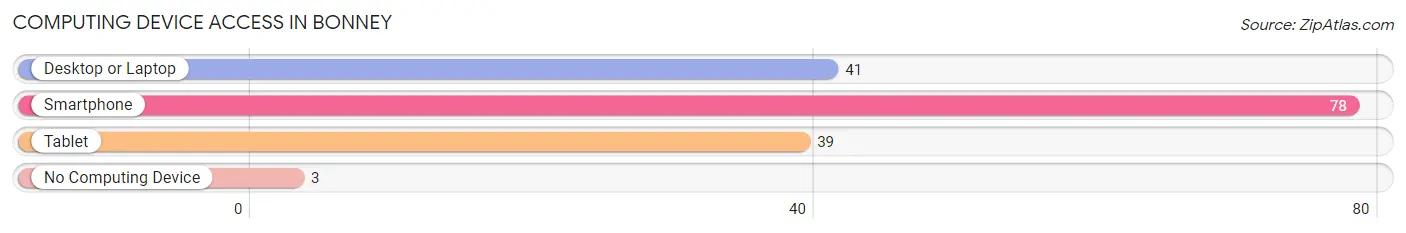
| Device Type | # Households | % Households |
| Desktop or Laptop | 41 | 48.8% |
| Smartphone | 78 | 92.9% |
| Tablet | 39 | 46.4% |
| No Computing Device | 3 | 3.6% |
| Total | 84 | 100.0% |
Internet Access in Bonney
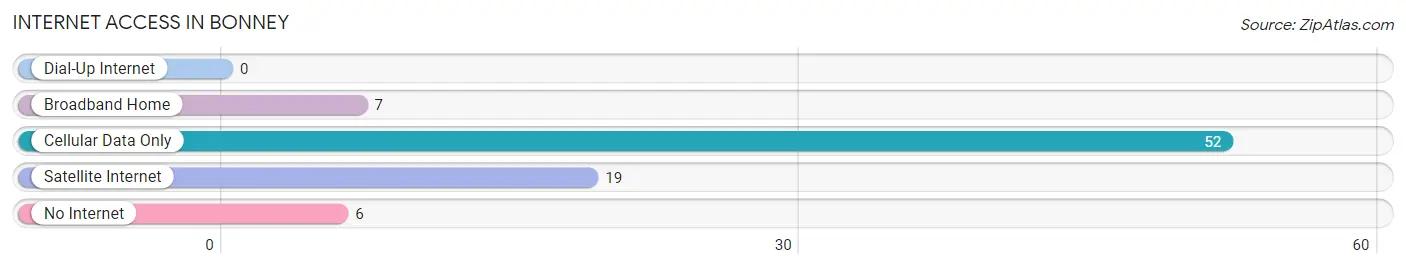
| Internet Type | # Households | % Households |
| Dial-Up Internet | 0 | 0.0% |
| Broadband Home | 7 | 8.3% |
| Cellular Data Only | 52 | 61.9% |
| Satellite Internet | 19 | 22.6% |
| No Internet | 6 | 7.1% |
| Total | 84 | 100.0% |
Bonney Summary
Bonney is a small town located in the state of Texas, in the United States. It is situated in the southeastern part of the state, in the county of Brazoria. The town has a population of approximately 1,000 people, and is located about 30 miles south of Houston.
Geography
Bonney is located in the southeastern part of Texas, in the county of Brazoria. It is situated on the Gulf Coast, and is bordered by the cities of Alvin, Angleton, and Lake Jackson. The town is located on the banks of the San Bernard River, and is surrounded by a number of small lakes and ponds. The terrain of the area is mostly flat, with some rolling hills. The climate of the area is humid subtropical, with hot summers and mild winters.
Economy
The economy of Bonney is largely based on agriculture and oil production. The town is home to several large farms, which produce a variety of crops, including corn, cotton, and soybeans. The town is also home to several oil and gas production companies, which are responsible for much of the town’s economic activity. In addition, the town is home to a number of small businesses, including restaurants, retail stores, and service providers.
Demographics
As of the 2010 census, the population of Bonney was 1,000 people. The racial makeup of the town was 94.2% White, 0.7% African American, 0.3% Native American, 0.3% Asian, 0.1% Pacific Islander, and 4.5% from other races. The median household income in the town was $37,500, and the median family income was $45,000. The per capita income in the town was $17,000.
History
The town of Bonney was founded in 1854, and was named after the local Bonney family. The town was originally a small farming community, and was home to a number of small businesses. In the early 1900s, the town began to experience a boom in oil production, which led to an influx of new residents and businesses. The town continued to grow throughout the 20th century, and today is a small but thriving community.
Bonney is a small town with a rich history and a bright future. The town is home to a diverse population, and is a great place to live and work. The town is home to a number of businesses, and is a great place to raise a family. The town is also home to a number of recreational activities, and is a great place to visit and explore.
Common Questions
What is Per Capita Income in Bonney?
Per Capita income in Bonney is $46,363.
What is the Median Household income in Bonney?
Median Household Income in Bonney is $89,167.
What is Inequality or Gini Index in Bonney?
Inequality or Gini Index in Bonney is 0.34.
What is the Total Population of Bonney?
Total Population of Bonney is 197.
What is the Total Male Population of Bonney?
Total Male Population of Bonney is 108.
What is the Total Female Population of Bonney?
Total Female Population of Bonney is 89.
What is the Ratio of Males per 100 Females in Bonney?
There are 121.35 Males per 100 Females in Bonney.
What is the Ratio of Females per 100 Males in Bonney?
There are 82.41 Females per 100 Males in Bonney.
What is the Median Population Age in Bonney?
Median Population Age in Bonney is 43.6 Years.
What is the Average Family Size in Bonney
Average Family Size in Bonney is 2.8 People.
What is the Average Household Size in Bonney
Average Household Size in Bonney is 2.4 People.
How Large is the Labor Force in Bonney?
There are 134 People in the Labor Forcein in Bonney.
What is the Percentage of People in the Labor Force in Bonney?
79.3% of People are in the Labor Force in Bonney.
What is the Unemployment Rate in Bonney?
Unemployment Rate in Bonney is 18.7%.