Zip Codes with the Highest Percentage of Population with a Degree in Liberal Arts and History in Magnolia, TX
RELATED REPORTS & OPTIONS
Liberal Arts and History
Magnolia
Compare Zip Codes
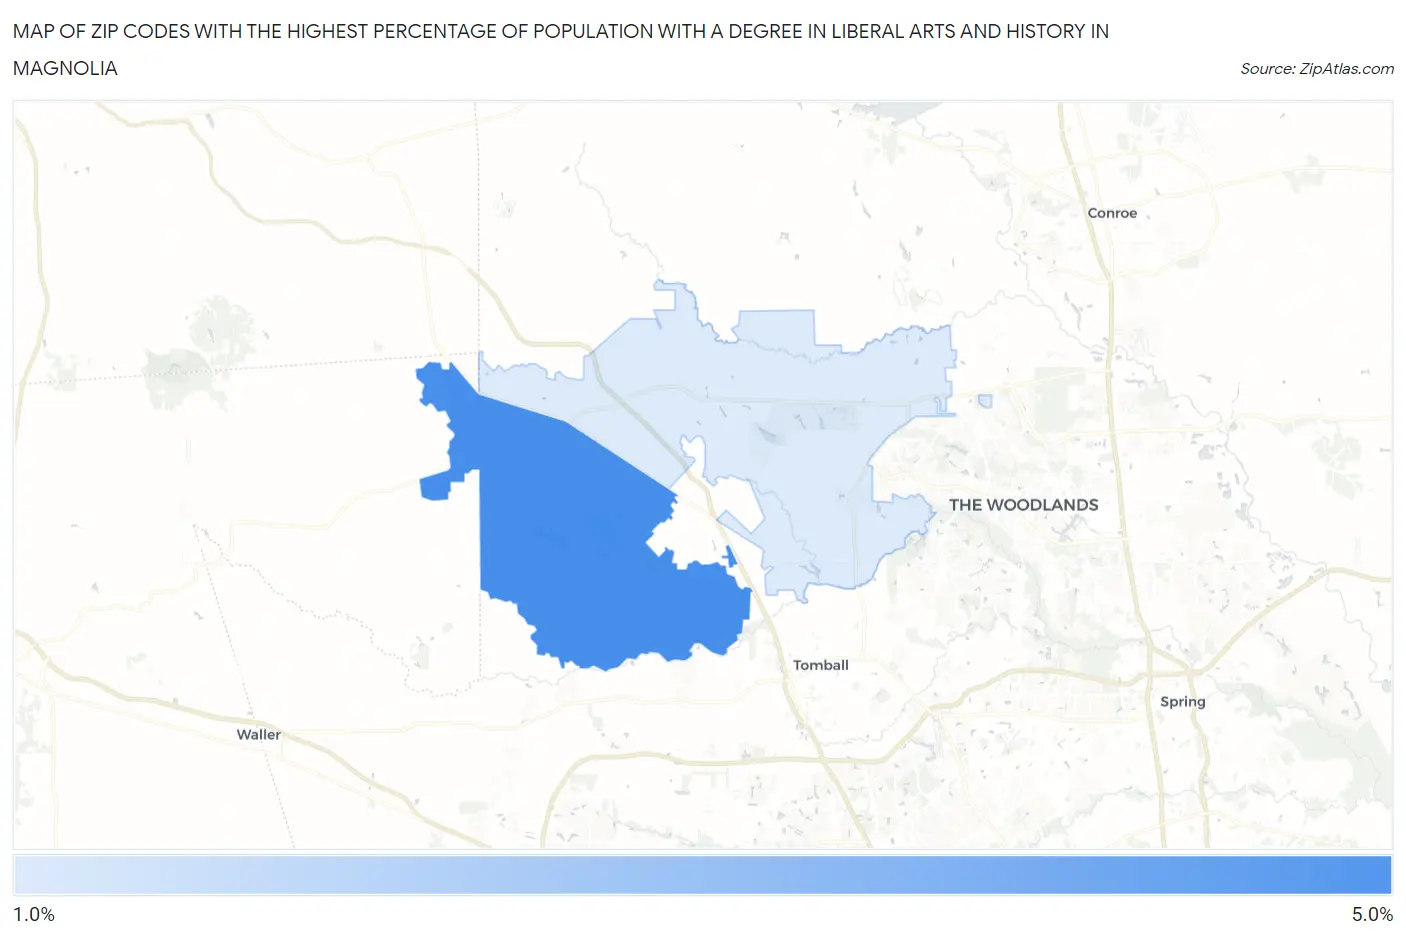
Map of Zip Codes with the Highest Percentage of Population with a Degree in Liberal Arts and History in Magnolia
1.5%
4.5%
Zip Codes with the Highest Percentage of Population with a Degree in Liberal Arts and History in Magnolia, TX
| Zip Code | % Graduates | vs State | vs National | |
| 1. | 77355 | 4.5% | 4.2%(+0.335)#673 | 4.9%(-0.386)#13,013 |
| 2. | 77354 | 1.5% | 4.2%(-2.68)#1,317 | 4.9%(-3.40)#22,548 |
1
Common Questions
What are the Top Zip Codes with the Highest Percentage of Population with a Degree in Liberal Arts and History in Magnolia, TX?
Top Zip Codes with the Highest Percentage of Population with a Degree in Liberal Arts and History in Magnolia, TX are:
What zip code has the Highest Percentage of Population with a Degree in Liberal Arts and History in Magnolia, TX?
77355 has the Highest Percentage of Population with a Degree in Liberal Arts and History in Magnolia, TX with 4.5%.
What is the Percentage of Population with a Degree in Liberal Arts and History in Magnolia, TX?
Percentage of Population with a Degree in Liberal Arts and History in Magnolia is 1.7%.
What is the Percentage of Population with a Degree in Liberal Arts and History in Texas?
Percentage of Population with a Degree in Liberal Arts and History in Texas is 4.2%.
What is the Percentage of Population with a Degree in Liberal Arts and History in the United States?
Percentage of Population with a Degree in Liberal Arts and History in the United States is 4.9%.