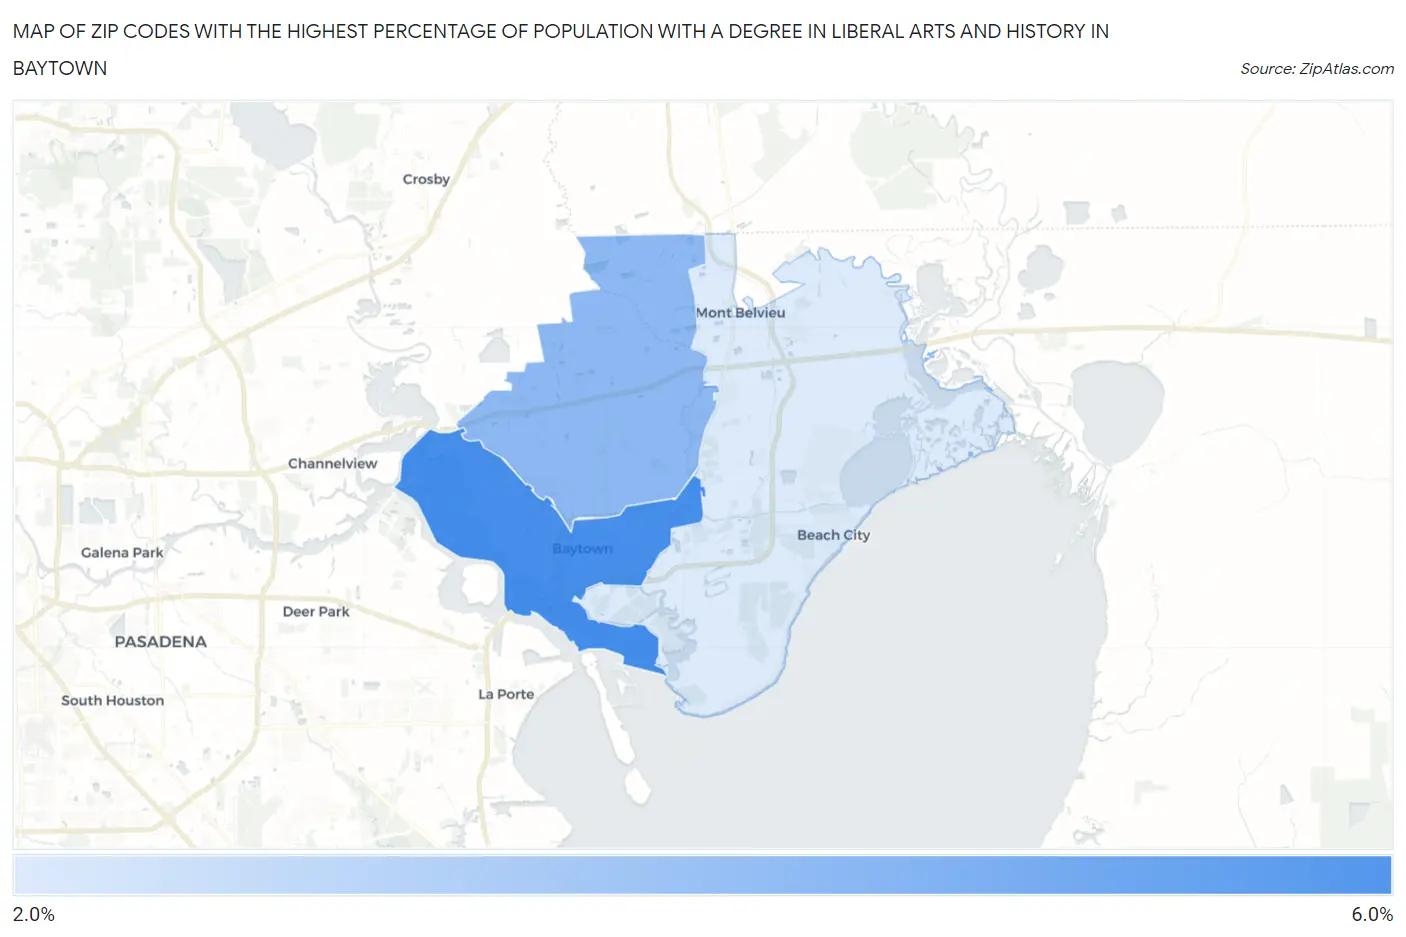
Zip Codes with the Highest Percentage of Population with a Degree in Liberal Arts and History in Baytown, TX
RELATED REPORTS & OPTIONS
Liberal Arts and History
Baytown
Compare Zip Codes
Map of Zip Codes with the Highest Percentage of Population with a Degree in Liberal Arts and History in Baytown
2.1%
5.9%
Zip Codes with the Highest Percentage of Population with a Degree in Liberal Arts and History in Baytown, TX
| Zip Code | % Graduates | vs State | vs National | |
| 1. | 77520 | 5.9% | 4.2%(+1.79)#430 | 4.9%(+1.06)#8,681 |
| 2. | 77521 | 4.2% | 4.2%(+0.003)#755 | 4.9%(-0.719)#14,200 |
| 3. | 77523 | 2.1% | 4.2%(-2.09)#1,233 | 4.9%(-2.81)#21,208 |
1
Common Questions
What are the Top Zip Codes with the Highest Percentage of Population with a Degree in Liberal Arts and History in Baytown, TX?
Top Zip Codes with the Highest Percentage of Population with a Degree in Liberal Arts and History in Baytown, TX are:
What zip code has the Highest Percentage of Population with a Degree in Liberal Arts and History in Baytown, TX?
77520 has the Highest Percentage of Population with a Degree in Liberal Arts and History in Baytown, TX with 5.9%.
What is the Percentage of Population with a Degree in Liberal Arts and History in Baytown, TX?
Percentage of Population with a Degree in Liberal Arts and History in Baytown is 5.6%.
What is the Percentage of Population with a Degree in Liberal Arts and History in Texas?
Percentage of Population with a Degree in Liberal Arts and History in Texas is 4.2%.
What is the Percentage of Population with a Degree in Liberal Arts and History in the United States?
Percentage of Population with a Degree in Liberal Arts and History in the United States is 4.9%.