Zip Codes with the Highest Percentage of Population with a Degree in Liberal Arts and History in Fort Worth, TX

RELATED REPORTS & OPTIONS

Liberal Arts and History
Population
Families and Households
Female Fertility
Female Fertility (Unmarried)
Race (Community Size)
Race (Percentage)
Ancestry (Community Size)
AfghanAfricanAlbanianAlsatianAmericanApacheArabArgentineanArmenianAustralianAustrianBahamianBangladeshiBarbadianBasqueBelgianBhutaneseBlackfeetBolivianBrazilianBritishBritish West IndianBulgarianBurmeseCajunCambodianCanadianCelticCentral AmericanCentral American IndianCherokeeCheyenneChickasawChileanChippewaChoctawColombianComancheCosta RicanCreekCroatianCrowCubanCzechCzechoslovakianDanishDelawareDominicanDutchDutch West IndianEastern EuropeanEcuadorianEgyptianEnglishEstonianEthiopianEuropeanFilipinoFinnishFrenchFrench American IndianFrench CanadianGermanGerman RussianGhanaianGreekGuamanian / ChamorroGuatemalanGuyaneseHaitianHonduranHopiHungarianIcelanderIndian (Asian)IndonesianInupiatIranianIraqiIrishIroquoisIsraeliItalianJamaicanJapaneseJordanianKenyanKiowaKoreanLaotianLatvianLebaneseLiberianLithuanianLuxembourgerMalaysianMalteseMexicanMexican American IndianMongolianMoroccanNative HawaiianNavajoNicaraguanNigerianNorthern EuropeanNorwegianOsageOttawaPakistaniPalestinianPanamanianPennsylvania GermanPeruvianPolishPortuguesePotawatomiPuebloPuerto RicanRomanianRussianSalvadoranSamoanScandinavianScotch-IrishScottishSerbianSiouxSlavicSlovakSloveneSomaliSouth AfricanSouth AmericanSouth American IndianSpaniardSpanishSpanish AmericanSpanish American IndianSri LankanSubsaharan AfricanSudaneseSwedishSwissSyrianThaiTonganTrinidadian and TobagonianTurkishUgandanUkrainianVenezuelanVietnameseWelshWest IndianYaquiYugoslavianZimbabwean
Ancestry (Percentage)
AfghanAfricanAlbanianAlsatianAmericanApacheArabArgentineanArmenianAustralianAustrianBahamianBangladeshiBarbadianBasqueBelgianBhutaneseBlackfeetBolivianBrazilianBritishBritish West IndianBulgarianBurmeseCajunCambodianCanadianCelticCentral AmericanCentral American IndianCherokeeCheyenneChickasawChileanChippewaChoctawColombianComancheCosta RicanCreekCroatianCrowCubanCzechCzechoslovakianDanishDelawareDominicanDutchDutch West IndianEastern EuropeanEcuadorianEgyptianEnglishEstonianEthiopianEuropeanFilipinoFinnishFrenchFrench American IndianFrench CanadianGermanGerman RussianGhanaianGreekGuamanian / ChamorroGuatemalanGuyaneseHaitianHonduranHopiHungarianIcelanderIndian (Asian)IndonesianInupiatIranianIraqiIrishIroquoisIsraeliItalianJamaicanJapaneseJordanianKenyanKiowaKoreanLaotianLatvianLebaneseLiberianLithuanianLuxembourgerMalaysianMalteseMexicanMexican American IndianMongolianMoroccanNative HawaiianNavajoNicaraguanNigerianNorthern EuropeanNorwegianOsageOttawaPakistaniPalestinianPanamanianPennsylvania GermanPeruvianPolishPortuguesePotawatomiPuebloPuerto RicanRomanianRussianSalvadoranSamoanScandinavianScotch-IrishScottishSerbianSiouxSlavicSlovakSloveneSomaliSouth AfricanSouth AmericanSouth American IndianSpaniardSpanishSpanish AmericanSpanish American IndianSri LankanSubsaharan AfricanSudaneseSwedishSwissSyrianThaiTonganTrinidadian and TobagonianTurkishUgandanUkrainianVenezuelanVietnameseWelshWest IndianYaquiYugoslavianZimbabwean
Immigrant Origin (Total)
AfghanistanAfricaAlbaniaArgentinaAsiaAustraliaBahamasBangladeshBarbadosBelarusBelizeBoliviaBosnia and HerzegovinaBrazilBulgariaBurma / MyanmarCambodiaCameroonCanadaCaribbeanCentral AmericaChileChinaColombiaCongoCosta RicaCroatiaCubaCzechoslovakiaDominican RepublicEastern AfricaEastern AsiaEastern EuropeEcuadorEgyptEl SalvadorEnglandEritreaEthiopiaEuropeFranceGermanyGhanaGreeceGuatemalaHaitiHondurasHong KongHungaryIndiaIndonesiaIranIraqIrelandIsraelItalyJamaicaJapanJordanKenyaKoreaLaosLatin AmericaLebanonLiberiaMalaysiaMexicoMicronesiaMiddle AfricaMoroccoNepalNetherlandsNicaraguaNigeriaNorthern AfricaNorthern EuropeOceaniaPakistanPanamaPeruPhilippinesPolandPortugalRomaniaRussiaScotlandSenegalSerbiaSomaliaSouth AfricaSouth AmericaSouth Central AsiaSouth Eastern AsiaSouthern EuropeSpainSri LankaSudanSwedenSwitzerlandSyriaTaiwanThailandTrinidad and TobagoTurkeyUgandaUkraineVenezuelaVietnamWestern AfricaWestern AsiaWestern EuropeZaireZimbabwe
Immigrant Origin (Percentage)
AfghanistanAfricaAlbaniaArgentinaAsiaAustraliaBahamasBangladeshBarbadosBelarusBelizeBoliviaBosnia and HerzegovinaBrazilBulgariaBurma / MyanmarCambodiaCameroonCanadaCaribbeanCentral AmericaChileChinaColombiaCongoCosta RicaCroatiaCubaCzechoslovakiaDominican RepublicEastern AfricaEastern AsiaEastern EuropeEcuadorEgyptEl SalvadorEnglandEritreaEthiopiaEuropeFranceGermanyGhanaGreeceGuatemalaHaitiHondurasHong KongHungaryIndiaIndonesiaIranIraqIrelandIsraelItalyJamaicaJapanJordanKenyaKoreaLaosLatin AmericaLebanonLiberiaMalaysiaMexicoMicronesiaMiddle AfricaMoroccoNepalNetherlandsNicaraguaNigeriaNorthern AfricaNorthern EuropeOceaniaPakistanPanamaPeruPhilippinesPolandPortugalRomaniaRussiaScotlandSenegalSerbiaSomaliaSouth AfricaSouth AmericaSouth Central AsiaSouth Eastern AsiaSouthern EuropeSpainSri LankaSudanSwedenSwitzerlandSyriaTaiwanThailandTrinidad and TobagoTurkeyUgandaUkraineVenezuelaVietnamWestern AfricaWestern AsiaWestern EuropeZaireZimbabwe
Income
Income (Families)
Income (Households)
Poverty
Poverty (Families)
Unemployment
Employment Occupations
Employment Industries
Employer Class
Commute Time
Commute Means
School Enrollment
Education by Degree Field
Occupancy
Finances
Physical Characteristics
Fort Worth
Compare Zip Codes
Comparison Subject

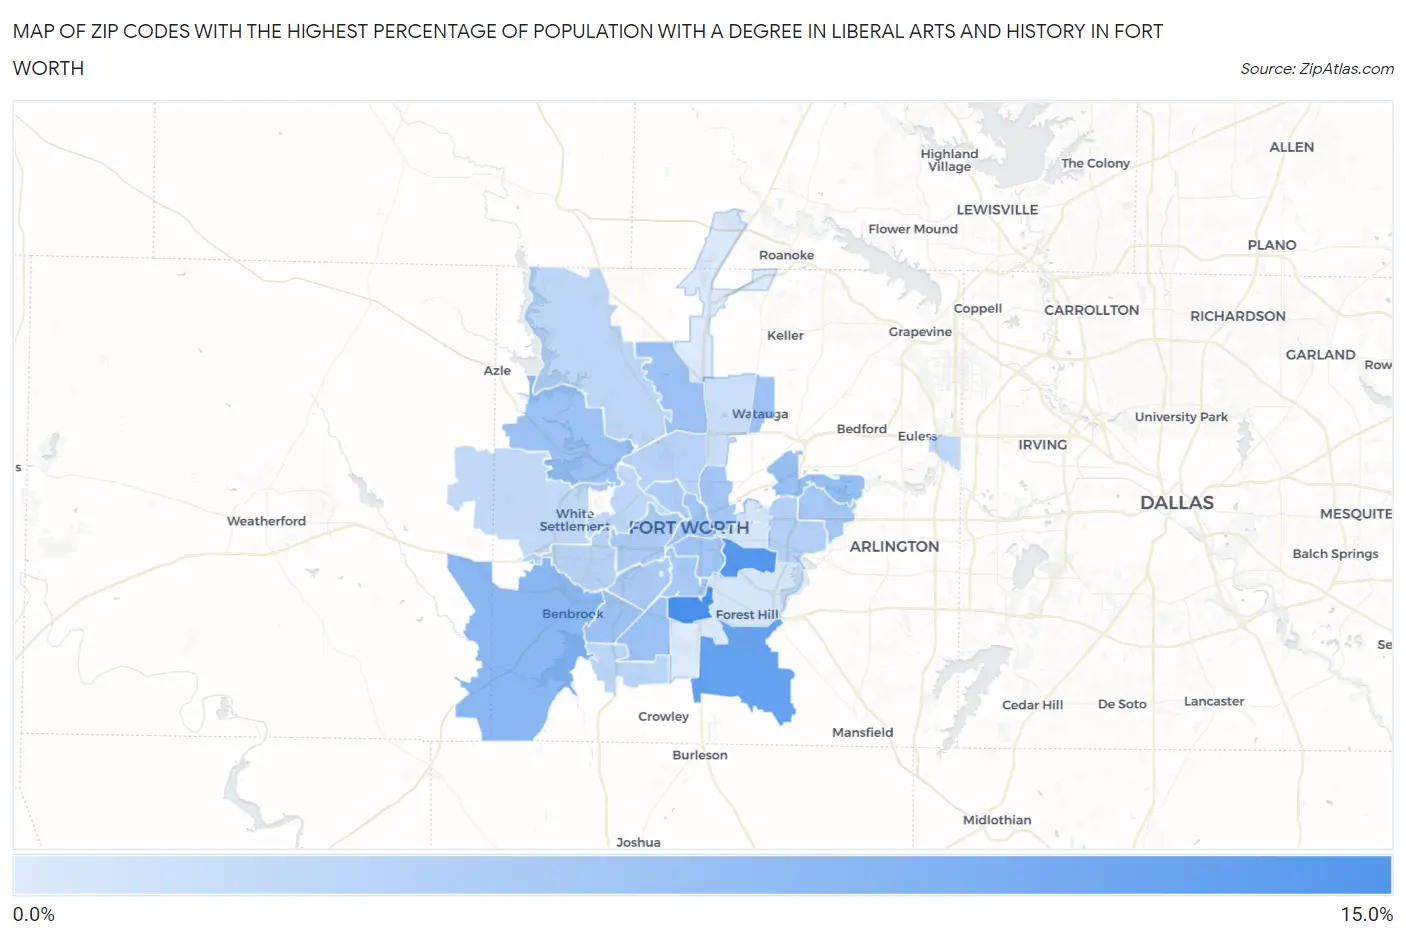
Map of Zip Codes with the Highest Percentage of Population with a Degree in Liberal Arts and History in Fort Worth

0.0%
15.0%
Zip Codes with the Highest Percentage of Population with a Degree in Liberal Arts and History in Fort Worth Map

Zip Codes with the Highest Percentage of Population with a Degree in Liberal Arts and History in Fort Worth, TX

Zip Code % Graduates vs State vs National
1.7611512.6%4.2%(+8.49)#934.9%(+7.76)#2,001
2.7610511.6%4.2%(+7.43)#1094.9%(+6.71)#2,338
3.7614010.3%4.2%(+6.13)#1484.9%(+5.41)#2,940
4.761267.6%4.2%(+3.41)#2714.9%(+2.69)#5,505
5.761186.6%4.2%(+2.42)#3604.9%(+1.69)#7,215
6.761316.4%4.2%(+2.22)#3764.9%(+1.50)#7,618
7.761356.3%4.2%(+2.16)#3874.9%(+1.44)#7,770
8.761336.2%4.2%(+2.09)#3974.9%(+1.37)#7,926
9.761486.2%4.2%(+2.09)#3984.9%(+1.37)#7,929
10.761326.2%4.2%(+2.05)#4024.9%(+1.33)#8,015
11.761045.9%4.2%(+1.76)#4384.9%(+1.04)#8,752
12.761025.8%4.2%(+1.69)#4504.9%(+0.964)#8,950
13.761115.7%4.2%(+1.51)#4714.9%(+0.790)#9,395
14.761105.6%4.2%(+1.42)#4854.9%(+0.701)#9,640
15.761205.6%4.2%(+1.41)#4874.9%(+0.685)#9,675
16.761095.3%4.2%(+1.10)#5324.9%(+0.380)#10,596
17.761075.2%4.2%(+1.01)#5414.9%(+0.292)#10,831
18.761645.0%4.2%(+0.838)#5694.9%(+0.117)#11,388
19.761124.5%4.2%(+0.388)#6564.9%(-0.333)#12,858
20.761064.2%4.2%(+0.032)#7404.9%(-0.689)#14,084
21.761164.2%4.2%(+0.022)#7474.9%(-0.699)#14,119
22.761234.1%4.2%(-0.090)#7714.9%(-0.812)#14,542
23.761793.9%4.2%(-0.204)#7964.9%(-0.925)#14,994
24.761553.8%4.2%(-0.393)#8384.9%(-1.11)#15,682
25.761143.7%4.2%(-0.433)#8444.9%(-1.15)#15,821
26.761083.5%4.2%(-0.679)#9124.9%(-1.40)#16,703
27.761372.8%4.2%(-1.34)#1,0584.9%(-2.06)#18,967
28.761032.1%4.2%(-2.09)#1,2324.9%(-2.81)#21,200
29.761192.1%4.2%(-2.10)#1,2374.9%(-2.82)#21,238
30.761771.6%4.2%(-2.56)#1,3024.9%(-3.29)#22,335
31.761341.6%4.2%(-2.57)#1,3034.9%(-3.29)#22,344

Common Questions

What are the Top 10 Zip Codes with the Highest Percentage of Population with a Degree in Liberal Arts and History in Fort Worth, TX?
Top 10 Zip Codes with the Highest Percentage of Population with a Degree in Liberal Arts and History in Fort Worth, TX are:
#1
12.6%
#2
11.6%
#3
10.3%
#4
7.6%
#5
6.6%
#6
6.4%
#7
6.3%
#8
6.2%
#9
6.2%
#10
6.2%
What zip code has the Highest Percentage of Population with a Degree in Liberal Arts and History in Fort Worth, TX?
76115 has the Highest Percentage of Population with a Degree in Liberal Arts and History in Fort Worth, TX with 12.6%.
What is the Percentage of Population with a Degree in Liberal Arts and History in Fort Worth, TX?
Percentage of Population with a Degree in Liberal Arts and History in Fort Worth is 4.9%.
What is the Percentage of Population with a Degree in Liberal Arts and History in Texas?
Percentage of Population with a Degree in Liberal Arts and History in Texas is 4.2%.
What is the Percentage of Population with a Degree in Liberal Arts and History in the United States?
Percentage of Population with a Degree in Liberal Arts and History in the United States is 4.9%.