Zip Codes with the Highest Percentage of Population with a Degree in Liberal Arts and History in Gatesville, TX
RELATED REPORTS & OPTIONS
Liberal Arts and History
Gatesville
Compare Zip Codes
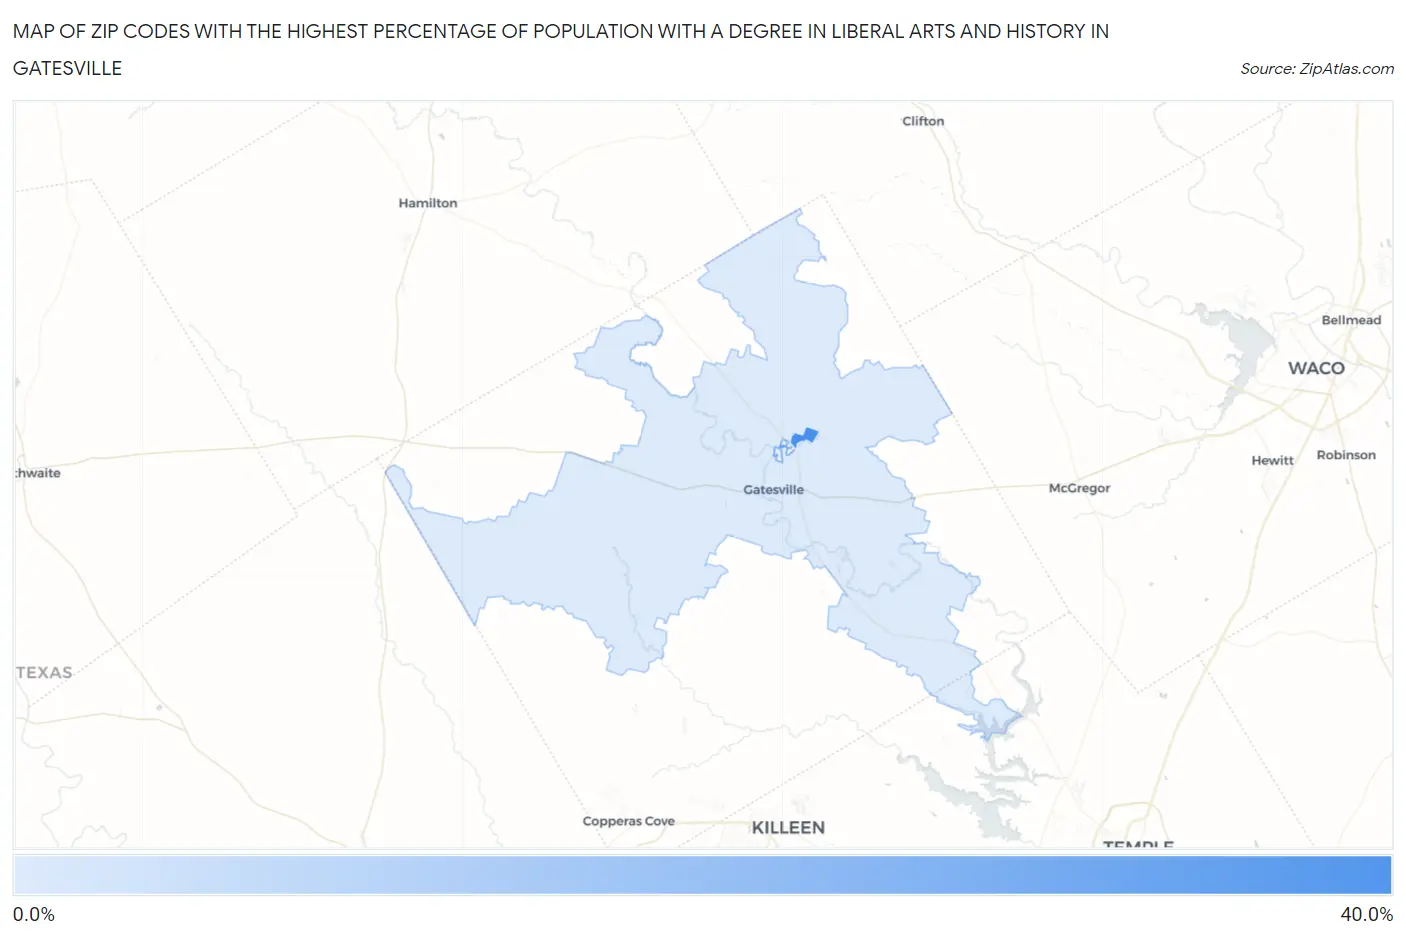
Map of Zip Codes with the Highest Percentage of Population with a Degree in Liberal Arts and History in Gatesville
3.6%
39.8%
Zip Codes with the Highest Percentage of Population with a Degree in Liberal Arts and History in Gatesville, TX
| Zip Code | % Graduates | vs State | vs National | |
| 1. | 76597 | 39.8% | 4.2%(+35.6)#12 | 4.9%(+34.9)#249 |
| 2. | 76528 | 3.6% | 4.2%(-0.552)#875 | 4.9%(-1.27)#16,256 |
1
Common Questions
What are the Top 3 Zip Codes with the Highest Percentage of Population with a Degree in Liberal Arts and History in Gatesville, TX?
Top 3 Zip Codes with the Highest Percentage of Population with a Degree in Liberal Arts and History in Gatesville, TX are:
What zip code has the Highest Percentage of Population with a Degree in Liberal Arts and History in Gatesville, TX?
76597 has the Highest Percentage of Population with a Degree in Liberal Arts and History in Gatesville, TX with 39.8%.
What is the Percentage of Population with a Degree in Liberal Arts and History in Gatesville, TX?
Percentage of Population with a Degree in Liberal Arts and History in Gatesville is 7.3%.
What is the Percentage of Population with a Degree in Liberal Arts and History in Texas?
Percentage of Population with a Degree in Liberal Arts and History in Texas is 4.2%.
What is the Percentage of Population with a Degree in Liberal Arts and History in the United States?
Percentage of Population with a Degree in Liberal Arts and History in the United States is 4.9%.