Zip Codes with the Highest Percentage of Population with a Degree in Liberal Arts and History in Beaumont, TX
RELATED REPORTS & OPTIONS
Liberal Arts and History
Beaumont
Compare Zip Codes
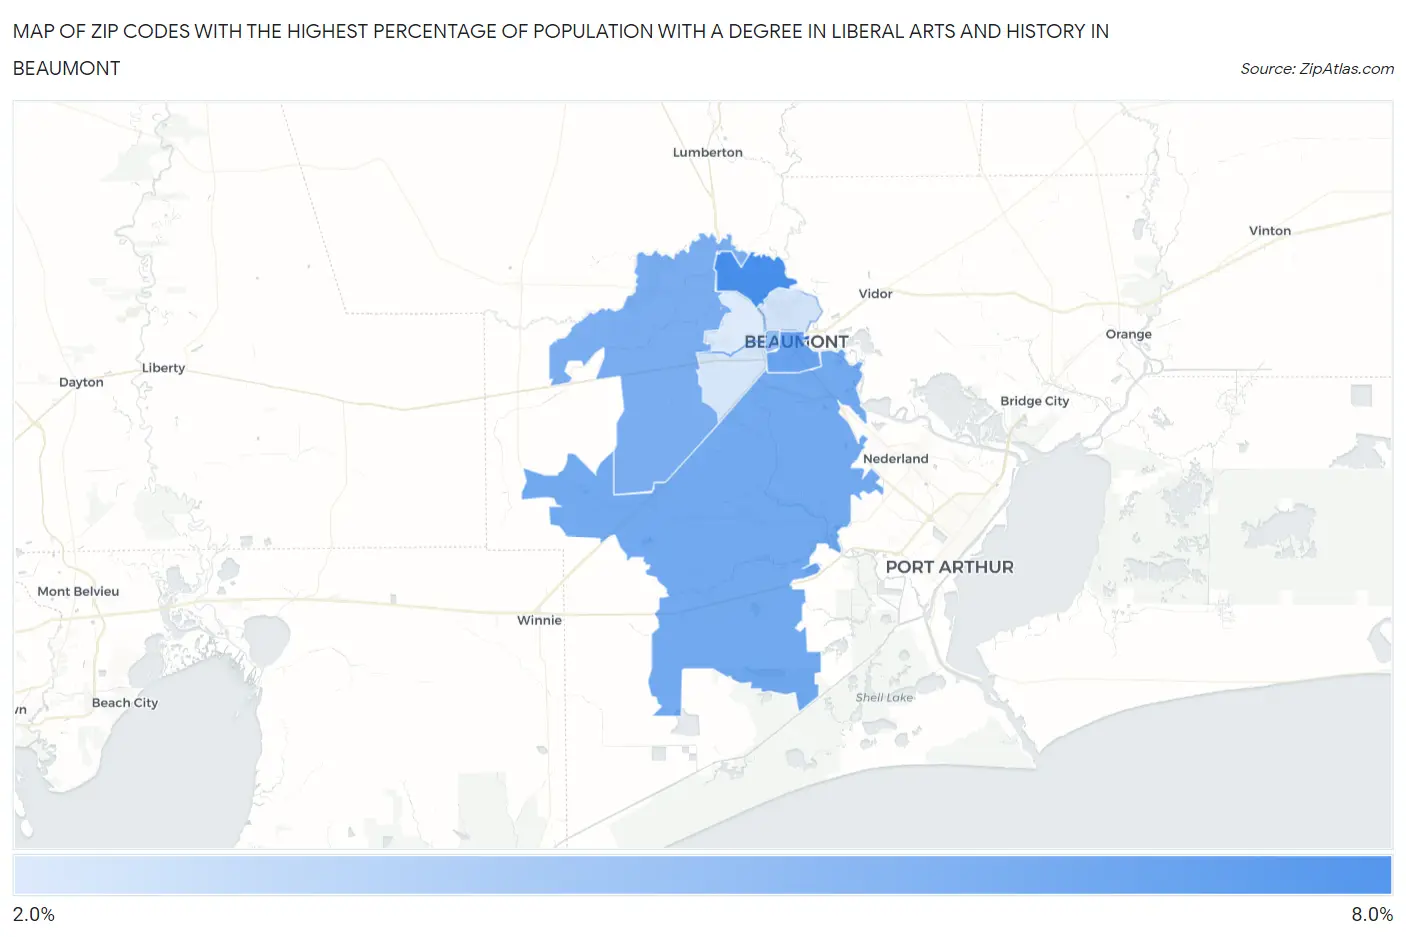
Map of Zip Codes with the Highest Percentage of Population with a Degree in Liberal Arts and History in Beaumont
2.4%
7.2%
Zip Codes with the Highest Percentage of Population with a Degree in Liberal Arts and History in Beaumont, TX
| Zip Code | % Graduates | vs State | vs National | |
| 1. | 77708 | 7.2% | 4.2%(+3.08)#295 | 4.9%(+2.35)#6,008 |
| 2. | 77701 | 6.2% | 4.2%(+2.04)#404 | 4.9%(+1.32)#8,043 |
| 3. | 77705 | 5.8% | 4.2%(+1.64)#458 | 4.9%(+0.916)#9,061 |
| 4. | 77713 | 5.6% | 4.2%(+1.44)#484 | 4.9%(+0.718)#9,593 |
| 5. | 77702 | 4.7% | 4.2%(+0.585)#626 | 4.9%(-0.137)#12,210 |
| 6. | 77703 | 2.7% | 4.2%(-1.44)#1,079 | 4.9%(-2.16)#19,282 |
| 7. | 77707 | 2.6% | 4.2%(-1.56)#1,113 | 4.9%(-2.29)#19,689 |
| 8. | 77706 | 2.4% | 4.2%(-1.79)#1,170 | 4.9%(-2.52)#20,389 |
1
Common Questions
What are the Top 5 Zip Codes with the Highest Percentage of Population with a Degree in Liberal Arts and History in Beaumont, TX?
Top 5 Zip Codes with the Highest Percentage of Population with a Degree in Liberal Arts and History in Beaumont, TX are:
What zip code has the Highest Percentage of Population with a Degree in Liberal Arts and History in Beaumont, TX?
77708 has the Highest Percentage of Population with a Degree in Liberal Arts and History in Beaumont, TX with 7.2%.
What is the Percentage of Population with a Degree in Liberal Arts and History in Beaumont, TX?
Percentage of Population with a Degree in Liberal Arts and History in Beaumont is 3.5%.
What is the Percentage of Population with a Degree in Liberal Arts and History in Texas?
Percentage of Population with a Degree in Liberal Arts and History in Texas is 4.2%.
What is the Percentage of Population with a Degree in Liberal Arts and History in the United States?
Percentage of Population with a Degree in Liberal Arts and History in the United States is 4.9%.