Zip Codes with the Highest Percentage of Population with a Degree in Liberal Arts and History in Henderson, TX
RELATED REPORTS & OPTIONS
Liberal Arts and History
Henderson
Compare Zip Codes
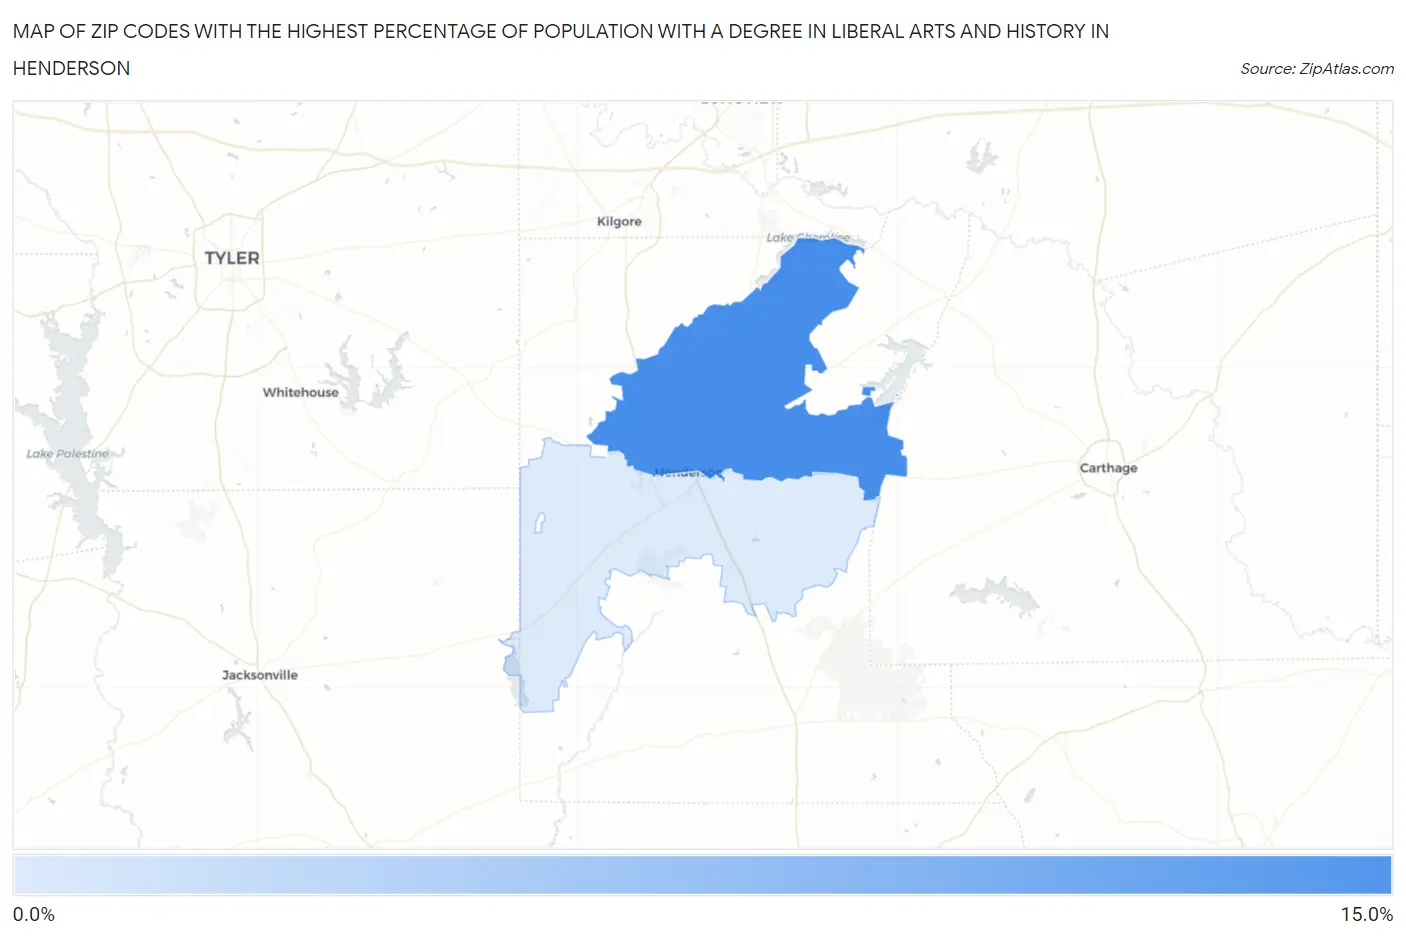
Map of Zip Codes with the Highest Percentage of Population with a Degree in Liberal Arts and History in Henderson
3.7%
13.8%
Zip Codes with the Highest Percentage of Population with a Degree in Liberal Arts and History in Henderson, TX
| Zip Code | % Graduates | vs State | vs National | |
| 1. | 75652 | 13.8% | 4.2%(+9.62)#81 | 4.9%(+8.89)#1,695 |
| 2. | 75654 | 3.7% | 4.2%(-0.475)#856 | 4.9%(-1.20)#15,980 |
1
Common Questions
What are the Top Zip Codes with the Highest Percentage of Population with a Degree in Liberal Arts and History in Henderson, TX?
Top Zip Codes with the Highest Percentage of Population with a Degree in Liberal Arts and History in Henderson, TX are:
What zip code has the Highest Percentage of Population with a Degree in Liberal Arts and History in Henderson, TX?
75652 has the Highest Percentage of Population with a Degree in Liberal Arts and History in Henderson, TX with 13.8%.
What is the Percentage of Population with a Degree in Liberal Arts and History in Henderson, TX?
Percentage of Population with a Degree in Liberal Arts and History in Henderson is 7.8%.
What is the Percentage of Population with a Degree in Liberal Arts and History in Texas?
Percentage of Population with a Degree in Liberal Arts and History in Texas is 4.2%.
What is the Percentage of Population with a Degree in Liberal Arts and History in the United States?
Percentage of Population with a Degree in Liberal Arts and History in the United States is 4.9%.