Zip Codes with the Highest Percentage of Population with a Degree in Liberal Arts and History in Hurst, TX
RELATED REPORTS & OPTIONS
Liberal Arts and History
Hurst
Compare Zip Codes
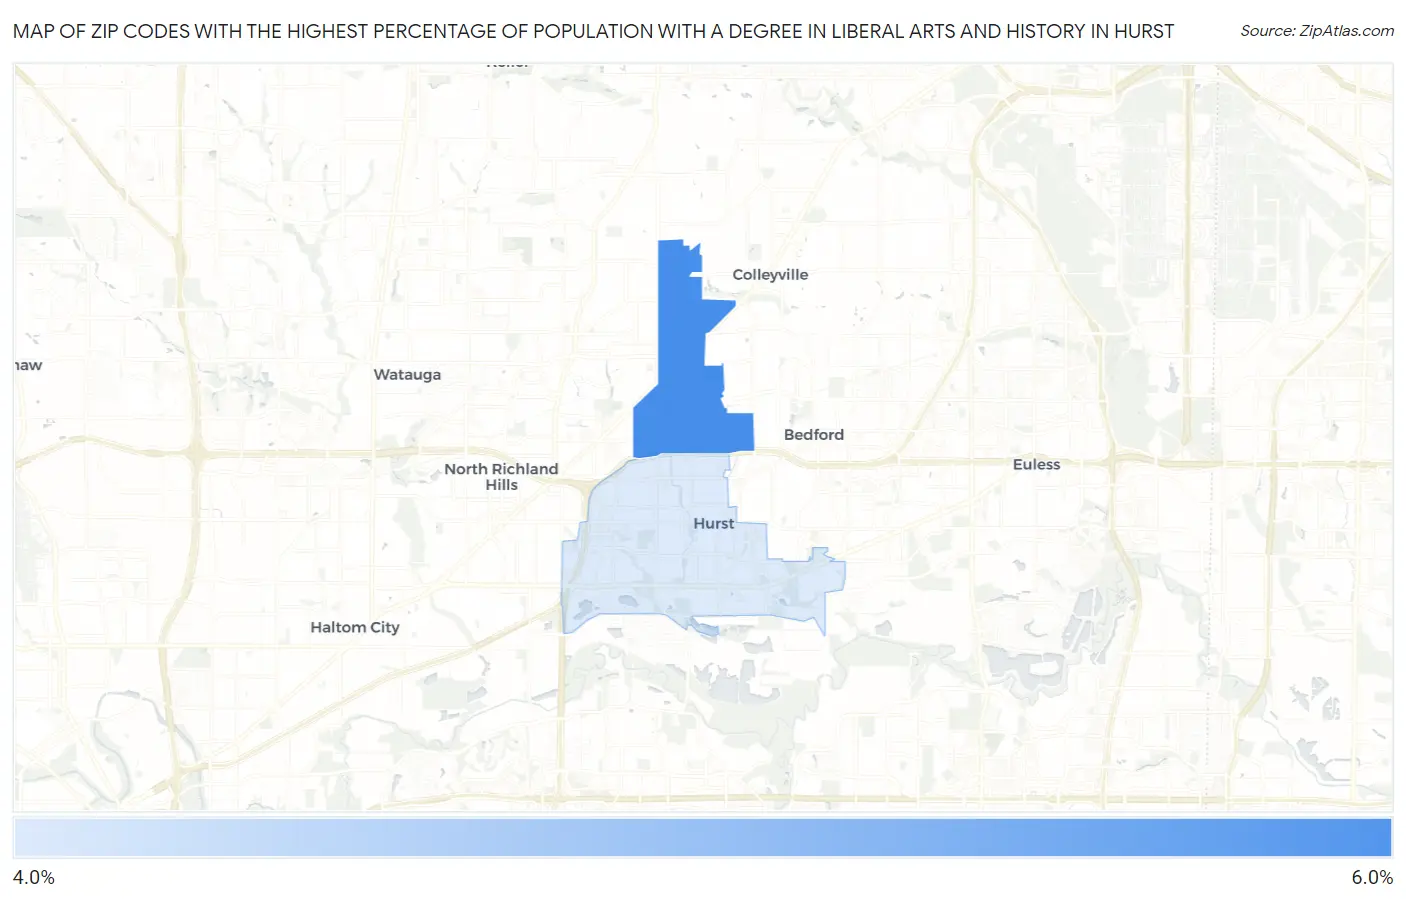
Map of Zip Codes with the Highest Percentage of Population with a Degree in Liberal Arts and History in Hurst
4.4%
5.5%
Zip Codes with the Highest Percentage of Population with a Degree in Liberal Arts and History in Hurst, TX
| Zip Code | % Graduates | vs State | vs National | |
| 1. | 76054 | 5.5% | 4.2%(+1.33)#502 | 4.9%(+0.608)#9,919 |
| 2. | 76053 | 4.4% | 4.2%(+0.222)#693 | 4.9%(-0.499)#13,384 |
1
Common Questions
What are the Top Zip Codes with the Highest Percentage of Population with a Degree in Liberal Arts and History in Hurst, TX?
Top Zip Codes with the Highest Percentage of Population with a Degree in Liberal Arts and History in Hurst, TX are:
What zip code has the Highest Percentage of Population with a Degree in Liberal Arts and History in Hurst, TX?
76054 has the Highest Percentage of Population with a Degree in Liberal Arts and History in Hurst, TX with 5.5%.
What is the Percentage of Population with a Degree in Liberal Arts and History in Hurst, TX?
Percentage of Population with a Degree in Liberal Arts and History in Hurst is 3.9%.
What is the Percentage of Population with a Degree in Liberal Arts and History in Texas?
Percentage of Population with a Degree in Liberal Arts and History in Texas is 4.2%.
What is the Percentage of Population with a Degree in Liberal Arts and History in the United States?
Percentage of Population with a Degree in Liberal Arts and History in the United States is 4.9%.