Zip Codes with the Highest Percentage of Population with a Degree in Liberal Arts and History in Tyler, TX
RELATED REPORTS & OPTIONS
Liberal Arts and History
Tyler
Compare Zip Codes
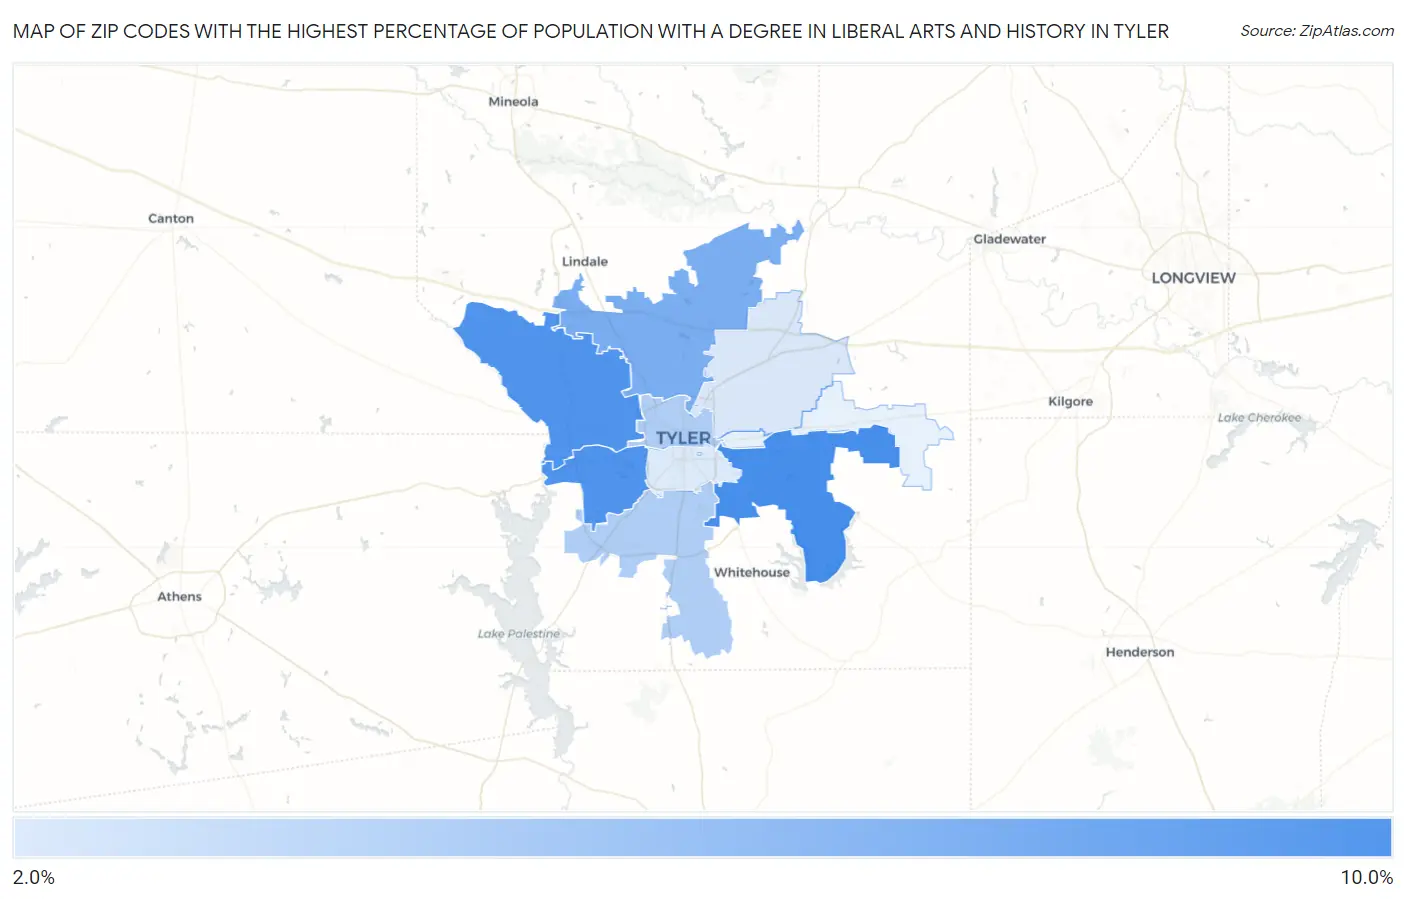
Map of Zip Codes with the Highest Percentage of Population with a Degree in Liberal Arts and History in Tyler
2.6%
8.1%
Zip Codes with the Highest Percentage of Population with a Degree in Liberal Arts and History in Tyler, TX
| Zip Code | % Graduates | vs State | vs National | |
| 1. | 75707 | 8.1% | 4.2%(+3.93)#232 | 4.9%(+3.21)#4,802 |
| 2. | 75709 | 7.8% | 4.2%(+3.69)#250 | 4.9%(+2.97)#5,102 |
| 3. | 75704 | 7.8% | 4.2%(+3.69)#251 | 4.9%(+2.97)#5,110 |
| 4. | 75706 | 6.2% | 4.2%(+2.03)#408 | 4.9%(+1.31)#8,072 |
| 5. | 75703 | 4.3% | 4.2%(+0.131)#712 | 4.9%(-0.590)#13,704 |
| 6. | 75702 | 4.2% | 4.2%(+0.067)#726 | 4.9%(-0.655)#13,942 |
| 7. | 75708 | 2.8% | 4.2%(-1.38)#1,065 | 4.9%(-2.10)#19,096 |
| 8. | 75701 | 2.6% | 4.2%(-1.55)#1,106 | 4.9%(-2.27)#19,659 |
1
Common Questions
What are the Top 5 Zip Codes with the Highest Percentage of Population with a Degree in Liberal Arts and History in Tyler, TX?
Top 5 Zip Codes with the Highest Percentage of Population with a Degree in Liberal Arts and History in Tyler, TX are:
What zip code has the Highest Percentage of Population with a Degree in Liberal Arts and History in Tyler, TX?
75707 has the Highest Percentage of Population with a Degree in Liberal Arts and History in Tyler, TX with 8.1%.
What is the Percentage of Population with a Degree in Liberal Arts and History in Tyler, TX?
Percentage of Population with a Degree in Liberal Arts and History in Tyler is 4.5%.
What is the Percentage of Population with a Degree in Liberal Arts and History in Texas?
Percentage of Population with a Degree in Liberal Arts and History in Texas is 4.2%.
What is the Percentage of Population with a Degree in Liberal Arts and History in the United States?
Percentage of Population with a Degree in Liberal Arts and History in the United States is 4.9%.