Zip Codes with the Highest Percentage of Population with a Degree in Liberal Arts and History in Denton, TX
RELATED REPORTS & OPTIONS
Liberal Arts and History
Denton
Compare Zip Codes
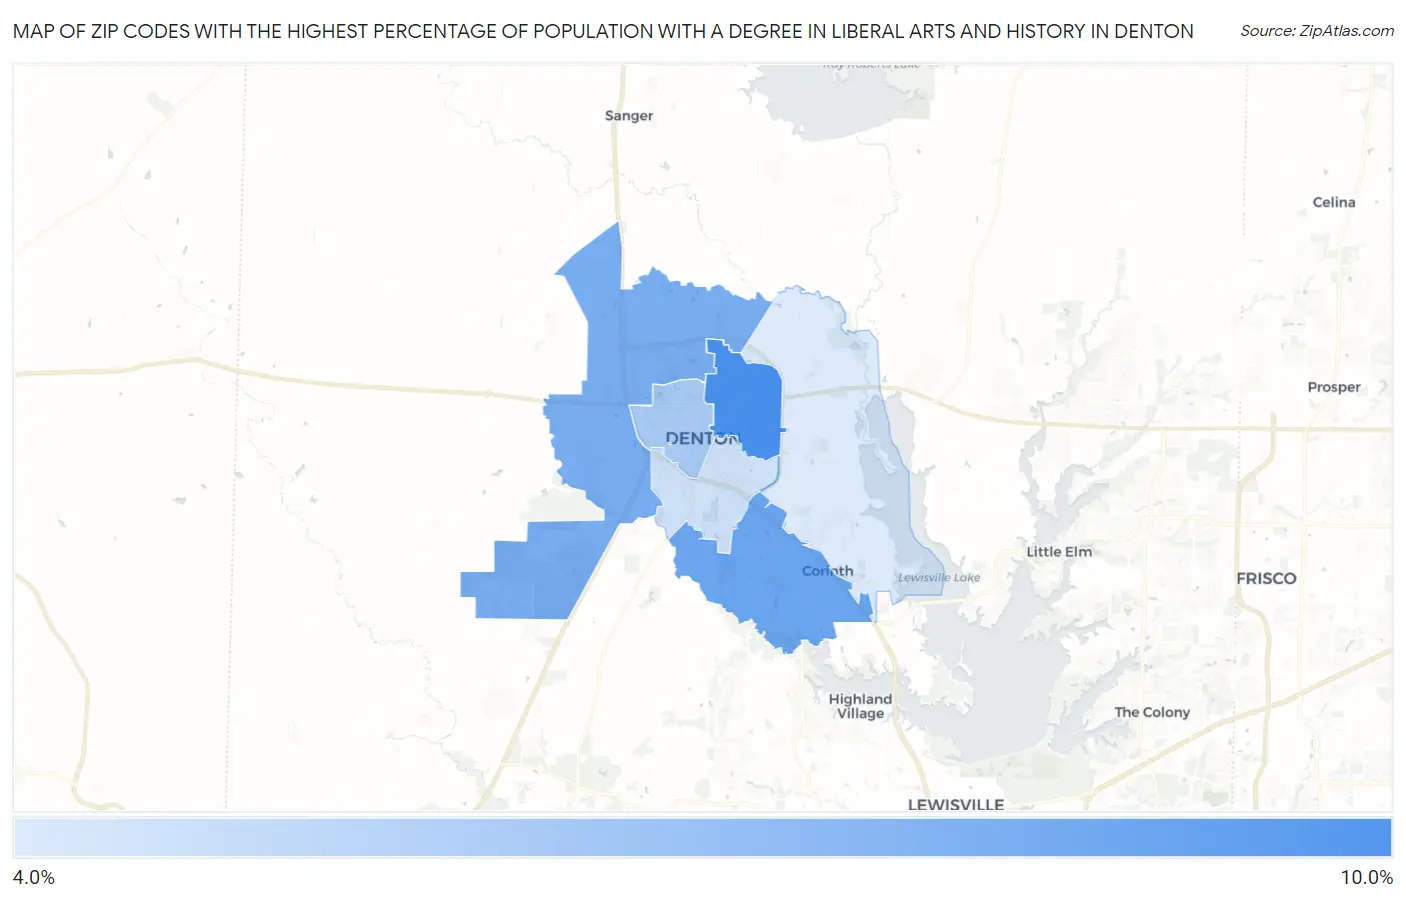
Map of Zip Codes with the Highest Percentage of Population with a Degree in Liberal Arts and History in Denton
4.6%
8.9%
Zip Codes with the Highest Percentage of Population with a Degree in Liberal Arts and History in Denton, TX
| Zip Code | % Graduates | vs State | vs National | |
| 1. | 76209 | 8.9% | 4.2%(+4.75)#191 | 4.9%(+4.03)#3,935 |
| 2. | 76210 | 7.8% | 4.2%(+3.64)#260 | 4.9%(+2.92)#5,180 |
| 3. | 76207 | 7.5% | 4.2%(+3.35)#273 | 4.9%(+2.63)#5,578 |
| 4. | 76201 | 6.1% | 4.2%(+1.96)#413 | 4.9%(+1.24)#8,227 |
| 5. | 76205 | 5.0% | 4.2%(+0.864)#564 | 4.9%(+0.143)#11,294 |
| 6. | 76208 | 4.6% | 4.2%(+0.441)#645 | 4.9%(-0.280)#12,663 |
1
Common Questions
What are the Top 5 Zip Codes with the Highest Percentage of Population with a Degree in Liberal Arts and History in Denton, TX?
Top 5 Zip Codes with the Highest Percentage of Population with a Degree in Liberal Arts and History in Denton, TX are:
What zip code has the Highest Percentage of Population with a Degree in Liberal Arts and History in Denton, TX?
76209 has the Highest Percentage of Population with a Degree in Liberal Arts and History in Denton, TX with 8.9%.
What is the Percentage of Population with a Degree in Liberal Arts and History in Denton, TX?
Percentage of Population with a Degree in Liberal Arts and History in Denton is 6.3%.
What is the Percentage of Population with a Degree in Liberal Arts and History in Texas?
Percentage of Population with a Degree in Liberal Arts and History in Texas is 4.2%.
What is the Percentage of Population with a Degree in Liberal Arts and History in the United States?
Percentage of Population with a Degree in Liberal Arts and History in the United States is 4.9%.