Cienegas Terrace, TX Map & Demographics
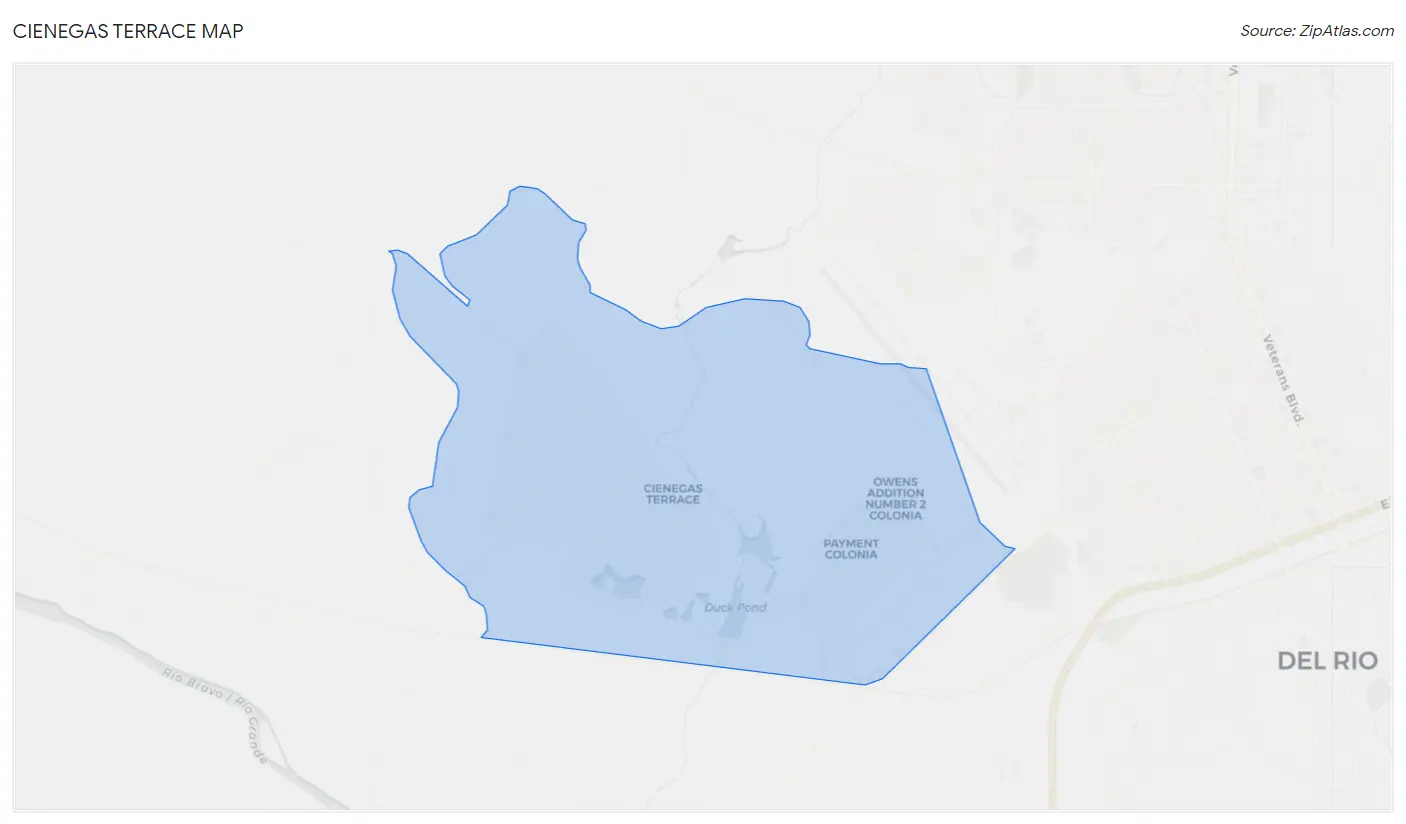
Cienegas Terrace Map
Cienegas Terrace Overview
$19,260
PER CAPITA INCOME
$53,235
AVG FAMILY INCOME
$39,418
AVG HOUSEHOLD INCOME
54.7%
WAGE / INCOME GAP [ % ]
45.3¢/ $1
WAGE / INCOME GAP [ $ ]
0.35
INEQUALITY / GINI INDEX
1,653
TOTAL POPULATION
933
MALE POPULATION
720
FEMALE POPULATION
129.58
MALES / 100 FEMALES
77.17
FEMALES / 100 MALES
46.2
MEDIAN AGE
2.9
AVG FAMILY SIZE
2.8
AVG HOUSEHOLD SIZE
763
LABOR FORCE [ PEOPLE ]
56.8%
PERCENT IN LABOR FORCE
2.7%
UNEMPLOYMENT RATE
Income in Cienegas Terrace
Income Overview in Cienegas Terrace
Per Capita Income in Cienegas Terrace is $19,260, while median incomes of families and households are $53,235 and $39,418 respectively.
| Characteristic | Number | Measure |
| Per Capita Income | 1,653 | $19,260 |
| Median Family Income | 548 | $53,235 |
| Mean Family Income | 548 | $58,771 |
| Median Household Income | 595 | $39,418 |
| Mean Household Income | 595 | $56,345 |
| Income Deficit | 548 | $0 |
| Wage / Income Gap (%) | 1,653 | 54.71% |
| Wage / Income Gap ($) | 1,653 | 45.29¢ per $1 |
| Gini / Inequality Index | 1,653 | 0.35 |
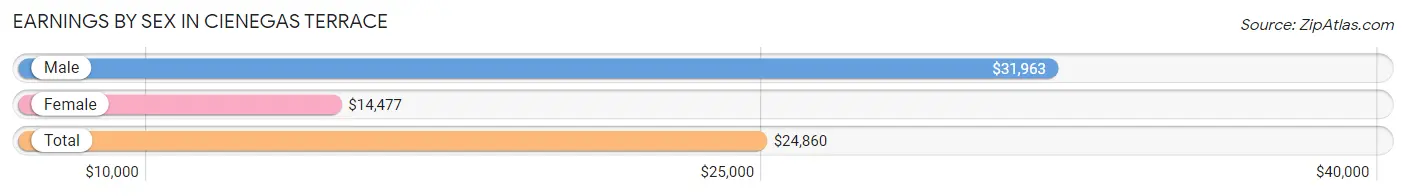
Earnings by Sex in Cienegas Terrace
Average Earnings in Cienegas Terrace are $24,860, $31,963 for men and $14,477 for women, a difference of 54.7%.
| Sex | Number | Average Earnings |
| Male | 386 (46.8%) | $31,963 |
| Female | 438 (53.2%) | $14,477 |
| Total | 824 (100.0%) | $24,860 |
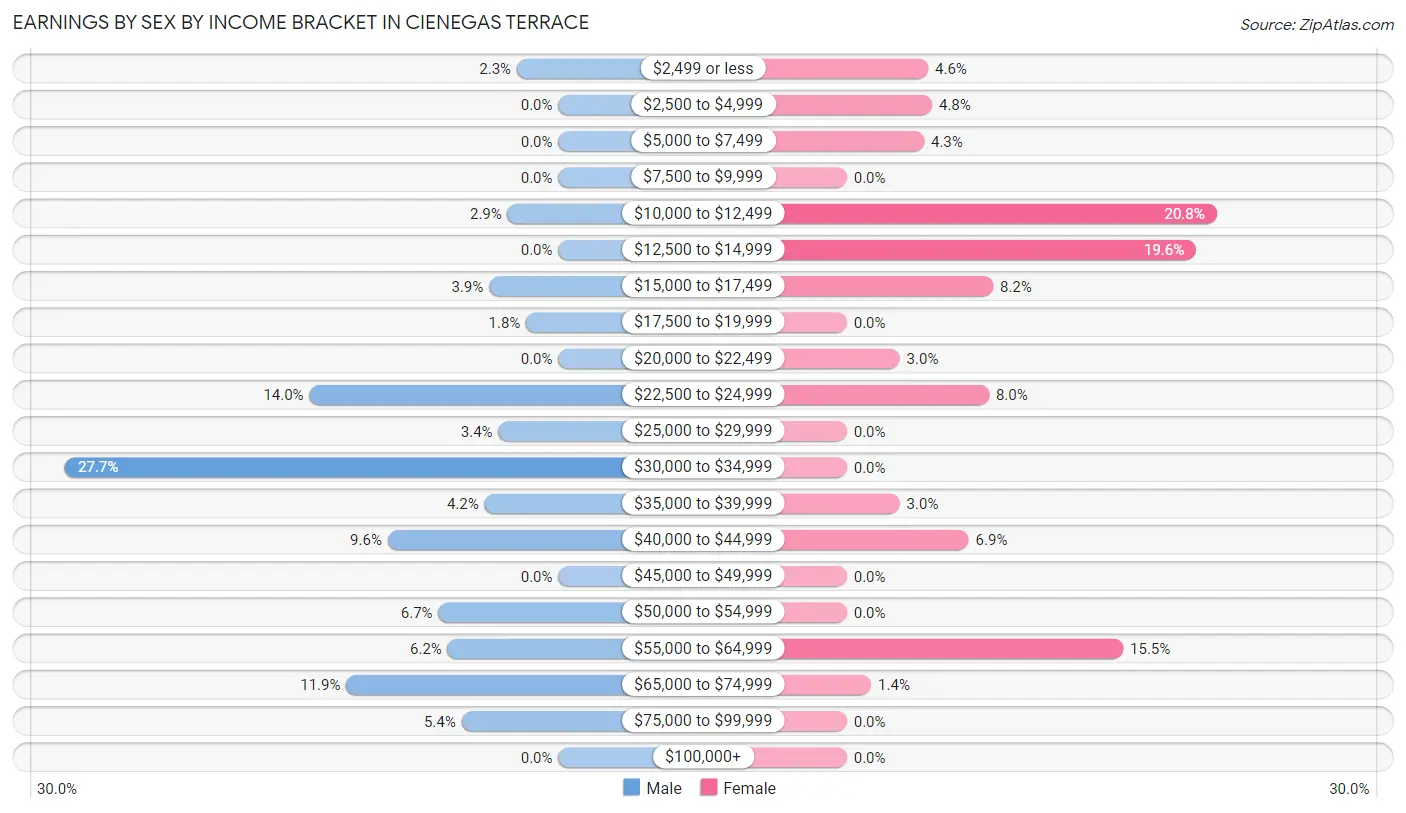
Earnings by Sex by Income Bracket in Cienegas Terrace
The most common earnings brackets in Cienegas Terrace are $30,000 to $34,999 for men (107 | 27.7%) and $10,000 to $12,499 for women (91 | 20.8%).
| Income | Male | Female |
| $2,499 or less | 9 (2.3%) | 20 (4.6%) |
| $2,500 to $4,999 | 0 (0.0%) | 21 (4.8%) |
| $5,000 to $7,499 | 0 (0.0%) | 19 (4.3%) |
| $7,500 to $9,999 | 0 (0.0%) | 0 (0.0%) |
| $10,000 to $12,499 | 11 (2.9%) | 91 (20.8%) |
| $12,500 to $14,999 | 0 (0.0%) | 86 (19.6%) |
| $15,000 to $17,499 | 15 (3.9%) | 36 (8.2%) |
| $17,500 to $19,999 | 7 (1.8%) | 0 (0.0%) |
| $20,000 to $22,499 | 0 (0.0%) | 13 (3.0%) |
| $22,500 to $24,999 | 54 (14.0%) | 35 (8.0%) |
| $25,000 to $29,999 | 13 (3.4%) | 0 (0.0%) |
| $30,000 to $34,999 | 107 (27.7%) | 0 (0.0%) |
| $35,000 to $39,999 | 16 (4.2%) | 13 (3.0%) |
| $40,000 to $44,999 | 37 (9.6%) | 30 (6.9%) |
| $45,000 to $49,999 | 0 (0.0%) | 0 (0.0%) |
| $50,000 to $54,999 | 26 (6.7%) | 0 (0.0%) |
| $55,000 to $64,999 | 24 (6.2%) | 68 (15.5%) |
| $65,000 to $74,999 | 46 (11.9%) | 6 (1.4%) |
| $75,000 to $99,999 | 21 (5.4%) | 0 (0.0%) |
| $100,000+ | 0 (0.0%) | 0 (0.0%) |
| Total | 386 (100.0%) | 438 (100.0%) |
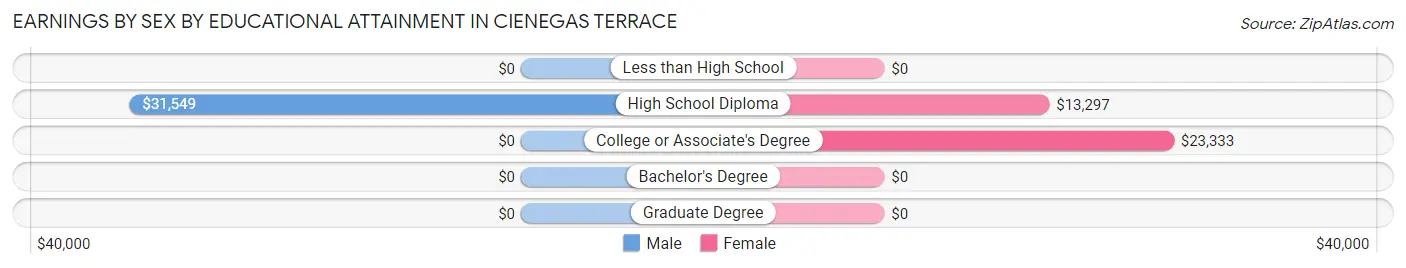
Earnings by Sex by Educational Attainment in Cienegas Terrace
Average earnings in Cienegas Terrace are $31,882 for men and $15,590 for women, a difference of 51.1%. Men with an educational attainment of high school diploma enjoy the highest average annual earnings of $31,549, while those with high school diploma education earn the least with $31,549. Women with an educational attainment of college or associate's degree earn the most with the average annual earnings of $23,333, while those with high school diploma education have the smallest earnings of $13,297.
| Educational Attainment | Male Income | Female Income |
| Less than High School | - | - |
| High School Diploma | $31,549 | $13,297 |
| College or Associate's Degree | - | - |
| Bachelor's Degree | - | - |
| Graduate Degree | - | - |
| Total | $31,882 | $15,590 |
Family Income in Cienegas Terrace
Family Income Brackets in Cienegas Terrace
According to the Cienegas Terrace family income data, there are 140 families falling into the $50,000 to $74,999 income range, which is the most common income bracket and makes up 25.6% of all families.
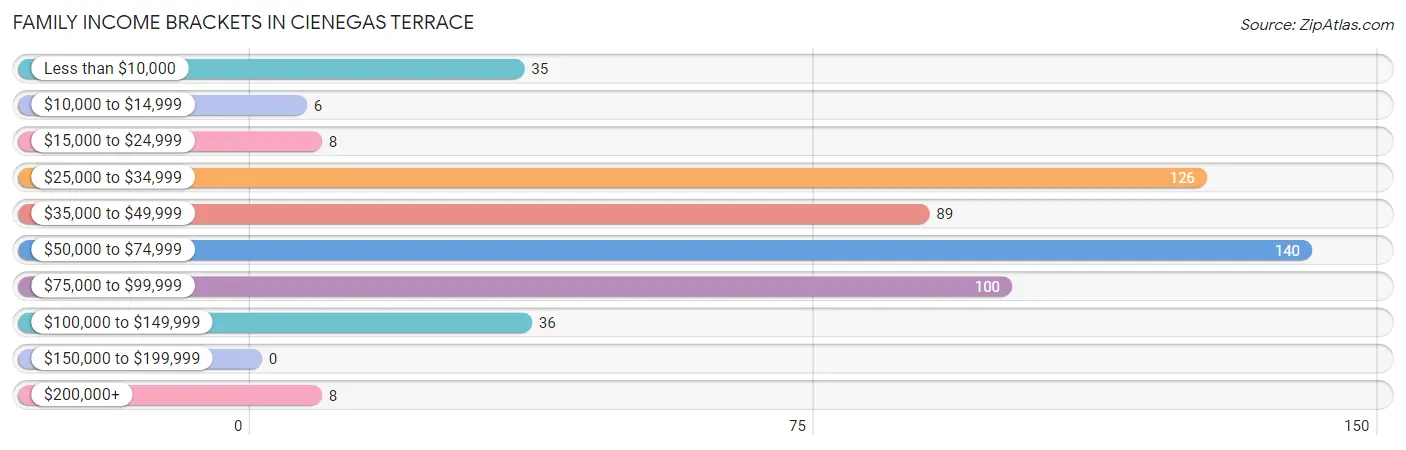
| Income Bracket | # Families | % Families |
| Less than $10,000 | 35 | 6.4% |
| $10,000 to $14,999 | 6 | 1.1% |
| $15,000 to $24,999 | 8 | 1.5% |
| $25,000 to $34,999 | 126 | 23.0% |
| $35,000 to $49,999 | 89 | 16.2% |
| $50,000 to $74,999 | 140 | 25.5% |
| $75,000 to $99,999 | 100 | 18.2% |
| $100,000 to $149,999 | 36 | 6.6% |
| $150,000 to $199,999 | 0 | 0.0% |
| $200,000+ | 8 | 1.5% |
Family Income by Famaliy Size in Cienegas Terrace
4-person families (98 | 17.9%) account for the highest median family income in Cienegas Terrace with $78,542 per family, while 4-person families (98 | 17.9%) have the highest median income of $19,636 per family member.
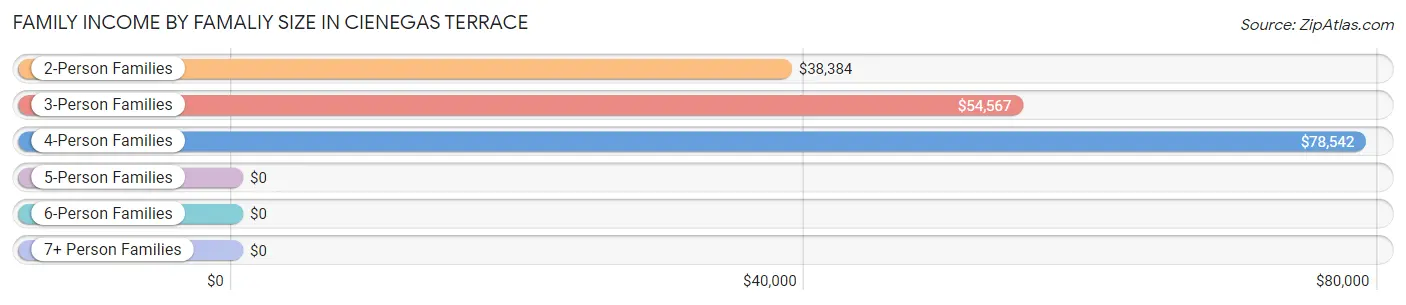
| Income Bracket | # Families | Median Income |
| 2-Person Families | 215 (39.2%) | $38,384 |
| 3-Person Families | 177 (32.3%) | $54,567 |
| 4-Person Families | 98 (17.9%) | $78,542 |
| 5-Person Families | 58 (10.6%) | $0 |
| 6-Person Families | 0 (0.0%) | $0 |
| 7+ Person Families | 0 (0.0%) | $0 |
| Total | 548 (100.0%) | $53,235 |
Family Income by Number of Earners in Cienegas Terrace
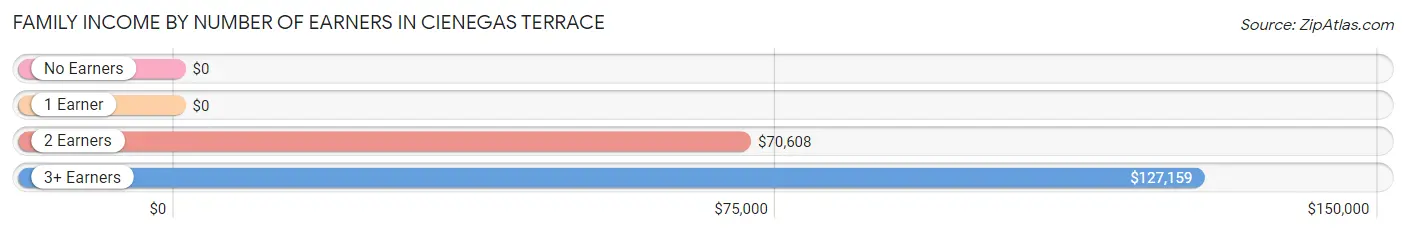
| Number of Earners | # Families | Median Income |
| No Earners | 28 (5.1%) | $0 |
| 1 Earner | 243 (44.3%) | $0 |
| 2 Earners | 224 (40.9%) | $70,608 |
| 3+ Earners | 53 (9.7%) | $127,159 |
| Total | 548 (100.0%) | $53,235 |
Household Income in Cienegas Terrace
Household Income Brackets in Cienegas Terrace
With 140 households falling in the category, the $50,000 to $74,999 income range is the most frequent in Cienegas Terrace, accounting for 23.5% of all households.
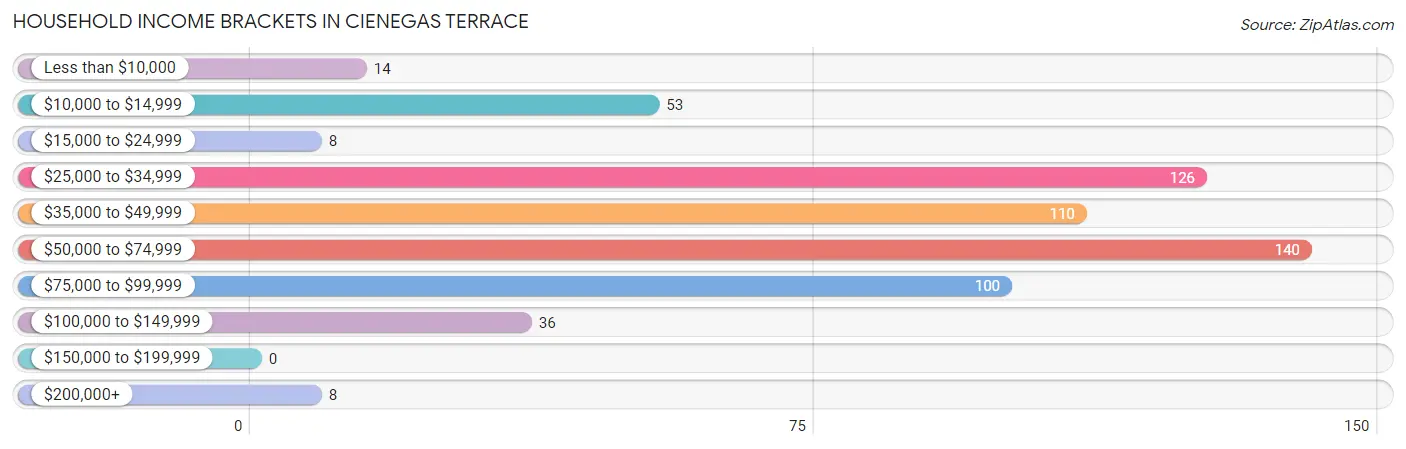
| Income Bracket | # Households | % Households |
| Less than $10,000 | 14 | 2.4% |
| $10,000 to $14,999 | 53 | 8.9% |
| $15,000 to $24,999 | 8 | 1.3% |
| $25,000 to $34,999 | 126 | 21.2% |
| $35,000 to $49,999 | 110 | 18.5% |
| $50,000 to $74,999 | 140 | 23.5% |
| $75,000 to $99,999 | 100 | 16.8% |
| $100,000 to $149,999 | 36 | 6.1% |
| $150,000 to $199,999 | 0 | 0.0% |
| $200,000+ | 8 | 1.3% |
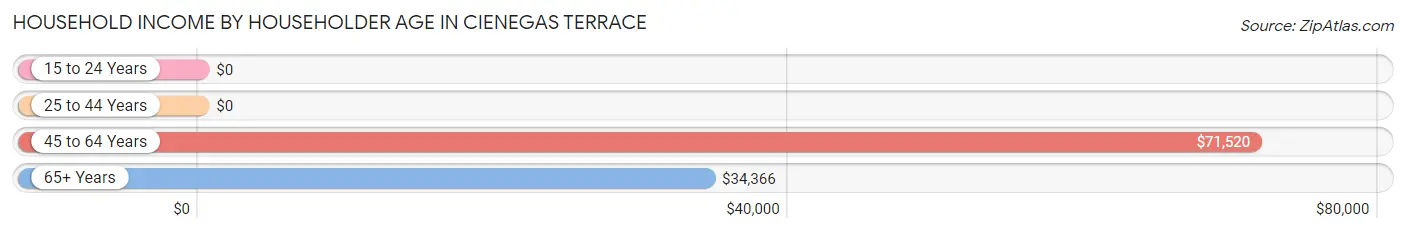
Household Income by Householder Age in Cienegas Terrace
The median household income in Cienegas Terrace is $39,418, with the highest median household income of $71,520 found in the 45 to 64 years age bracket for the primary householder. A total of 249 households (41.8%) fall into this category. Meanwhile, the 15 to 24 years age bracket for the primary householder has the lowest median household income of $0, with 26 households (4.4%) in this group.
| Income Bracket | # Households | Median Income |
| 15 to 24 Years | 26 (4.4%) | $0 |
| 25 to 44 Years | 70 (11.8%) | $0 |
| 45 to 64 Years | 249 (41.8%) | $71,520 |
| 65+ Years | 250 (42.0%) | $34,366 |
| Total | 595 (100.0%) | $39,418 |
Poverty in Cienegas Terrace
Income Below Poverty by Sex and Age in Cienegas Terrace
With 10.3% poverty level for males and 10.8% for females among the residents of Cienegas Terrace, 12 to 14 year old males and 75 year old and over females are the most vulnerable to poverty, with 31 males (56.4%) and 8 females (100.0%) in their respective age groups living below the poverty level.
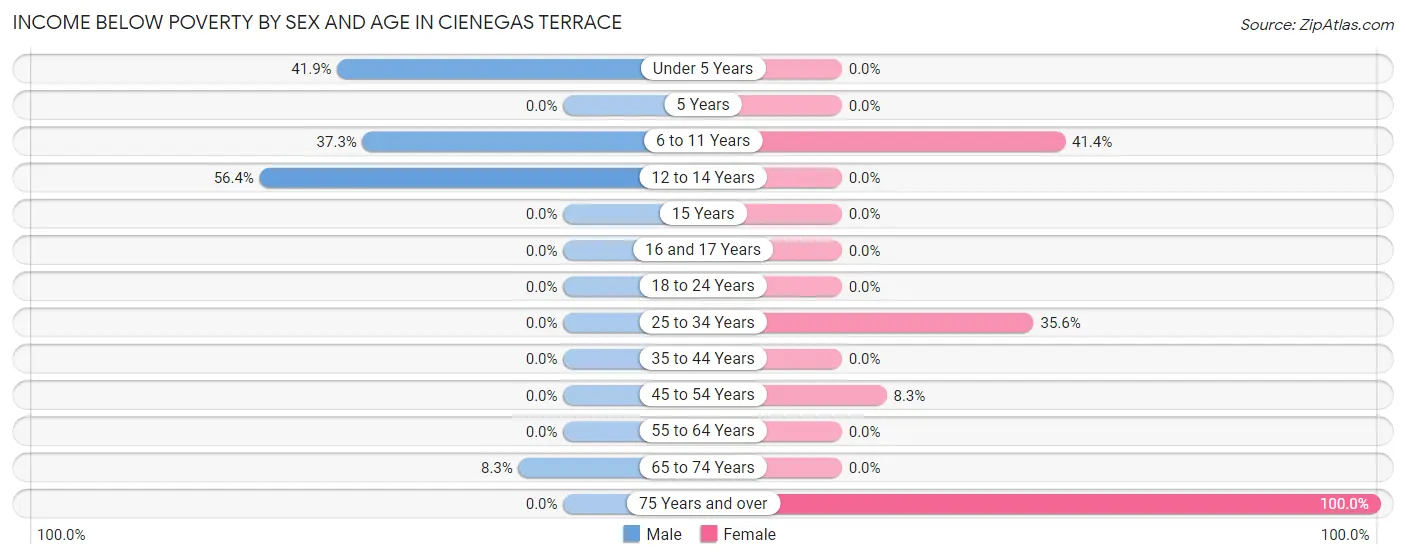
| Age Bracket | Male | Female |
| Under 5 Years | 26 (41.9%) | 0 (0.0%) |
| 5 Years | 0 (0.0%) | 0 (0.0%) |
| 6 to 11 Years | 19 (37.2%) | 29 (41.4%) |
| 12 to 14 Years | 31 (56.4%) | 0 (0.0%) |
| 15 Years | 0 (0.0%) | 0 (0.0%) |
| 16 and 17 Years | 0 (0.0%) | 0 (0.0%) |
| 18 to 24 Years | 0 (0.0%) | 0 (0.0%) |
| 25 to 34 Years | 0 (0.0%) | 21 (35.6%) |
| 35 to 44 Years | 0 (0.0%) | 0 (0.0%) |
| 45 to 54 Years | 0 (0.0%) | 20 (8.3%) |
| 55 to 64 Years | 0 (0.0%) | 0 (0.0%) |
| 65 to 74 Years | 20 (8.3%) | 0 (0.0%) |
| 75 Years and over | 0 (0.0%) | 8 (100.0%) |
| Total | 96 (10.3%) | 78 (10.8%) |
Income Above Poverty by Sex and Age in Cienegas Terrace
According to the poverty statistics in Cienegas Terrace, males aged 15 years and females aged under 5 years are the age groups that are most secure financially, with 100.0% of males and 100.0% of females in these age groups living above the poverty line.
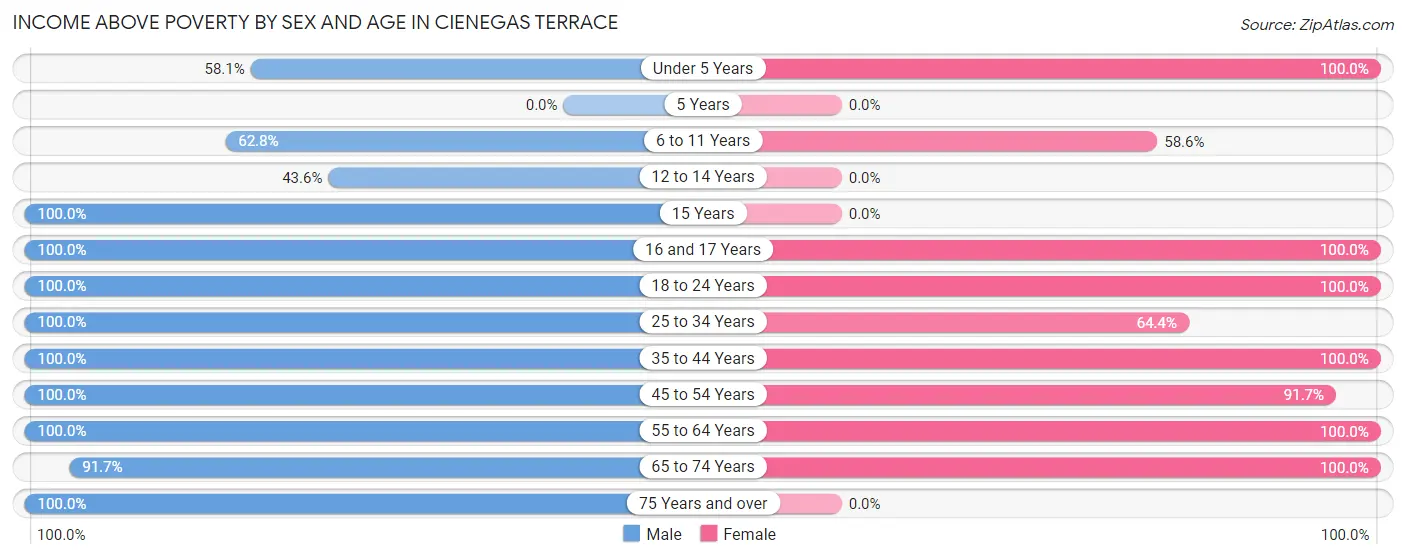
| Age Bracket | Male | Female |
| Under 5 Years | 36 (58.1%) | 32 (100.0%) |
| 5 Years | 0 (0.0%) | 0 (0.0%) |
| 6 to 11 Years | 32 (62.7%) | 41 (58.6%) |
| 12 to 14 Years | 24 (43.6%) | 0 (0.0%) |
| 15 Years | 39 (100.0%) | 0 (0.0%) |
| 16 and 17 Years | 64 (100.0%) | 29 (100.0%) |
| 18 to 24 Years | 51 (100.0%) | 75 (100.0%) |
| 25 to 34 Years | 67 (100.0%) | 38 (64.4%) |
| 35 to 44 Years | 54 (100.0%) | 86 (100.0%) |
| 45 to 54 Years | 196 (100.0%) | 221 (91.7%) |
| 55 to 64 Years | 44 (100.0%) | 6 (100.0%) |
| 65 to 74 Years | 221 (91.7%) | 114 (100.0%) |
| 75 Years and over | 9 (100.0%) | 0 (0.0%) |
| Total | 837 (89.7%) | 642 (89.2%) |
Income Below Poverty Among Married-Couple Families in Cienegas Terrace
The poverty statistics for married-couple families in Cienegas Terrace show that 4.4% or 20 of the total 456 families live below the poverty line. Families with 1 or 2 children have the highest poverty rate of 9.5%, comprising of 14 families. On the other hand, families with 3 or 4 children have the lowest poverty rate of 0.0%, which includes 0 families.
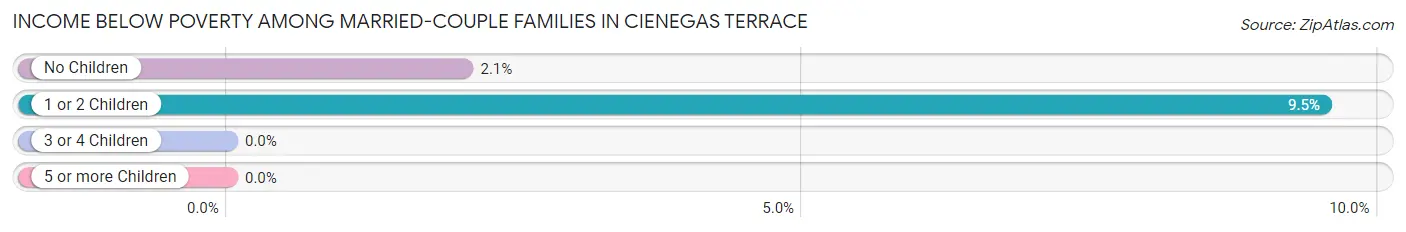
| Children | Above Poverty | Below Poverty |
| No Children | 287 (98.0%) | 6 (2.1%) |
| 1 or 2 Children | 133 (90.5%) | 14 (9.5%) |
| 3 or 4 Children | 16 (100.0%) | 0 (0.0%) |
| 5 or more Children | 0 (0.0%) | 0 (0.0%) |
| Total | 436 (95.6%) | 20 (4.4%) |
Income Below Poverty Among Single-Parent Households in Cienegas Terrace
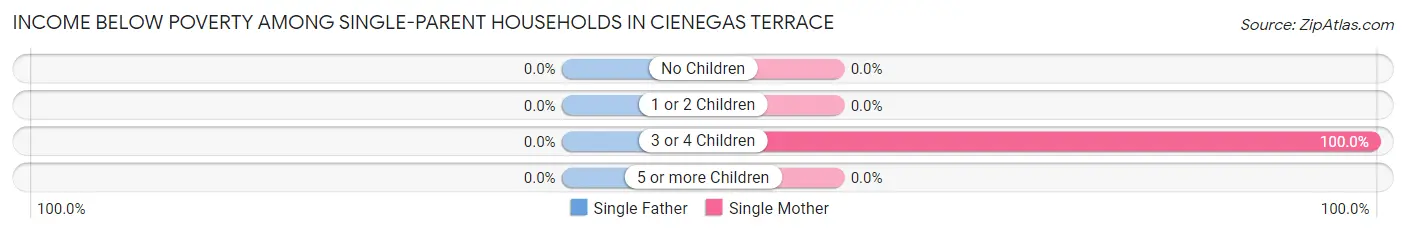
| Children | Single Father | Single Mother |
| No Children | 0 (0.0%) | 0 (0.0%) |
| 1 or 2 Children | 0 (0.0%) | 0 (0.0%) |
| 3 or 4 Children | 0 (0.0%) | 21 (100.0%) |
| 5 or more Children | 0 (0.0%) | 0 (0.0%) |
| Total | 0 (0.0%) | 21 (77.8%) |
Income Below Poverty Among Married-Couple vs Single-Parent Households in Cienegas Terrace
The poverty data for Cienegas Terrace shows that 20 of the married-couple family households (4.4%) and 21 of the single-parent households (22.8%) are living below the poverty level. Within the married-couple family households, those with 1 or 2 children have the highest poverty rate, with 14 households (9.5%) falling below the poverty line. Among the single-parent households, those with 3 or 4 children have the highest poverty rate, with 21 household (100.0%) living below poverty.
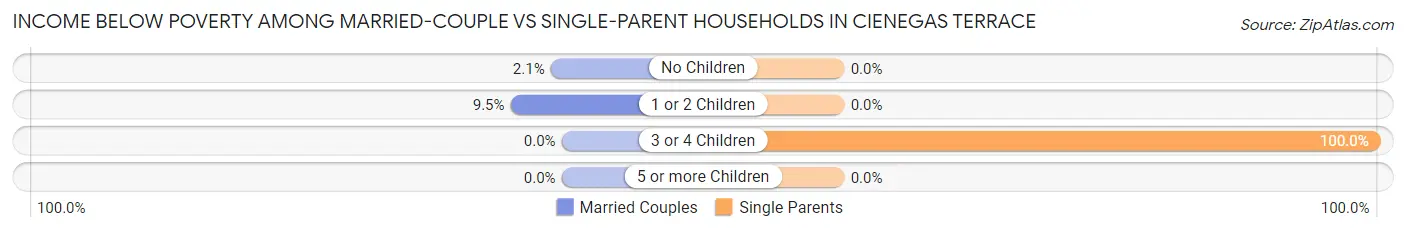
| Children | Married-Couple Families | Single-Parent Households |
| No Children | 6 (2.1%) | 0 (0.0%) |
| 1 or 2 Children | 14 (9.5%) | 0 (0.0%) |
| 3 or 4 Children | 0 (0.0%) | 21 (100.0%) |
| 5 or more Children | 0 (0.0%) | 0 (0.0%) |
| Total | 20 (4.4%) | 21 (22.8%) |
Race in Cienegas Terrace
The most populous races in Cienegas Terrace are Hispanic or Latino (1,562 | 94.5%), White / Caucasian (1,151 | 69.6%), and Two or more Races (346 | 20.9%).
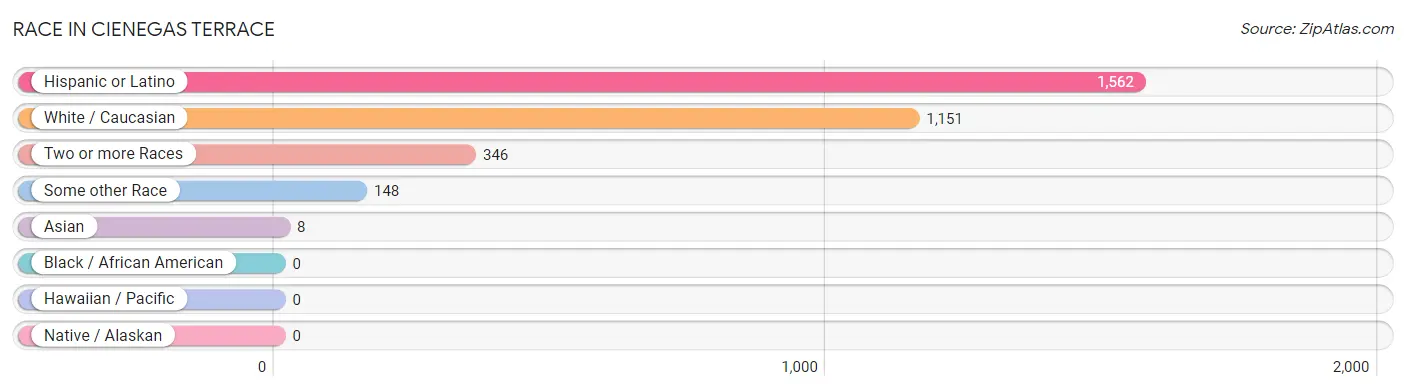
| Race | # Population | % Population |
| Asian | 8 | 0.5% |
| Black / African American | 0 | 0.0% |
| Hawaiian / Pacific | 0 | 0.0% |
| Hispanic or Latino | 1,562 | 94.5% |
| Native / Alaskan | 0 | 0.0% |
| White / Caucasian | 1,151 | 69.6% |
| Two or more Races | 346 | 20.9% |
| Some other Race | 148 | 8.9% |
| Total | 1,653 | 100.0% |
Ancestry in Cienegas Terrace
The most populous ancestries reported in Cienegas Terrace are Mexican (1,562 | 94.5%), Irish (20 | 1.2%), European (14 | 0.9%), Korean (8 | 0.5%), and Cherokee (6 | 0.4%), together accounting for 97.4% of all Cienegas Terrace residents.
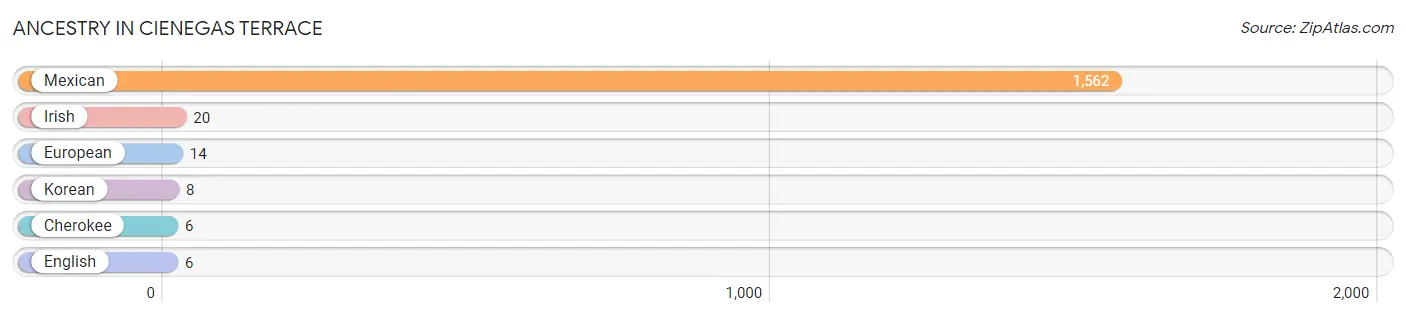
| Ancestry | # Population | % Population |
| Cherokee | 6 | 0.4% |
| English | 6 | 0.4% |
| European | 14 | 0.9% |
| Irish | 20 | 1.2% |
| Korean | 8 | 0.5% |
| Mexican | 1,562 | 94.5% | View All 6 Rows |
Immigrants in Cienegas Terrace
The most numerous immigrant groups reported in Cienegas Terrace came from Central America (603 | 36.5%), Latin America (603 | 36.5%), Mexico (603 | 36.5%), Africa (14 | 0.9%), and South Africa (14 | 0.9%), together accounting for 111.1% of all Cienegas Terrace residents.
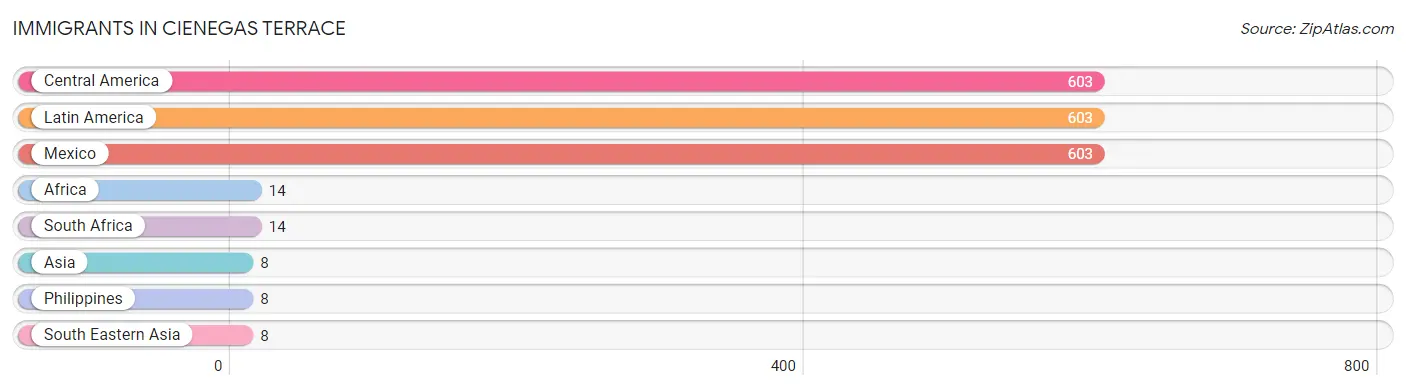
| Immigration Origin | # Population | % Population |
| Africa | 14 | 0.9% |
| Asia | 8 | 0.5% |
| Central America | 603 | 36.5% |
| Latin America | 603 | 36.5% |
| Mexico | 603 | 36.5% |
| Philippines | 8 | 0.5% |
| South Africa | 14 | 0.9% |
| South Eastern Asia | 8 | 0.5% | View All 8 Rows |
Sex and Age in Cienegas Terrace
Sex and Age in Cienegas Terrace
The most populous age groups in Cienegas Terrace are 45 to 49 Years (172 | 18.4%) for men and 45 to 49 Years (162 | 22.5%) for women.
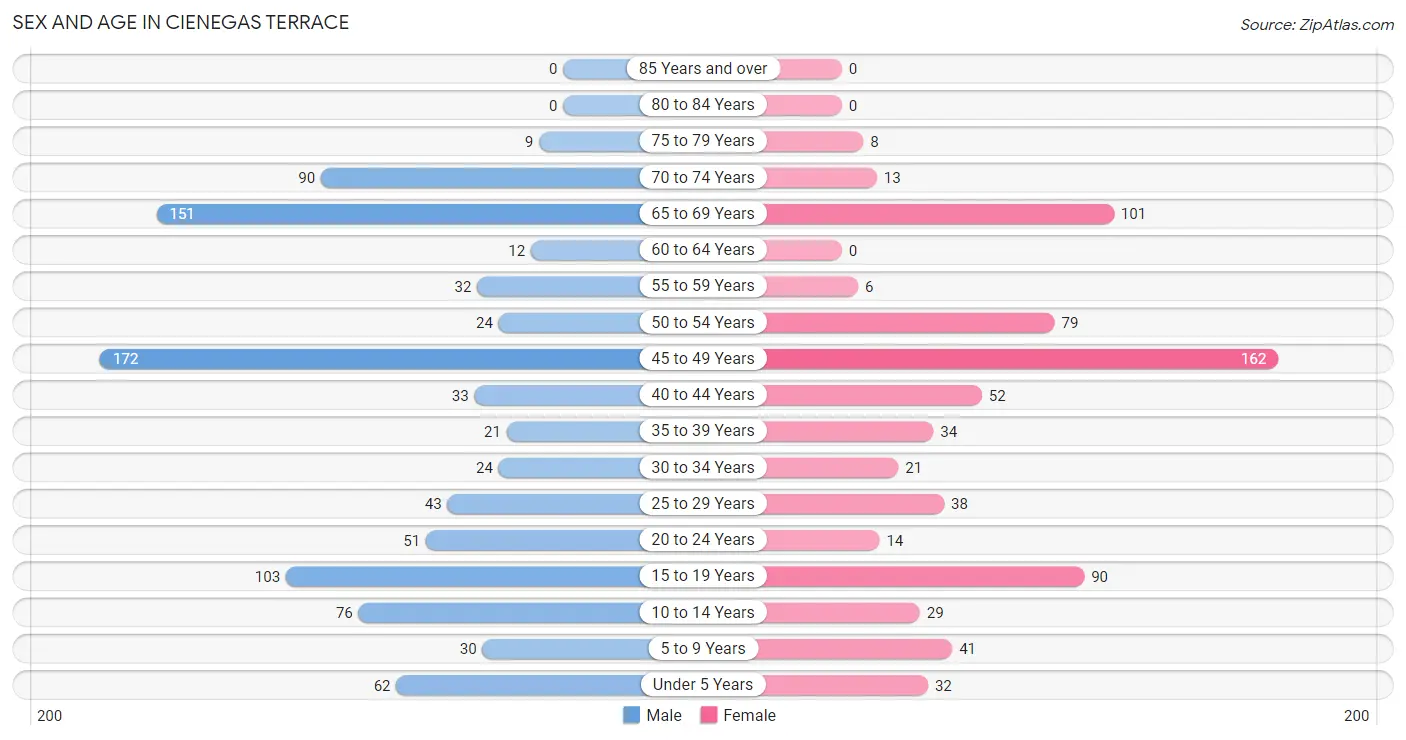
| Age Bracket | Male | Female |
| Under 5 Years | 62 (6.7%) | 32 (4.4%) |
| 5 to 9 Years | 30 (3.2%) | 41 (5.7%) |
| 10 to 14 Years | 76 (8.2%) | 29 (4.0%) |
| 15 to 19 Years | 103 (11.0%) | 90 (12.5%) |
| 20 to 24 Years | 51 (5.5%) | 14 (1.9%) |
| 25 to 29 Years | 43 (4.6%) | 38 (5.3%) |
| 30 to 34 Years | 24 (2.6%) | 21 (2.9%) |
| 35 to 39 Years | 21 (2.2%) | 34 (4.7%) |
| 40 to 44 Years | 33 (3.5%) | 52 (7.2%) |
| 45 to 49 Years | 172 (18.4%) | 162 (22.5%) |
| 50 to 54 Years | 24 (2.6%) | 79 (11.0%) |
| 55 to 59 Years | 32 (3.4%) | 6 (0.8%) |
| 60 to 64 Years | 12 (1.3%) | 0 (0.0%) |
| 65 to 69 Years | 151 (16.2%) | 101 (14.0%) |
| 70 to 74 Years | 90 (9.7%) | 13 (1.8%) |
| 75 to 79 Years | 9 (1.0%) | 8 (1.1%) |
| 80 to 84 Years | 0 (0.0%) | 0 (0.0%) |
| 85 Years and over | 0 (0.0%) | 0 (0.0%) |
| Total | 933 (100.0%) | 720 (100.0%) |
Families and Households in Cienegas Terrace
Median Family Size in Cienegas Terrace
The median family size in Cienegas Terrace is 2.89 persons per family, with single female/mother families (27 | 4.9%) accounting for the largest median family size of 4.44 persons per family. On the other hand, married-couple families (456 | 83.2%) represent the smallest median family size with 2.75 persons per family.
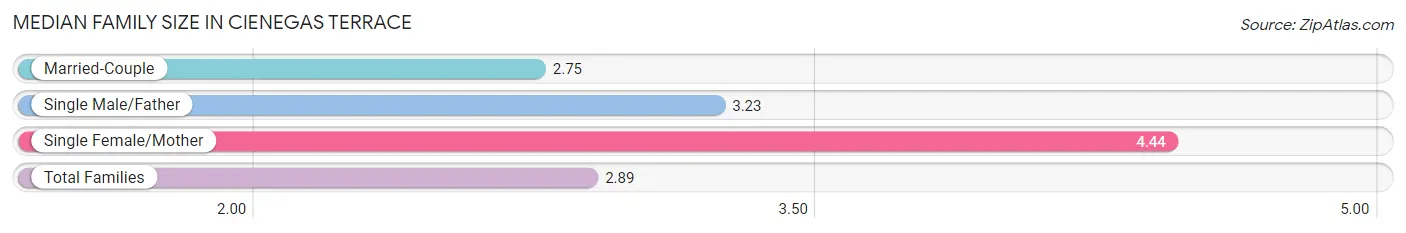
| Family Type | # Families | Family Size |
| Married-Couple | 456 (83.2%) | 2.75 |
| Single Male/Father | 65 (11.9%) | 3.23 |
| Single Female/Mother | 27 (4.9%) | 4.44 |
| Total Families | 548 (100.0%) | 2.89 |
Median Household Size in Cienegas Terrace
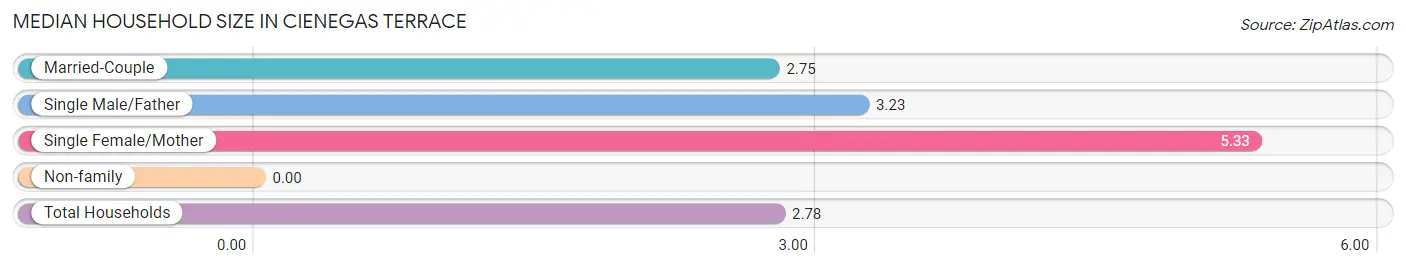
| Household Type | # Households | Household Size |
| Married-Couple | 456 (76.6%) | 2.75 |
| Single Male/Father | 65 (10.9%) | 3.23 |
| Single Female/Mother | 27 (4.5%) | 5.33 |
| Non-family | 47 (7.9%) | - |
| Total Households | 595 (100.0%) | 2.78 |
Household Size by Marriage Status in Cienegas Terrace
Out of a total of 595 households in Cienegas Terrace, 548 (92.1%) are family households, while 47 (7.9%) are nonfamily households. The most numerous type of family households are 2-person households, comprising 215, and the most common type of nonfamily households are 1-person households, comprising 47.
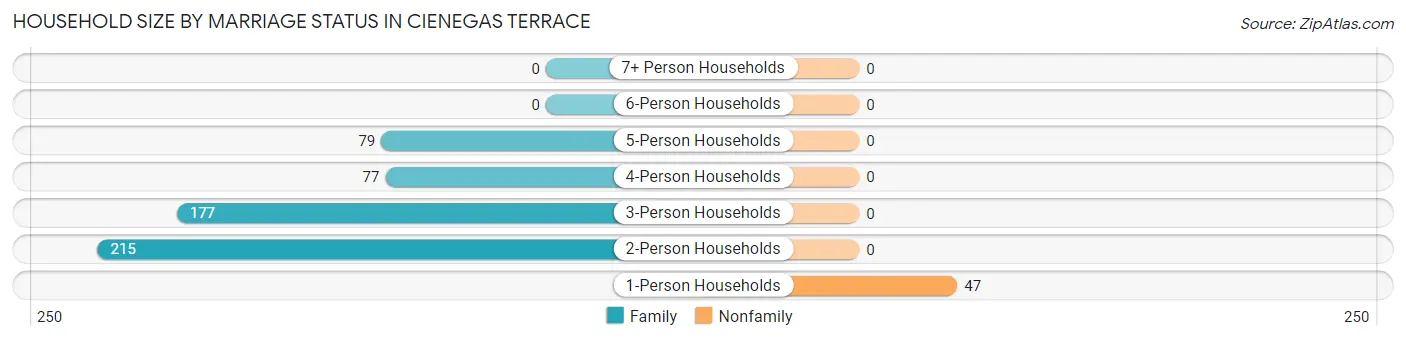
| Household Size | Family Households | Nonfamily Households |
| 1-Person Households | - | 47 (7.9%) |
| 2-Person Households | 215 (36.1%) | 0 (0.0%) |
| 3-Person Households | 177 (29.7%) | 0 (0.0%) |
| 4-Person Households | 77 (12.9%) | 0 (0.0%) |
| 5-Person Households | 79 (13.3%) | 0 (0.0%) |
| 6-Person Households | 0 (0.0%) | 0 (0.0%) |
| 7+ Person Households | 0 (0.0%) | 0 (0.0%) |
| Total | 548 (92.1%) | 47 (7.9%) |
Female Fertility in Cienegas Terrace
Fertility by Age in Cienegas Terrace
| Age Bracket | Women with Births | Births / 1,000 Women |
| 15 to 19 years | 0 (0.0%) | 0.0 |
| 20 to 34 years | 0 (0.0%) | 0.0 |
| 35 to 50 years | 0 (0.0%) | 0.0 |
| Total | 0 (0.0%) | 0.0 |
Fertility by Age by Marriage Status in Cienegas Terrace
| Age Bracket | Married | Unmarried |
| 15 to 19 years | 0 (0.0%) | 0 (0.0%) |
| 20 to 34 years | 0 (0.0%) | 0 (0.0%) |
| 35 to 50 years | 0 (0.0%) | 0 (0.0%) |
| Total | 0 (0.0%) | 0 (0.0%) |
Fertility by Education in Cienegas Terrace
| Educational Attainment | Women with Births | Births / 1,000 Women |
| Less than High School | 0 (0.0%) | 0.0 |
| High School Diploma | 0 (0.0%) | 0.0 |
| College or Associate's Degree | 0 (0.0%) | 0.0 |
| Bachelor's Degree | 0 (0.0%) | 0.0 |
| Graduate Degree | 0 (0.0%) | 0.0 |
| Total | 0 (0.0%) | 0.0 |
Fertility by Education by Marriage Status in Cienegas Terrace
| Educational Attainment | Married | Unmarried |
| Less than High School | 0 (0.0%) | 0 (0.0%) |
| High School Diploma | 0 (0.0%) | 0 (0.0%) |
| College or Associate's Degree | 0 (0.0%) | 0 (0.0%) |
| Bachelor's Degree | 0 (0.0%) | 0 (0.0%) |
| Graduate Degree | 0 (0.0%) | 0 (0.0%) |
| Total | 0 (0.0%) | 0 (0.0%) |
Employment Characteristics in Cienegas Terrace
Employment by Class of Employer in Cienegas Terrace
Among the 744 employed individuals in Cienegas Terrace, private company employees (430 | 57.8%), self-employed (not incorporated) (122 | 16.4%), and not-for-profit organizations (109 | 14.6%) make up the most common classes of employment.
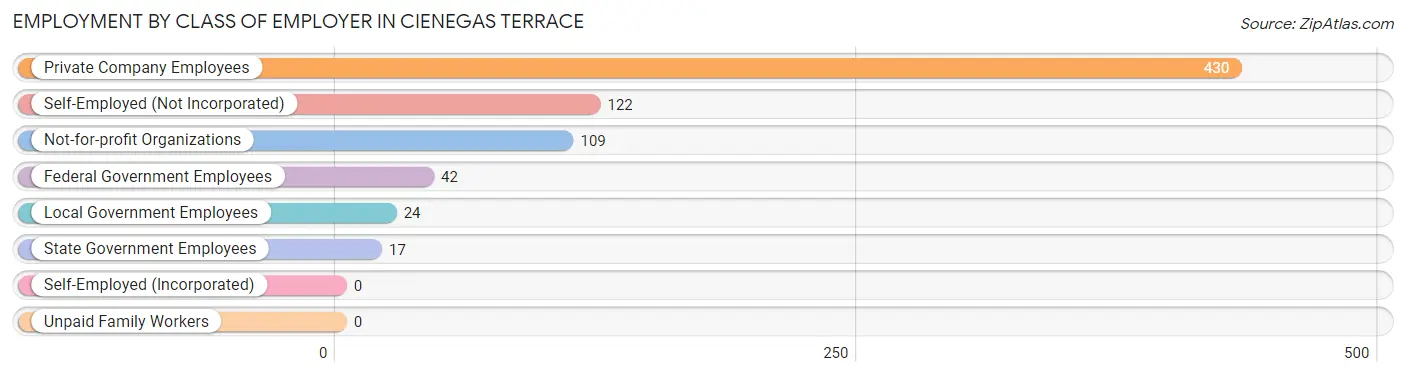
| Employer Class | # Employees | % Employees |
| Private Company Employees | 430 | 57.8% |
| Self-Employed (Incorporated) | 0 | 0.0% |
| Self-Employed (Not Incorporated) | 122 | 16.4% |
| Not-for-profit Organizations | 109 | 14.6% |
| Local Government Employees | 24 | 3.2% |
| State Government Employees | 17 | 2.3% |
| Federal Government Employees | 42 | 5.7% |
| Unpaid Family Workers | 0 | 0.0% |
| Total | 744 | 100.0% |
Employment Status by Age in Cienegas Terrace
According to the labor force statistics for Cienegas Terrace, out of the total population over 16 years of age (1,344), 56.8% or 763 individuals are in the labor force, with 2.7% or 21 of them unemployed. The age group with the highest labor force participation rate is 20 to 24 years, with 100.0% or 65 individuals in the labor force. Within the labor force, the 75 years and over age range has the highest percentage of unemployed individuals, with 100.0% or 9 of them being unemployed.
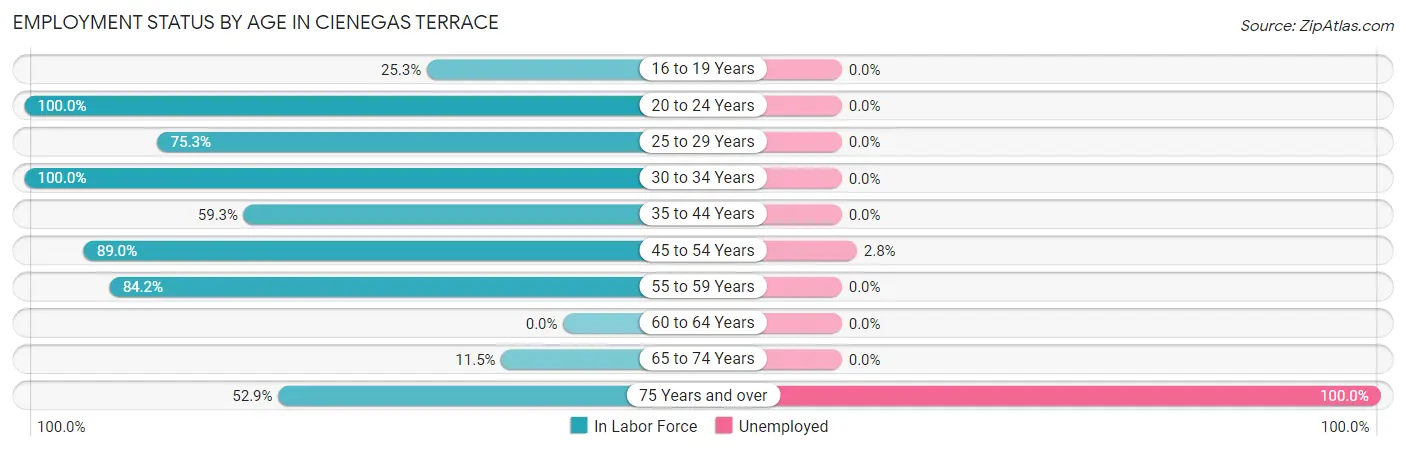
| Age Bracket | In Labor Force | Unemployed |
| 16 to 19 Years | 39 (25.3%) | 0 (0.0%) |
| 20 to 24 Years | 65 (100.0%) | 0 (0.0%) |
| 25 to 29 Years | 61 (75.3%) | 0 (0.0%) |
| 30 to 34 Years | 45 (100.0%) | 0 (0.0%) |
| 35 to 44 Years | 83 (59.3%) | 0 (0.0%) |
| 45 to 54 Years | 389 (89.0%) | 11 (2.8%) |
| 55 to 59 Years | 32 (84.2%) | 0 (0.0%) |
| 60 to 64 Years | 0 (0.0%) | 0 (0.0%) |
| 65 to 74 Years | 41 (11.5%) | 0 (0.0%) |
| 75 Years and over | 9 (52.9%) | 9 (100.0%) |
| Total | 763 (56.8%) | 21 (2.7%) |
Employment Status by Educational Attainment in Cienegas Terrace
According to labor force statistics for Cienegas Terrace, 81.0% of individuals (610) out of the total population between 25 and 64 years of age (753) are in the labor force, with 1.8% or 11 of them being unemployed. The group with the highest labor force participation rate are those with the educational attainment of bachelor's degree or higher, with 100.0% or 31 individuals in the labor force. Within the labor force, individuals with high school diploma education have the highest percentage of unemployment, with 2.7% or 11 of them being unemployed.
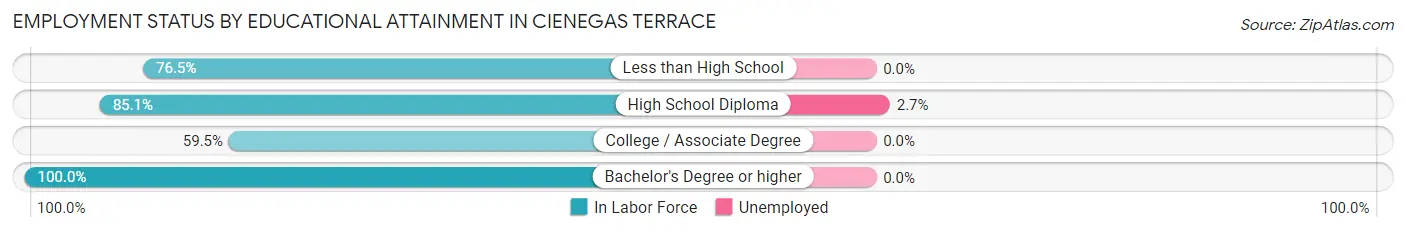
| Educational Attainment | In Labor Force | Unemployed |
| Less than High School | 124 (76.5%) | 0 (0.0%) |
| High School Diploma | 405 (85.1%) | 13 (2.7%) |
| College / Associate Degree | 50 (59.5%) | 0 (0.0%) |
| Bachelor's Degree or higher | 31 (100.0%) | 0 (0.0%) |
| Total | 610 (81.0%) | 14 (1.8%) |
Employment Occupations by Sex in Cienegas Terrace
Management, Business, Science and Arts Occupations
The most common Management, Business, Science and Arts occupations in Cienegas Terrace are Management (47 | 6.4%), Community & Social Service (42 | 5.7%), Education Instruction & Library (37 | 5.1%), and Arts, Media & Entertainment (5 | 0.7%).
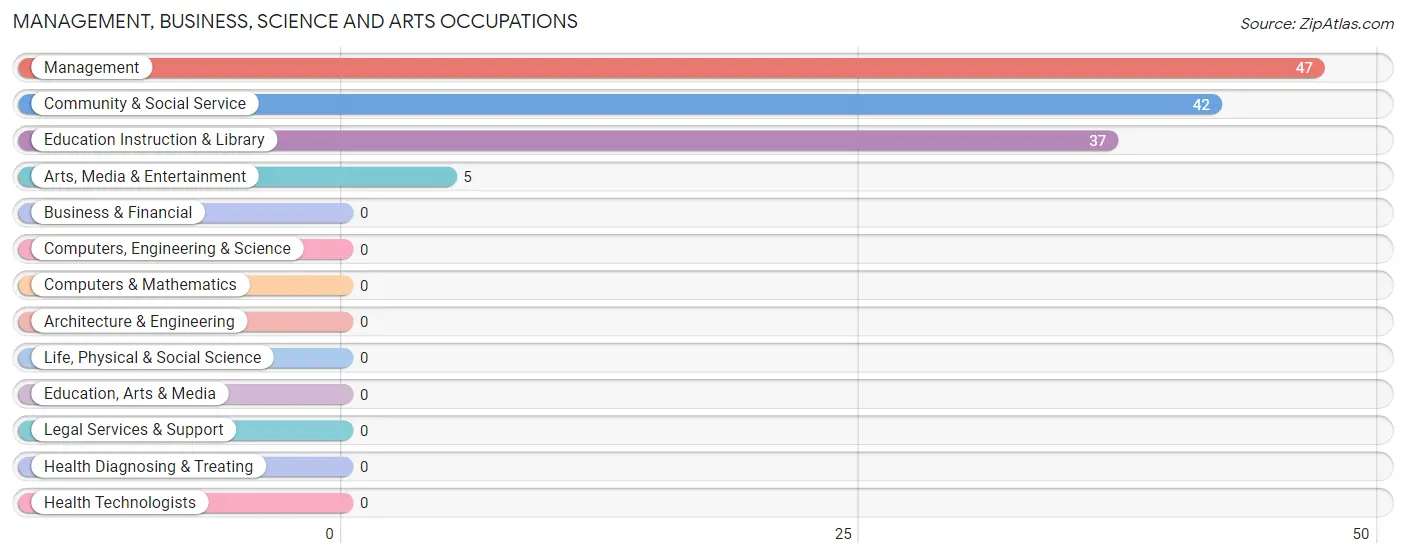
Management, Business, Science and Arts Occupations by Sex
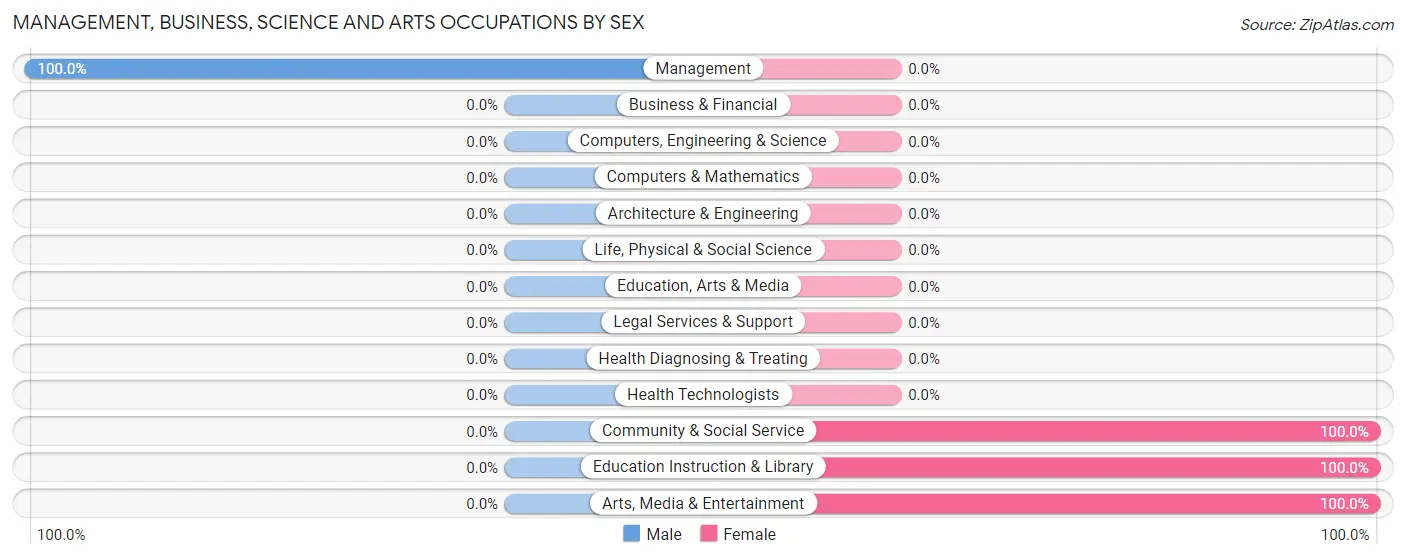
| Occupation | Male | Female |
| Management | 47 (100.0%) | 0 (0.0%) |
| Business & Financial | 0 (0.0%) | 0 (0.0%) |
| Computers, Engineering & Science | 0 (0.0%) | 0 (0.0%) |
| Computers & Mathematics | 0 (0.0%) | 0 (0.0%) |
| Architecture & Engineering | 0 (0.0%) | 0 (0.0%) |
| Life, Physical & Social Science | 0 (0.0%) | 0 (0.0%) |
| Community & Social Service | 0 (0.0%) | 42 (100.0%) |
| Education, Arts & Media | 0 (0.0%) | 0 (0.0%) |
| Legal Services & Support | 0 (0.0%) | 0 (0.0%) |
| Education Instruction & Library | 0 (0.0%) | 37 (100.0%) |
| Arts, Media & Entertainment | 0 (0.0%) | 5 (100.0%) |
| Health Diagnosing & Treating | 0 (0.0%) | 0 (0.0%) |
| Health Technologists | 0 (0.0%) | 0 (0.0%) |
| Total (Category) | 47 (52.8%) | 42 (47.2%) |
| Total (Overall) | 354 (48.4%) | 378 (51.6%) |
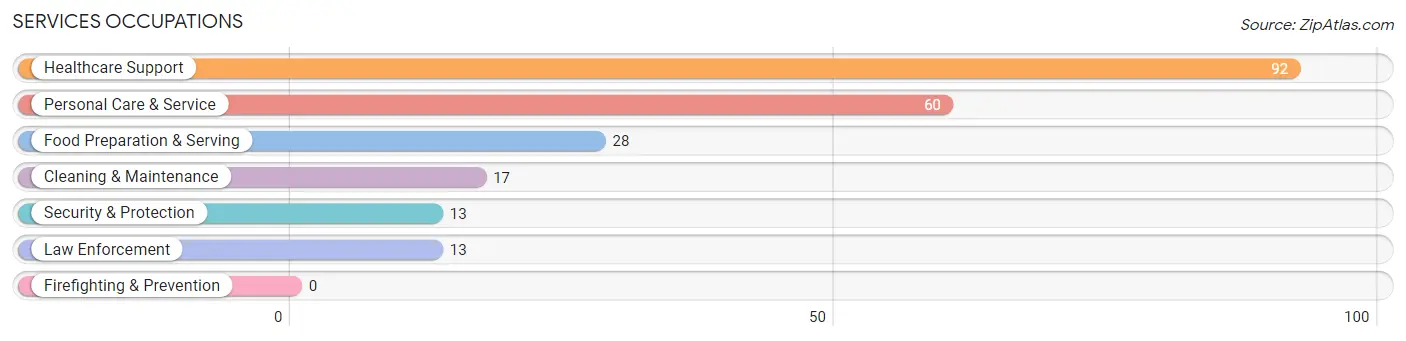
Services Occupations
The most common Services occupations in Cienegas Terrace are Healthcare Support (92 | 12.6%), Personal Care & Service (60 | 8.2%), Food Preparation & Serving (28 | 3.8%), Cleaning & Maintenance (17 | 2.3%), and Security & Protection (13 | 1.8%).
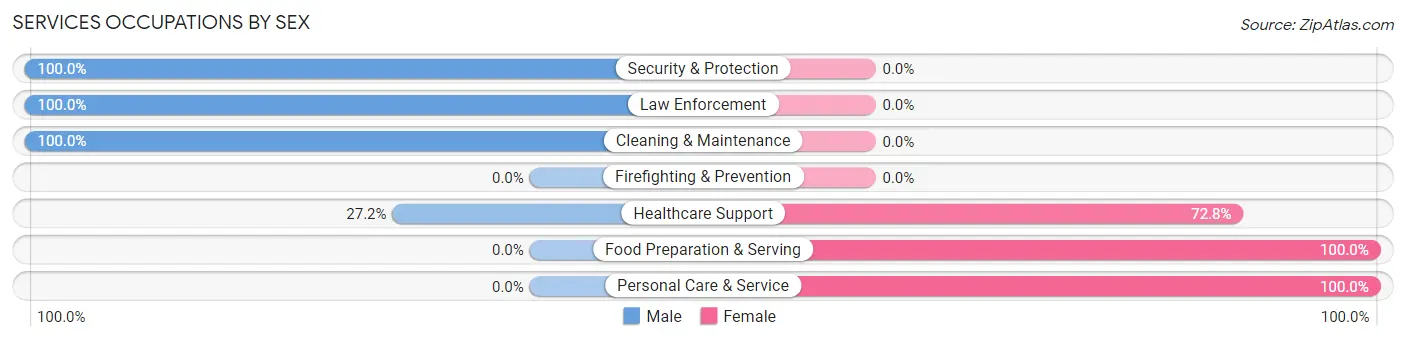
Services Occupations by Sex
Within the Services occupations in Cienegas Terrace, the most male-oriented occupations are Security & Protection (100.0%), Law Enforcement (100.0%), and Cleaning & Maintenance (100.0%), while the most female-oriented occupations are Food Preparation & Serving (100.0%), Personal Care & Service (100.0%), and Healthcare Support (72.8%).
| Occupation | Male | Female |
| Healthcare Support | 25 (27.2%) | 67 (72.8%) |
| Security & Protection | 13 (100.0%) | 0 (0.0%) |
| Firefighting & Prevention | 0 (0.0%) | 0 (0.0%) |
| Law Enforcement | 13 (100.0%) | 0 (0.0%) |
| Food Preparation & Serving | 0 (0.0%) | 28 (100.0%) |
| Cleaning & Maintenance | 17 (100.0%) | 0 (0.0%) |
| Personal Care & Service | 0 (0.0%) | 60 (100.0%) |
| Total (Category) | 55 (26.2%) | 155 (73.8%) |
| Total (Overall) | 354 (48.4%) | 378 (51.6%) |
Sales and Office Occupations
The most common Sales and Office occupations in Cienegas Terrace are Sales & Related (41 | 5.6%), and Office & Administration (32 | 4.4%).
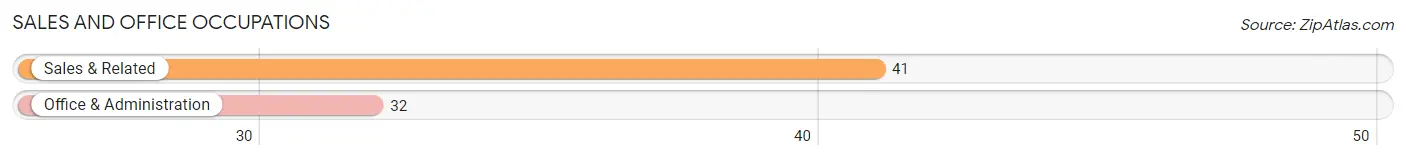
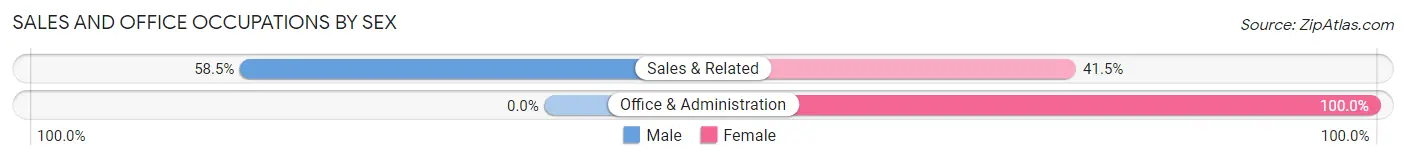
Sales and Office Occupations by Sex
| Occupation | Male | Female |
| Sales & Related | 24 (58.5%) | 17 (41.5%) |
| Office & Administration | 0 (0.0%) | 32 (100.0%) |
| Total (Category) | 24 (32.9%) | 49 (67.1%) |
| Total (Overall) | 354 (48.4%) | 378 (51.6%) |
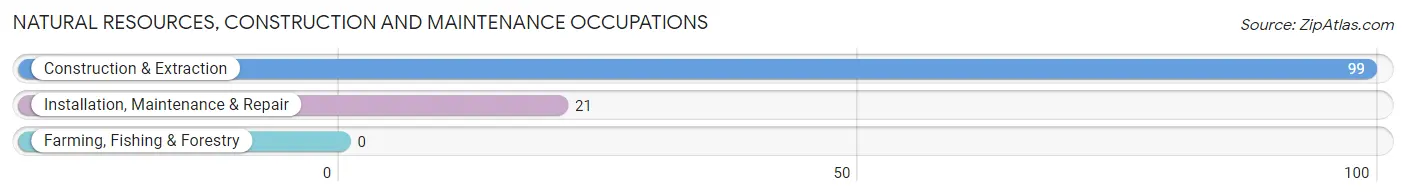
Natural Resources, Construction and Maintenance Occupations
The most common Natural Resources, Construction and Maintenance occupations in Cienegas Terrace are Construction & Extraction (99 | 13.5%), and Installation, Maintenance & Repair (21 | 2.9%).
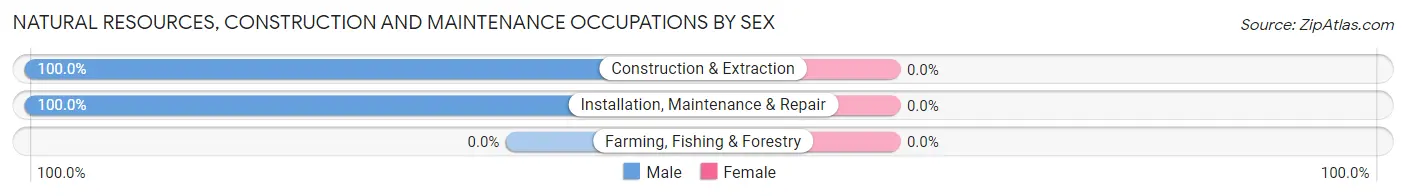
Natural Resources, Construction and Maintenance Occupations by Sex
| Occupation | Male | Female |
| Farming, Fishing & Forestry | 0 (0.0%) | 0 (0.0%) |
| Construction & Extraction | 99 (100.0%) | 0 (0.0%) |
| Installation, Maintenance & Repair | 21 (100.0%) | 0 (0.0%) |
| Total (Category) | 120 (100.0%) | 0 (0.0%) |
| Total (Overall) | 354 (48.4%) | 378 (51.6%) |
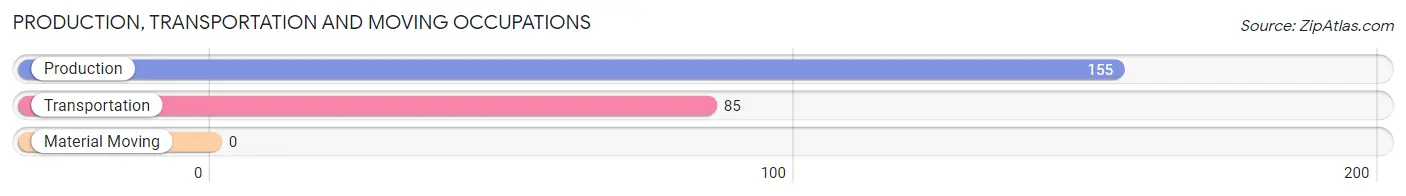
Production, Transportation and Moving Occupations
The most common Production, Transportation and Moving occupations in Cienegas Terrace are Production (155 | 21.2%), and Transportation (85 | 11.6%).
Production, Transportation and Moving Occupations by Sex
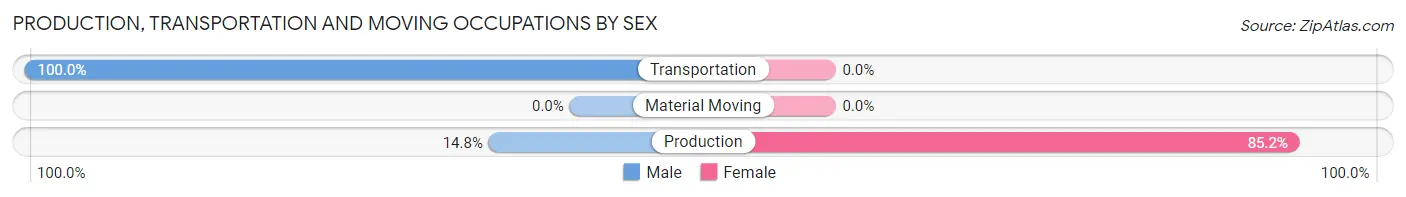
| Occupation | Male | Female |
| Production | 23 (14.8%) | 132 (85.2%) |
| Transportation | 85 (100.0%) | 0 (0.0%) |
| Material Moving | 0 (0.0%) | 0 (0.0%) |
| Total (Category) | 108 (45.0%) | 132 (55.0%) |
| Total (Overall) | 354 (48.4%) | 378 (51.6%) |
Employment Industries by Sex in Cienegas Terrace
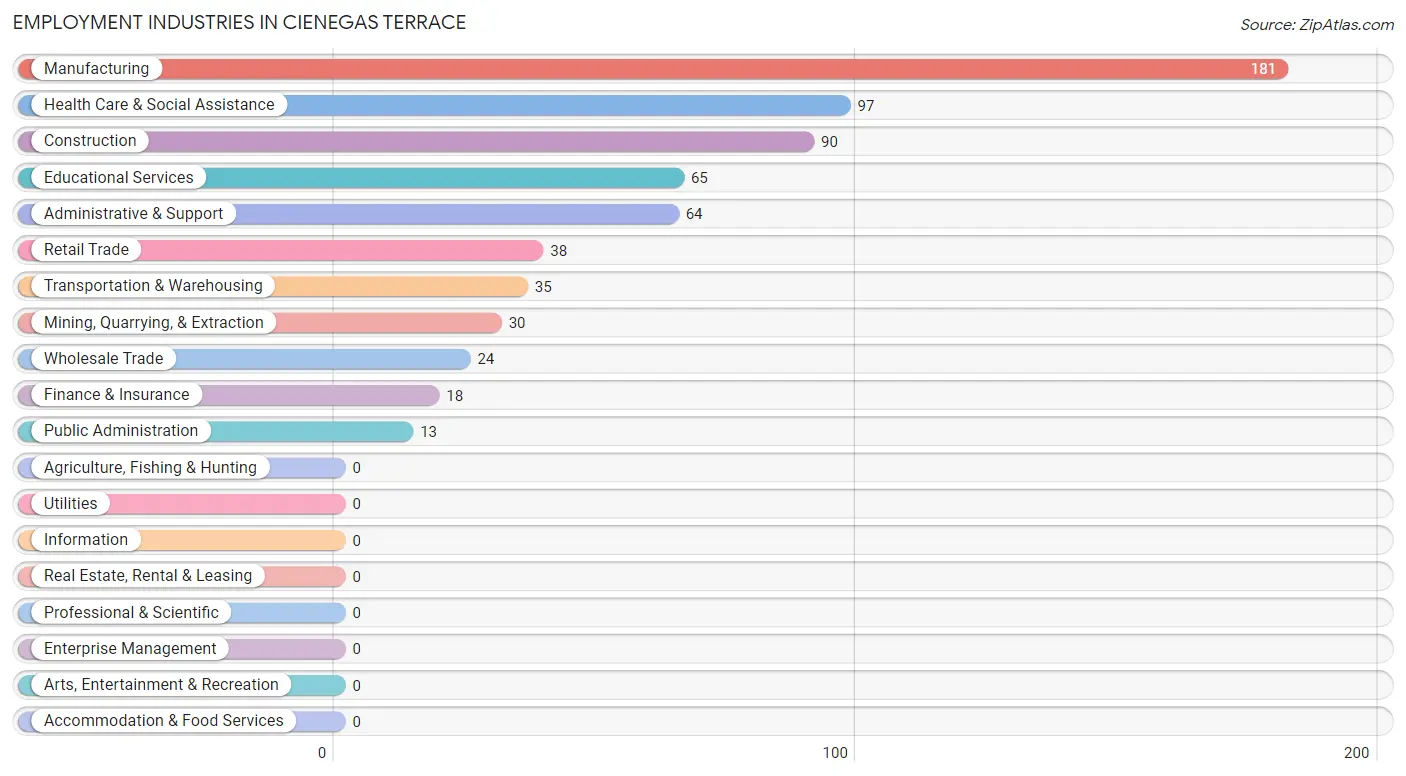
Employment Industries in Cienegas Terrace
The major employment industries in Cienegas Terrace include Manufacturing (181 | 24.7%), Health Care & Social Assistance (97 | 13.3%), Construction (90 | 12.3%), Educational Services (65 | 8.9%), and Administrative & Support (64 | 8.7%).
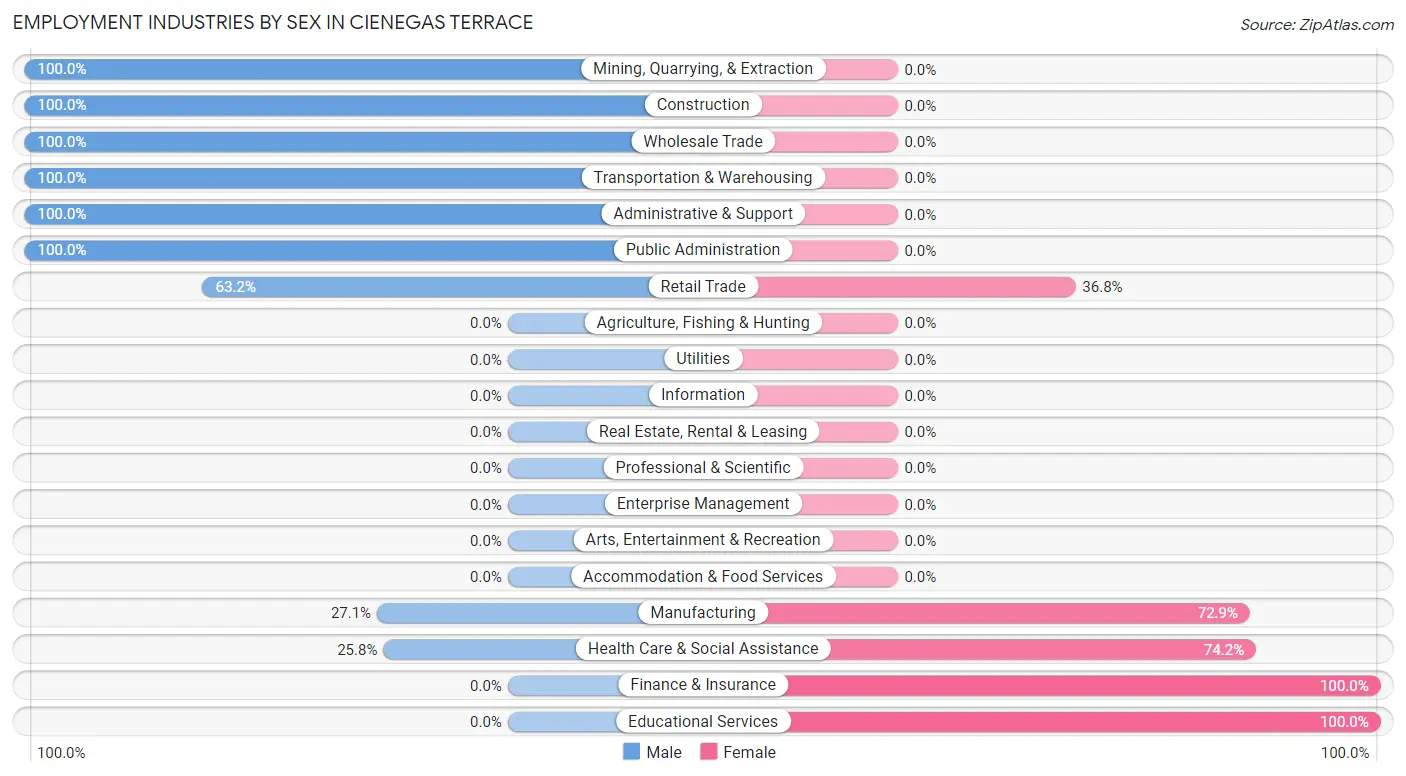
Employment Industries by Sex in Cienegas Terrace
The Cienegas Terrace industries that see more men than women are Mining, Quarrying, & Extraction (100.0%), Construction (100.0%), and Wholesale Trade (100.0%), whereas the industries that tend to have a higher number of women are Finance & Insurance (100.0%), Educational Services (100.0%), and Health Care & Social Assistance (74.2%).
| Industry | Male | Female |
| Agriculture, Fishing & Hunting | 0 (0.0%) | 0 (0.0%) |
| Mining, Quarrying, & Extraction | 30 (100.0%) | 0 (0.0%) |
| Construction | 90 (100.0%) | 0 (0.0%) |
| Manufacturing | 49 (27.1%) | 132 (72.9%) |
| Wholesale Trade | 24 (100.0%) | 0 (0.0%) |
| Retail Trade | 24 (63.2%) | 14 (36.8%) |
| Transportation & Warehousing | 35 (100.0%) | 0 (0.0%) |
| Utilities | 0 (0.0%) | 0 (0.0%) |
| Information | 0 (0.0%) | 0 (0.0%) |
| Finance & Insurance | 0 (0.0%) | 18 (100.0%) |
| Real Estate, Rental & Leasing | 0 (0.0%) | 0 (0.0%) |
| Professional & Scientific | 0 (0.0%) | 0 (0.0%) |
| Enterprise Management | 0 (0.0%) | 0 (0.0%) |
| Administrative & Support | 64 (100.0%) | 0 (0.0%) |
| Educational Services | 0 (0.0%) | 65 (100.0%) |
| Health Care & Social Assistance | 25 (25.8%) | 72 (74.2%) |
| Arts, Entertainment & Recreation | 0 (0.0%) | 0 (0.0%) |
| Accommodation & Food Services | 0 (0.0%) | 0 (0.0%) |
| Public Administration | 13 (100.0%) | 0 (0.0%) |
| Total | 354 (48.4%) | 378 (51.6%) |
Education in Cienegas Terrace
School Enrollment in Cienegas Terrace
The most common levels of schooling among the 395 students in Cienegas Terrace are high school (185 | 46.8%), elementary school (102 | 25.8%), and college / undergraduate (33 | 8.4%).
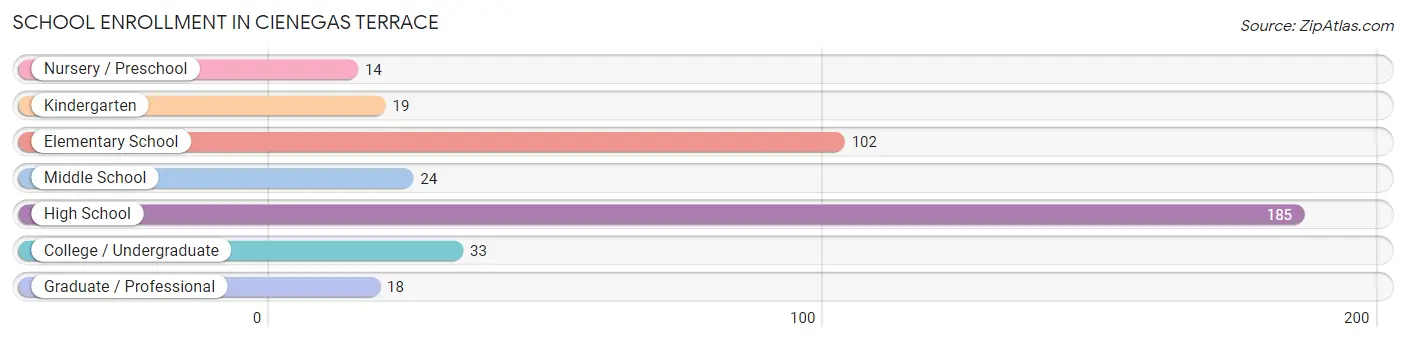
| School Level | # Students | % Students |
| Nursery / Preschool | 14 | 3.5% |
| Kindergarten | 19 | 4.8% |
| Elementary School | 102 | 25.8% |
| Middle School | 24 | 6.1% |
| High School | 185 | 46.8% |
| College / Undergraduate | 33 | 8.4% |
| Graduate / Professional | 18 | 4.6% |
| Total | 395 | 100.0% |
School Enrollment by Age by Funding Source in Cienegas Terrace
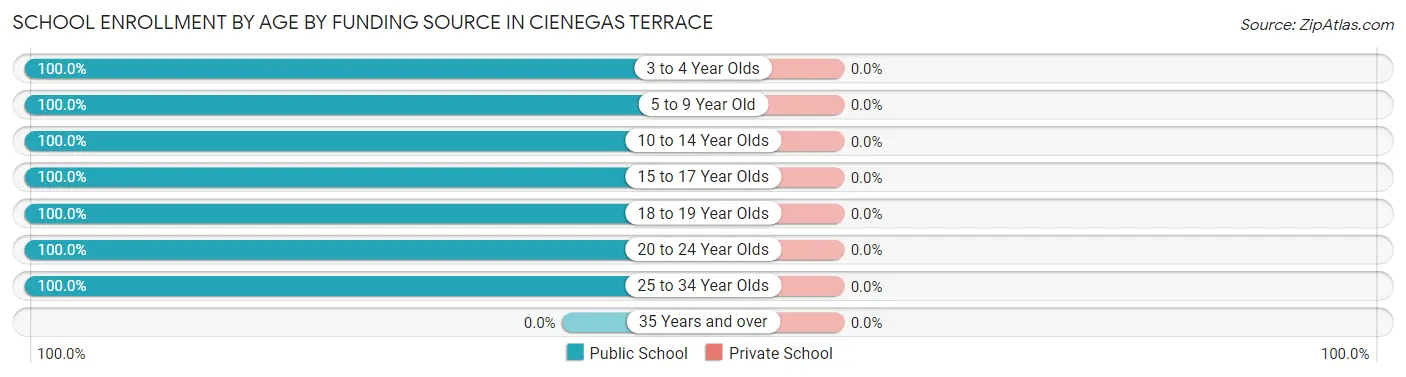
| Age Bracket | Public School | Private School |
| 3 to 4 Year Olds | 14 (100.0%) | 0 (0.0%) |
| 5 to 9 Year Old | 71 (100.0%) | 0 (0.0%) |
| 10 to 14 Year Olds | 105 (100.0%) | 0 (0.0%) |
| 15 to 17 Year Olds | 132 (100.0%) | 0 (0.0%) |
| 18 to 19 Year Olds | 42 (100.0%) | 0 (0.0%) |
| 20 to 24 Year Olds | 13 (100.0%) | 0 (0.0%) |
| 25 to 34 Year Olds | 18 (100.0%) | 0 (0.0%) |
| 35 Years and over | 0 (0.0%) | 0 (0.0%) |
| Total | 395 (100.0%) | 0 (0.0%) |
Educational Attainment by Field of Study in Cienegas Terrace
Education (49 | 54.4%), liberal arts & history (21 | 23.3%), arts & humanities (14 | 15.6%), and psychology (6 | 6.7%) are the most common fields of study among 90 individuals in Cienegas Terrace who have obtained a bachelor's degree or higher.
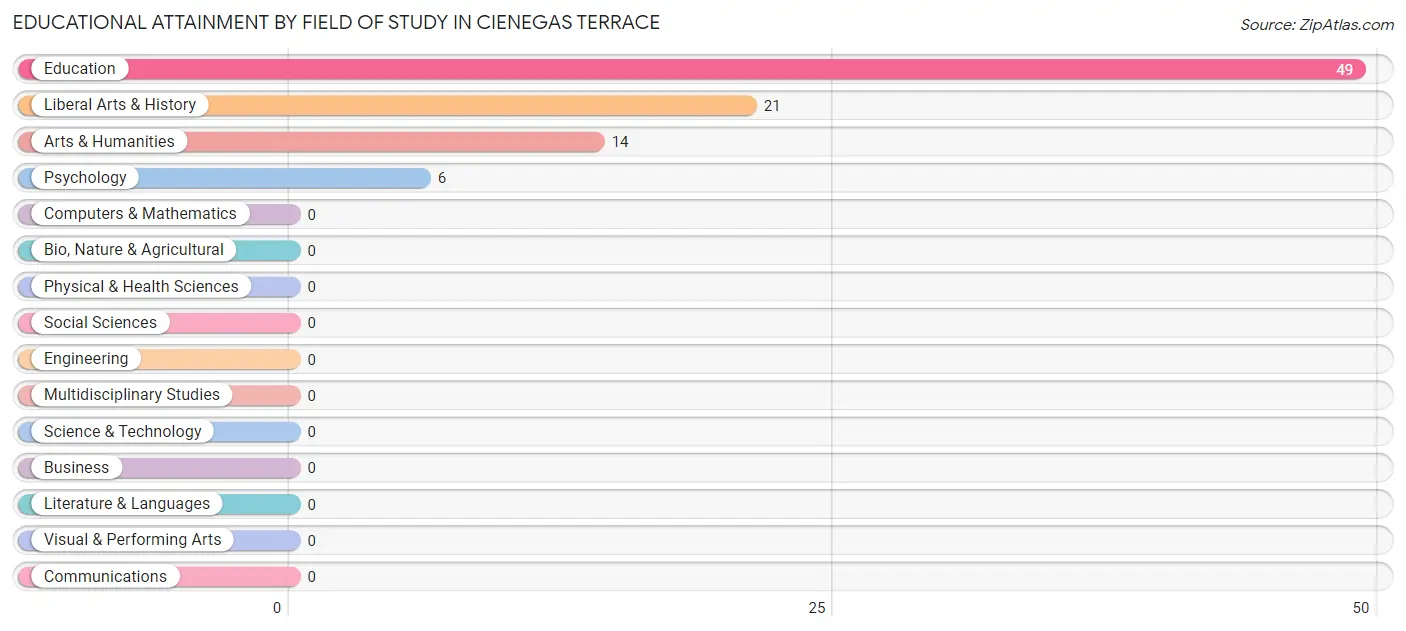
| Field of Study | # Graduates | % Graduates |
| Computers & Mathematics | 0 | 0.0% |
| Bio, Nature & Agricultural | 0 | 0.0% |
| Physical & Health Sciences | 0 | 0.0% |
| Psychology | 6 | 6.7% |
| Social Sciences | 0 | 0.0% |
| Engineering | 0 | 0.0% |
| Multidisciplinary Studies | 0 | 0.0% |
| Science & Technology | 0 | 0.0% |
| Business | 0 | 0.0% |
| Education | 49 | 54.4% |
| Literature & Languages | 0 | 0.0% |
| Liberal Arts & History | 21 | 23.3% |
| Visual & Performing Arts | 0 | 0.0% |
| Communications | 0 | 0.0% |
| Arts & Humanities | 14 | 15.6% |
| Total | 90 | 100.0% |
Transportation & Commute in Cienegas Terrace
Vehicle Availability by Sex in Cienegas Terrace
The most prevalent vehicle ownership categories in Cienegas Terrace are males with 2 vehicles (188, accounting for 51.4%) and females with 2 vehicles (170, making up 49.7%).
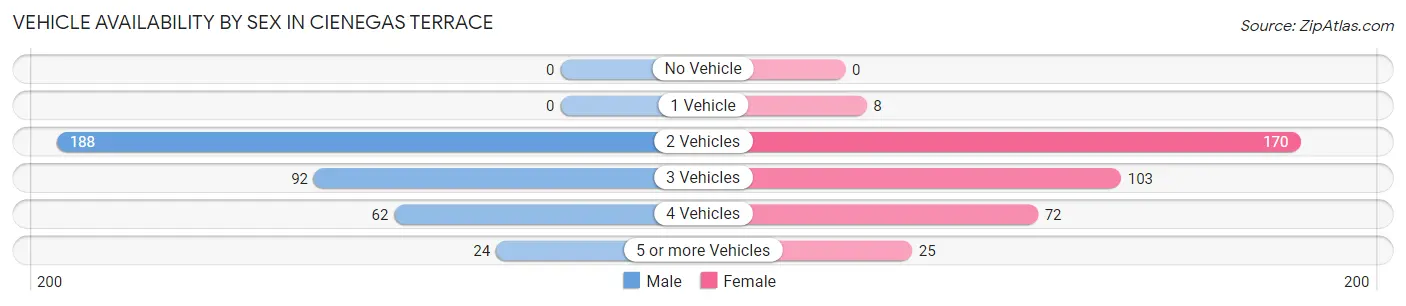
| Vehicles Available | Male | Female |
| No Vehicle | 0 (0.0%) | 0 (0.0%) |
| 1 Vehicle | 0 (0.0%) | 8 (2.1%) |
| 2 Vehicles | 188 (51.4%) | 170 (45.0%) |
| 3 Vehicles | 92 (25.1%) | 103 (27.3%) |
| 4 Vehicles | 62 (16.9%) | 72 (19.1%) |
| 5 or more Vehicles | 24 (6.6%) | 25 (6.6%) |
| Total | 366 (100.0%) | 378 (100.0%) |
Commute Time in Cienegas Terrace
The most frequently occuring commute durations in Cienegas Terrace are 10 to 14 minutes (216 commuters, 29.0%), 5 to 9 minutes (196 commuters, 26.3%), and 15 to 19 minutes (89 commuters, 12.0%).
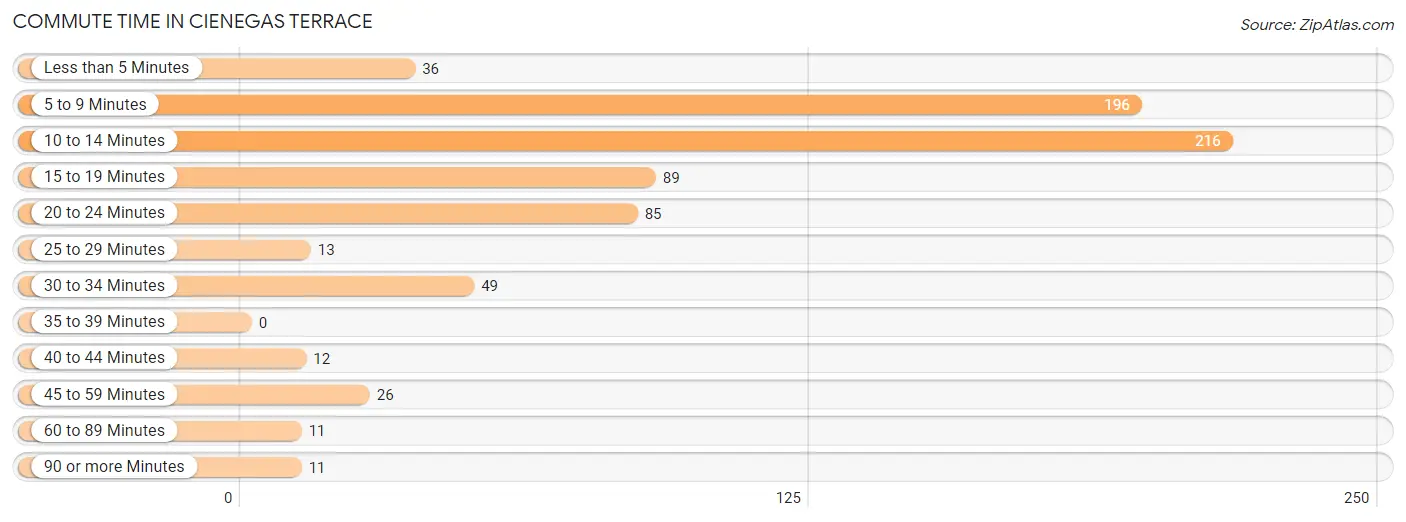
| Commute Time | # Commuters | % Commuters |
| Less than 5 Minutes | 36 | 4.8% |
| 5 to 9 Minutes | 196 | 26.3% |
| 10 to 14 Minutes | 216 | 29.0% |
| 15 to 19 Minutes | 89 | 12.0% |
| 20 to 24 Minutes | 85 | 11.4% |
| 25 to 29 Minutes | 13 | 1.8% |
| 30 to 34 Minutes | 49 | 6.6% |
| 35 to 39 Minutes | 0 | 0.0% |
| 40 to 44 Minutes | 12 | 1.6% |
| 45 to 59 Minutes | 26 | 3.5% |
| 60 to 89 Minutes | 11 | 1.5% |
| 90 or more Minutes | 11 | 1.5% |
Commute Time by Sex in Cienegas Terrace
The most common commute times in Cienegas Terrace are 20 to 24 minutes (85 commuters, 23.2%) for males and 10 to 14 minutes (153 commuters, 40.5%) for females.
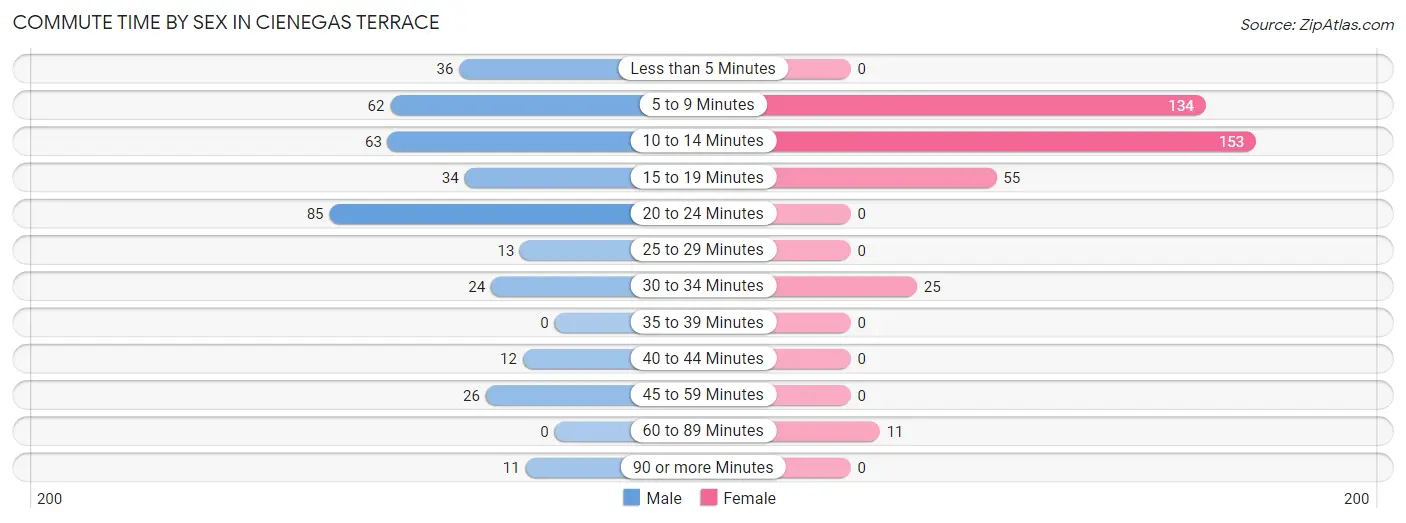
| Commute Time | Male | Female |
| Less than 5 Minutes | 36 (9.8%) | 0 (0.0%) |
| 5 to 9 Minutes | 62 (16.9%) | 134 (35.4%) |
| 10 to 14 Minutes | 63 (17.2%) | 153 (40.5%) |
| 15 to 19 Minutes | 34 (9.3%) | 55 (14.5%) |
| 20 to 24 Minutes | 85 (23.2%) | 0 (0.0%) |
| 25 to 29 Minutes | 13 (3.5%) | 0 (0.0%) |
| 30 to 34 Minutes | 24 (6.6%) | 25 (6.6%) |
| 35 to 39 Minutes | 0 (0.0%) | 0 (0.0%) |
| 40 to 44 Minutes | 12 (3.3%) | 0 (0.0%) |
| 45 to 59 Minutes | 26 (7.1%) | 0 (0.0%) |
| 60 to 89 Minutes | 0 (0.0%) | 11 (2.9%) |
| 90 or more Minutes | 11 (3.0%) | 0 (0.0%) |
Time of Departure to Work by Sex in Cienegas Terrace
The most frequent times of departure to work in Cienegas Terrace are 6:30 AM to 6:59 AM (73, 20.0%) for males and 9:00 AM to 9:59 AM (95, 25.1%) for females.
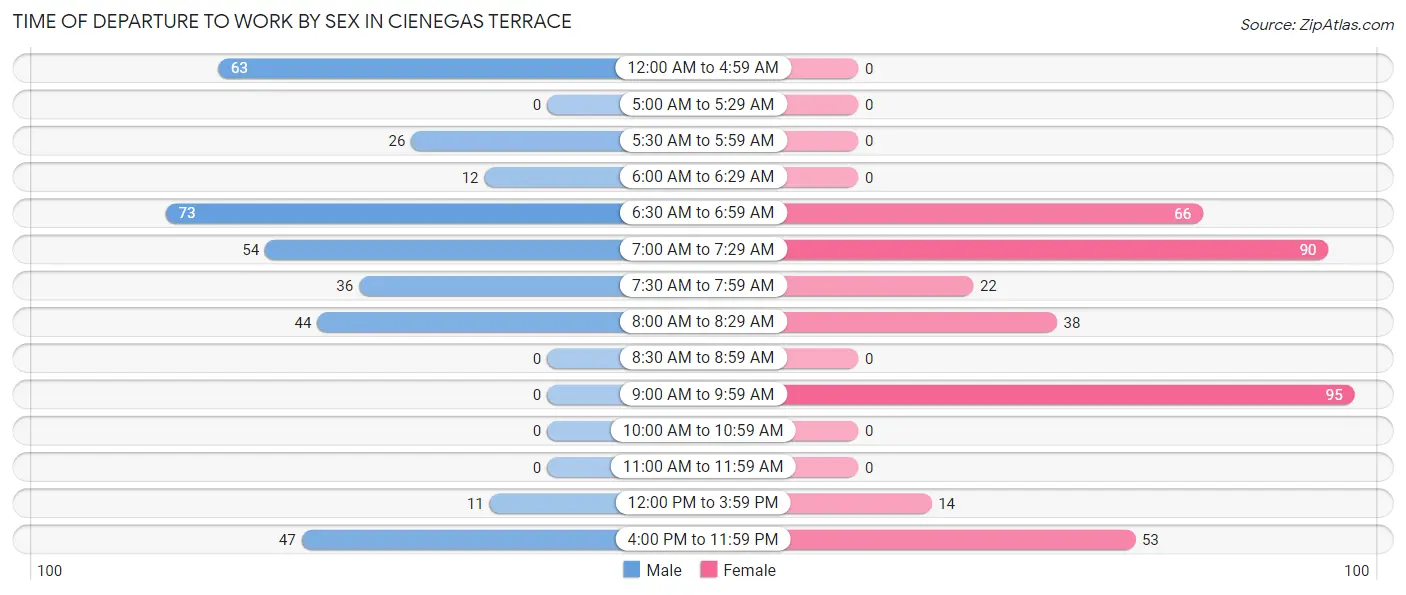
| Time of Departure | Male | Female |
| 12:00 AM to 4:59 AM | 63 (17.2%) | 0 (0.0%) |
| 5:00 AM to 5:29 AM | 0 (0.0%) | 0 (0.0%) |
| 5:30 AM to 5:59 AM | 26 (7.1%) | 0 (0.0%) |
| 6:00 AM to 6:29 AM | 12 (3.3%) | 0 (0.0%) |
| 6:30 AM to 6:59 AM | 73 (20.0%) | 66 (17.5%) |
| 7:00 AM to 7:29 AM | 54 (14.7%) | 90 (23.8%) |
| 7:30 AM to 7:59 AM | 36 (9.8%) | 22 (5.8%) |
| 8:00 AM to 8:29 AM | 44 (12.0%) | 38 (10.1%) |
| 8:30 AM to 8:59 AM | 0 (0.0%) | 0 (0.0%) |
| 9:00 AM to 9:59 AM | 0 (0.0%) | 95 (25.1%) |
| 10:00 AM to 10:59 AM | 0 (0.0%) | 0 (0.0%) |
| 11:00 AM to 11:59 AM | 0 (0.0%) | 0 (0.0%) |
| 12:00 PM to 3:59 PM | 11 (3.0%) | 14 (3.7%) |
| 4:00 PM to 11:59 PM | 47 (12.8%) | 53 (14.0%) |
| Total | 366 (100.0%) | 378 (100.0%) |
Housing Occupancy in Cienegas Terrace
Occupancy by Ownership in Cienegas Terrace
Of the total 595 dwellings in Cienegas Terrace, owner-occupied units account for 524 (88.1%), while renter-occupied units make up 71 (11.9%).
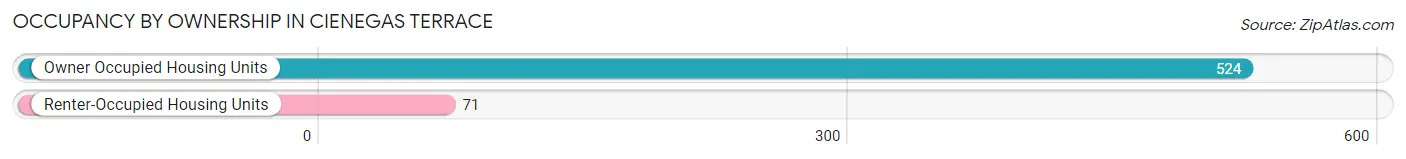
| Occupancy | # Housing Units | % Housing Units |
| Owner Occupied Housing Units | 524 | 88.1% |
| Renter-Occupied Housing Units | 71 | 11.9% |
| Total Occupied Housing Units | 595 | 100.0% |
Occupancy by Household Size in Cienegas Terrace
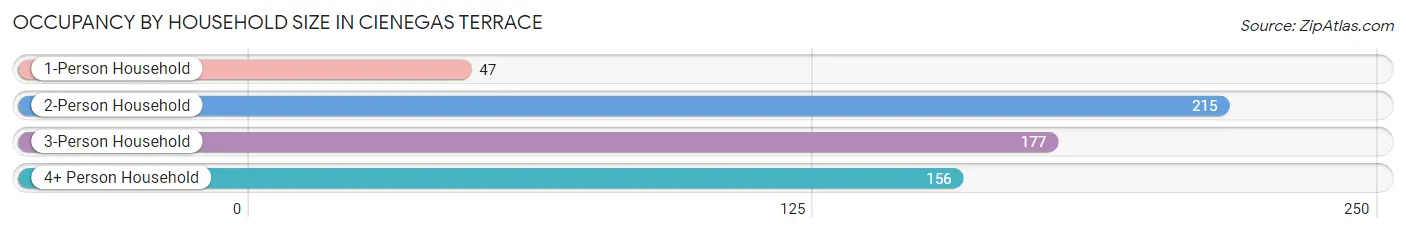
| Household Size | # Housing Units | % Housing Units |
| 1-Person Household | 47 | 7.9% |
| 2-Person Household | 215 | 36.1% |
| 3-Person Household | 177 | 29.7% |
| 4+ Person Household | 156 | 26.2% |
| Total Housing Units | 595 | 100.0% |
Occupancy by Ownership by Household Size in Cienegas Terrace
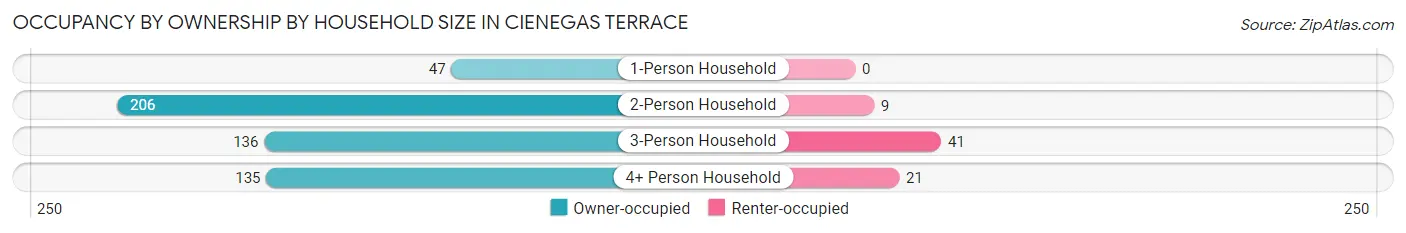
| Household Size | Owner-occupied | Renter-occupied |
| 1-Person Household | 47 (100.0%) | 0 (0.0%) |
| 2-Person Household | 206 (95.8%) | 9 (4.2%) |
| 3-Person Household | 136 (76.8%) | 41 (23.2%) |
| 4+ Person Household | 135 (86.5%) | 21 (13.5%) |
| Total Housing Units | 524 (88.1%) | 71 (11.9%) |
Occupancy by Educational Attainment in Cienegas Terrace
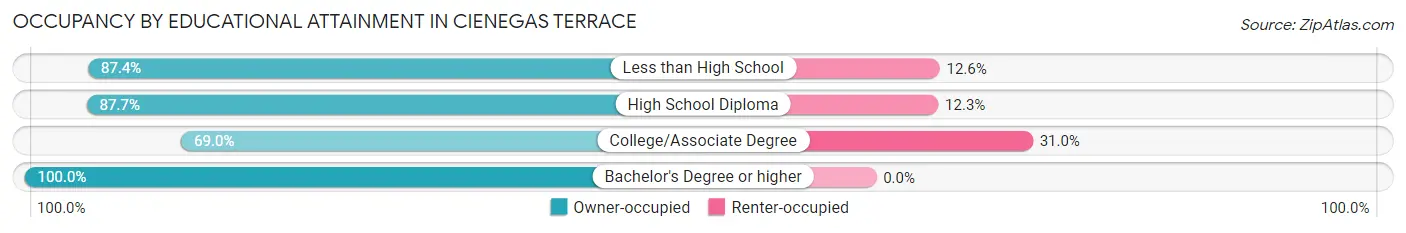
| Household Size | Owner-occupied | Renter-occupied |
| Less than High School | 181 (87.4%) | 26 (12.6%) |
| High School Diploma | 257 (87.7%) | 36 (12.3%) |
| College/Associate Degree | 20 (69.0%) | 9 (31.0%) |
| Bachelor's Degree or higher | 66 (100.0%) | 0 (0.0%) |
Occupancy by Age of Householder in Cienegas Terrace
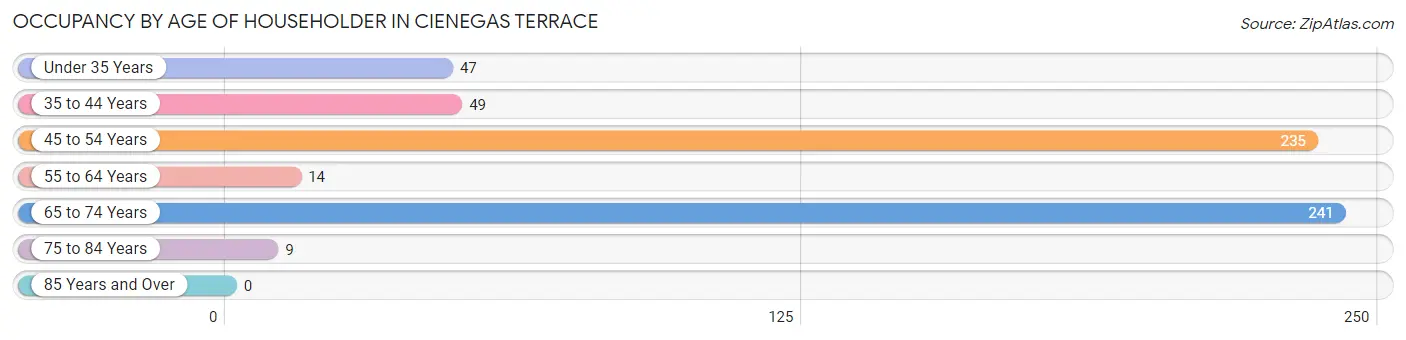
| Age Bracket | # Households | % Households |
| Under 35 Years | 47 | 7.9% |
| 35 to 44 Years | 49 | 8.2% |
| 45 to 54 Years | 235 | 39.5% |
| 55 to 64 Years | 14 | 2.4% |
| 65 to 74 Years | 241 | 40.5% |
| 75 to 84 Years | 9 | 1.5% |
| 85 Years and Over | 0 | 0.0% |
| Total | 595 | 100.0% |
Housing Finances in Cienegas Terrace
Median Income by Occupancy in Cienegas Terrace
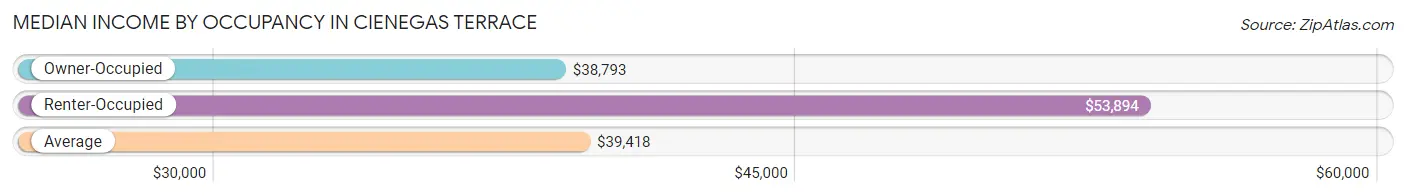
| Occupancy Type | # Households | Median Income |
| Owner-Occupied | 524 (88.1%) | $38,793 |
| Renter-Occupied | 71 (11.9%) | $53,894 |
| Average | 595 (100.0%) | $39,418 |
Occupancy by Householder Income Bracket in Cienegas Terrace
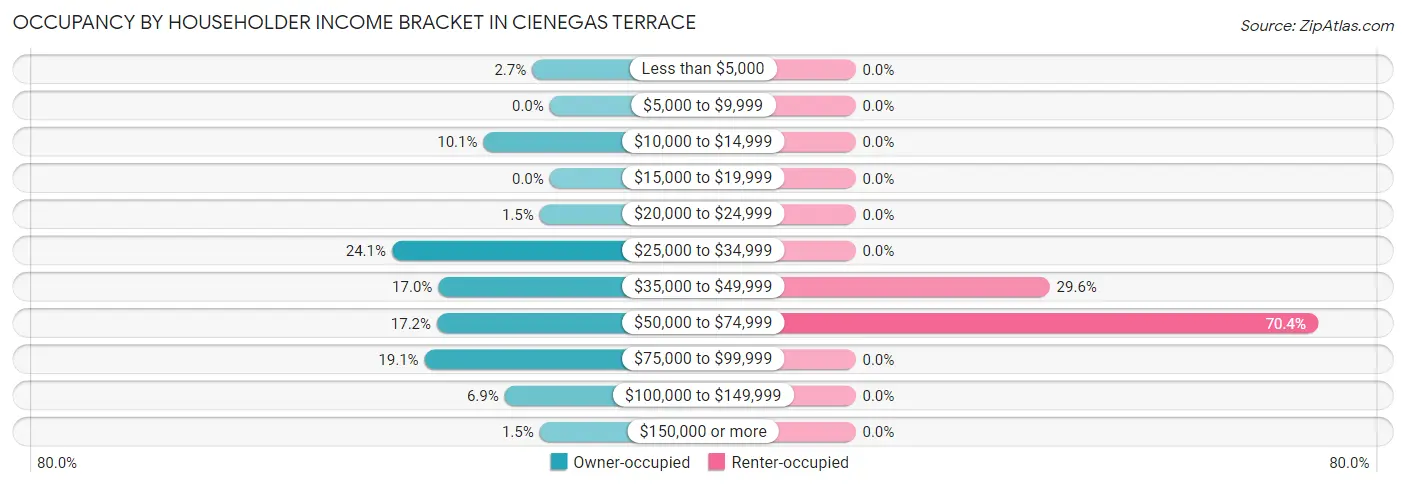
| Income Bracket | Owner-occupied | Renter-occupied |
| Less than $5,000 | 14 (2.7%) | 0 (0.0%) |
| $5,000 to $9,999 | 0 (0.0%) | 0 (0.0%) |
| $10,000 to $14,999 | 53 (10.1%) | 0 (0.0%) |
| $15,000 to $19,999 | 0 (0.0%) | 0 (0.0%) |
| $20,000 to $24,999 | 8 (1.5%) | 0 (0.0%) |
| $25,000 to $34,999 | 126 (24.0%) | 0 (0.0%) |
| $35,000 to $49,999 | 89 (17.0%) | 21 (29.6%) |
| $50,000 to $74,999 | 90 (17.2%) | 50 (70.4%) |
| $75,000 to $99,999 | 100 (19.1%) | 0 (0.0%) |
| $100,000 to $149,999 | 36 (6.9%) | 0 (0.0%) |
| $150,000 or more | 8 (1.5%) | 0 (0.0%) |
| Total | 524 (100.0%) | 71 (100.0%) |
Monthly Housing Cost Tiers in Cienegas Terrace
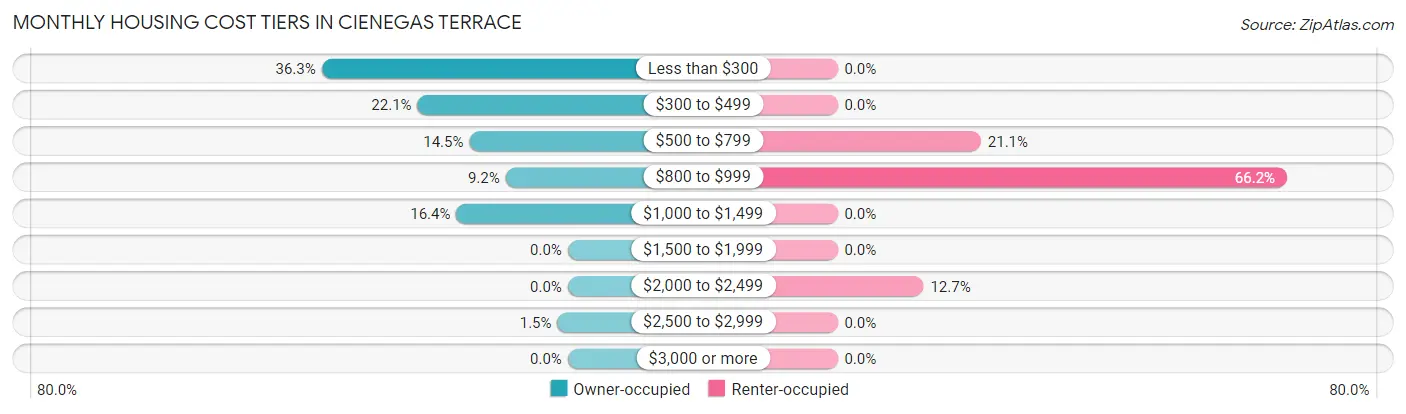
| Monthly Cost | Owner-occupied | Renter-occupied |
| Less than $300 | 190 (36.3%) | 0 (0.0%) |
| $300 to $499 | 116 (22.1%) | 0 (0.0%) |
| $500 to $799 | 76 (14.5%) | 15 (21.1%) |
| $800 to $999 | 48 (9.2%) | 47 (66.2%) |
| $1,000 to $1,499 | 86 (16.4%) | 0 (0.0%) |
| $1,500 to $1,999 | 0 (0.0%) | 0 (0.0%) |
| $2,000 to $2,499 | 0 (0.0%) | 9 (12.7%) |
| $2,500 to $2,999 | 8 (1.5%) | 0 (0.0%) |
| $3,000 or more | 0 (0.0%) | 0 (0.0%) |
| Total | 524 (100.0%) | 71 (100.0%) |
Physical Housing Characteristics in Cienegas Terrace
Housing Structures in Cienegas Terrace
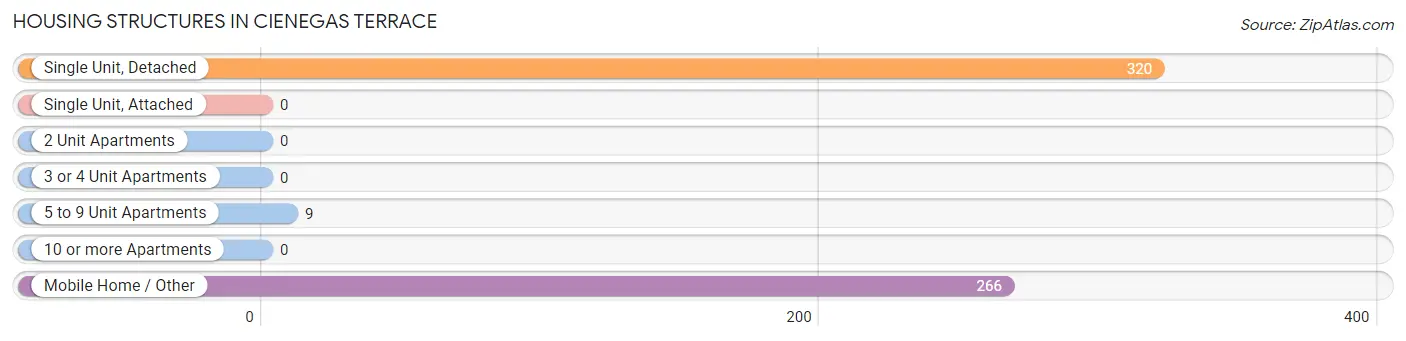
| Structure Type | # Housing Units | % Housing Units |
| Single Unit, Detached | 320 | 53.8% |
| Single Unit, Attached | 0 | 0.0% |
| 2 Unit Apartments | 0 | 0.0% |
| 3 or 4 Unit Apartments | 0 | 0.0% |
| 5 to 9 Unit Apartments | 9 | 1.5% |
| 10 or more Apartments | 0 | 0.0% |
| Mobile Home / Other | 266 | 44.7% |
| Total | 595 | 100.0% |
Housing Structures by Occupancy in Cienegas Terrace
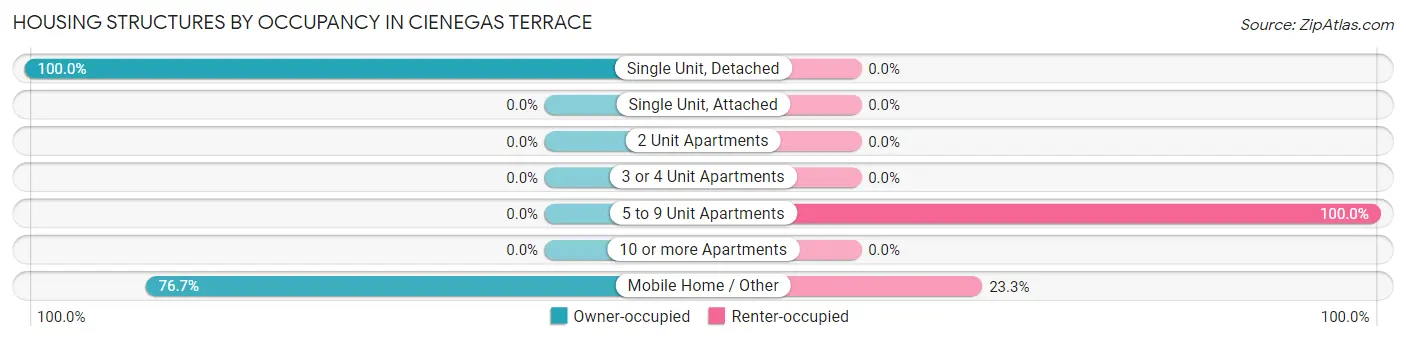
| Structure Type | Owner-occupied | Renter-occupied |
| Single Unit, Detached | 320 (100.0%) | 0 (0.0%) |
| Single Unit, Attached | 0 (0.0%) | 0 (0.0%) |
| 2 Unit Apartments | 0 (0.0%) | 0 (0.0%) |
| 3 or 4 Unit Apartments | 0 (0.0%) | 0 (0.0%) |
| 5 to 9 Unit Apartments | 0 (0.0%) | 9 (100.0%) |
| 10 or more Apartments | 0 (0.0%) | 0 (0.0%) |
| Mobile Home / Other | 204 (76.7%) | 62 (23.3%) |
| Total | 524 (88.1%) | 71 (11.9%) |
Housing Structures by Number of Rooms in Cienegas Terrace
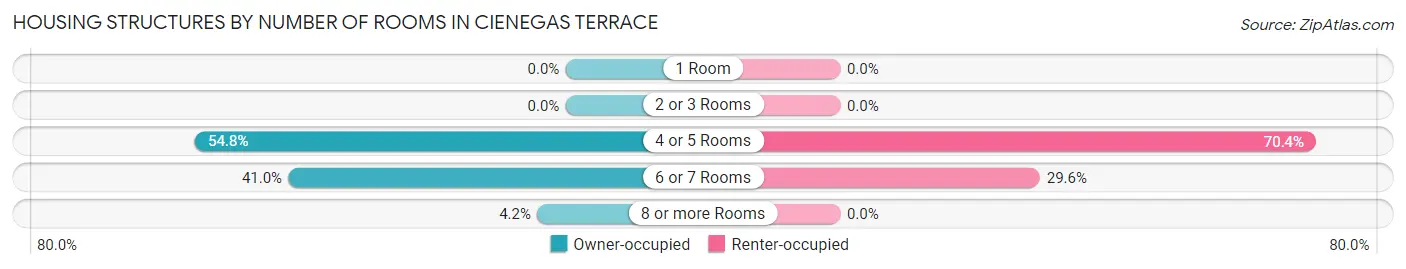
| Number of Rooms | Owner-occupied | Renter-occupied |
| 1 Room | 0 (0.0%) | 0 (0.0%) |
| 2 or 3 Rooms | 0 (0.0%) | 0 (0.0%) |
| 4 or 5 Rooms | 287 (54.8%) | 50 (70.4%) |
| 6 or 7 Rooms | 215 (41.0%) | 21 (29.6%) |
| 8 or more Rooms | 22 (4.2%) | 0 (0.0%) |
| Total | 524 (100.0%) | 71 (100.0%) |
Housing Structure by Heating Type in Cienegas Terrace
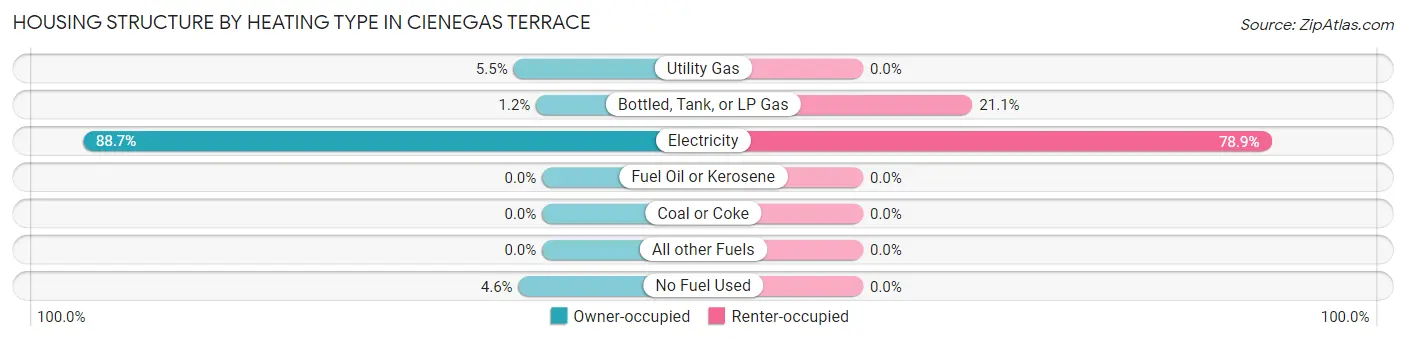
| Heating Type | Owner-occupied | Renter-occupied |
| Utility Gas | 29 (5.5%) | 0 (0.0%) |
| Bottled, Tank, or LP Gas | 6 (1.1%) | 15 (21.1%) |
| Electricity | 465 (88.7%) | 56 (78.9%) |
| Fuel Oil or Kerosene | 0 (0.0%) | 0 (0.0%) |
| Coal or Coke | 0 (0.0%) | 0 (0.0%) |
| All other Fuels | 0 (0.0%) | 0 (0.0%) |
| No Fuel Used | 24 (4.6%) | 0 (0.0%) |
| Total | 524 (100.0%) | 71 (100.0%) |
Household Vehicle Usage in Cienegas Terrace
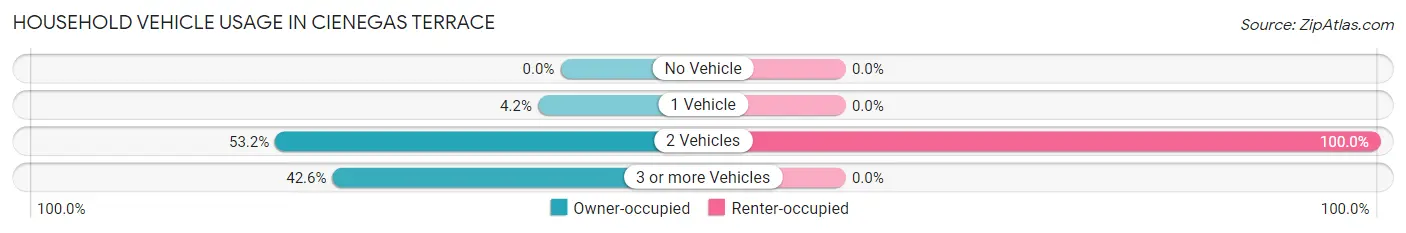
| Vehicles per Household | Owner-occupied | Renter-occupied |
| No Vehicle | 0 (0.0%) | 0 (0.0%) |
| 1 Vehicle | 22 (4.2%) | 0 (0.0%) |
| 2 Vehicles | 279 (53.2%) | 71 (100.0%) |
| 3 or more Vehicles | 223 (42.6%) | 0 (0.0%) |
| Total | 524 (100.0%) | 71 (100.0%) |
Real Estate & Mortgages in Cienegas Terrace
Real Estate and Mortgage Overview in Cienegas Terrace
| Characteristic | Without Mortgage | With Mortgage |
| Housing Units | 382 | 142 |
| Median Property Value | $76,200 | $161,800 |
| Median Household Income | $35,242 | $8 |
| Monthly Housing Costs | $301 | $0 |
| Real Estate Taxes | $337 | $0 |
Property Value by Mortgage Status in Cienegas Terrace
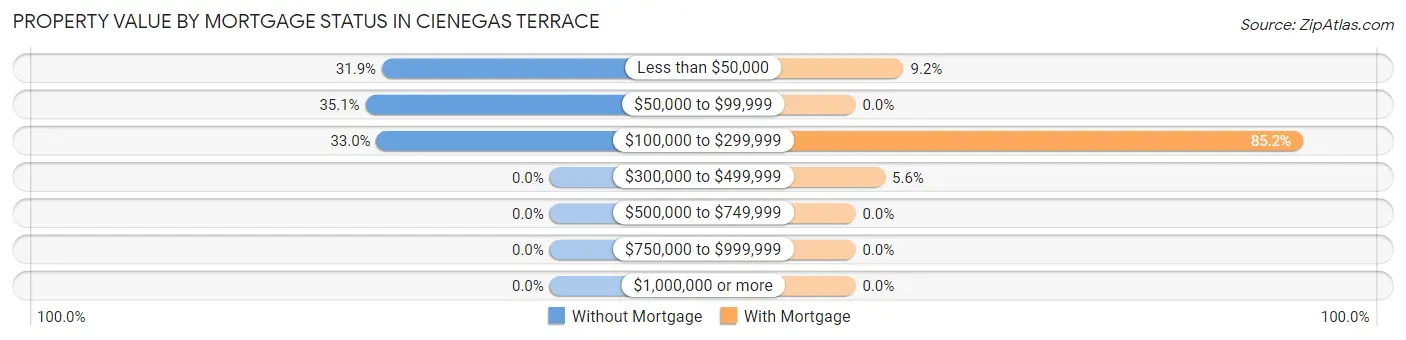
| Property Value | Without Mortgage | With Mortgage |
| Less than $50,000 | 122 (31.9%) | 13 (9.1%) |
| $50,000 to $99,999 | 134 (35.1%) | 0 (0.0%) |
| $100,000 to $299,999 | 126 (33.0%) | 121 (85.2%) |
| $300,000 to $499,999 | 0 (0.0%) | 8 (5.6%) |
| $500,000 to $749,999 | 0 (0.0%) | 0 (0.0%) |
| $750,000 to $999,999 | 0 (0.0%) | 0 (0.0%) |
| $1,000,000 or more | 0 (0.0%) | 0 (0.0%) |
| Total | 382 (100.0%) | 142 (100.0%) |
Household Income by Mortgage Status in Cienegas Terrace
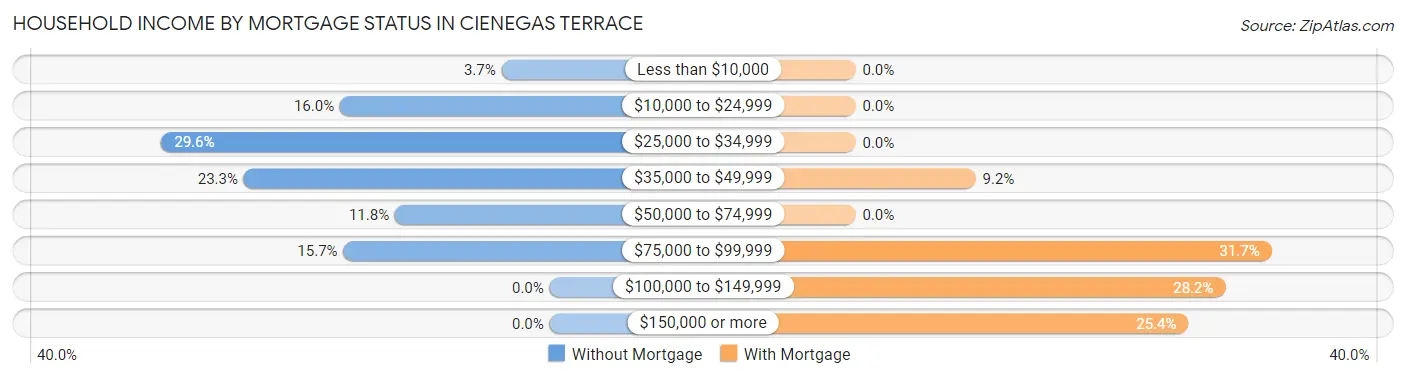
| Household Income | Without Mortgage | With Mortgage |
| Less than $10,000 | 14 (3.7%) | 0 (0.0%) |
| $10,000 to $24,999 | 61 (16.0%) | 0 (0.0%) |
| $25,000 to $34,999 | 113 (29.6%) | 0 (0.0%) |
| $35,000 to $49,999 | 89 (23.3%) | 13 (9.1%) |
| $50,000 to $74,999 | 45 (11.8%) | 0 (0.0%) |
| $75,000 to $99,999 | 60 (15.7%) | 45 (31.7%) |
| $100,000 to $149,999 | 0 (0.0%) | 40 (28.2%) |
| $150,000 or more | 0 (0.0%) | 36 (25.4%) |
| Total | 382 (100.0%) | 142 (100.0%) |
Property Value to Household Income Ratio in Cienegas Terrace
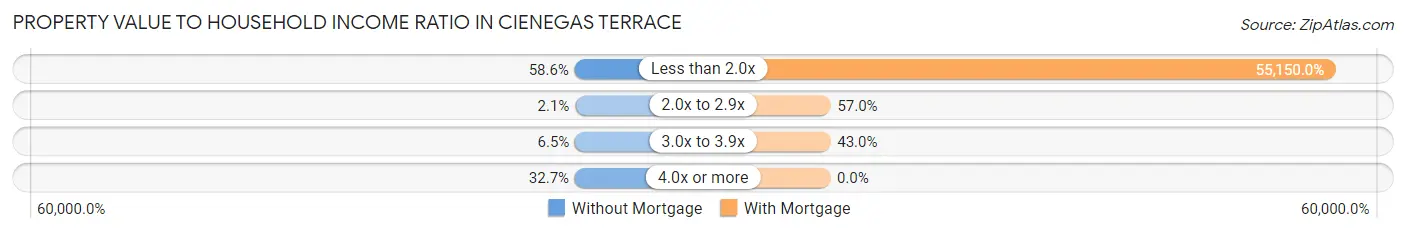
| Value-to-Income Ratio | Without Mortgage | With Mortgage |
| Less than 2.0x | 224 (58.6%) | 78,313 (55,150.0%) |
| 2.0x to 2.9x | 8 (2.1%) | 81 (57.0%) |
| 3.0x to 3.9x | 25 (6.5%) | 61 (43.0%) |
| 4.0x or more | 125 (32.7%) | 0 (0.0%) |
| Total | 382 (100.0%) | 142 (100.0%) |
Real Estate Taxes by Mortgage Status in Cienegas Terrace
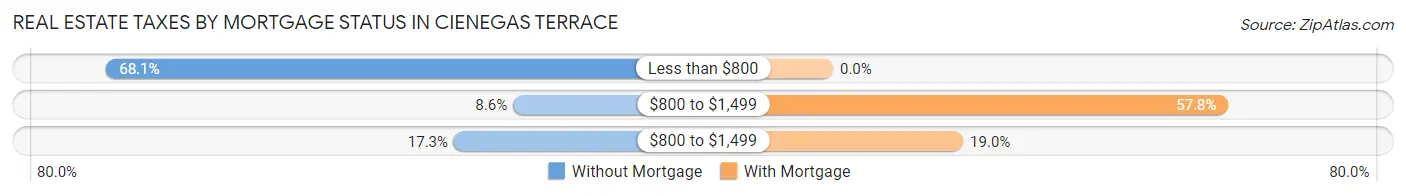
| Property Taxes | Without Mortgage | With Mortgage |
| Less than $800 | 260 (68.1%) | 0 (0.0%) |
| $800 to $1,499 | 33 (8.6%) | 82 (57.8%) |
| $800 to $1,499 | 66 (17.3%) | 27 (19.0%) |
| Total | 382 (100.0%) | 142 (100.0%) |
Health & Disability in Cienegas Terrace
Health Insurance Coverage by Age in Cienegas Terrace
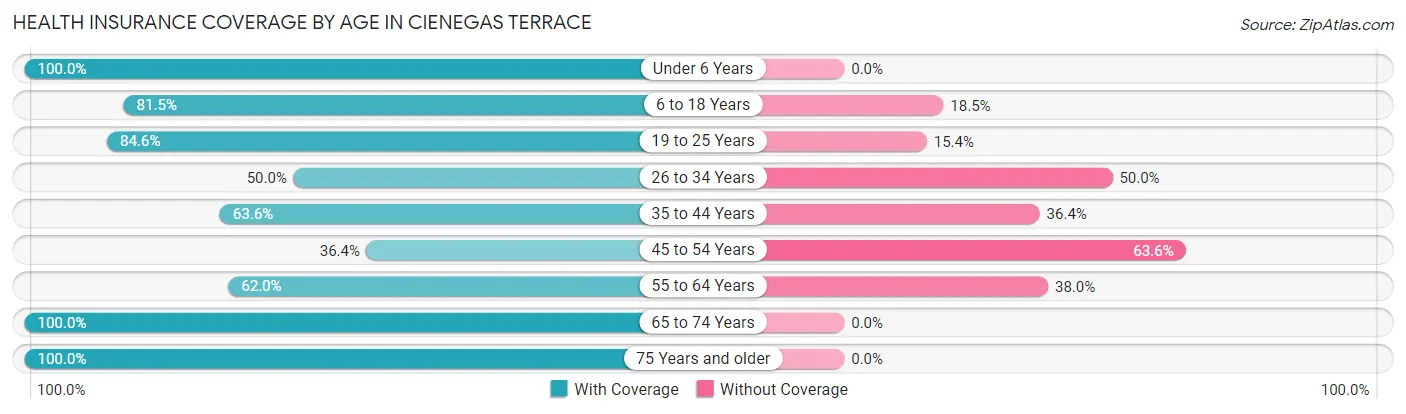
| Age Bracket | With Coverage | Without Coverage |
| Under 6 Years | 94 (100.0%) | 0 (0.0%) |
| 6 to 18 Years | 269 (81.5%) | 61 (18.5%) |
| 19 to 25 Years | 110 (84.6%) | 20 (15.4%) |
| 26 to 34 Years | 44 (50.0%) | 44 (50.0%) |
| 35 to 44 Years | 89 (63.6%) | 51 (36.4%) |
| 45 to 54 Years | 159 (36.4%) | 278 (63.6%) |
| 55 to 64 Years | 31 (62.0%) | 19 (38.0%) |
| 65 to 74 Years | 355 (100.0%) | 0 (0.0%) |
| 75 Years and older | 17 (100.0%) | 0 (0.0%) |
| Total | 1,168 (71.2%) | 473 (28.8%) |
Health Insurance Coverage by Citizenship Status in Cienegas Terrace
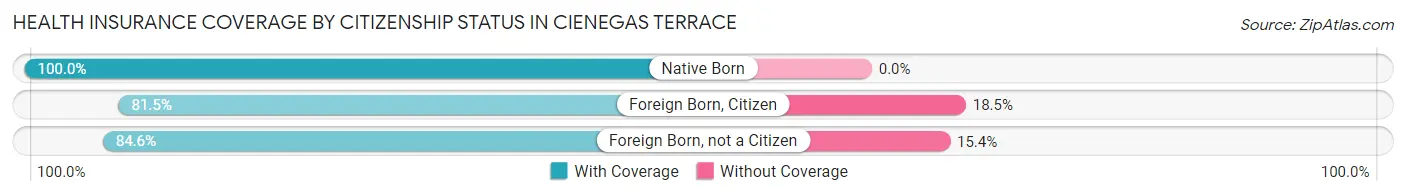
| Citizenship Status | With Coverage | Without Coverage |
| Native Born | 94 (100.0%) | 0 (0.0%) |
| Foreign Born, Citizen | 269 (81.5%) | 61 (18.5%) |
| Foreign Born, not a Citizen | 110 (84.6%) | 20 (15.4%) |
Health Insurance Coverage by Household Income in Cienegas Terrace
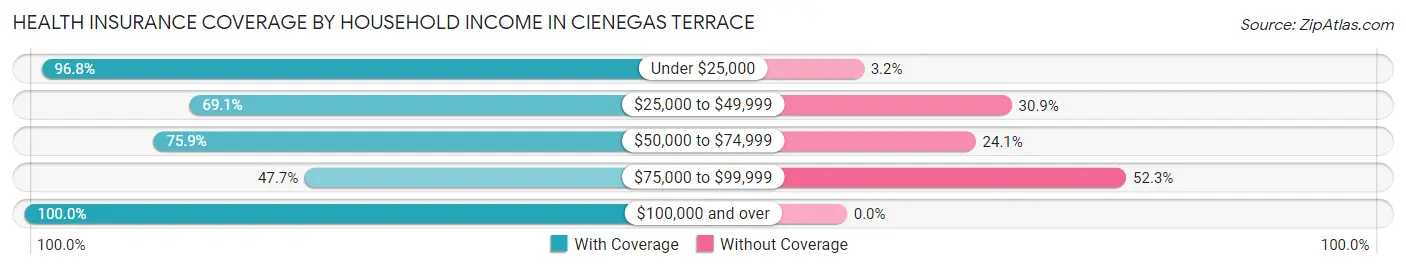
| Household Income | With Coverage | Without Coverage |
| Under $25,000 | 122 (96.8%) | 4 (3.2%) |
| $25,000 to $49,999 | 461 (69.1%) | 206 (30.9%) |
| $50,000 to $74,999 | 264 (75.9%) | 84 (24.1%) |
| $75,000 to $99,999 | 163 (47.7%) | 179 (52.3%) |
| $100,000 and over | 158 (100.0%) | 0 (0.0%) |
Public vs Private Health Insurance Coverage by Age in Cienegas Terrace
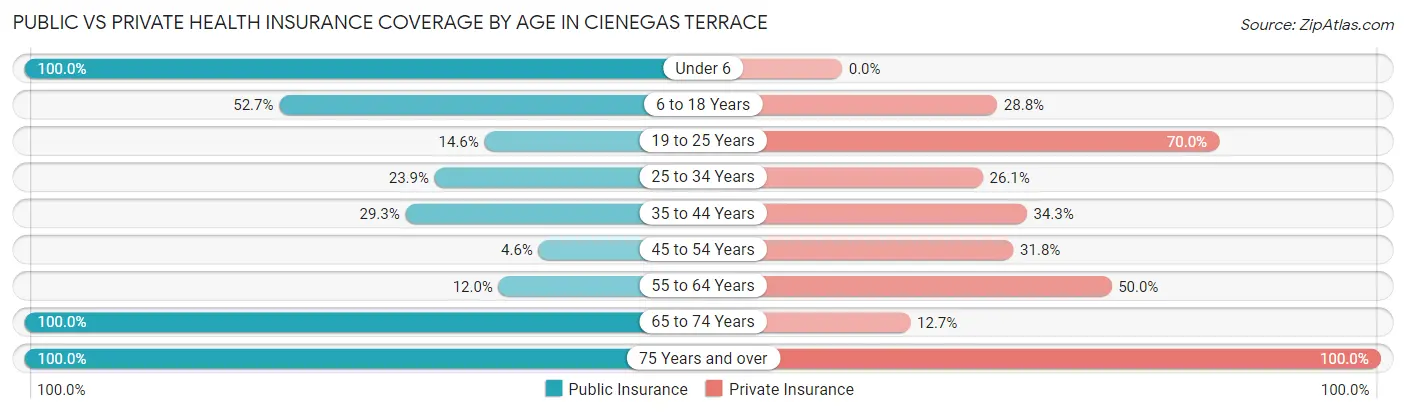
| Age Bracket | Public Insurance | Private Insurance |
| Under 6 | 94 (100.0%) | 0 (0.0%) |
| 6 to 18 Years | 174 (52.7%) | 95 (28.8%) |
| 19 to 25 Years | 19 (14.6%) | 91 (70.0%) |
| 25 to 34 Years | 21 (23.9%) | 23 (26.1%) |
| 35 to 44 Years | 41 (29.3%) | 48 (34.3%) |
| 45 to 54 Years | 20 (4.6%) | 139 (31.8%) |
| 55 to 64 Years | 6 (12.0%) | 25 (50.0%) |
| 65 to 74 Years | 355 (100.0%) | 45 (12.7%) |
| 75 Years and over | 17 (100.0%) | 17 (100.0%) |
| Total | 747 (45.5%) | 483 (29.4%) |
Disability Status by Sex by Age in Cienegas Terrace
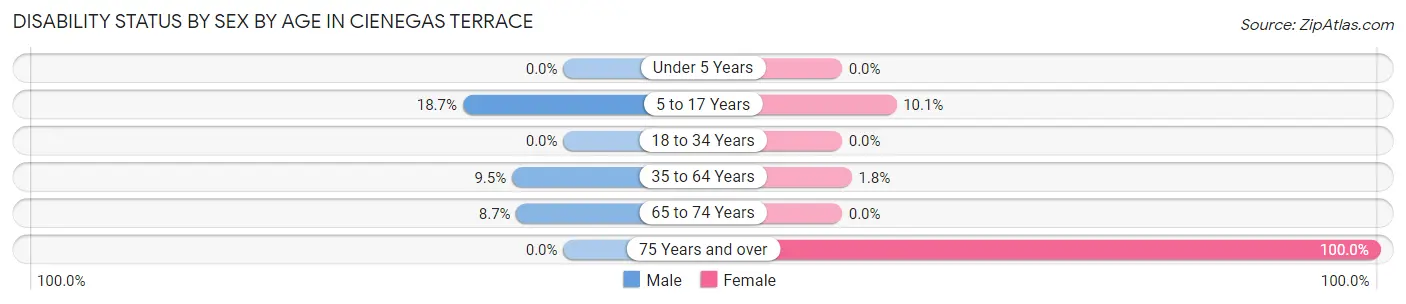
| Age Bracket | Male | Female |
| Under 5 Years | 0 (0.0%) | 0 (0.0%) |
| 5 to 17 Years | 39 (18.7%) | 10 (10.1%) |
| 18 to 34 Years | 0 (0.0%) | 0 (0.0%) |
| 35 to 64 Years | 28 (9.5%) | 6 (1.8%) |
| 65 to 74 Years | 21 (8.7%) | 0 (0.0%) |
| 75 Years and over | 0 (0.0%) | 8 (100.0%) |
Disability Class by Sex by Age in Cienegas Terrace
Disability Class: Hearing Difficulty
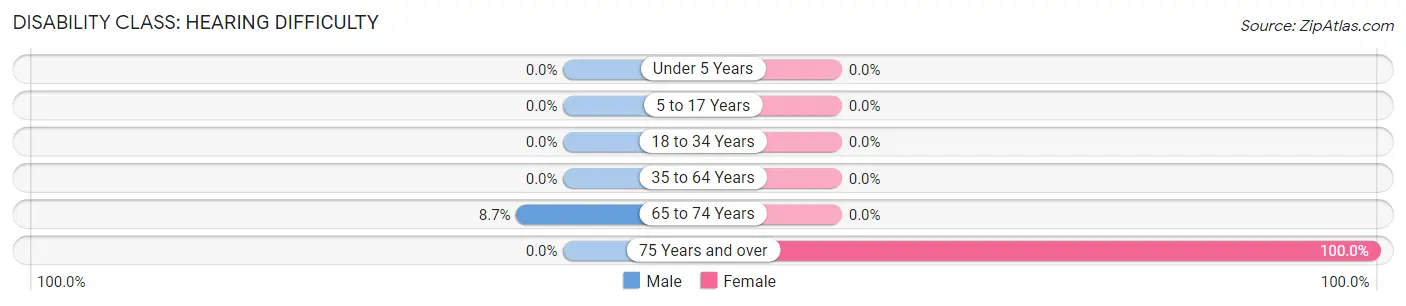
| Age Bracket | Male | Female |
| Under 5 Years | 0 (0.0%) | 0 (0.0%) |
| 5 to 17 Years | 0 (0.0%) | 0 (0.0%) |
| 18 to 34 Years | 0 (0.0%) | 0 (0.0%) |
| 35 to 64 Years | 0 (0.0%) | 0 (0.0%) |
| 65 to 74 Years | 21 (8.7%) | 0 (0.0%) |
| 75 Years and over | 0 (0.0%) | 8 (100.0%) |
Disability Class: Vision Difficulty
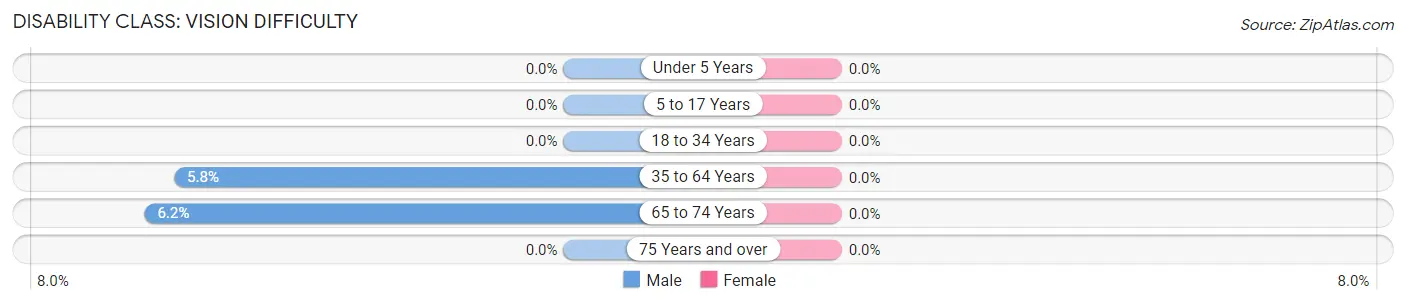
| Age Bracket | Male | Female |
| Under 5 Years | 0 (0.0%) | 0 (0.0%) |
| 5 to 17 Years | 0 (0.0%) | 0 (0.0%) |
| 18 to 34 Years | 0 (0.0%) | 0 (0.0%) |
| 35 to 64 Years | 17 (5.8%) | 0 (0.0%) |
| 65 to 74 Years | 15 (6.2%) | 0 (0.0%) |
| 75 Years and over | 0 (0.0%) | 0 (0.0%) |
Disability Class: Cognitive Difficulty
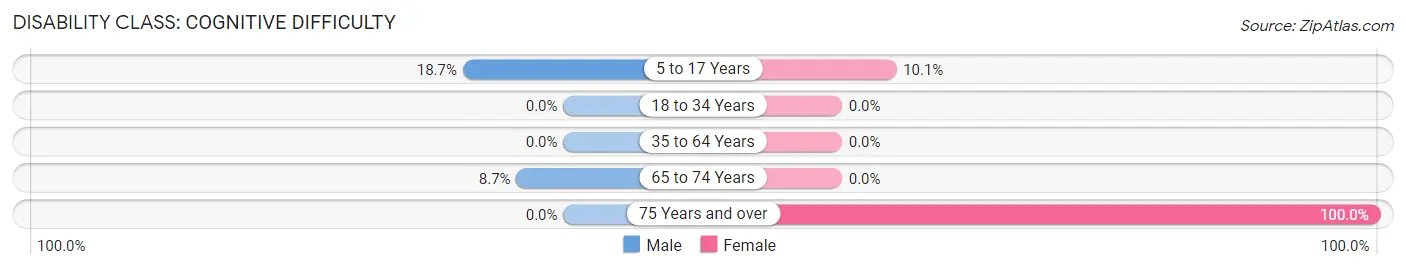
| Age Bracket | Male | Female |
| 5 to 17 Years | 39 (18.7%) | 10 (10.1%) |
| 18 to 34 Years | 0 (0.0%) | 0 (0.0%) |
| 35 to 64 Years | 0 (0.0%) | 0 (0.0%) |
| 65 to 74 Years | 21 (8.7%) | 0 (0.0%) |
| 75 Years and over | 0 (0.0%) | 8 (100.0%) |
Disability Class: Ambulatory Difficulty
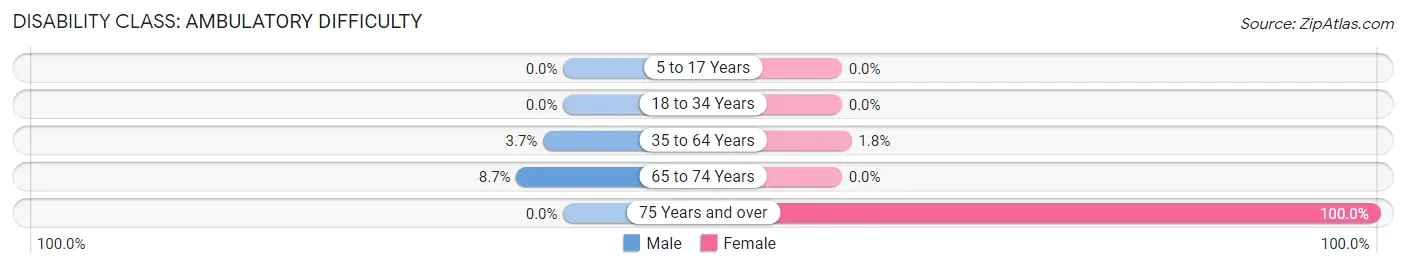
| Age Bracket | Male | Female |
| 5 to 17 Years | 0 (0.0%) | 0 (0.0%) |
| 18 to 34 Years | 0 (0.0%) | 0 (0.0%) |
| 35 to 64 Years | 11 (3.7%) | 6 (1.8%) |
| 65 to 74 Years | 21 (8.7%) | 0 (0.0%) |
| 75 Years and over | 0 (0.0%) | 8 (100.0%) |
Disability Class: Self-Care Difficulty
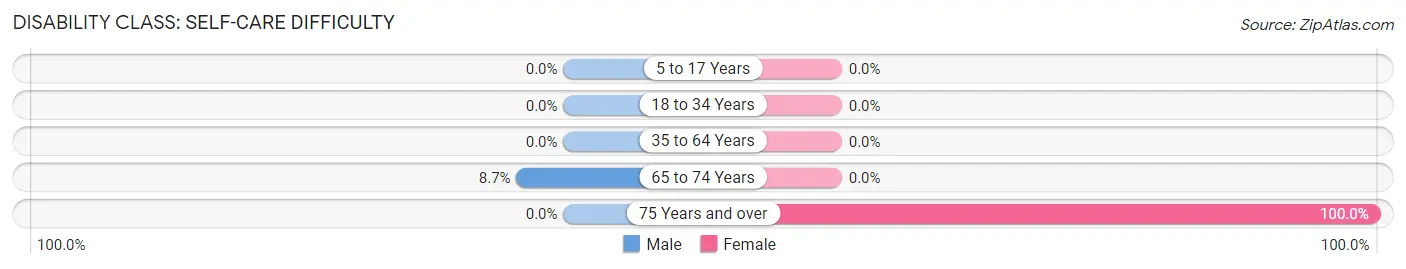
| Age Bracket | Male | Female |
| 5 to 17 Years | 0 (0.0%) | 0 (0.0%) |
| 18 to 34 Years | 0 (0.0%) | 0 (0.0%) |
| 35 to 64 Years | 0 (0.0%) | 0 (0.0%) |
| 65 to 74 Years | 21 (8.7%) | 0 (0.0%) |
| 75 Years and over | 0 (0.0%) | 8 (100.0%) |
Technology Access in Cienegas Terrace
Computing Device Access in Cienegas Terrace
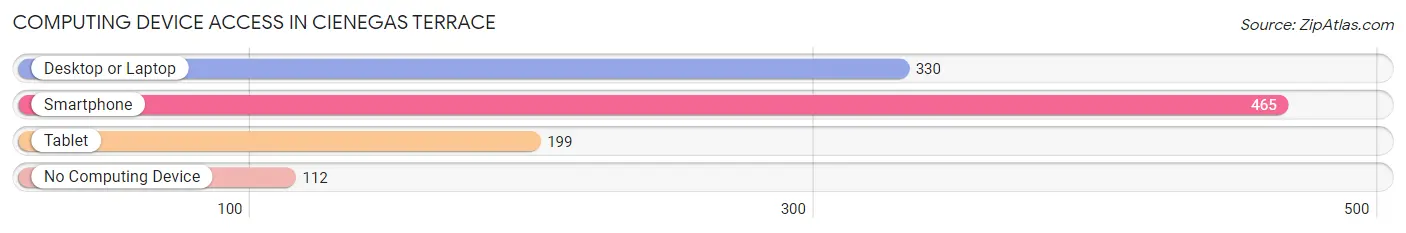
| Device Type | # Households | % Households |
| Desktop or Laptop | 330 | 55.5% |
| Smartphone | 465 | 78.1% |
| Tablet | 199 | 33.5% |
| No Computing Device | 112 | 18.8% |
| Total | 595 | 100.0% |
Internet Access in Cienegas Terrace
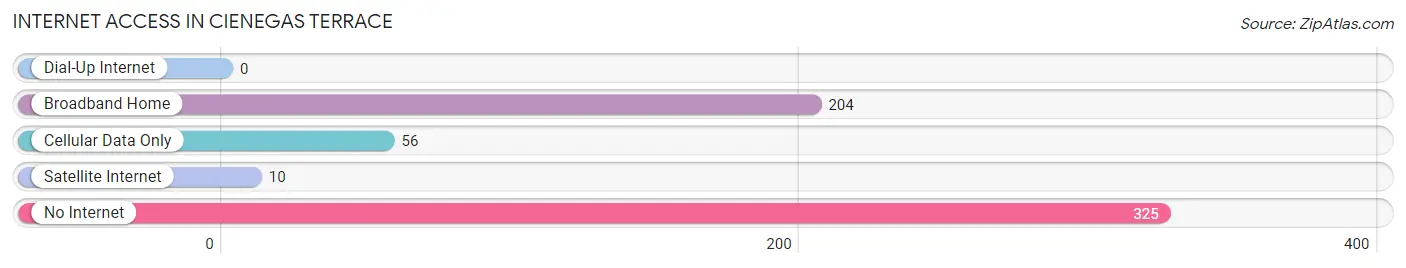
| Internet Type | # Households | % Households |
| Dial-Up Internet | 0 | 0.0% |
| Broadband Home | 204 | 34.3% |
| Cellular Data Only | 56 | 9.4% |
| Satellite Internet | 10 | 1.7% |
| No Internet | 325 | 54.6% |
| Total | 595 | 100.0% |
Cienegas Terrace Summary
Cienegas Terrace is a small unincorporated community located in the western part of Uvalde County, Texas. It is situated on the banks of the Nueces River, approximately 10 miles south of Uvalde, the county seat. The population of Cienegas Terrace was estimated to be around 200 people in 2020.
History
Cienegas Terrace was founded in the late 1800s by a group of settlers from Mexico. The settlers were attracted to the area due to its fertile soil and abundant water supply. The settlers named the area Cienegas Terrace, which translates to “hundred springs” in Spanish. The settlers built a small church and a school, and the community quickly grew.
In the early 1900s, the community was home to a number of businesses, including a general store, a blacksmith shop, and a cotton gin. The community also had a post office, which was established in 1906.
Geography
Cienegas Terrace is located in the western part of Uvalde County, Texas. It is situated on the banks of the Nueces River, approximately 10 miles south of Uvalde, the county seat. The terrain in the area is mostly flat, with some rolling hills. The climate is semi-arid, with hot summers and mild winters.
Economy
The economy of Cienegas Terrace is largely based on agriculture. The area is known for its production of cotton, corn, and sorghum. The community also has a number of small businesses, including a general store, a gas station, and a restaurant.
Demographics
The population of Cienegas Terrace was estimated to be around 200 people in 2020. The racial makeup of the community is predominantly Hispanic, with a small percentage of African Americans and other races. The median household income in the area is around $30,000, and the median home value is around $90,000.
Conclusion
Cienegas Terrace is a small unincorporated community located in the western part of Uvalde County, Texas. It was founded in the late 1800s by a group of settlers from Mexico, and the population of the community is estimated to be around 200 people. The economy of Cienegas Terrace is largely based on agriculture, and the racial makeup of the community is predominantly Hispanic.
Common Questions
What is Per Capita Income in Cienegas Terrace?
Per Capita income in Cienegas Terrace is $19,260.
What is the Median Family Income in Cienegas Terrace?
Median Family Income in Cienegas Terrace is $53,235.
What is the Median Household income in Cienegas Terrace?
Median Household Income in Cienegas Terrace is $39,418.
What is Income or Wage Gap in Cienegas Terrace?
Income or Wage Gap in Cienegas Terrace is 54.7%.
Women in Cienegas Terrace earn 45.3 cents for every dollar earned by a man.
What is Inequality or Gini Index in Cienegas Terrace?
Inequality or Gini Index in Cienegas Terrace is 0.35.
What is the Total Population of Cienegas Terrace?
Total Population of Cienegas Terrace is 1,653.
What is the Total Male Population of Cienegas Terrace?
Total Male Population of Cienegas Terrace is 933.
What is the Total Female Population of Cienegas Terrace?
Total Female Population of Cienegas Terrace is 720.
What is the Ratio of Males per 100 Females in Cienegas Terrace?
There are 129.58 Males per 100 Females in Cienegas Terrace.
What is the Ratio of Females per 100 Males in Cienegas Terrace?
There are 77.17 Females per 100 Males in Cienegas Terrace.
What is the Median Population Age in Cienegas Terrace?
Median Population Age in Cienegas Terrace is 46.2 Years.
What is the Average Family Size in Cienegas Terrace
Average Family Size in Cienegas Terrace is 2.9 People.
What is the Average Household Size in Cienegas Terrace
Average Household Size in Cienegas Terrace is 2.8 People.
How Large is the Labor Force in Cienegas Terrace?
There are 763 People in the Labor Forcein in Cienegas Terrace.
What is the Percentage of People in the Labor Force in Cienegas Terrace?
56.8% of People are in the Labor Force in Cienegas Terrace.
What is the Unemployment Rate in Cienegas Terrace?
Unemployment Rate in Cienegas Terrace is 2.7%.