Zip Codes with the Highest Percentage of Population with a Degree in Liberal Arts and History in Corpus Christi, TX
RELATED REPORTS & OPTIONS
Liberal Arts and History
Corpus Christi
Compare Zip Codes
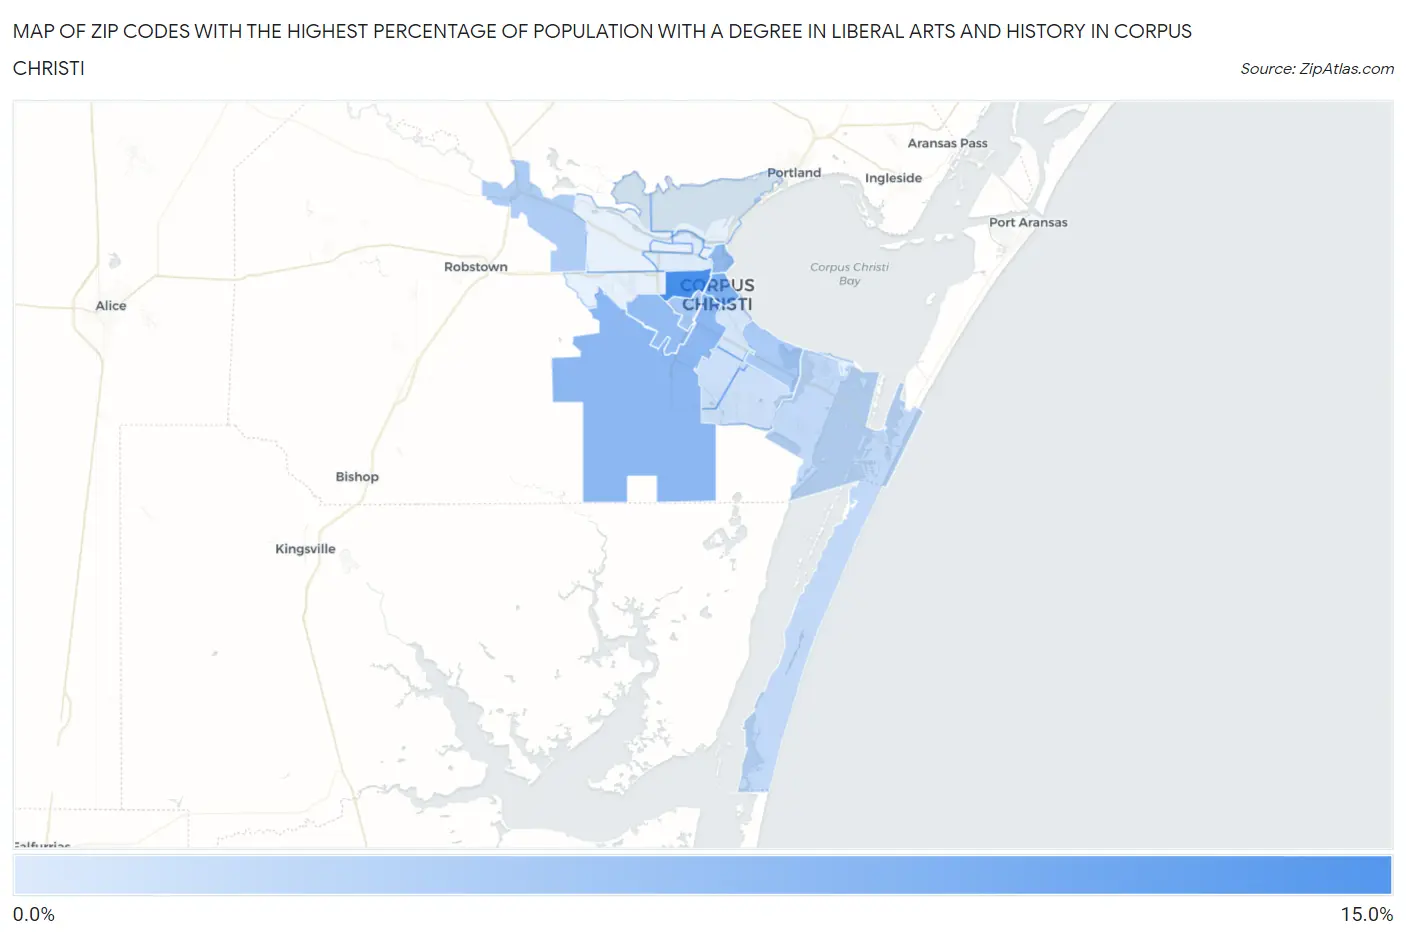
Map of Zip Codes with the Highest Percentage of Population with a Degree in Liberal Arts and History in Corpus Christi
0.0%
15.0%
Zip Codes with the Highest Percentage of Population with a Degree in Liberal Arts and History in Corpus Christi, TX
| Zip Code | % Graduates | vs State | vs National | |
| 1. | 78405 | 10.8% | 4.2%(+6.63)#128 | 4.9%(+5.91)#2,654 |
| 2. | 78404 | 7.5% | 4.2%(+3.30)#276 | 4.9%(+2.58)#5,666 |
| 3. | 78415 | 6.6% | 4.2%(+2.47)#358 | 4.9%(+1.75)#7,100 |
| 4. | 78401 | 6.3% | 4.2%(+2.17)#386 | 4.9%(+1.44)#7,756 |
| 5. | 78417 | 6.2% | 4.2%(+2.04)#405 | 4.9%(+1.32)#8,047 |
| 6. | 78416 | 5.1% | 4.2%(+0.981)#549 | 4.9%(+0.259)#10,926 |
| 7. | 78412 | 4.8% | 4.2%(+0.642)#610 | 4.9%(-0.079)#11,993 |
| 8. | 78410 | 4.5% | 4.2%(+0.335)#674 | 4.9%(-0.386)#13,014 |
| 9. | 78418 | 3.5% | 4.2%(-0.691)#916 | 4.9%(-1.41)#16,750 |
| 10. | 78413 | 2.8% | 4.2%(-1.35)#1,061 | 4.9%(-2.07)#19,009 |
| 11. | 78414 | 2.8% | 4.2%(-1.40)#1,068 | 4.9%(-2.12)#19,156 |
| 12. | 78411 | 2.4% | 4.2%(-1.72)#1,153 | 4.9%(-2.44)#20,199 |
| 13. | 78408 | 1.9% | 4.2%(-2.26)#1,255 | 4.9%(-2.98)#21,640 |
1
Common Questions
What are the Top 10 Zip Codes with the Highest Percentage of Population with a Degree in Liberal Arts and History in Corpus Christi, TX?
Top 10 Zip Codes with the Highest Percentage of Population with a Degree in Liberal Arts and History in Corpus Christi, TX are:
What zip code has the Highest Percentage of Population with a Degree in Liberal Arts and History in Corpus Christi, TX?
78405 has the Highest Percentage of Population with a Degree in Liberal Arts and History in Corpus Christi, TX with 10.8%.
What is the Percentage of Population with a Degree in Liberal Arts and History in Corpus Christi, TX?
Percentage of Population with a Degree in Liberal Arts and History in Corpus Christi is 3.8%.
What is the Percentage of Population with a Degree in Liberal Arts and History in Texas?
Percentage of Population with a Degree in Liberal Arts and History in Texas is 4.2%.
What is the Percentage of Population with a Degree in Liberal Arts and History in the United States?
Percentage of Population with a Degree in Liberal Arts and History in the United States is 4.9%.