Callender Lake, TX Map & Demographics
Callender Lake Map
Callender Lake Overview
$49,541
PER CAPITA INCOME
$43,717
AVG HOUSEHOLD INCOME
73.5%
WAGE / INCOME GAP [ % ]
26.5¢/ $1
WAGE / INCOME GAP [ $ ]
0.62
INEQUALITY / GINI INDEX
903
TOTAL POPULATION
461
MALE POPULATION
442
FEMALE POPULATION
104.30
MALES / 100 FEMALES
95.88
FEMALES / 100 MALES
27.8
MEDIAN AGE
2.6
AVG FAMILY SIZE
2.1
AVG HOUSEHOLD SIZE
428
LABOR FORCE [ PEOPLE ]
58.9%
PERCENT IN LABOR FORCE
Income in Callender Lake
Income Overview in Callender Lake
| Characteristic | Number | Measure |
| Per Capita Income | 903 | $49,541 |
| Median Family Income | 289 | $0 |
| Mean Family Income | 289 | $139,444 |
| Median Household Income | 435 | $43,717 |
| Mean Household Income | 435 | $103,863 |
| Income Deficit | 289 | $0 |
| Wage / Income Gap (%) | 903 | 73.53% |
| Wage / Income Gap ($) | 903 | 26.47¢ per $1 |
| Gini / Inequality Index | 903 | 0.62 |
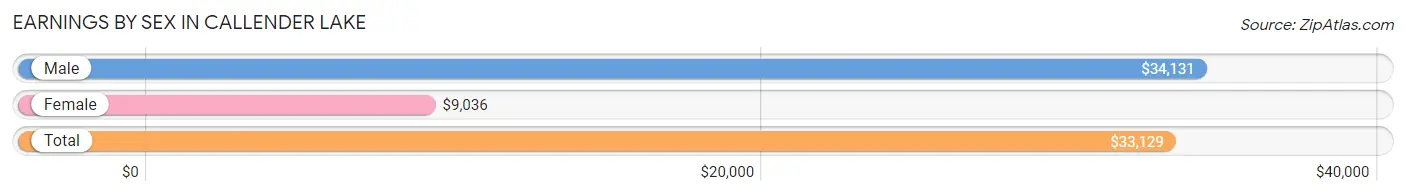
Earnings by Sex in Callender Lake
Average Earnings in Callender Lake are $33,129, $34,131 for men and $9,036 for women, a difference of 73.5%.
| Sex | Number | Average Earnings |
| Male | 253 (55.5%) | $34,131 |
| Female | 203 (44.5%) | $9,036 |
| Total | 456 (100.0%) | $33,129 |
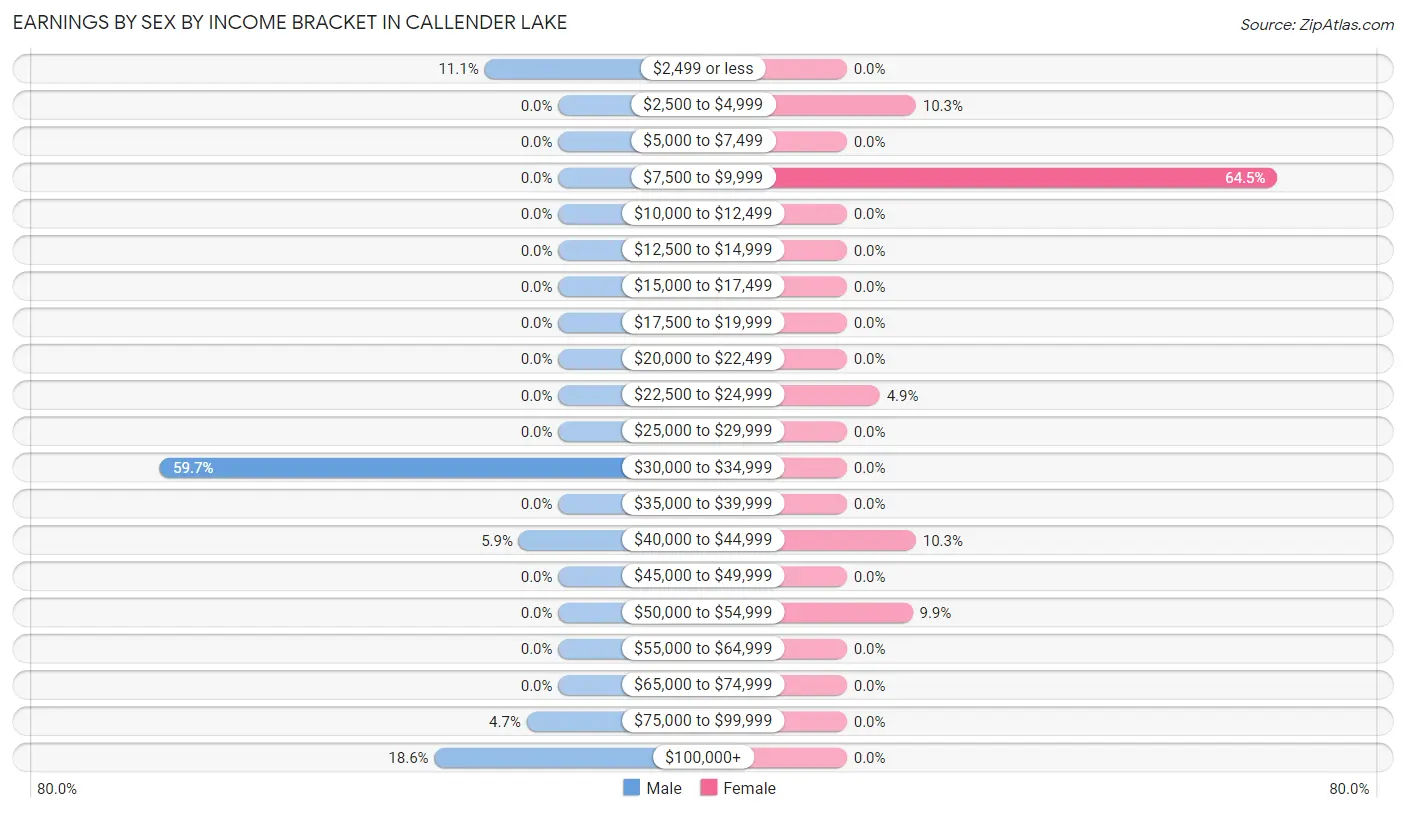
Earnings by Sex by Income Bracket in Callender Lake
The most common earnings brackets in Callender Lake are $30,000 to $34,999 for men (151 | 59.7%) and $7,500 to $9,999 for women (131 | 64.5%).
| Income | Male | Female |
| $2,499 or less | 28 (11.1%) | 0 (0.0%) |
| $2,500 to $4,999 | 0 (0.0%) | 21 (10.3%) |
| $5,000 to $7,499 | 0 (0.0%) | 0 (0.0%) |
| $7,500 to $9,999 | 0 (0.0%) | 131 (64.5%) |
| $10,000 to $12,499 | 0 (0.0%) | 0 (0.0%) |
| $12,500 to $14,999 | 0 (0.0%) | 0 (0.0%) |
| $15,000 to $17,499 | 0 (0.0%) | 0 (0.0%) |
| $17,500 to $19,999 | 0 (0.0%) | 0 (0.0%) |
| $20,000 to $22,499 | 0 (0.0%) | 0 (0.0%) |
| $22,500 to $24,999 | 0 (0.0%) | 10 (4.9%) |
| $25,000 to $29,999 | 0 (0.0%) | 0 (0.0%) |
| $30,000 to $34,999 | 151 (59.7%) | 0 (0.0%) |
| $35,000 to $39,999 | 0 (0.0%) | 0 (0.0%) |
| $40,000 to $44,999 | 15 (5.9%) | 21 (10.3%) |
| $45,000 to $49,999 | 0 (0.0%) | 0 (0.0%) |
| $50,000 to $54,999 | 0 (0.0%) | 20 (9.9%) |
| $55,000 to $64,999 | 0 (0.0%) | 0 (0.0%) |
| $65,000 to $74,999 | 0 (0.0%) | 0 (0.0%) |
| $75,000 to $99,999 | 12 (4.7%) | 0 (0.0%) |
| $100,000+ | 47 (18.6%) | 0 (0.0%) |
| Total | 253 (100.0%) | 203 (100.0%) |
Earnings by Sex by Educational Attainment in Callender Lake
| Educational Attainment | Male Income | Female Income |
| Less than High School | - | - |
| High School Diploma | - | - |
| College or Associate's Degree | - | - |
| Bachelor's Degree | - | - |
| Graduate Degree | - | - |
| Total | $34,131 | $40,595 |
Family Income in Callender Lake
Family Income Brackets in Callender Lake
According to the Callender Lake family income data, there are 151 families falling into the $35,000 to $49,999 income range, which is the most common income bracket and makes up 52.2% of all families.
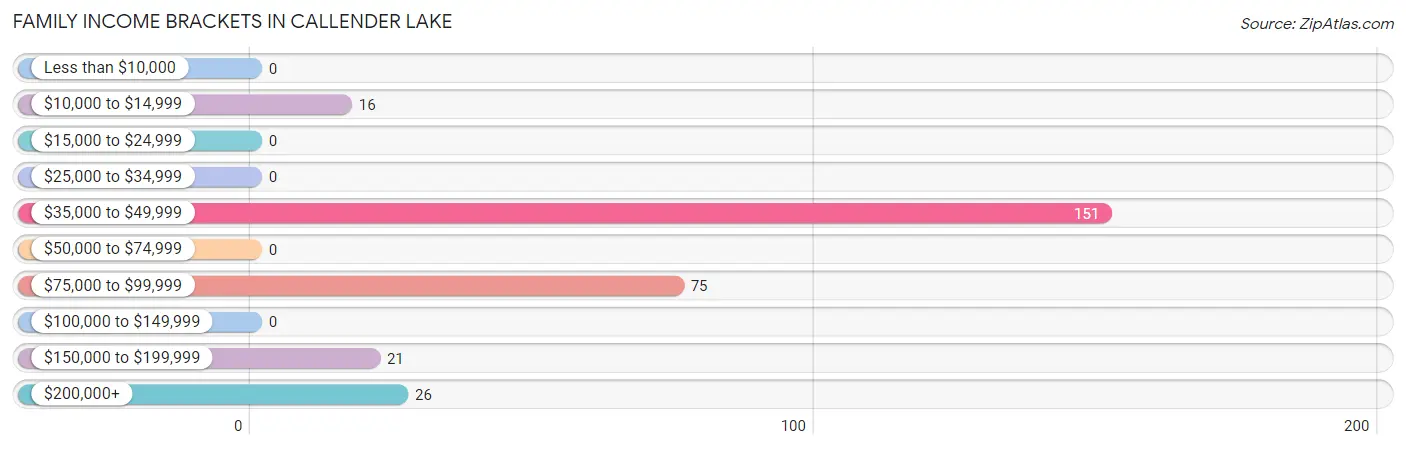
| Income Bracket | # Families | % Families |
| Less than $10,000 | 0 | 0.0% |
| $10,000 to $14,999 | 16 | 5.5% |
| $15,000 to $24,999 | 0 | 0.0% |
| $25,000 to $34,999 | 0 | 0.0% |
| $35,000 to $49,999 | 151 | 52.2% |
| $50,000 to $74,999 | 0 | 0.0% |
| $75,000 to $99,999 | 75 | 26.0% |
| $100,000 to $149,999 | 0 | 0.0% |
| $150,000 to $199,999 | 21 | 7.3% |
| $200,000+ | 26 | 9.0% |
Family Income by Famaliy Size in Callender Lake
2-person families (91 | 31.5%) account for the highest median family income in Callender Lake with $81,411 per family, while 2-person families (91 | 31.5%) have the highest median income of $40,706 per family member.
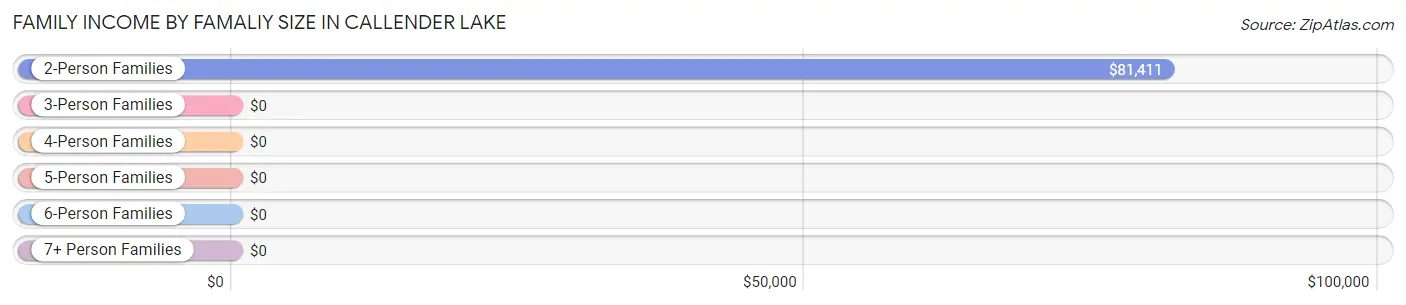
| Income Bracket | # Families | Median Income |
| 2-Person Families | 91 (31.5%) | $81,411 |
| 3-Person Families | 172 (59.5%) | $0 |
| 4-Person Families | 0 (0.0%) | $0 |
| 5-Person Families | 26 (9.0%) | $0 |
| 6-Person Families | 0 (0.0%) | $0 |
| 7+ Person Families | 0 (0.0%) | $0 |
| Total | 289 (100.0%) | $0 |
Family Income by Number of Earners in Callender Lake
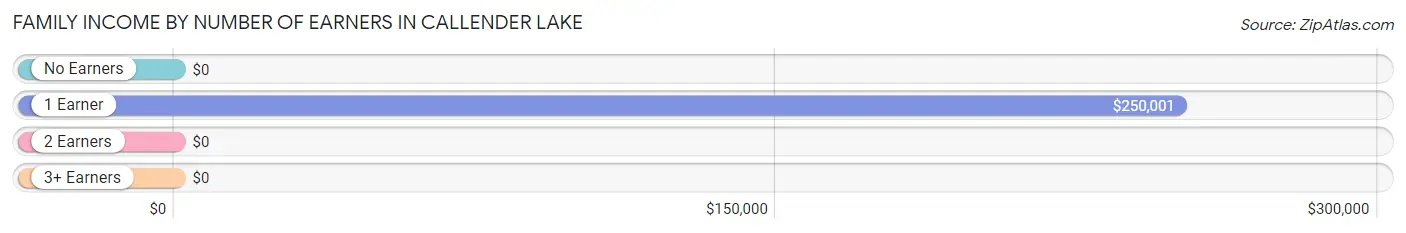
| Number of Earners | # Families | Median Income |
| No Earners | 47 (16.3%) | $0 |
| 1 Earner | 50 (17.3%) | $250,001 |
| 2 Earners | 171 (59.2%) | $0 |
| 3+ Earners | 21 (7.3%) | $0 |
| Total | 289 (100.0%) | $0 |
Household Income in Callender Lake
Household Income Brackets in Callender Lake
With 188 households falling in the category, the $35,000 to $49,999 income range is the most frequent in Callender Lake, accounting for 43.2% of all households.
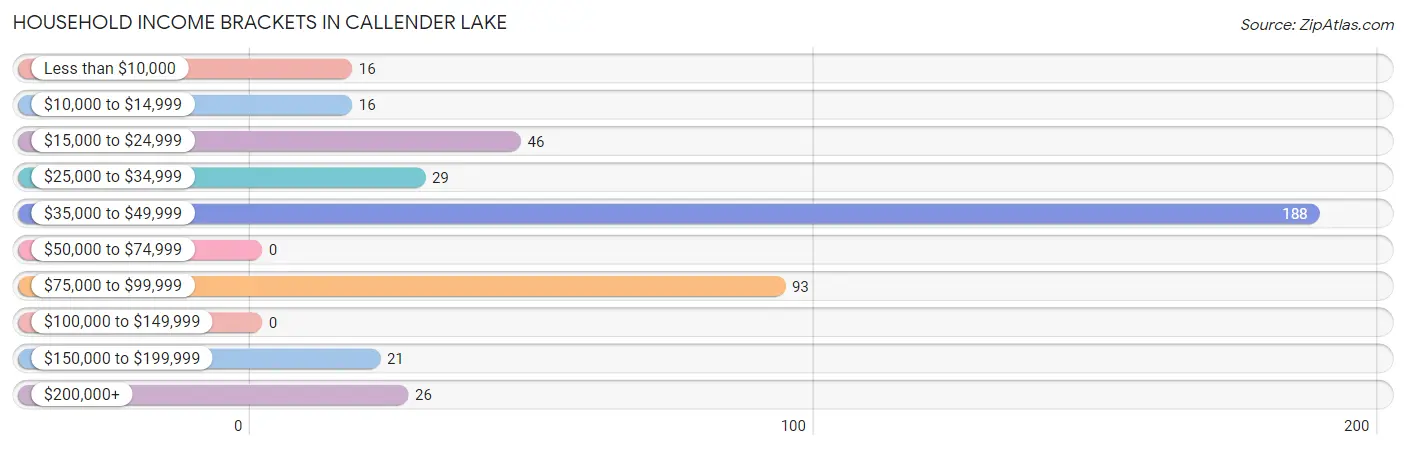
| Income Bracket | # Households | % Households |
| Less than $10,000 | 16 | 3.7% |
| $10,000 to $14,999 | 16 | 3.7% |
| $15,000 to $24,999 | 46 | 10.6% |
| $25,000 to $34,999 | 29 | 6.7% |
| $35,000 to $49,999 | 188 | 43.2% |
| $50,000 to $74,999 | 0 | 0.0% |
| $75,000 to $99,999 | 93 | 21.4% |
| $100,000 to $149,999 | 0 | 0.0% |
| $150,000 to $199,999 | 21 | 4.8% |
| $200,000+ | 26 | 6.0% |
Household Income by Householder Age in Callender Lake
The median household income in Callender Lake is $43,717, with the highest median household income of $89,167 found in the 45 to 64 years age bracket for the primary householder. A total of 90 households (20.7%) fall into this category.
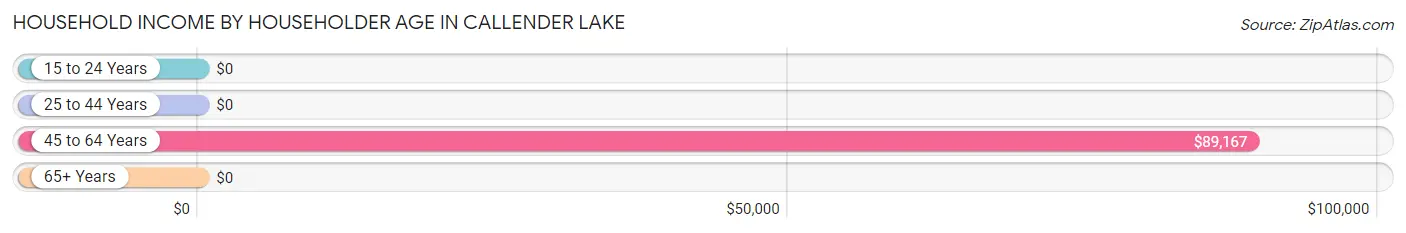
| Income Bracket | # Households | Median Income |
| 15 to 24 Years | 0 (0.0%) | $0 |
| 25 to 44 Years | 177 (40.7%) | $0 |
| 45 to 64 Years | 90 (20.7%) | $89,167 |
| 65+ Years | 168 (38.6%) | $0 |
| Total | 435 (100.0%) | $43,717 |
Poverty in Callender Lake
Income Below Poverty by Sex and Age in Callender Lake
With 3.5% poverty level for males and 7.2% for females among the residents of Callender Lake, 65 to 74 year old males and 55 to 64 year old females are the most vulnerable to poverty, with 16 males (31.4%) and 16 females (30.2%) in their respective age groups living below the poverty level.
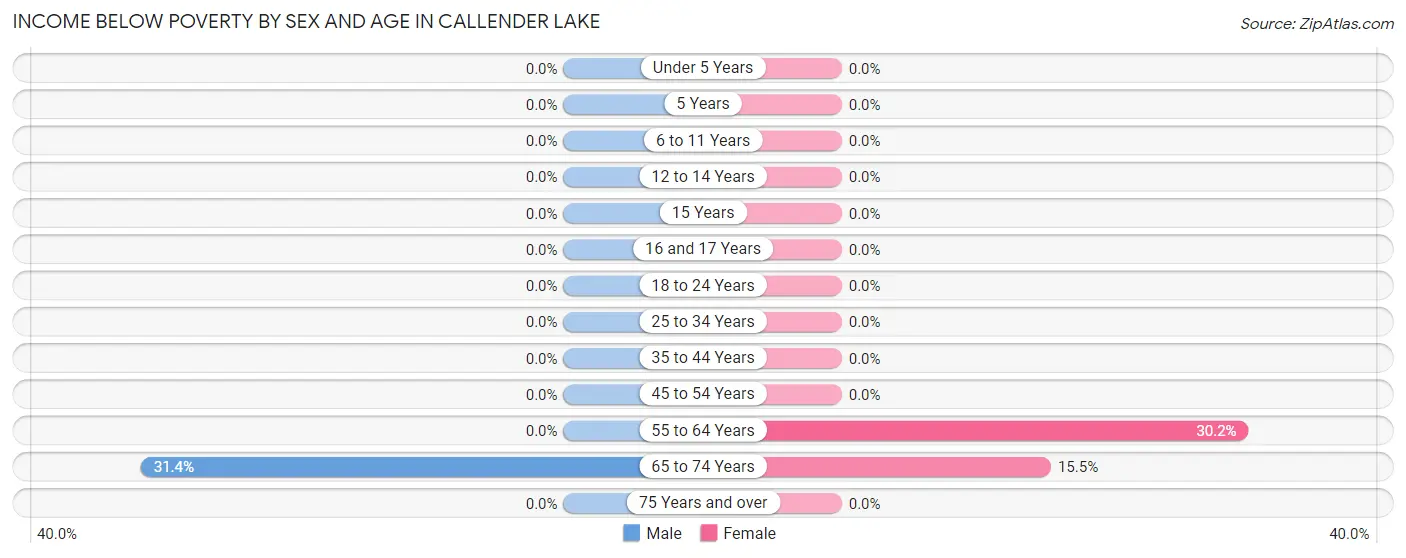
| Age Bracket | Male | Female |
| Under 5 Years | 0 (0.0%) | 0 (0.0%) |
| 5 Years | 0 (0.0%) | 0 (0.0%) |
| 6 to 11 Years | 0 (0.0%) | 0 (0.0%) |
| 12 to 14 Years | 0 (0.0%) | 0 (0.0%) |
| 15 Years | 0 (0.0%) | 0 (0.0%) |
| 16 and 17 Years | 0 (0.0%) | 0 (0.0%) |
| 18 to 24 Years | 0 (0.0%) | 0 (0.0%) |
| 25 to 34 Years | 0 (0.0%) | 0 (0.0%) |
| 35 to 44 Years | 0 (0.0%) | 0 (0.0%) |
| 45 to 54 Years | 0 (0.0%) | 0 (0.0%) |
| 55 to 64 Years | 0 (0.0%) | 16 (30.2%) |
| 65 to 74 Years | 16 (31.4%) | 16 (15.5%) |
| 75 Years and over | 0 (0.0%) | 0 (0.0%) |
| Total | 16 (3.5%) | 32 (7.2%) |
Income Above Poverty by Sex and Age in Callender Lake
According to the poverty statistics in Callender Lake, males aged under 5 years and females aged 5 years are the age groups that are most secure financially, with 100.0% of males and 100.0% of females in these age groups living above the poverty line.
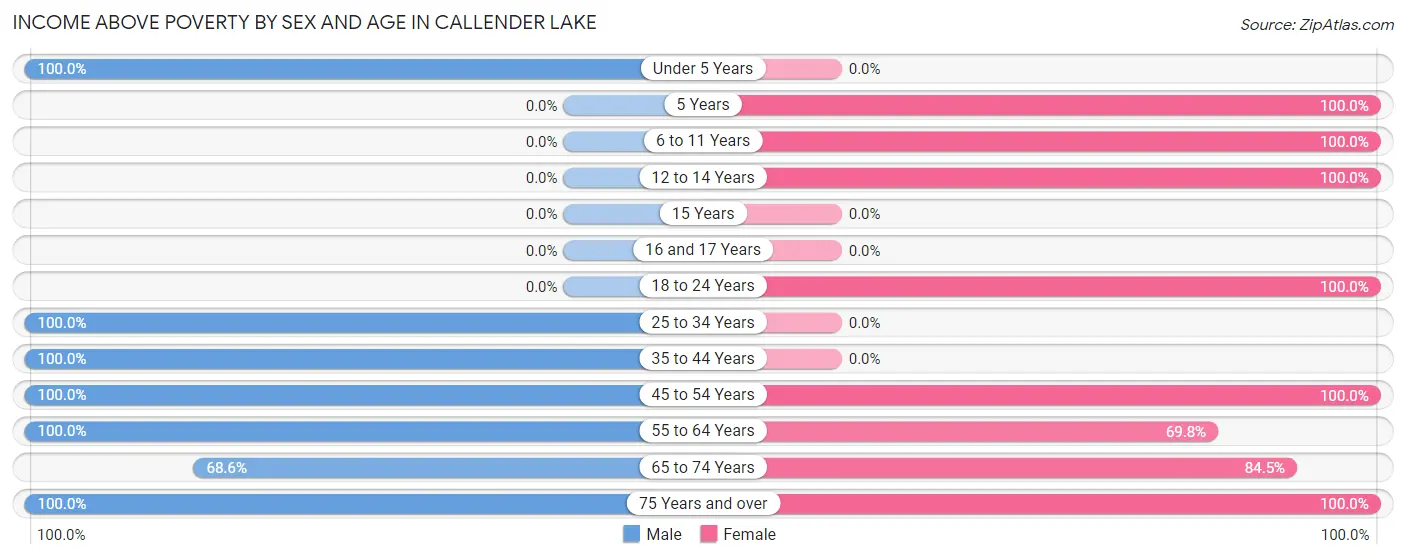
| Age Bracket | Male | Female |
| Under 5 Years | 117 (100.0%) | 0 (0.0%) |
| 5 Years | 0 (0.0%) | 18 (100.0%) |
| 6 to 11 Years | 0 (0.0%) | 20 (100.0%) |
| 12 to 14 Years | 0 (0.0%) | 21 (100.0%) |
| 15 Years | 0 (0.0%) | 0 (0.0%) |
| 16 and 17 Years | 0 (0.0%) | 0 (0.0%) |
| 18 to 24 Years | 0 (0.0%) | 131 (100.0%) |
| 25 to 34 Years | 179 (100.0%) | 0 (0.0%) |
| 35 to 44 Years | 26 (100.0%) | 0 (0.0%) |
| 45 to 54 Years | 36 (100.0%) | 65 (100.0%) |
| 55 to 64 Years | 12 (100.0%) | 37 (69.8%) |
| 65 to 74 Years | 35 (68.6%) | 87 (84.5%) |
| 75 Years and over | 40 (100.0%) | 31 (100.0%) |
| Total | 445 (96.5%) | 410 (92.8%) |
Income Below Poverty Among Married-Couple Families in Callender Lake
The poverty statistics for married-couple families in Callender Lake show that 5.5% or 16 of the total 289 families live below the poverty line. Families with no children have the highest poverty rate of 14.3%, comprising of 16 families. On the other hand, families with 1 or 2 children have the lowest poverty rate of 0.0%, which includes 0 families.
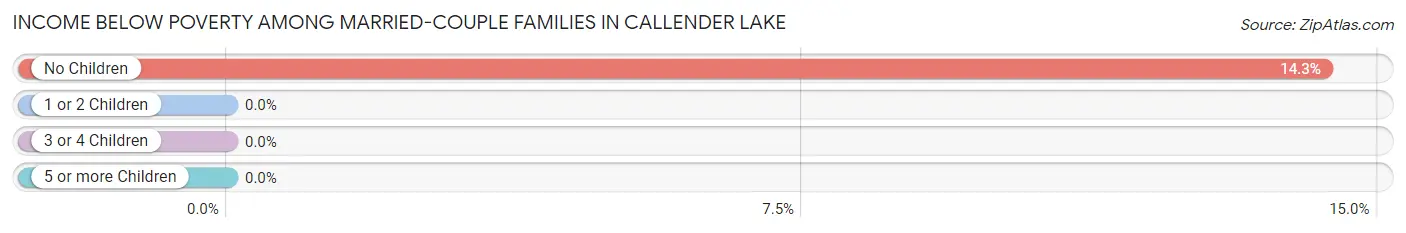
| Children | Above Poverty | Below Poverty |
| No Children | 96 (85.7%) | 16 (14.3%) |
| 1 or 2 Children | 151 (100.0%) | 0 (0.0%) |
| 3 or 4 Children | 26 (100.0%) | 0 (0.0%) |
| 5 or more Children | 0 (0.0%) | 0 (0.0%) |
| Total | 273 (94.5%) | 16 (5.5%) |
Income Below Poverty Among Single-Parent Households in Callender Lake
| Children | Single Father | Single Mother |
| No Children | 0 (0.0%) | 0 (0.0%) |
| 1 or 2 Children | 0 (0.0%) | 0 (0.0%) |
| 3 or 4 Children | 0 (0.0%) | 0 (0.0%) |
| 5 or more Children | 0 (0.0%) | 0 (0.0%) |
| Total | 0 (0.0%) | 0 (0.0%) |
Income Below Poverty Among Married-Couple vs Single-Parent Households in Callender Lake
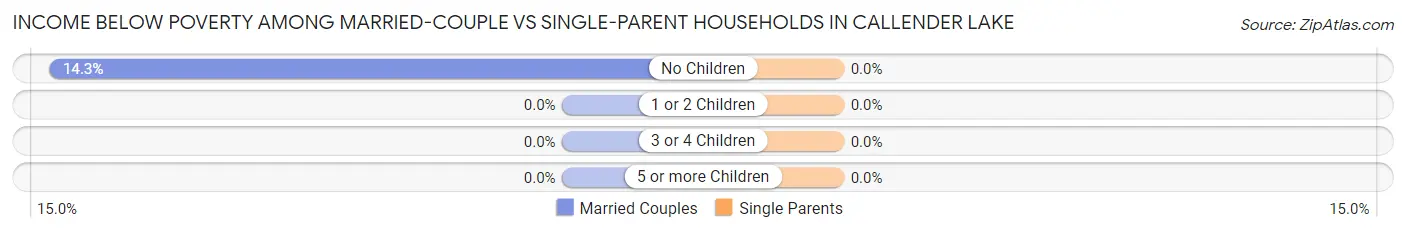
| Children | Married-Couple Families | Single-Parent Households |
| No Children | 16 (14.3%) | 0 (0.0%) |
| 1 or 2 Children | 0 (0.0%) | 0 (0.0%) |
| 3 or 4 Children | 0 (0.0%) | 0 (0.0%) |
| 5 or more Children | 0 (0.0%) | 0 (0.0%) |
| Total | 16 (5.5%) | 0 (0.0%) |
Race in Callender Lake
The most populous races in Callender Lake are White / Caucasian (504 | 55.8%), Black / African American (399 | 44.2%), and Hispanic or Latino (18 | 2.0%).
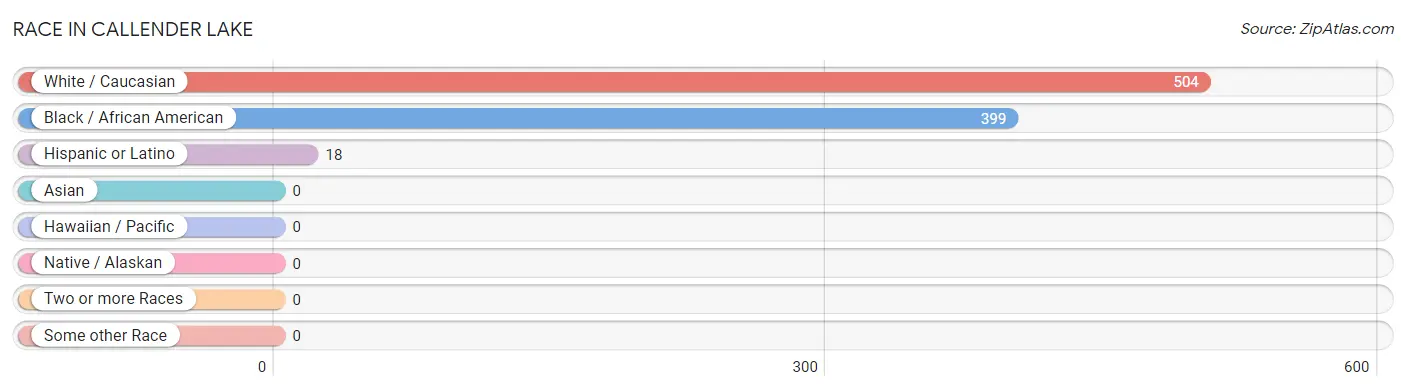
| Race | # Population | % Population |
| Asian | 0 | 0.0% |
| Black / African American | 399 | 44.2% |
| Hawaiian / Pacific | 0 | 0.0% |
| Hispanic or Latino | 18 | 2.0% |
| Native / Alaskan | 0 | 0.0% |
| White / Caucasian | 504 | 55.8% |
| Two or more Races | 0 | 0.0% |
| Some other Race | 0 | 0.0% |
| Total | 903 | 100.0% |
Ancestry in Callender Lake
The most populous ancestries reported in Callender Lake are English (159 | 17.6%), American (125 | 13.8%), German (67 | 7.4%), Irish (34 | 3.8%), and Scottish (19 | 2.1%), together accounting for 44.7% of all Callender Lake residents.
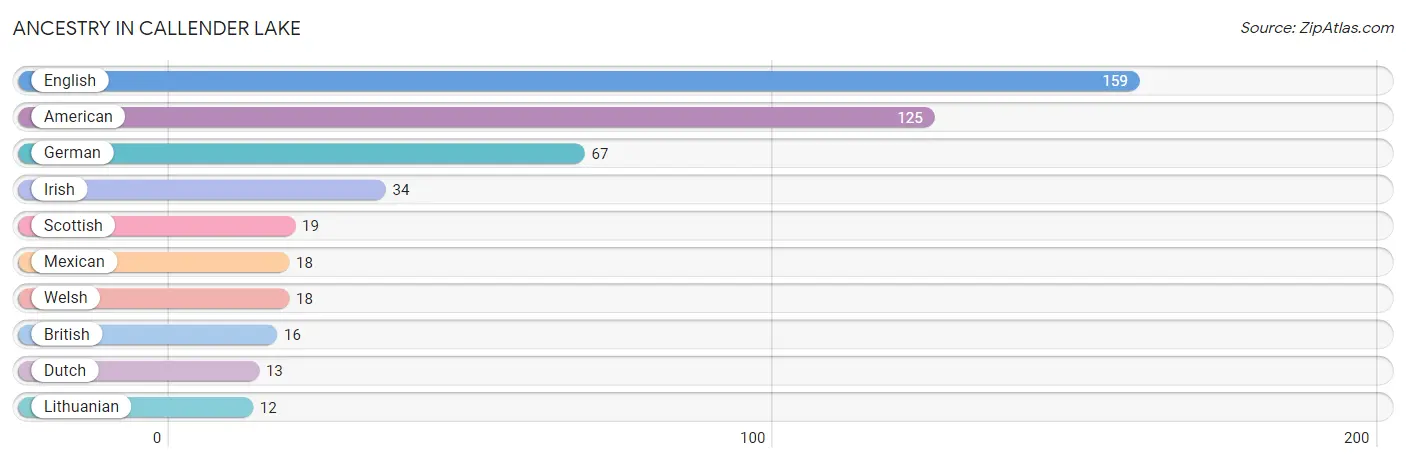
| Ancestry | # Population | % Population |
| American | 125 | 13.8% |
| British | 16 | 1.8% |
| Dutch | 13 | 1.4% |
| English | 159 | 17.6% |
| German | 67 | 7.4% |
| Irish | 34 | 3.8% |
| Lithuanian | 12 | 1.3% |
| Mexican | 18 | 2.0% |
| Scottish | 19 | 2.1% |
| Welsh | 18 | 2.0% | View All 10 Rows |
Immigrants in Callender Lake

| Immigration Origin | # Population | % Population | View All 0 Rows |
Sex and Age in Callender Lake
Sex and Age in Callender Lake
The most populous age groups in Callender Lake are 25 to 29 Years (179 | 38.8%) for men and 20 to 24 Years (131 | 29.6%) for women.
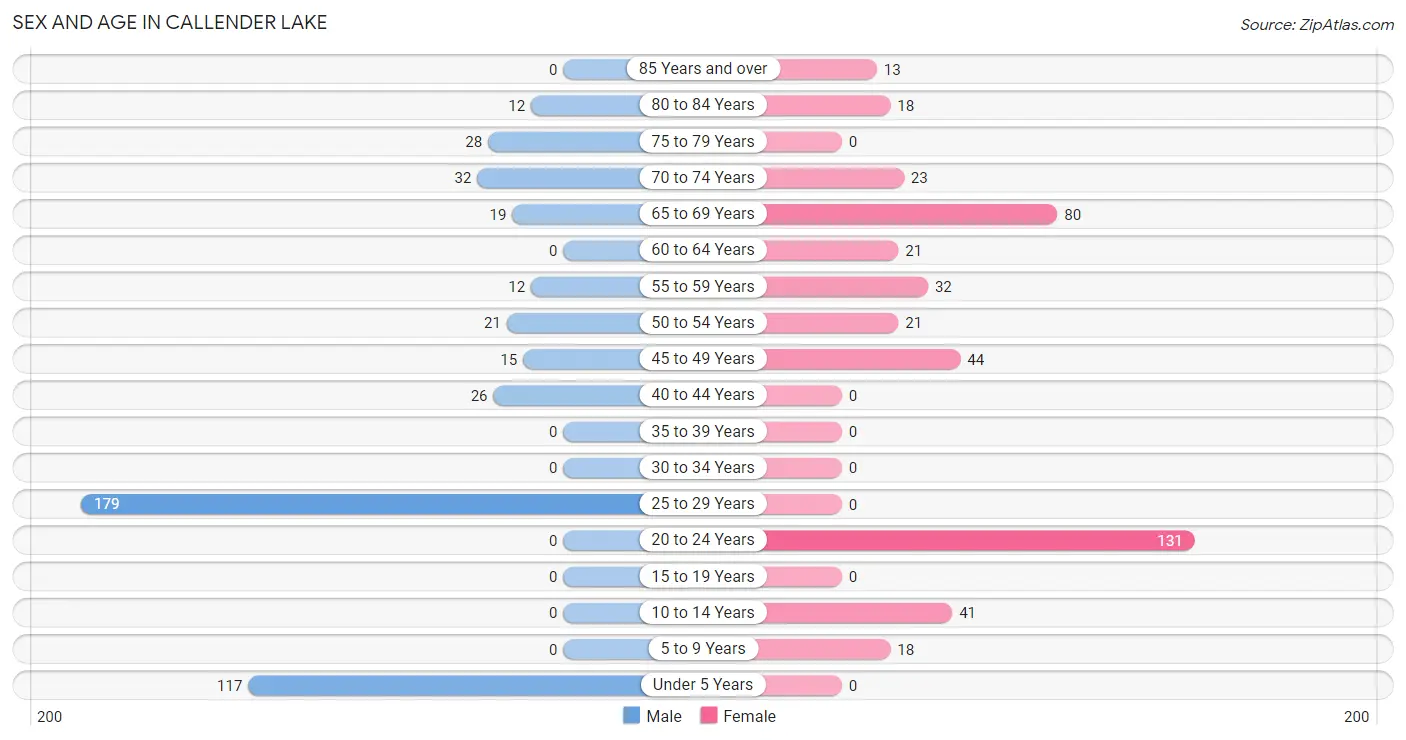
| Age Bracket | Male | Female |
| Under 5 Years | 117 (25.4%) | 0 (0.0%) |
| 5 to 9 Years | 0 (0.0%) | 18 (4.1%) |
| 10 to 14 Years | 0 (0.0%) | 41 (9.3%) |
| 15 to 19 Years | 0 (0.0%) | 0 (0.0%) |
| 20 to 24 Years | 0 (0.0%) | 131 (29.6%) |
| 25 to 29 Years | 179 (38.8%) | 0 (0.0%) |
| 30 to 34 Years | 0 (0.0%) | 0 (0.0%) |
| 35 to 39 Years | 0 (0.0%) | 0 (0.0%) |
| 40 to 44 Years | 26 (5.6%) | 0 (0.0%) |
| 45 to 49 Years | 15 (3.3%) | 44 (10.0%) |
| 50 to 54 Years | 21 (4.6%) | 21 (4.8%) |
| 55 to 59 Years | 12 (2.6%) | 32 (7.2%) |
| 60 to 64 Years | 0 (0.0%) | 21 (4.8%) |
| 65 to 69 Years | 19 (4.1%) | 80 (18.1%) |
| 70 to 74 Years | 32 (6.9%) | 23 (5.2%) |
| 75 to 79 Years | 28 (6.1%) | 0 (0.0%) |
| 80 to 84 Years | 12 (2.6%) | 18 (4.1%) |
| 85 Years and over | 0 (0.0%) | 13 (2.9%) |
| Total | 461 (100.0%) | 442 (100.0%) |
Families and Households in Callender Lake
Median Family Size in Callender Lake
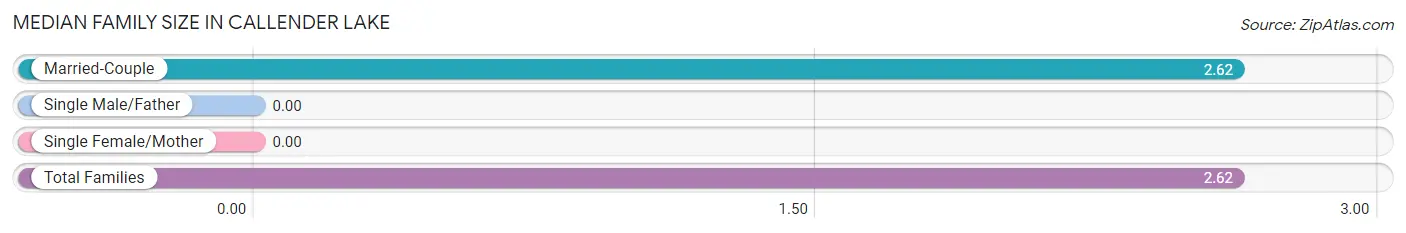
| Family Type | # Families | Family Size |
| Married-Couple | 289 (100.0%) | 2.62 |
| Single Male/Father | 0 (0.0%) | - |
| Single Female/Mother | 0 (0.0%) | - |
| Total Families | 289 (100.0%) | 2.62 |
Median Household Size in Callender Lake
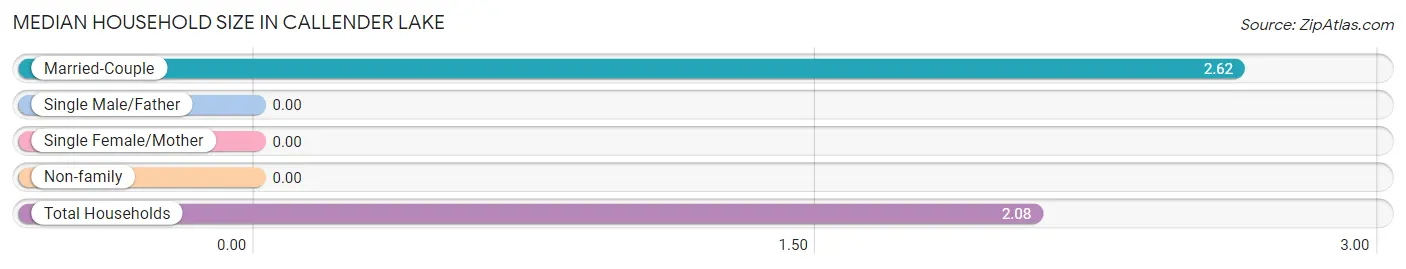
| Household Type | # Households | Household Size |
| Married-Couple | 289 (66.4%) | 2.62 |
| Single Male/Father | 0 (0.0%) | - |
| Single Female/Mother | 0 (0.0%) | - |
| Non-family | 146 (33.6%) | - |
| Total Households | 435 (100.0%) | 2.08 |
Household Size by Marriage Status in Callender Lake
Out of a total of 435 households in Callender Lake, 289 (66.4%) are family households, while 146 (33.6%) are nonfamily households. The most numerous type of family households are 3-person households, comprising 172, and the most common type of nonfamily households are 1-person households, comprising 146.
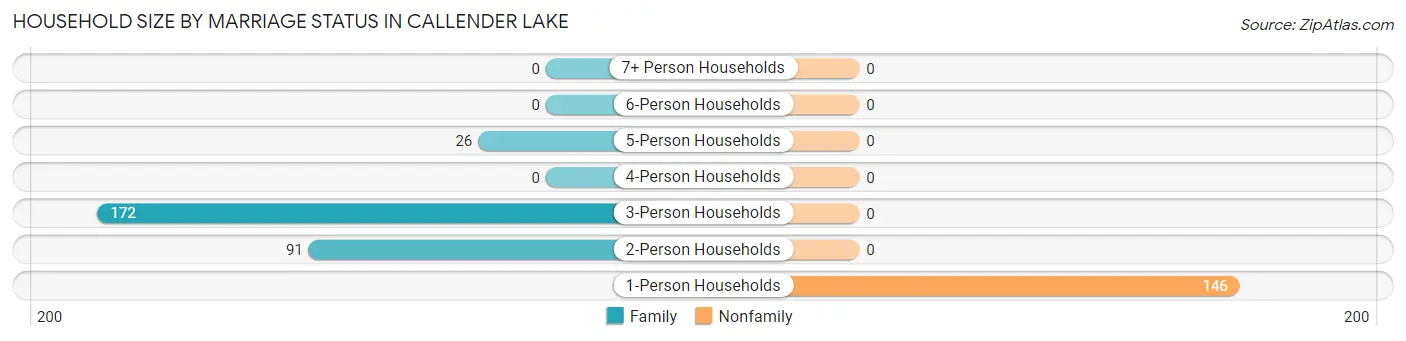
| Household Size | Family Households | Nonfamily Households |
| 1-Person Households | - | 146 (33.6%) |
| 2-Person Households | 91 (20.9%) | 0 (0.0%) |
| 3-Person Households | 172 (39.5%) | 0 (0.0%) |
| 4-Person Households | 0 (0.0%) | 0 (0.0%) |
| 5-Person Households | 26 (6.0%) | 0 (0.0%) |
| 6-Person Households | 0 (0.0%) | 0 (0.0%) |
| 7+ Person Households | 0 (0.0%) | 0 (0.0%) |
| Total | 289 (66.4%) | 146 (33.6%) |
Female Fertility in Callender Lake
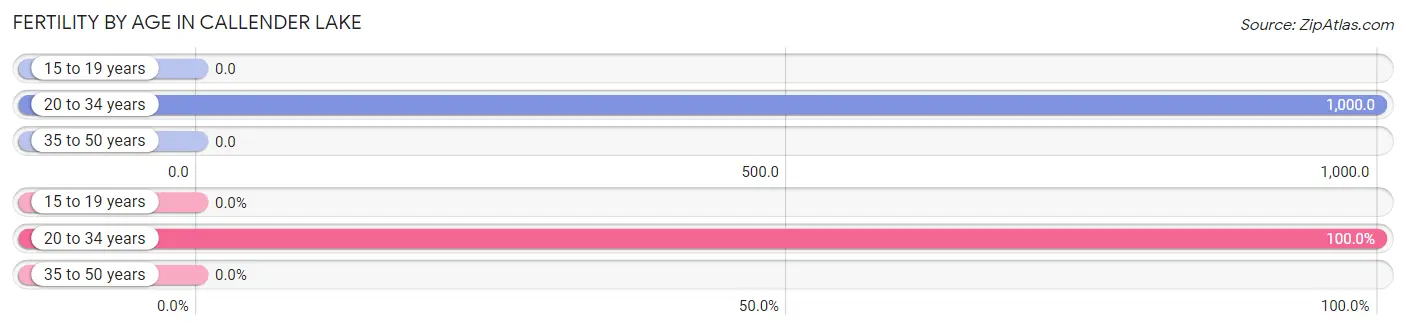
Fertility by Age in Callender Lake
Average fertility rate in Callender Lake is 749.0 births per 1,000 women. Women in the age bracket of 20 to 34 years have the highest fertility rate with 1,000.0 births per 1,000 women. Women in the age bracket of 20 to 34 years acount for 100.0% of all women with births.
| Age Bracket | Women with Births | Births / 1,000 Women |
| 15 to 19 years | 0 (0.0%) | 0.0 |
| 20 to 34 years | 131 (100.0%) | 1,000.0 |
| 35 to 50 years | 0 (0.0%) | 0.0 |
| Total | 131 (100.0%) | 749.0 |
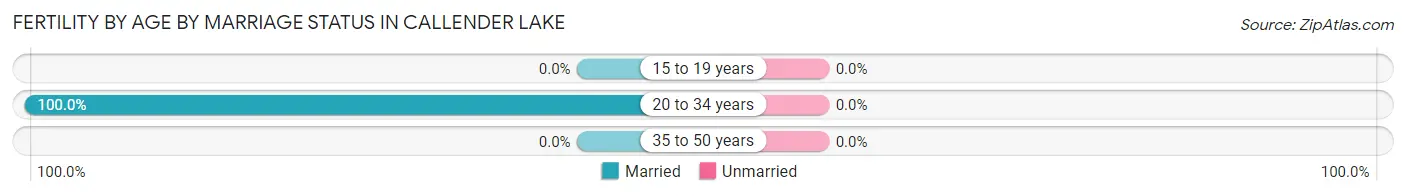
Fertility by Age by Marriage Status in Callender Lake
| Age Bracket | Married | Unmarried |
| 15 to 19 years | 0 (0.0%) | 0 (0.0%) |
| 20 to 34 years | 131 (100.0%) | 0 (0.0%) |
| 35 to 50 years | 0 (0.0%) | 0 (0.0%) |
| Total | 131 (100.0%) | 0 (0.0%) |
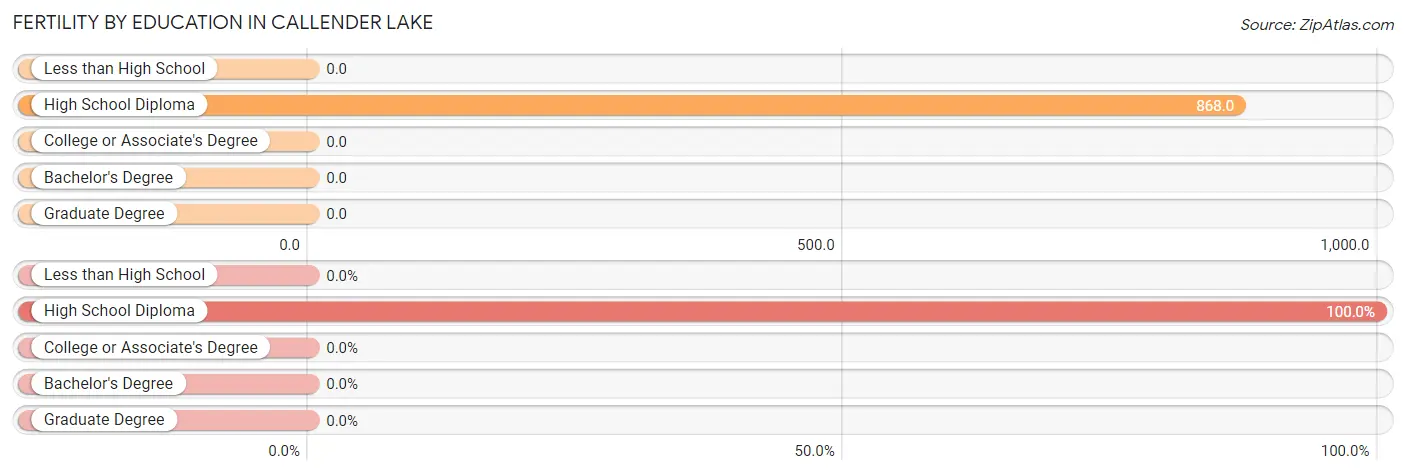
Fertility by Education in Callender Lake
| Educational Attainment | Women with Births | Births / 1,000 Women |
| Less than High School | 0 (0.0%) | 0.0 |
| High School Diploma | 131 (100.0%) | 868.0 |
| College or Associate's Degree | 0 (0.0%) | 0.0 |
| Bachelor's Degree | 0 (0.0%) | 0.0 |
| Graduate Degree | 0 (0.0%) | 0.0 |
| Total | 131 (100.0%) | 749.0 |
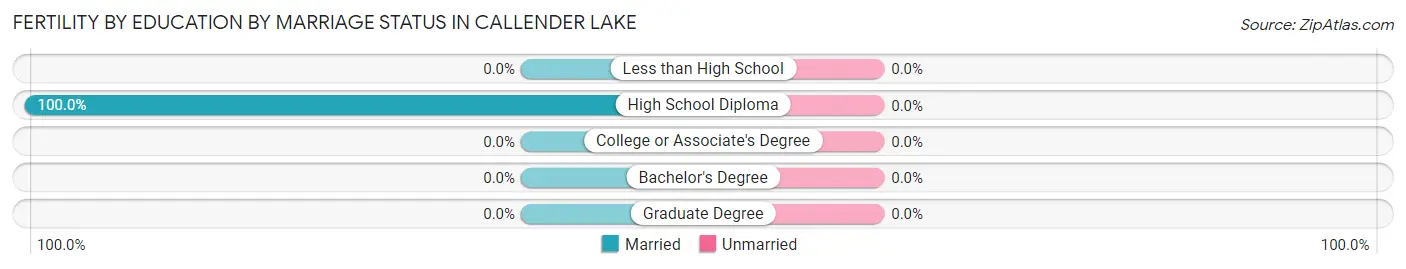
Fertility by Education by Marriage Status in Callender Lake
| Educational Attainment | Married | Unmarried |
| Less than High School | 0 (0.0%) | 0 (0.0%) |
| High School Diploma | 131 (100.0%) | 0 (0.0%) |
| College or Associate's Degree | 0 (0.0%) | 0 (0.0%) |
| Bachelor's Degree | 0 (0.0%) | 0 (0.0%) |
| Graduate Degree | 0 (0.0%) | 0 (0.0%) |
| Total | 131 (100.0%) | 0 (0.0%) |
Employment Characteristics in Callender Lake
Employment by Class of Employer in Callender Lake
Among the 428 employed individuals in Callender Lake, private company employees (376 | 87.8%), self-employed (not incorporated) (31 | 7.2%), and state government employees (21 | 4.9%) make up the most common classes of employment.
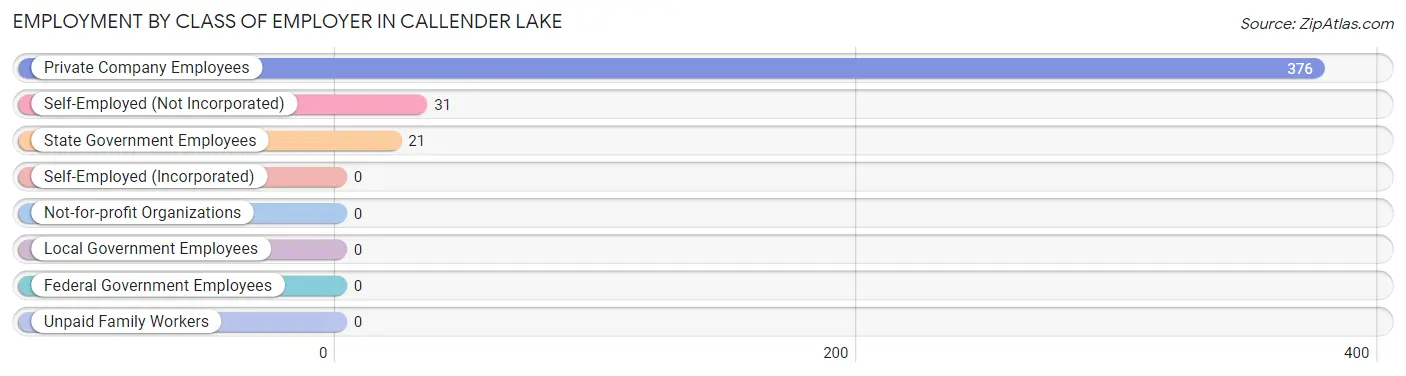
| Employer Class | # Employees | % Employees |
| Private Company Employees | 376 | 87.8% |
| Self-Employed (Incorporated) | 0 | 0.0% |
| Self-Employed (Not Incorporated) | 31 | 7.2% |
| Not-for-profit Organizations | 0 | 0.0% |
| Local Government Employees | 0 | 0.0% |
| State Government Employees | 21 | 4.9% |
| Federal Government Employees | 0 | 0.0% |
| Unpaid Family Workers | 0 | 0.0% |
| Total | 428 | 100.0% |
Employment Status by Age in Callender Lake
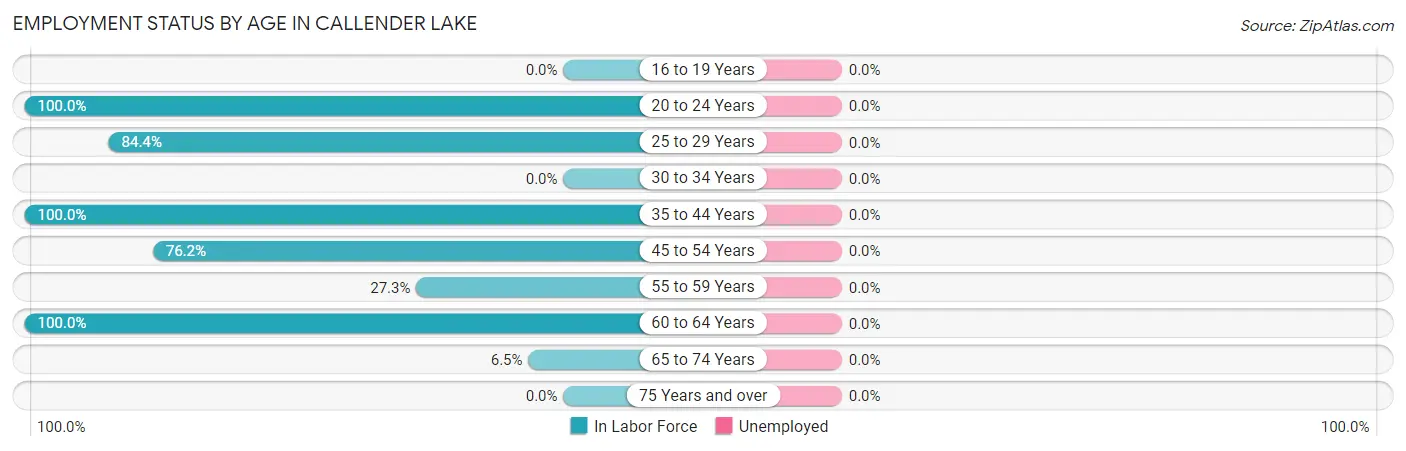
| Age Bracket | In Labor Force | Unemployed |
| 16 to 19 Years | 0 (0.0%) | 0 (0.0%) |
| 20 to 24 Years | 131 (100.0%) | 0 (0.0%) |
| 25 to 29 Years | 151 (84.4%) | 0 (0.0%) |
| 30 to 34 Years | 0 (0.0%) | 0 (0.0%) |
| 35 to 44 Years | 26 (100.0%) | 0 (0.0%) |
| 45 to 54 Years | 77 (76.2%) | 0 (0.0%) |
| 55 to 59 Years | 12 (27.3%) | 0 (0.0%) |
| 60 to 64 Years | 21 (100.0%) | 0 (0.0%) |
| 65 to 74 Years | 10 (6.5%) | 0 (0.0%) |
| 75 Years and over | 0 (0.0%) | 0 (0.0%) |
| Total | 428 (58.9%) | 0 (0.0%) |
Employment Status by Educational Attainment in Callender Lake
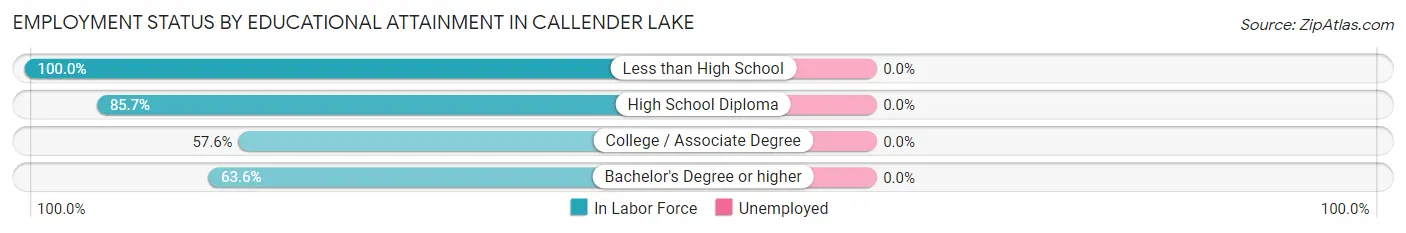
| Educational Attainment | In Labor Force | Unemployed |
| Less than High School | 15 (100.0%) | 0 (0.0%) |
| High School Diploma | 192 (85.7%) | 0 (0.0%) |
| College / Associate Degree | 38 (57.6%) | 0 (0.0%) |
| Bachelor's Degree or higher | 42 (63.6%) | 0 (0.0%) |
| Total | 287 (77.4%) | 0 (0.0%) |
Employment Occupations by Sex in Callender Lake
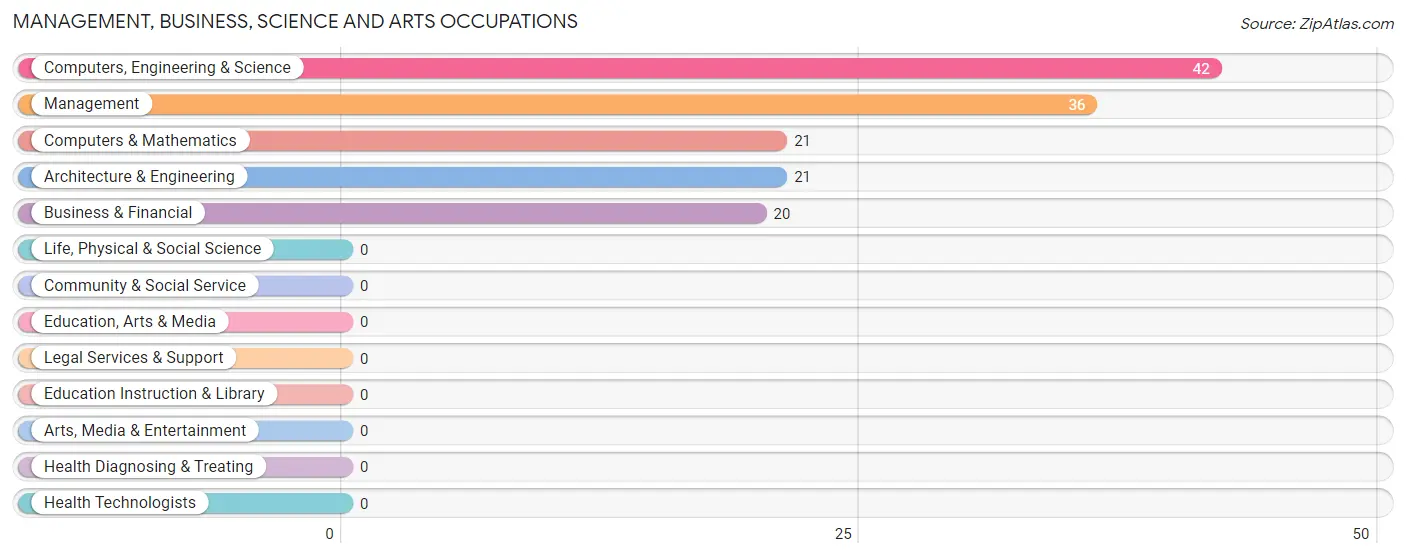
Management, Business, Science and Arts Occupations
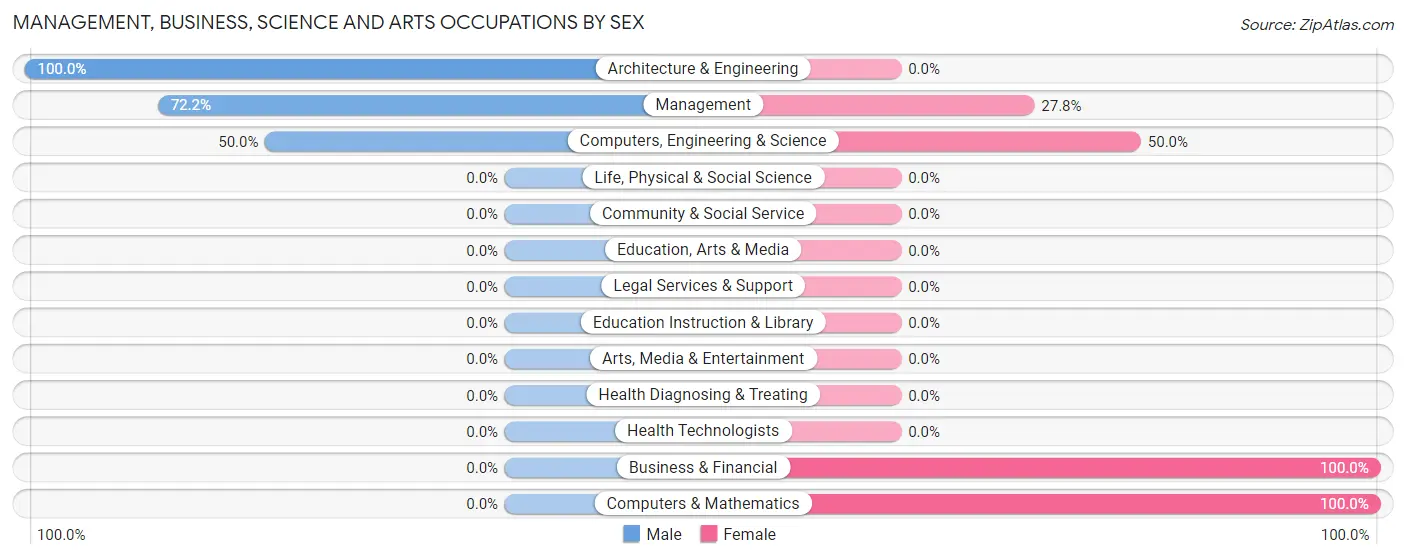
The most common Management, Business, Science and Arts occupations in Callender Lake are Computers, Engineering & Science (42 | 9.8%), Management (36 | 8.4%), Computers & Mathematics (21 | 4.9%), Architecture & Engineering (21 | 4.9%), and Business & Financial (20 | 4.7%).
Management, Business, Science and Arts Occupations by Sex
Within the Management, Business, Science and Arts occupations in Callender Lake, the most male-oriented occupations are Architecture & Engineering (100.0%), Management (72.2%), and Computers, Engineering & Science (50.0%), while the most female-oriented occupations are Business & Financial (100.0%), Computers & Mathematics (100.0%), and Computers, Engineering & Science (50.0%).
| Occupation | Male | Female |
| Management | 26 (72.2%) | 10 (27.8%) |
| Business & Financial | 0 (0.0%) | 20 (100.0%) |
| Computers, Engineering & Science | 21 (50.0%) | 21 (50.0%) |
| Computers & Mathematics | 0 (0.0%) | 21 (100.0%) |
| Architecture & Engineering | 21 (100.0%) | 0 (0.0%) |
| Life, Physical & Social Science | 0 (0.0%) | 0 (0.0%) |
| Community & Social Service | 0 (0.0%) | 0 (0.0%) |
| Education, Arts & Media | 0 (0.0%) | 0 (0.0%) |
| Legal Services & Support | 0 (0.0%) | 0 (0.0%) |
| Education Instruction & Library | 0 (0.0%) | 0 (0.0%) |
| Arts, Media & Entertainment | 0 (0.0%) | 0 (0.0%) |
| Health Diagnosing & Treating | 0 (0.0%) | 0 (0.0%) |
| Health Technologists | 0 (0.0%) | 0 (0.0%) |
| Total (Category) | 47 (48.0%) | 51 (52.0%) |
| Total (Overall) | 225 (52.6%) | 203 (47.4%) |
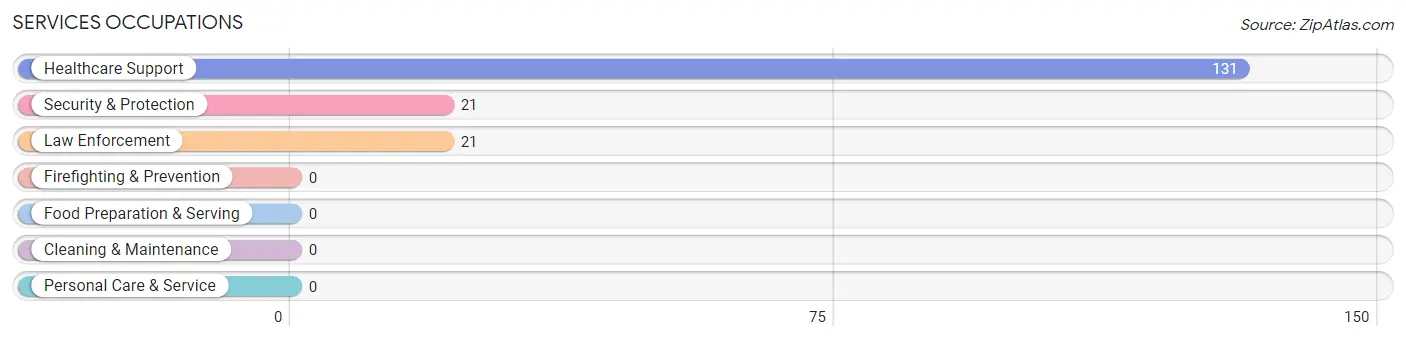
Services Occupations
The most common Services occupations in Callender Lake are Healthcare Support (131 | 30.6%), Security & Protection (21 | 4.9%), and Law Enforcement (21 | 4.9%).
Services Occupations by Sex
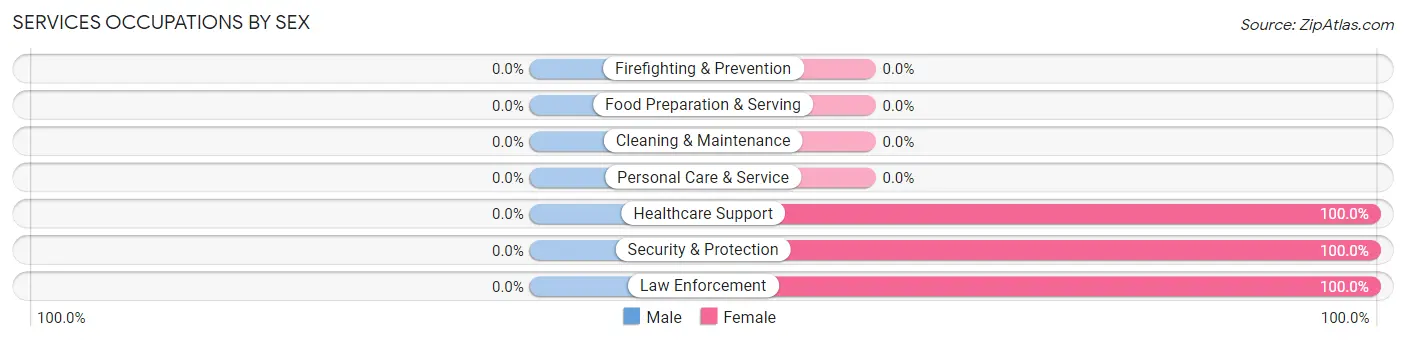
| Occupation | Male | Female |
| Healthcare Support | 0 (0.0%) | 131 (100.0%) |
| Security & Protection | 0 (0.0%) | 21 (100.0%) |
| Firefighting & Prevention | 0 (0.0%) | 0 (0.0%) |
| Law Enforcement | 0 (0.0%) | 21 (100.0%) |
| Food Preparation & Serving | 0 (0.0%) | 0 (0.0%) |
| Cleaning & Maintenance | 0 (0.0%) | 0 (0.0%) |
| Personal Care & Service | 0 (0.0%) | 0 (0.0%) |
| Total (Category) | 0 (0.0%) | 152 (100.0%) |
| Total (Overall) | 225 (52.6%) | 203 (47.4%) |
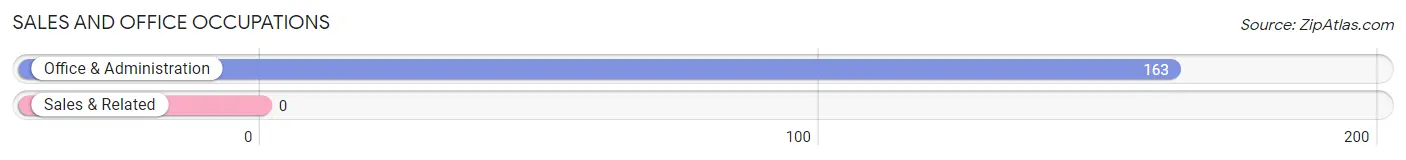
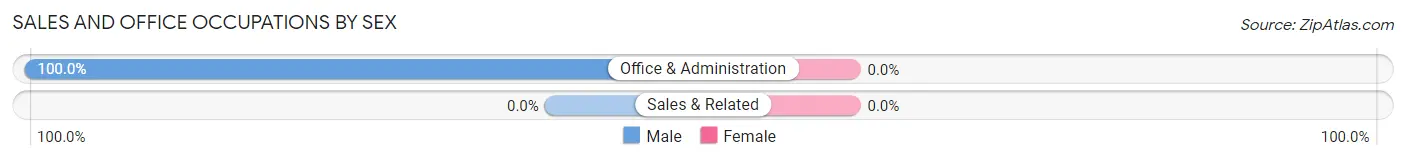
Sales and Office Occupations
The most common Sales and Office occupations in Callender Lake are , and Office & Administration (163 | 38.1%).
Sales and Office Occupations by Sex
| Occupation | Male | Female |
| Sales & Related | 0 (0.0%) | 0 (0.0%) |
| Office & Administration | 163 (100.0%) | 0 (0.0%) |
| Total (Category) | 163 (100.0%) | 0 (0.0%) |
| Total (Overall) | 225 (52.6%) | 203 (47.4%) |
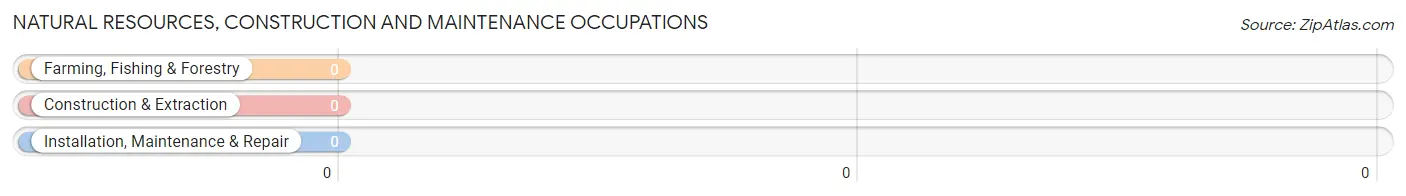
Natural Resources, Construction and Maintenance Occupations
Natural Resources, Construction and Maintenance Occupations by Sex
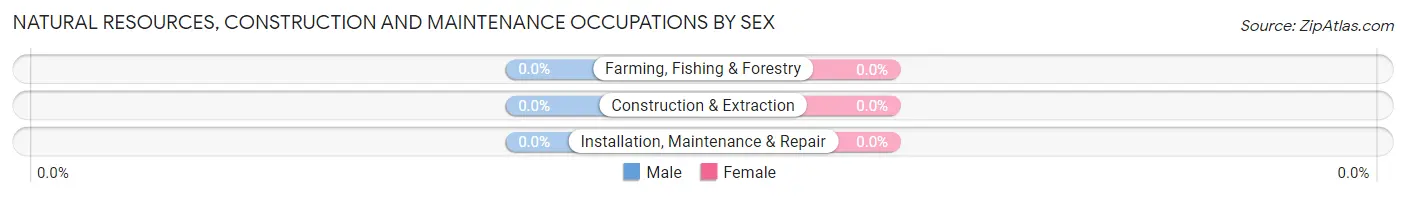
| Occupation | Male | Female |
| Farming, Fishing & Forestry | 0 (0.0%) | 0 (0.0%) |
| Construction & Extraction | 0 (0.0%) | 0 (0.0%) |
| Installation, Maintenance & Repair | 0 (0.0%) | 0 (0.0%) |
| Total (Category) | 0 (0.0%) | 0 (0.0%) |
| Total (Overall) | 225 (52.6%) | 203 (47.4%) |
Production, Transportation and Moving Occupations
The most common Production, Transportation and Moving occupations in Callender Lake are , and Production (15 | 3.5%).
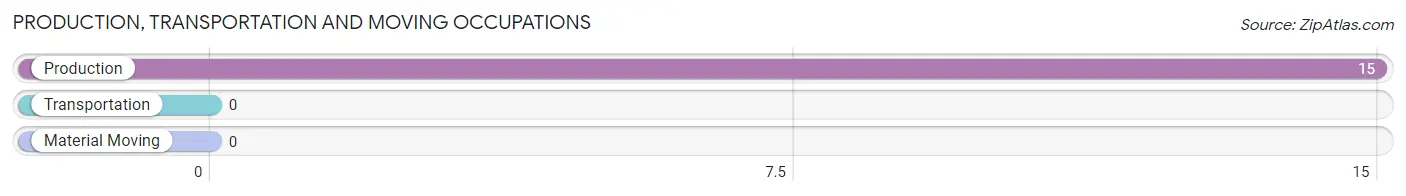
Production, Transportation and Moving Occupations by Sex
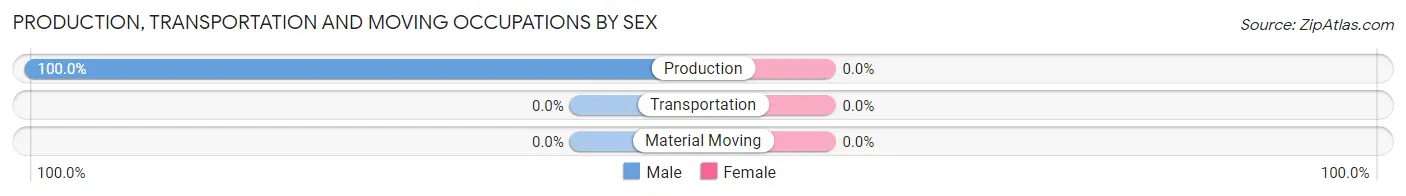
| Occupation | Male | Female |
| Production | 15 (100.0%) | 0 (0.0%) |
| Transportation | 0 (0.0%) | 0 (0.0%) |
| Material Moving | 0 (0.0%) | 0 (0.0%) |
| Total (Category) | 15 (100.0%) | 0 (0.0%) |
| Total (Overall) | 225 (52.6%) | 203 (47.4%) |
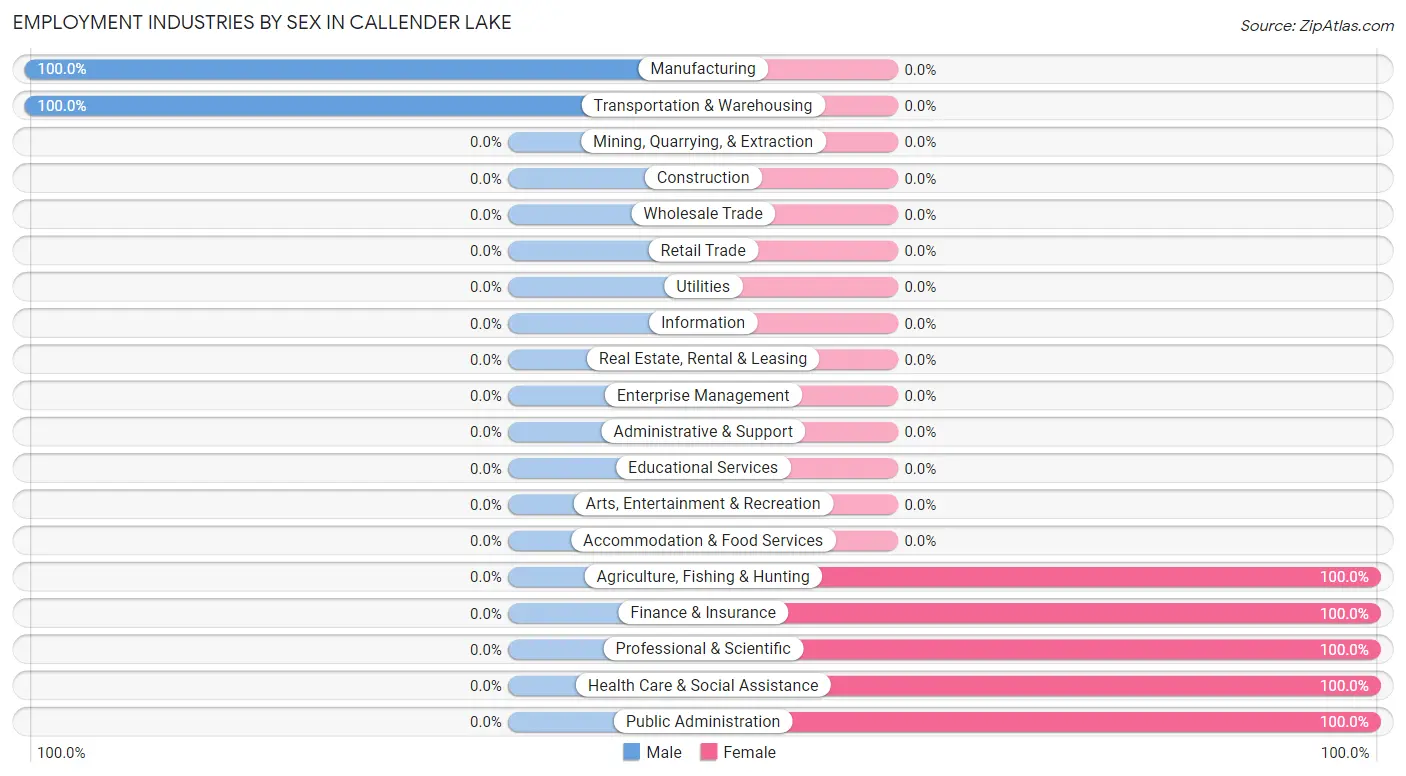
Employment Industries by Sex in Callender Lake
Employment Industries in Callender Lake
The major employment industries in Callender Lake include Manufacturing (213 | 49.8%), Health Care & Social Assistance (131 | 30.6%), Professional & Scientific (21 | 4.9%), Public Administration (21 | 4.9%), and Agriculture, Fishing & Hunting (20 | 4.7%).
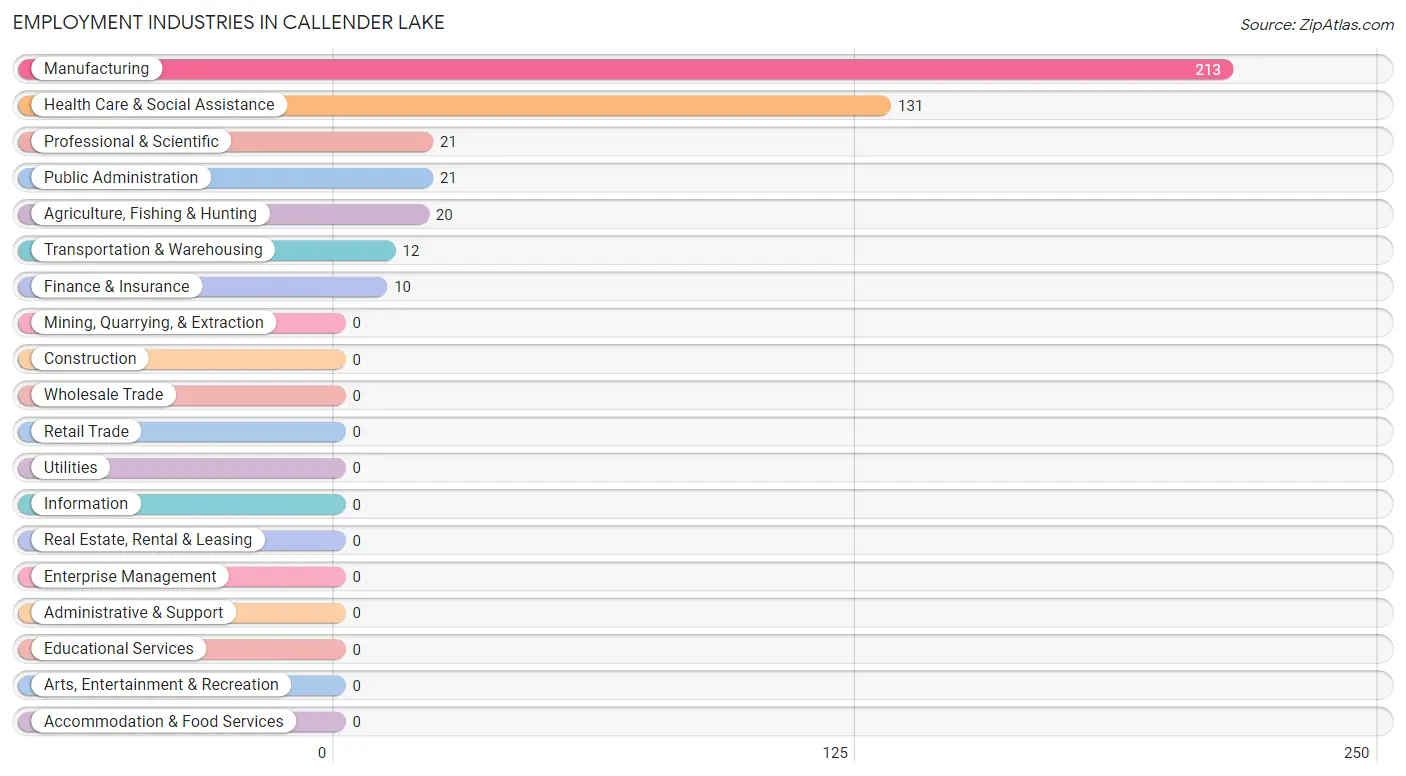
Employment Industries by Sex in Callender Lake
The Callender Lake industries that see more men than women are Manufacturing (100.0%), and Transportation & Warehousing (100.0%), whereas the industries that tend to have a higher number of women are Agriculture, Fishing & Hunting (100.0%), Finance & Insurance (100.0%), and Professional & Scientific (100.0%).
| Industry | Male | Female |
| Agriculture, Fishing & Hunting | 0 (0.0%) | 20 (100.0%) |
| Mining, Quarrying, & Extraction | 0 (0.0%) | 0 (0.0%) |
| Construction | 0 (0.0%) | 0 (0.0%) |
| Manufacturing | 213 (100.0%) | 0 (0.0%) |
| Wholesale Trade | 0 (0.0%) | 0 (0.0%) |
| Retail Trade | 0 (0.0%) | 0 (0.0%) |
| Transportation & Warehousing | 12 (100.0%) | 0 (0.0%) |
| Utilities | 0 (0.0%) | 0 (0.0%) |
| Information | 0 (0.0%) | 0 (0.0%) |
| Finance & Insurance | 0 (0.0%) | 10 (100.0%) |
| Real Estate, Rental & Leasing | 0 (0.0%) | 0 (0.0%) |
| Professional & Scientific | 0 (0.0%) | 21 (100.0%) |
| Enterprise Management | 0 (0.0%) | 0 (0.0%) |
| Administrative & Support | 0 (0.0%) | 0 (0.0%) |
| Educational Services | 0 (0.0%) | 0 (0.0%) |
| Health Care & Social Assistance | 0 (0.0%) | 131 (100.0%) |
| Arts, Entertainment & Recreation | 0 (0.0%) | 0 (0.0%) |
| Accommodation & Food Services | 0 (0.0%) | 0 (0.0%) |
| Public Administration | 0 (0.0%) | 21 (100.0%) |
| Total | 225 (52.6%) | 203 (47.4%) |
Education in Callender Lake
School Enrollment in Callender Lake
The most common levels of schooling among the 59 students in Callender Lake are high school (21 | 35.6%), elementary school (20 | 33.9%), and kindergarten (18 | 30.5%).
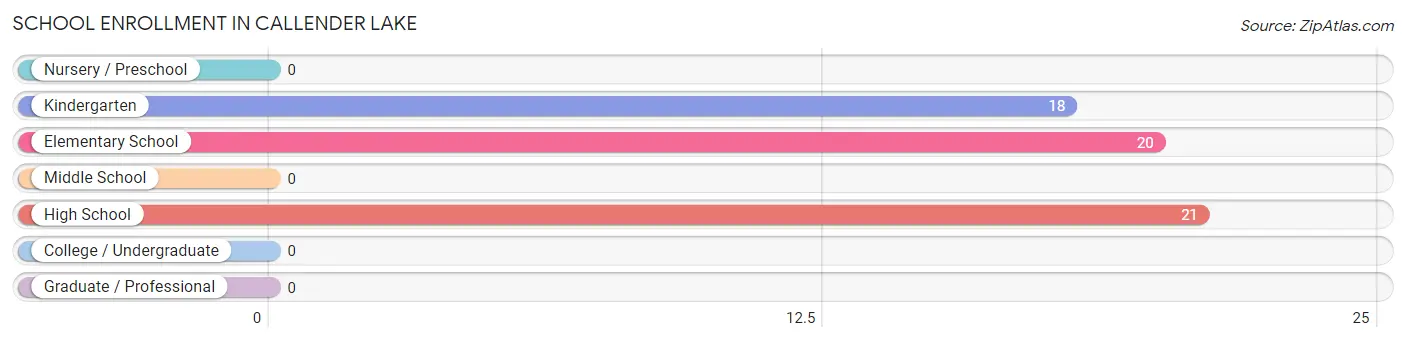
| School Level | # Students | % Students |
| Nursery / Preschool | 0 | 0.0% |
| Kindergarten | 18 | 30.5% |
| Elementary School | 20 | 33.9% |
| Middle School | 0 | 0.0% |
| High School | 21 | 35.6% |
| College / Undergraduate | 0 | 0.0% |
| Graduate / Professional | 0 | 0.0% |
| Total | 59 | 100.0% |
School Enrollment by Age by Funding Source in Callender Lake
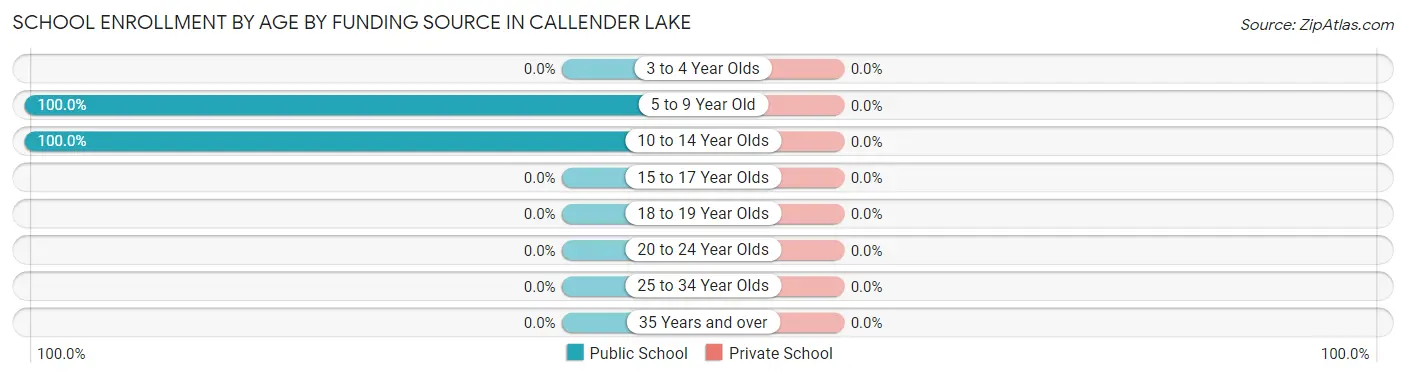
| Age Bracket | Public School | Private School |
| 3 to 4 Year Olds | 0 (0.0%) | 0 (0.0%) |
| 5 to 9 Year Old | 18 (100.0%) | 0 (0.0%) |
| 10 to 14 Year Olds | 41 (100.0%) | 0 (0.0%) |
| 15 to 17 Year Olds | 0 (0.0%) | 0 (0.0%) |
| 18 to 19 Year Olds | 0 (0.0%) | 0 (0.0%) |
| 20 to 24 Year Olds | 0 (0.0%) | 0 (0.0%) |
| 25 to 34 Year Olds | 0 (0.0%) | 0 (0.0%) |
| 35 Years and over | 0 (0.0%) | 0 (0.0%) |
| Total | 59 (100.0%) | 0 (0.0%) |
Educational Attainment by Field of Study in Callender Lake
Computers & mathematics (54 | 35.5%), liberal arts & history (42 | 27.6%), education (24 | 15.8%), bio, nature & agricultural (16 | 10.5%), and business (16 | 10.5%) are the most common fields of study among 152 individuals in Callender Lake who have obtained a bachelor's degree or higher.
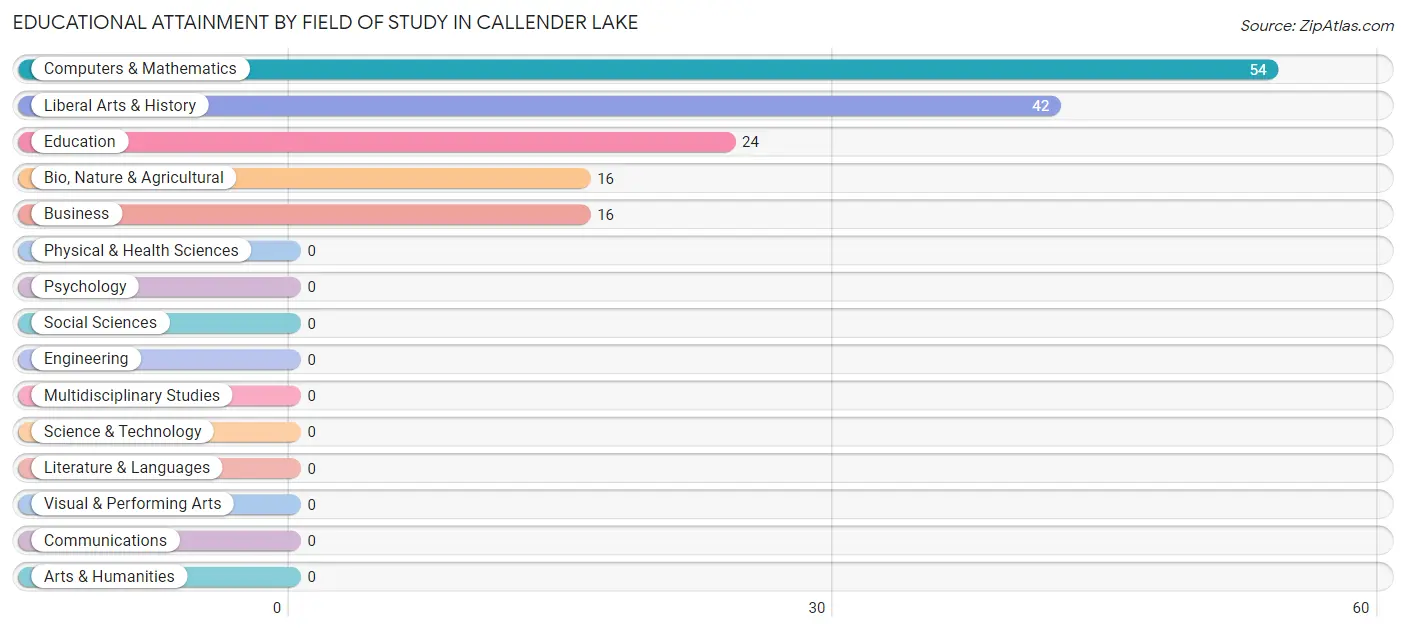
| Field of Study | # Graduates | % Graduates |
| Computers & Mathematics | 54 | 35.5% |
| Bio, Nature & Agricultural | 16 | 10.5% |
| Physical & Health Sciences | 0 | 0.0% |
| Psychology | 0 | 0.0% |
| Social Sciences | 0 | 0.0% |
| Engineering | 0 | 0.0% |
| Multidisciplinary Studies | 0 | 0.0% |
| Science & Technology | 0 | 0.0% |
| Business | 16 | 10.5% |
| Education | 24 | 15.8% |
| Literature & Languages | 0 | 0.0% |
| Liberal Arts & History | 42 | 27.6% |
| Visual & Performing Arts | 0 | 0.0% |
| Communications | 0 | 0.0% |
| Arts & Humanities | 0 | 0.0% |
| Total | 152 | 100.0% |
Transportation & Commute in Callender Lake
Vehicle Availability by Sex in Callender Lake
The most prevalent vehicle ownership categories in Callender Lake are males with 2 vehicles (163, accounting for 72.4%) and females with 2 vehicles (141, making up 80.3%).
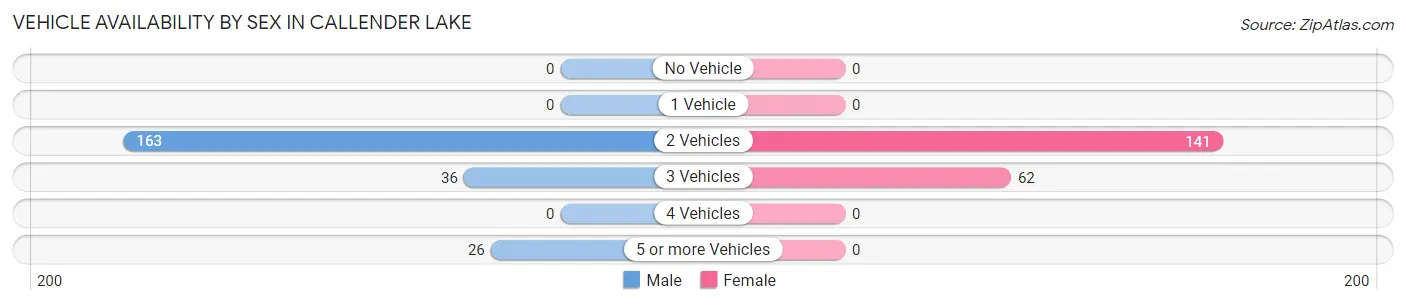
| Vehicles Available | Male | Female |
| No Vehicle | 0 (0.0%) | 0 (0.0%) |
| 1 Vehicle | 0 (0.0%) | 0 (0.0%) |
| 2 Vehicles | 163 (72.4%) | 141 (69.5%) |
| 3 Vehicles | 36 (16.0%) | 62 (30.5%) |
| 4 Vehicles | 0 (0.0%) | 0 (0.0%) |
| 5 or more Vehicles | 26 (11.6%) | 0 (0.0%) |
| Total | 225 (100.0%) | 203 (100.0%) |
Commute Time in Callender Lake
The most frequently occuring commute durations in Callender Lake are 45 to 59 minutes (292 commuters, 75.6%), 10 to 14 minutes (41 commuters, 10.6%), and 90 or more minutes (33 commuters, 8.6%).
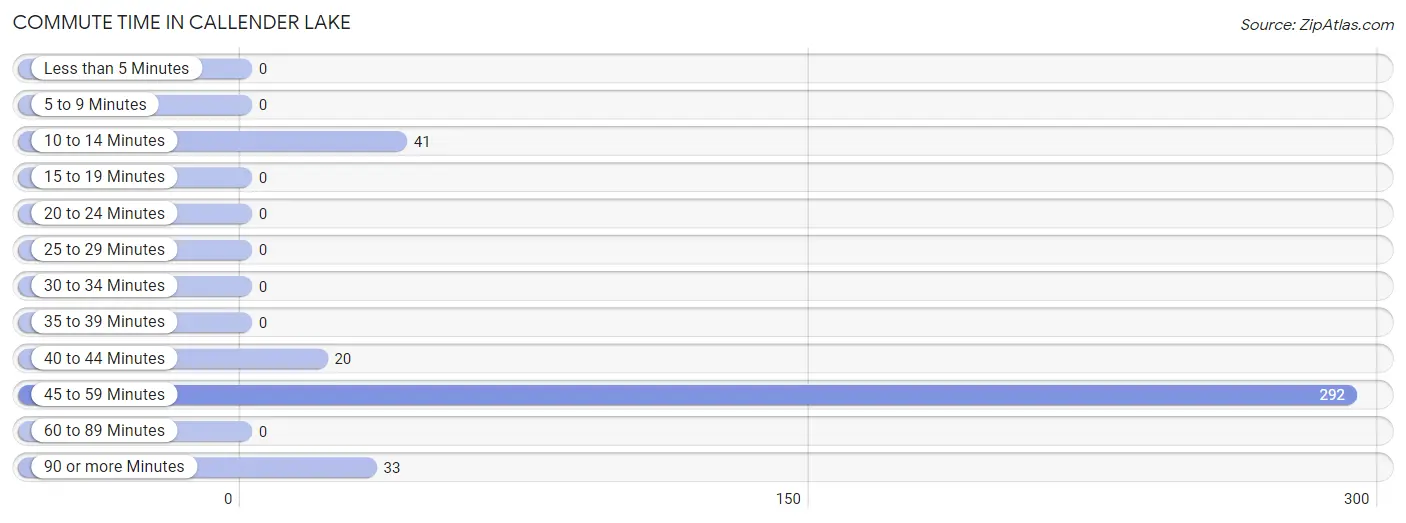
| Commute Time | # Commuters | % Commuters |
| Less than 5 Minutes | 0 | 0.0% |
| 5 to 9 Minutes | 0 | 0.0% |
| 10 to 14 Minutes | 41 | 10.6% |
| 15 to 19 Minutes | 0 | 0.0% |
| 20 to 24 Minutes | 0 | 0.0% |
| 25 to 29 Minutes | 0 | 0.0% |
| 30 to 34 Minutes | 0 | 0.0% |
| 35 to 39 Minutes | 0 | 0.0% |
| 40 to 44 Minutes | 20 | 5.2% |
| 45 to 59 Minutes | 292 | 75.6% |
| 60 to 89 Minutes | 0 | 0.0% |
| 90 or more Minutes | 33 | 8.6% |
Commute Time by Sex in Callender Lake
The most common commute times in Callender Lake are 45 to 59 minutes (151 commuters, 74.0%) for males and 45 to 59 minutes (141 commuters, 77.5%) for females.
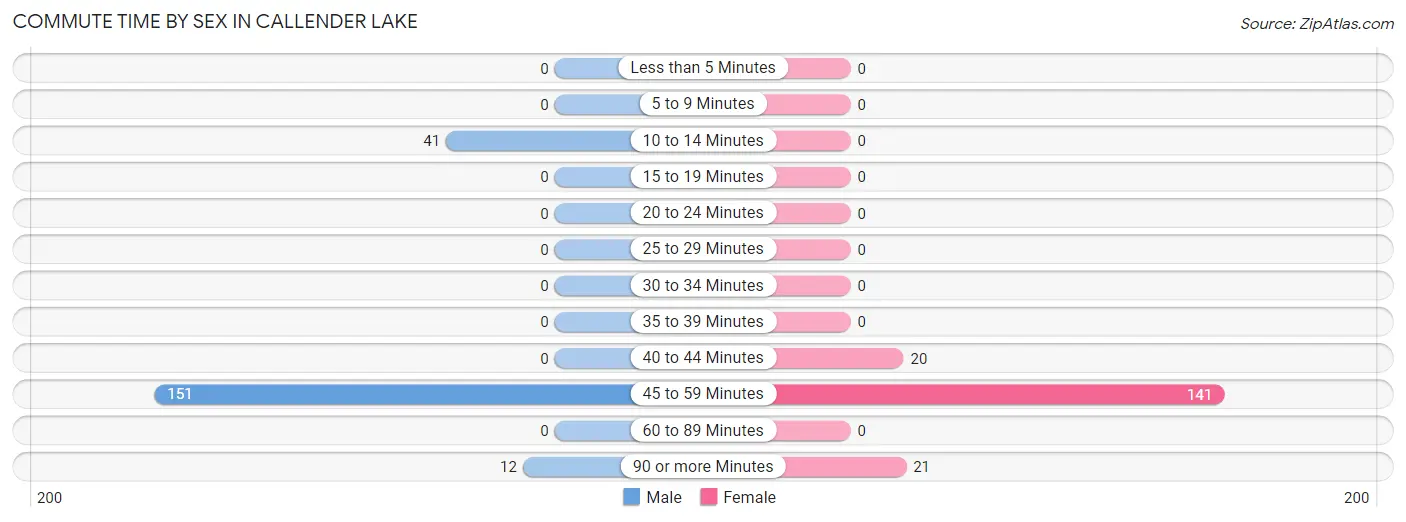
| Commute Time | Male | Female |
| Less than 5 Minutes | 0 (0.0%) | 0 (0.0%) |
| 5 to 9 Minutes | 0 (0.0%) | 0 (0.0%) |
| 10 to 14 Minutes | 41 (20.1%) | 0 (0.0%) |
| 15 to 19 Minutes | 0 (0.0%) | 0 (0.0%) |
| 20 to 24 Minutes | 0 (0.0%) | 0 (0.0%) |
| 25 to 29 Minutes | 0 (0.0%) | 0 (0.0%) |
| 30 to 34 Minutes | 0 (0.0%) | 0 (0.0%) |
| 35 to 39 Minutes | 0 (0.0%) | 0 (0.0%) |
| 40 to 44 Minutes | 0 (0.0%) | 20 (11.0%) |
| 45 to 59 Minutes | 151 (74.0%) | 141 (77.5%) |
| 60 to 89 Minutes | 0 (0.0%) | 0 (0.0%) |
| 90 or more Minutes | 12 (5.9%) | 21 (11.5%) |
Time of Departure to Work by Sex in Callender Lake
The most frequent times of departure to work in Callender Lake are 7:00 AM to 7:29 AM (166, 81.4%) for males and 8:00 AM to 8:29 AM (131, 72.0%) for females.
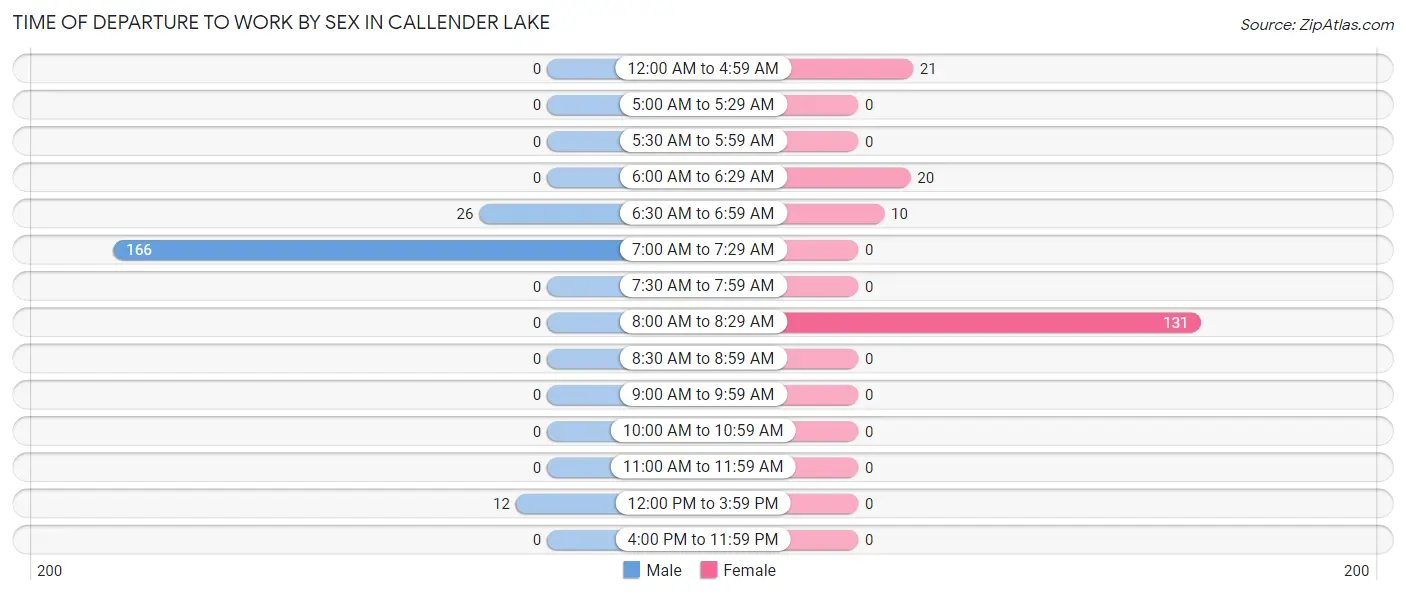
| Time of Departure | Male | Female |
| 12:00 AM to 4:59 AM | 0 (0.0%) | 21 (11.5%) |
| 5:00 AM to 5:29 AM | 0 (0.0%) | 0 (0.0%) |
| 5:30 AM to 5:59 AM | 0 (0.0%) | 0 (0.0%) |
| 6:00 AM to 6:29 AM | 0 (0.0%) | 20 (11.0%) |
| 6:30 AM to 6:59 AM | 26 (12.8%) | 10 (5.5%) |
| 7:00 AM to 7:29 AM | 166 (81.4%) | 0 (0.0%) |
| 7:30 AM to 7:59 AM | 0 (0.0%) | 0 (0.0%) |
| 8:00 AM to 8:29 AM | 0 (0.0%) | 131 (72.0%) |
| 8:30 AM to 8:59 AM | 0 (0.0%) | 0 (0.0%) |
| 9:00 AM to 9:59 AM | 0 (0.0%) | 0 (0.0%) |
| 10:00 AM to 10:59 AM | 0 (0.0%) | 0 (0.0%) |
| 11:00 AM to 11:59 AM | 0 (0.0%) | 0 (0.0%) |
| 12:00 PM to 3:59 PM | 12 (5.9%) | 0 (0.0%) |
| 4:00 PM to 11:59 PM | 0 (0.0%) | 0 (0.0%) |
| Total | 204 (100.0%) | 182 (100.0%) |
Housing Occupancy in Callender Lake
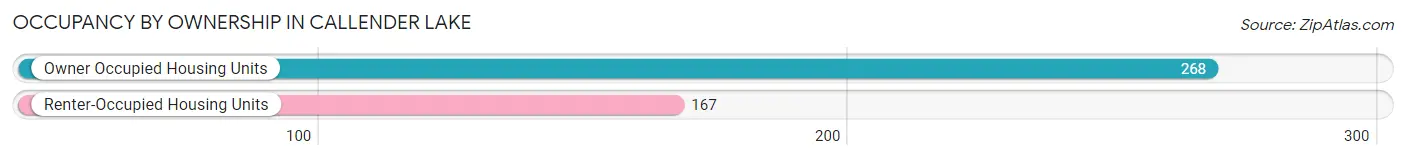
Occupancy by Ownership in Callender Lake
Of the total 435 dwellings in Callender Lake, owner-occupied units account for 268 (61.6%), while renter-occupied units make up 167 (38.4%).
| Occupancy | # Housing Units | % Housing Units |
| Owner Occupied Housing Units | 268 | 61.6% |
| Renter-Occupied Housing Units | 167 | 38.4% |
| Total Occupied Housing Units | 435 | 100.0% |
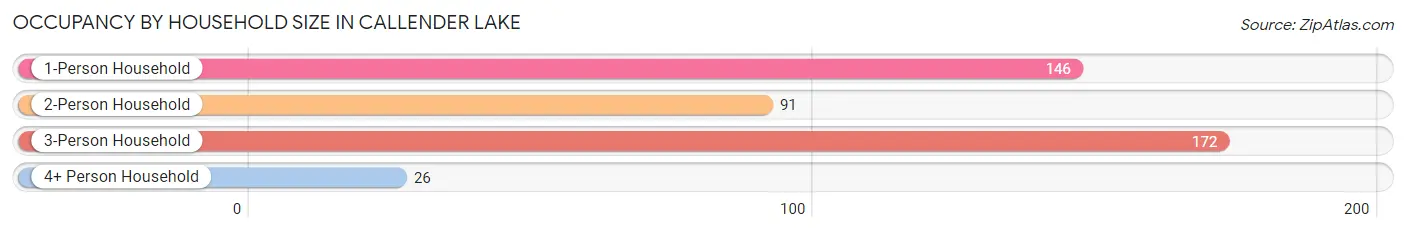
Occupancy by Household Size in Callender Lake
| Household Size | # Housing Units | % Housing Units |
| 1-Person Household | 146 | 33.6% |
| 2-Person Household | 91 | 20.9% |
| 3-Person Household | 172 | 39.5% |
| 4+ Person Household | 26 | 6.0% |
| Total Housing Units | 435 | 100.0% |
Occupancy by Ownership by Household Size in Callender Lake
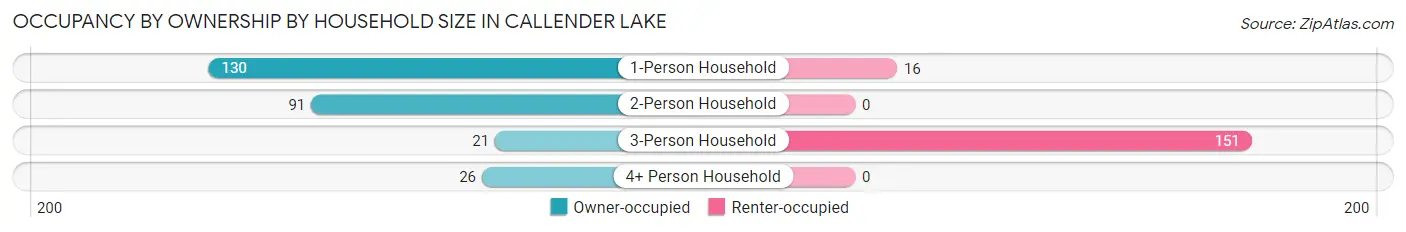
| Household Size | Owner-occupied | Renter-occupied |
| 1-Person Household | 130 (89.0%) | 16 (11.0%) |
| 2-Person Household | 91 (100.0%) | 0 (0.0%) |
| 3-Person Household | 21 (12.2%) | 151 (87.8%) |
| 4+ Person Household | 26 (100.0%) | 0 (0.0%) |
| Total Housing Units | 268 (61.6%) | 167 (38.4%) |
Occupancy by Educational Attainment in Callender Lake
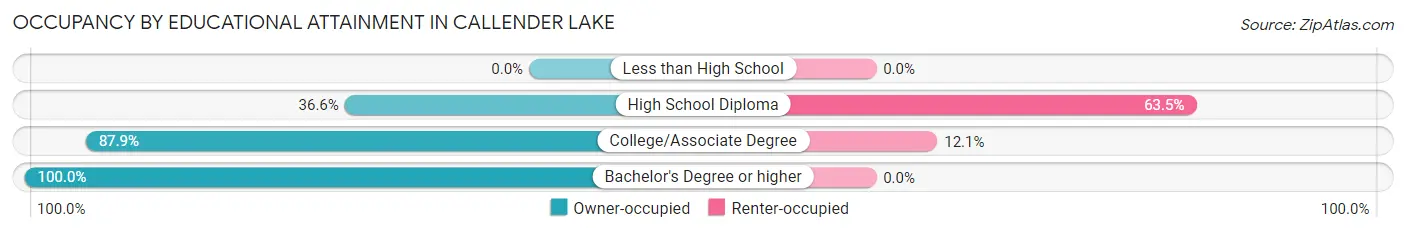
| Household Size | Owner-occupied | Renter-occupied |
| Less than High School | 0 (0.0%) | 0 (0.0%) |
| High School Diploma | 87 (36.5%) | 151 (63.4%) |
| College/Associate Degree | 116 (87.9%) | 16 (12.1%) |
| Bachelor's Degree or higher | 65 (100.0%) | 0 (0.0%) |
Occupancy by Age of Householder in Callender Lake
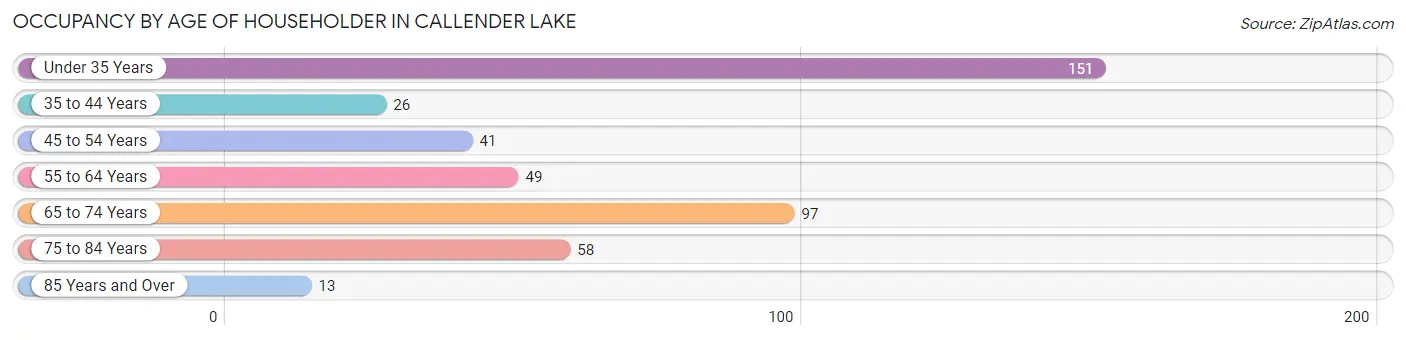
| Age Bracket | # Households | % Households |
| Under 35 Years | 151 | 34.7% |
| 35 to 44 Years | 26 | 6.0% |
| 45 to 54 Years | 41 | 9.4% |
| 55 to 64 Years | 49 | 11.3% |
| 65 to 74 Years | 97 | 22.3% |
| 75 to 84 Years | 58 | 13.3% |
| 85 Years and Over | 13 | 3.0% |
| Total | 435 | 100.0% |
Housing Finances in Callender Lake
Median Income by Occupancy in Callender Lake
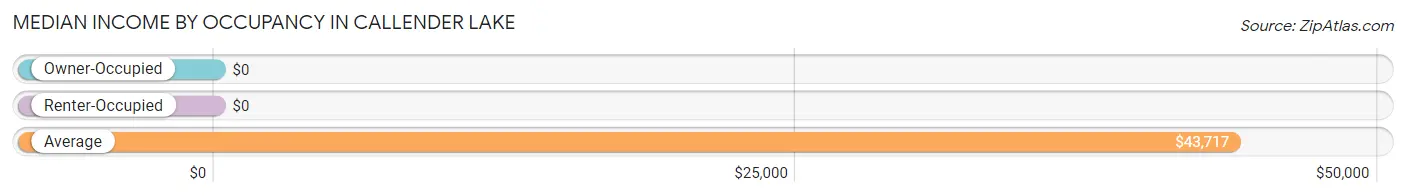
| Occupancy Type | # Households | Median Income |
| Owner-Occupied | 268 (61.6%) | $0 |
| Renter-Occupied | 167 (38.4%) | $0 |
| Average | 435 (100.0%) | $43,717 |
Occupancy by Householder Income Bracket in Callender Lake
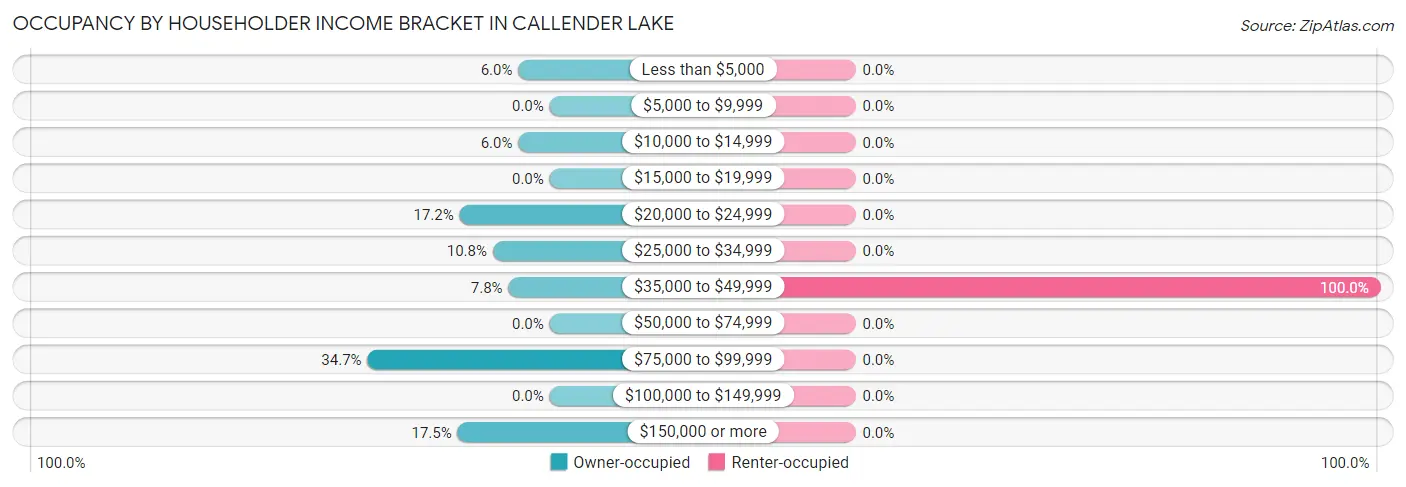
| Income Bracket | Owner-occupied | Renter-occupied |
| Less than $5,000 | 16 (6.0%) | 0 (0.0%) |
| $5,000 to $9,999 | 0 (0.0%) | 0 (0.0%) |
| $10,000 to $14,999 | 16 (6.0%) | 0 (0.0%) |
| $15,000 to $19,999 | 0 (0.0%) | 0 (0.0%) |
| $20,000 to $24,999 | 46 (17.2%) | 0 (0.0%) |
| $25,000 to $34,999 | 29 (10.8%) | 0 (0.0%) |
| $35,000 to $49,999 | 21 (7.8%) | 167 (100.0%) |
| $50,000 to $74,999 | 0 (0.0%) | 0 (0.0%) |
| $75,000 to $99,999 | 93 (34.7%) | 0 (0.0%) |
| $100,000 to $149,999 | 0 (0.0%) | 0 (0.0%) |
| $150,000 or more | 47 (17.5%) | 0 (0.0%) |
| Total | 268 (100.0%) | 167 (100.0%) |
Monthly Housing Cost Tiers in Callender Lake
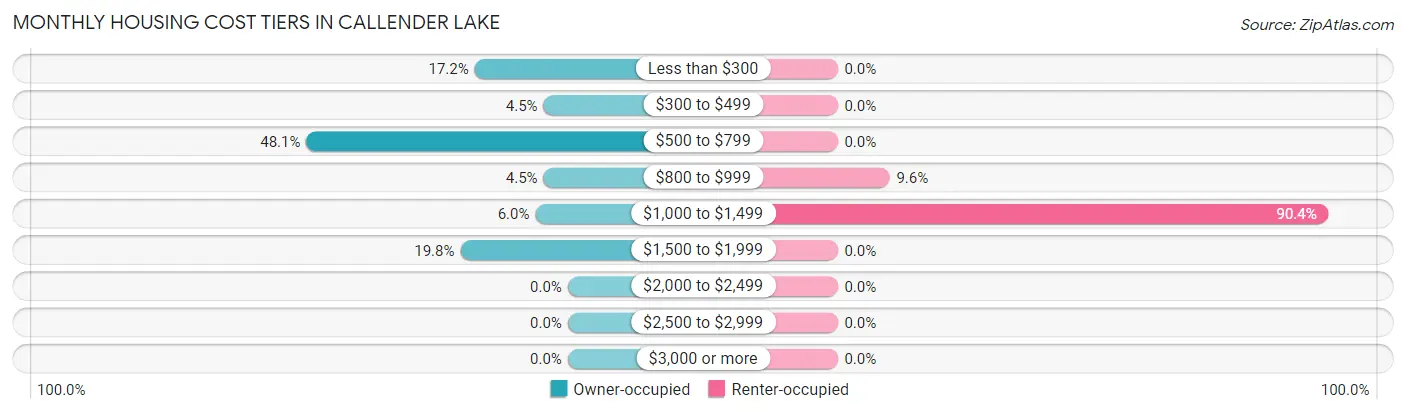
| Monthly Cost | Owner-occupied | Renter-occupied |
| Less than $300 | 46 (17.2%) | 0 (0.0%) |
| $300 to $499 | 12 (4.5%) | 0 (0.0%) |
| $500 to $799 | 129 (48.1%) | 0 (0.0%) |
| $800 to $999 | 12 (4.5%) | 16 (9.6%) |
| $1,000 to $1,499 | 16 (6.0%) | 151 (90.4%) |
| $1,500 to $1,999 | 53 (19.8%) | 0 (0.0%) |
| $2,000 to $2,499 | 0 (0.0%) | 0 (0.0%) |
| $2,500 to $2,999 | 0 (0.0%) | 0 (0.0%) |
| $3,000 or more | 0 (0.0%) | 0 (0.0%) |
| Total | 268 (100.0%) | 167 (100.0%) |
Physical Housing Characteristics in Callender Lake
Housing Structures in Callender Lake
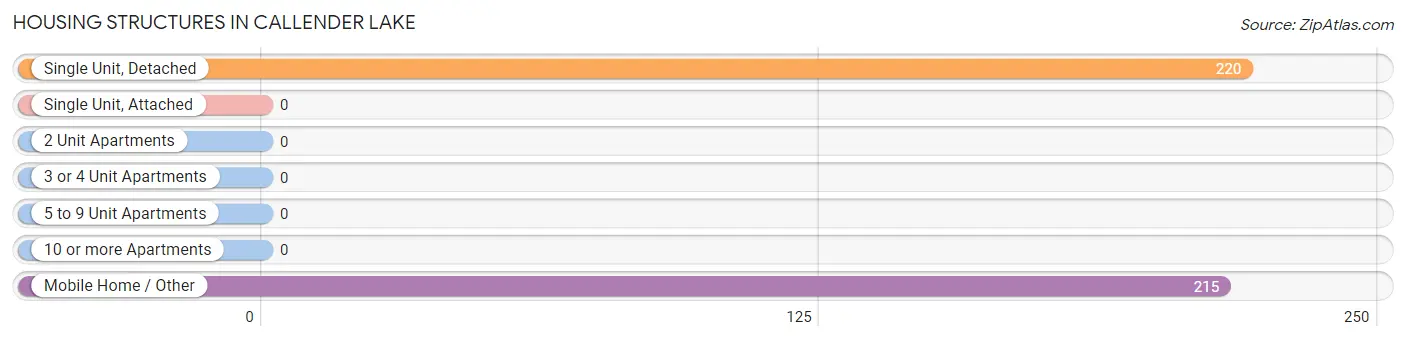
| Structure Type | # Housing Units | % Housing Units |
| Single Unit, Detached | 220 | 50.6% |
| Single Unit, Attached | 0 | 0.0% |
| 2 Unit Apartments | 0 | 0.0% |
| 3 or 4 Unit Apartments | 0 | 0.0% |
| 5 to 9 Unit Apartments | 0 | 0.0% |
| 10 or more Apartments | 0 | 0.0% |
| Mobile Home / Other | 215 | 49.4% |
| Total | 435 | 100.0% |
Housing Structures by Occupancy in Callender Lake
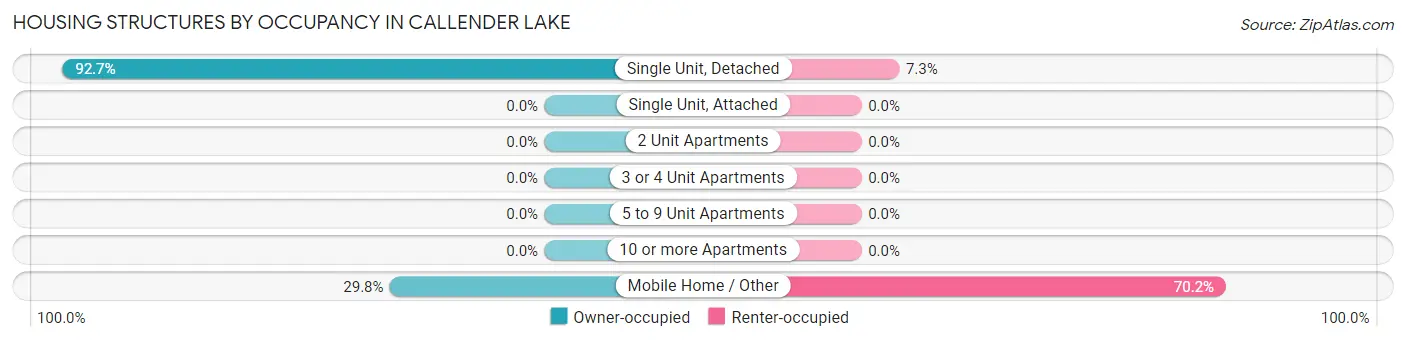
| Structure Type | Owner-occupied | Renter-occupied |
| Single Unit, Detached | 204 (92.7%) | 16 (7.3%) |
| Single Unit, Attached | 0 (0.0%) | 0 (0.0%) |
| 2 Unit Apartments | 0 (0.0%) | 0 (0.0%) |
| 3 or 4 Unit Apartments | 0 (0.0%) | 0 (0.0%) |
| 5 to 9 Unit Apartments | 0 (0.0%) | 0 (0.0%) |
| 10 or more Apartments | 0 (0.0%) | 0 (0.0%) |
| Mobile Home / Other | 64 (29.8%) | 151 (70.2%) |
| Total | 268 (61.6%) | 167 (38.4%) |
Housing Structures by Number of Rooms in Callender Lake
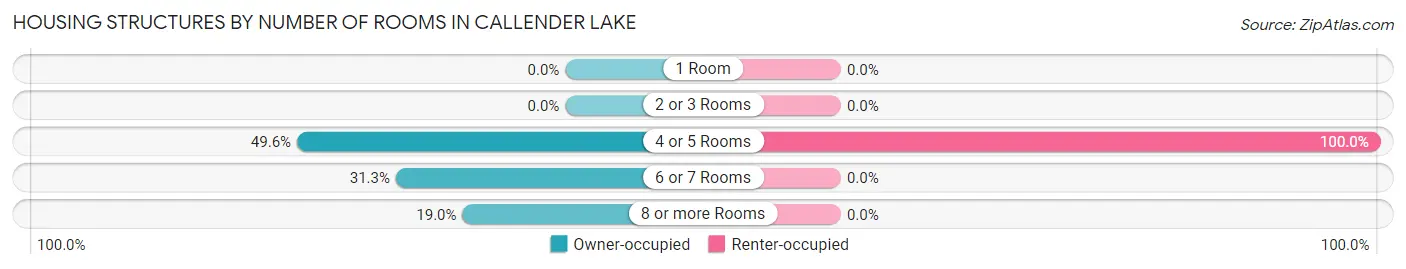
| Number of Rooms | Owner-occupied | Renter-occupied |
| 1 Room | 0 (0.0%) | 0 (0.0%) |
| 2 or 3 Rooms | 0 (0.0%) | 0 (0.0%) |
| 4 or 5 Rooms | 133 (49.6%) | 167 (100.0%) |
| 6 or 7 Rooms | 84 (31.3%) | 0 (0.0%) |
| 8 or more Rooms | 51 (19.0%) | 0 (0.0%) |
| Total | 268 (100.0%) | 167 (100.0%) |
Housing Structure by Heating Type in Callender Lake
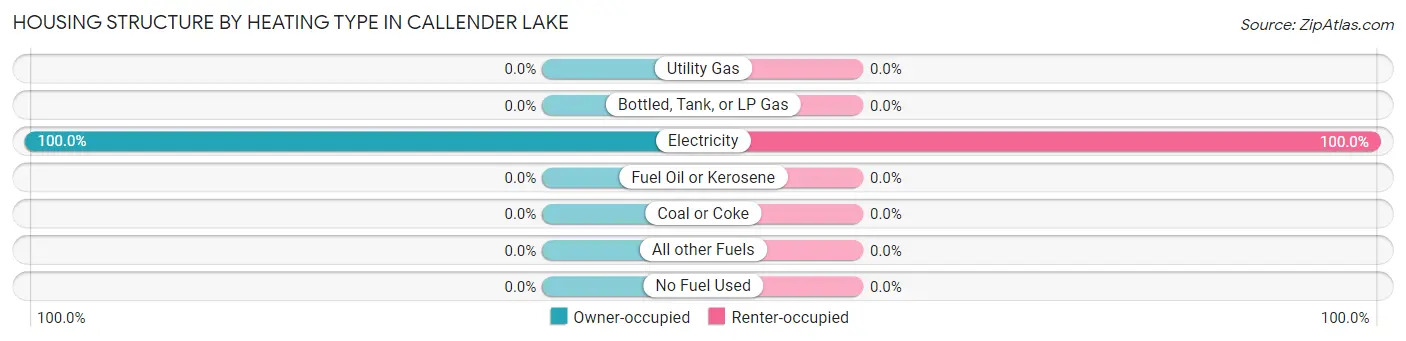
| Heating Type | Owner-occupied | Renter-occupied |
| Utility Gas | 0 (0.0%) | 0 (0.0%) |
| Bottled, Tank, or LP Gas | 0 (0.0%) | 0 (0.0%) |
| Electricity | 268 (100.0%) | 167 (100.0%) |
| Fuel Oil or Kerosene | 0 (0.0%) | 0 (0.0%) |
| Coal or Coke | 0 (0.0%) | 0 (0.0%) |
| All other Fuels | 0 (0.0%) | 0 (0.0%) |
| No Fuel Used | 0 (0.0%) | 0 (0.0%) |
| Total | 268 (100.0%) | 167 (100.0%) |
Household Vehicle Usage in Callender Lake
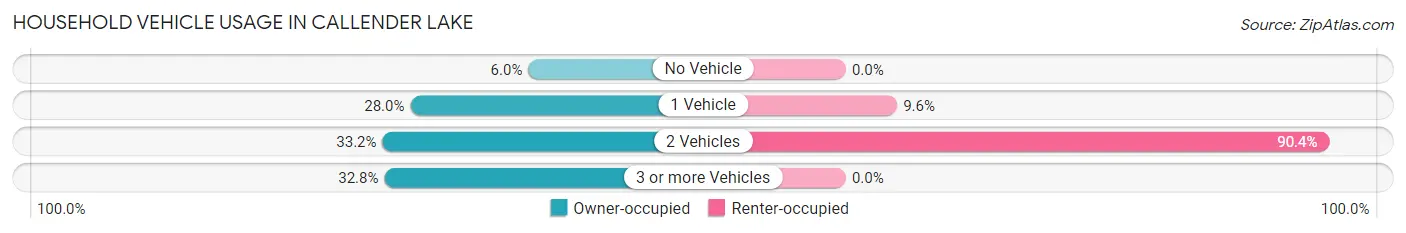
| Vehicles per Household | Owner-occupied | Renter-occupied |
| No Vehicle | 16 (6.0%) | 0 (0.0%) |
| 1 Vehicle | 75 (28.0%) | 16 (9.6%) |
| 2 Vehicles | 89 (33.2%) | 151 (90.4%) |
| 3 or more Vehicles | 88 (32.8%) | 0 (0.0%) |
| Total | 268 (100.0%) | 167 (100.0%) |
Real Estate & Mortgages in Callender Lake
Real Estate and Mortgage Overview in Callender Lake
| Characteristic | Without Mortgage | With Mortgage |
| Housing Units | 178 | 90 |
| Median Property Value | $268,800 | $141,700 |
| Median Household Income | - | - |
| Monthly Housing Costs | $565 | $0 |
| Real Estate Taxes | - | - |
Property Value by Mortgage Status in Callender Lake
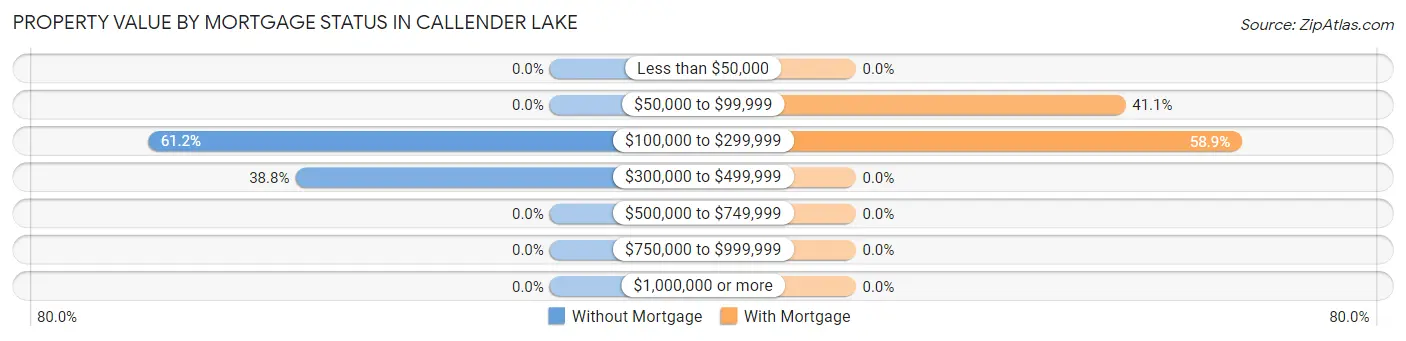
| Property Value | Without Mortgage | With Mortgage |
| Less than $50,000 | 0 (0.0%) | 0 (0.0%) |
| $50,000 to $99,999 | 0 (0.0%) | 37 (41.1%) |
| $100,000 to $299,999 | 109 (61.2%) | 53 (58.9%) |
| $300,000 to $499,999 | 69 (38.8%) | 0 (0.0%) |
| $500,000 to $749,999 | 0 (0.0%) | 0 (0.0%) |
| $750,000 to $999,999 | 0 (0.0%) | 0 (0.0%) |
| $1,000,000 or more | 0 (0.0%) | 0 (0.0%) |
| Total | 178 (100.0%) | 90 (100.0%) |
Household Income by Mortgage Status in Callender Lake
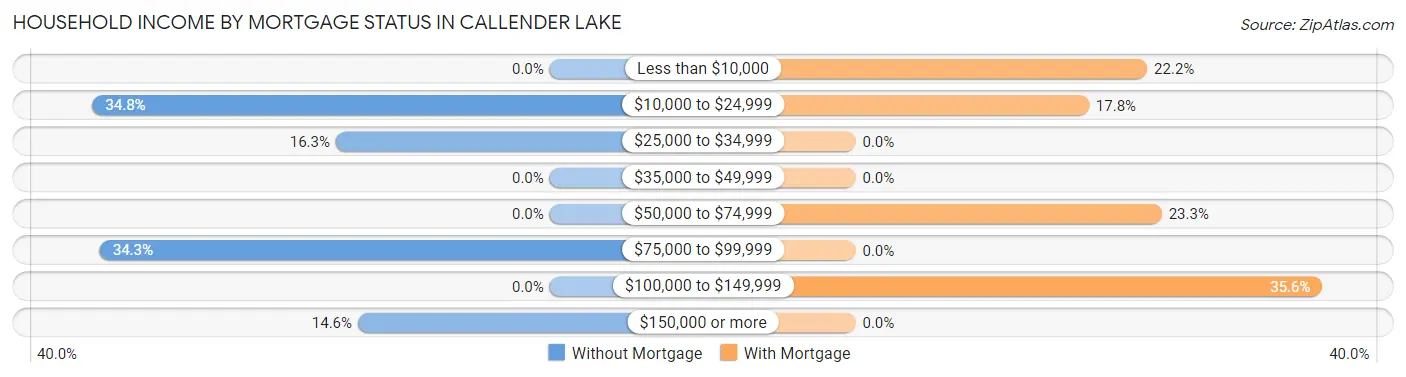
| Household Income | Without Mortgage | With Mortgage |
| Less than $10,000 | 0 (0.0%) | 20 (22.2%) |
| $10,000 to $24,999 | 62 (34.8%) | 16 (17.8%) |
| $25,000 to $34,999 | 29 (16.3%) | 0 (0.0%) |
| $35,000 to $49,999 | 0 (0.0%) | 0 (0.0%) |
| $50,000 to $74,999 | 0 (0.0%) | 21 (23.3%) |
| $75,000 to $99,999 | 61 (34.3%) | 0 (0.0%) |
| $100,000 to $149,999 | 0 (0.0%) | 32 (35.6%) |
| $150,000 or more | 26 (14.6%) | 0 (0.0%) |
| Total | 178 (100.0%) | 90 (100.0%) |
Property Value to Household Income Ratio in Callender Lake
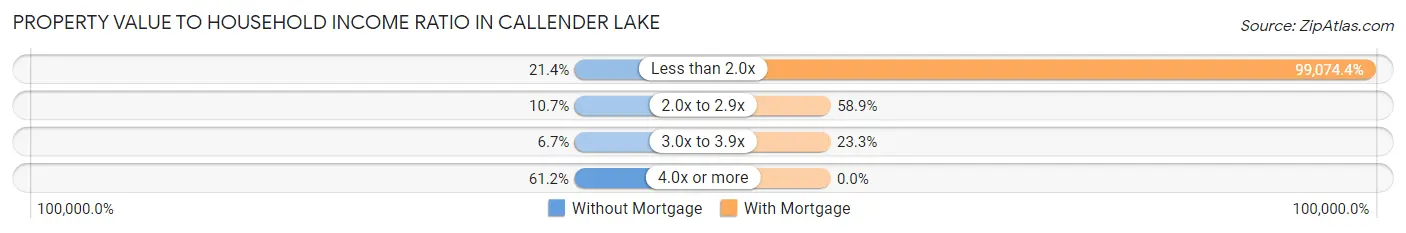
| Value-to-Income Ratio | Without Mortgage | With Mortgage |
| Less than 2.0x | 38 (21.3%) | 89,167 (99,074.4%) |
| 2.0x to 2.9x | 19 (10.7%) | 53 (58.9%) |
| 3.0x to 3.9x | 12 (6.7%) | 21 (23.3%) |
| 4.0x or more | 109 (61.2%) | 0 (0.0%) |
| Total | 178 (100.0%) | 90 (100.0%) |
Real Estate Taxes by Mortgage Status in Callender Lake
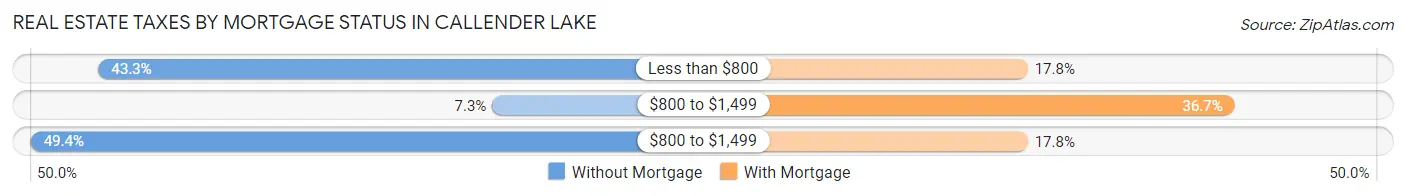
| Property Taxes | Without Mortgage | With Mortgage |
| Less than $800 | 77 (43.3%) | 16 (17.8%) |
| $800 to $1,499 | 13 (7.3%) | 33 (36.7%) |
| $800 to $1,499 | 88 (49.4%) | 16 (17.8%) |
| Total | 178 (100.0%) | 90 (100.0%) |
Health & Disability in Callender Lake
Health Insurance Coverage by Age in Callender Lake
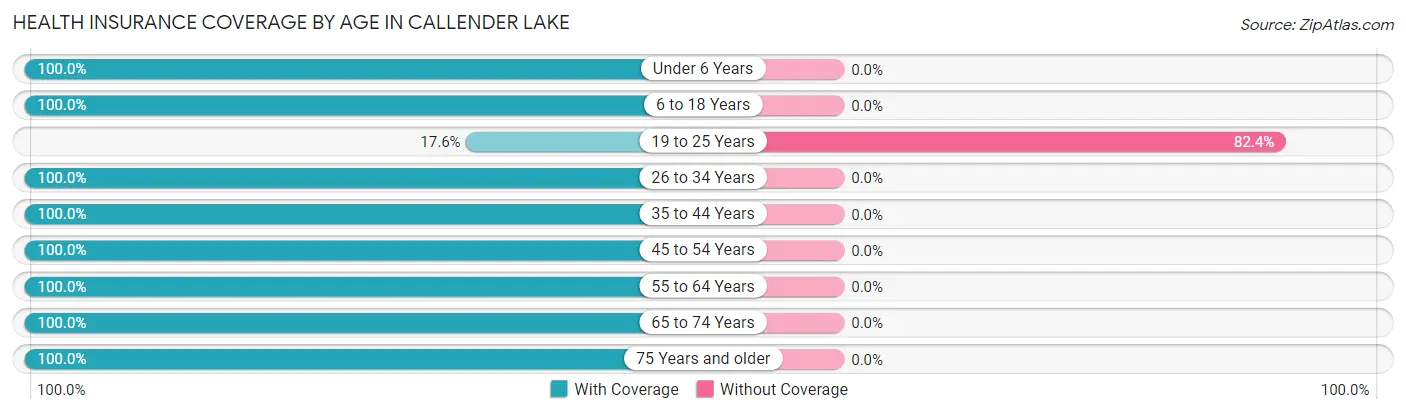
| Age Bracket | With Coverage | Without Coverage |
| Under 6 Years | 135 (100.0%) | 0 (0.0%) |
| 6 to 18 Years | 41 (100.0%) | 0 (0.0%) |
| 19 to 25 Years | 28 (17.6%) | 131 (82.4%) |
| 26 to 34 Years | 151 (100.0%) | 0 (0.0%) |
| 35 to 44 Years | 26 (100.0%) | 0 (0.0%) |
| 45 to 54 Years | 101 (100.0%) | 0 (0.0%) |
| 55 to 64 Years | 65 (100.0%) | 0 (0.0%) |
| 65 to 74 Years | 154 (100.0%) | 0 (0.0%) |
| 75 Years and older | 71 (100.0%) | 0 (0.0%) |
| Total | 772 (85.5%) | 131 (14.5%) |
Health Insurance Coverage by Citizenship Status in Callender Lake
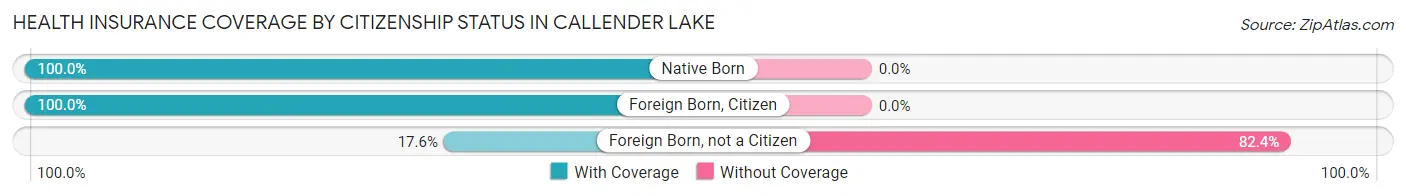
| Citizenship Status | With Coverage | Without Coverage |
| Native Born | 135 (100.0%) | 0 (0.0%) |
| Foreign Born, Citizen | 41 (100.0%) | 0 (0.0%) |
| Foreign Born, not a Citizen | 28 (17.6%) | 131 (82.4%) |
Health Insurance Coverage by Household Income in Callender Lake
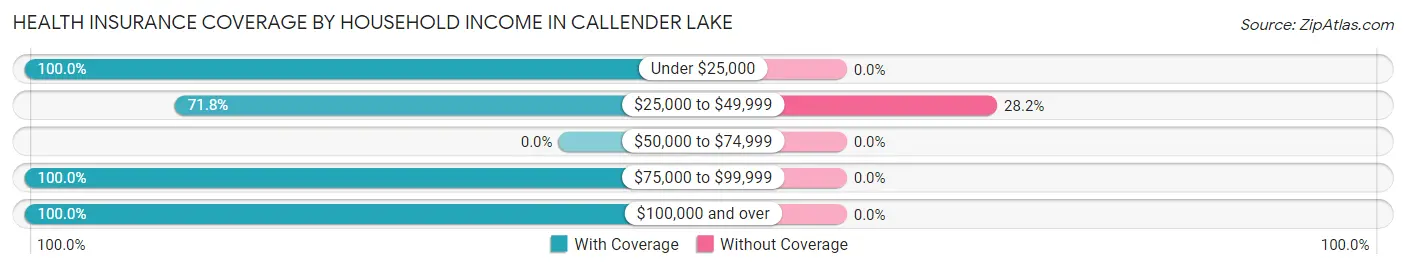
| Household Income | With Coverage | Without Coverage |
| Under $25,000 | 94 (100.0%) | 0 (0.0%) |
| $25,000 to $49,999 | 334 (71.8%) | 131 (28.2%) |
| $50,000 to $74,999 | 0 (0.0%) | 0 (0.0%) |
| $75,000 to $99,999 | 165 (100.0%) | 0 (0.0%) |
| $100,000 and over | 179 (100.0%) | 0 (0.0%) |
Public vs Private Health Insurance Coverage by Age in Callender Lake
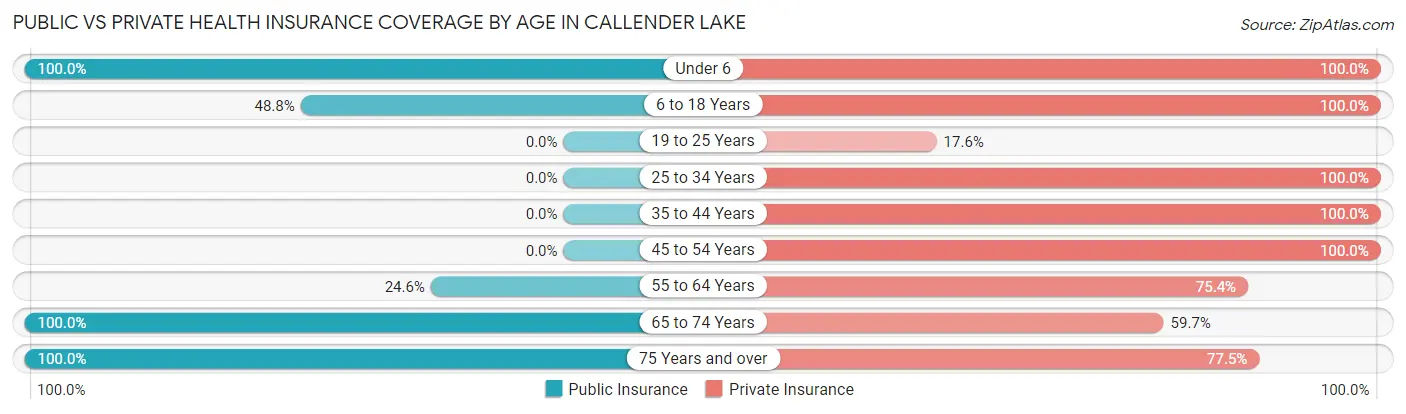
| Age Bracket | Public Insurance | Private Insurance |
| Under 6 | 135 (100.0%) | 135 (100.0%) |
| 6 to 18 Years | 20 (48.8%) | 41 (100.0%) |
| 19 to 25 Years | 0 (0.0%) | 28 (17.6%) |
| 25 to 34 Years | 0 (0.0%) | 151 (100.0%) |
| 35 to 44 Years | 0 (0.0%) | 26 (100.0%) |
| 45 to 54 Years | 0 (0.0%) | 101 (100.0%) |
| 55 to 64 Years | 16 (24.6%) | 49 (75.4%) |
| 65 to 74 Years | 154 (100.0%) | 92 (59.7%) |
| 75 Years and over | 71 (100.0%) | 55 (77.5%) |
| Total | 396 (43.9%) | 678 (75.1%) |
Disability Status by Sex by Age in Callender Lake
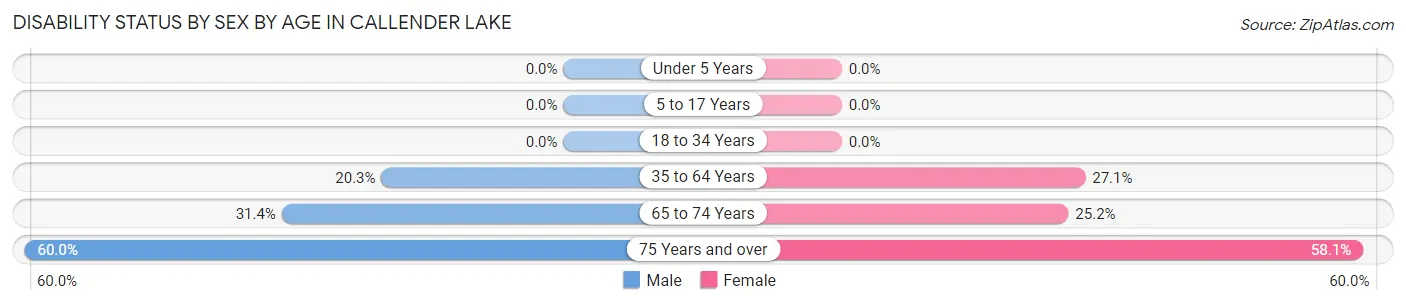
| Age Bracket | Male | Female |
| Under 5 Years | 0 (0.0%) | 0 (0.0%) |
| 5 to 17 Years | 0 (0.0%) | 0 (0.0%) |
| 18 to 34 Years | 0 (0.0%) | 0 (0.0%) |
| 35 to 64 Years | 15 (20.3%) | 32 (27.1%) |
| 65 to 74 Years | 16 (31.4%) | 26 (25.2%) |
| 75 Years and over | 24 (60.0%) | 18 (58.1%) |
Disability Class by Sex by Age in Callender Lake
Disability Class: Hearing Difficulty
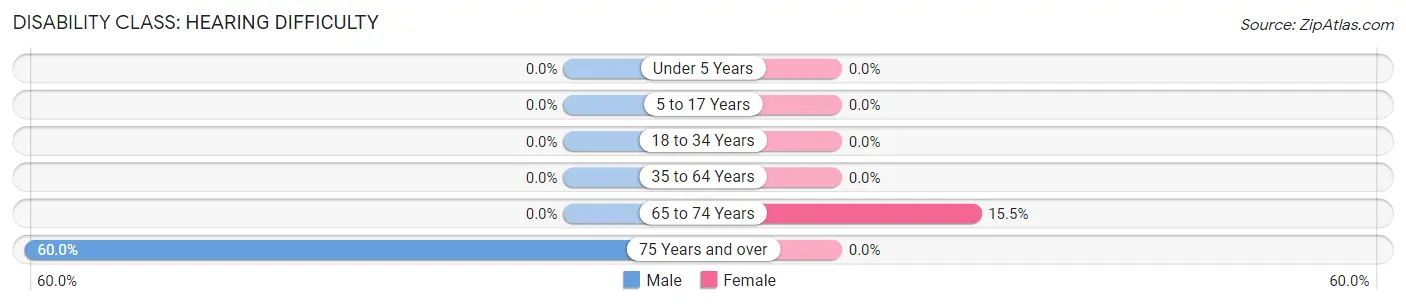
| Age Bracket | Male | Female |
| Under 5 Years | 0 (0.0%) | 0 (0.0%) |
| 5 to 17 Years | 0 (0.0%) | 0 (0.0%) |
| 18 to 34 Years | 0 (0.0%) | 0 (0.0%) |
| 35 to 64 Years | 0 (0.0%) | 0 (0.0%) |
| 65 to 74 Years | 0 (0.0%) | 16 (15.5%) |
| 75 Years and over | 24 (60.0%) | 0 (0.0%) |
Disability Class: Vision Difficulty
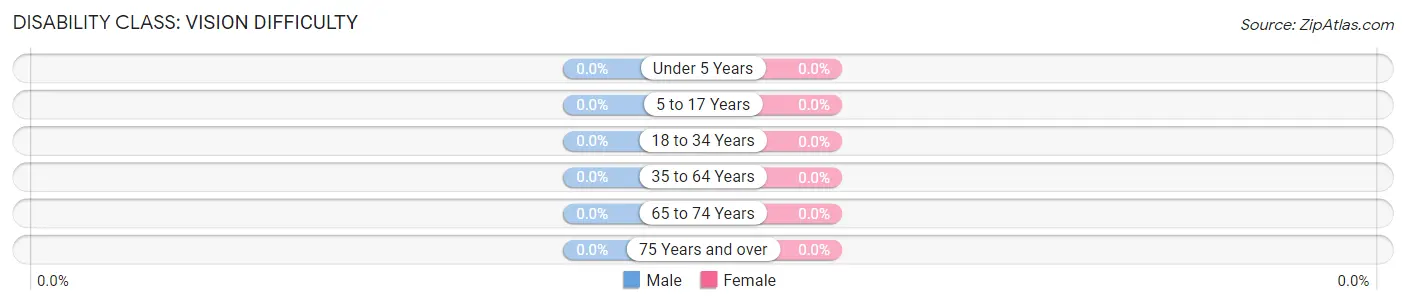
| Age Bracket | Male | Female |
| Under 5 Years | 0 (0.0%) | 0 (0.0%) |
| 5 to 17 Years | 0 (0.0%) | 0 (0.0%) |
| 18 to 34 Years | 0 (0.0%) | 0 (0.0%) |
| 35 to 64 Years | 0 (0.0%) | 0 (0.0%) |
| 65 to 74 Years | 0 (0.0%) | 0 (0.0%) |
| 75 Years and over | 0 (0.0%) | 0 (0.0%) |
Disability Class: Cognitive Difficulty
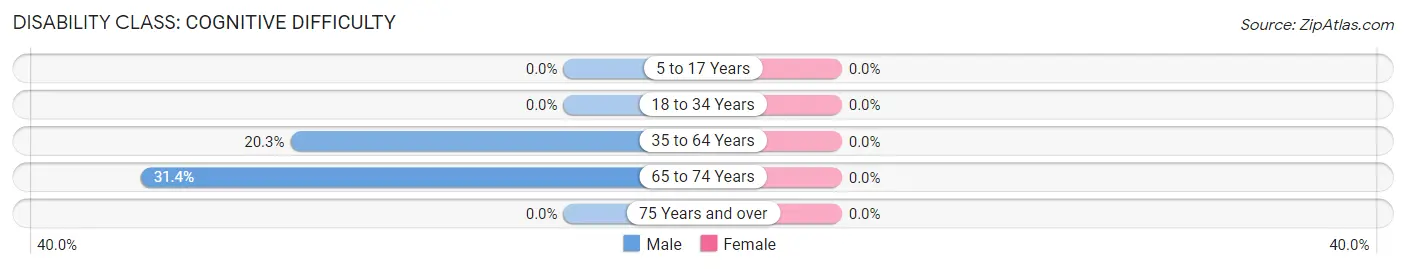
| Age Bracket | Male | Female |
| 5 to 17 Years | 0 (0.0%) | 0 (0.0%) |
| 18 to 34 Years | 0 (0.0%) | 0 (0.0%) |
| 35 to 64 Years | 15 (20.3%) | 0 (0.0%) |
| 65 to 74 Years | 16 (31.4%) | 0 (0.0%) |
| 75 Years and over | 0 (0.0%) | 0 (0.0%) |
Disability Class: Ambulatory Difficulty
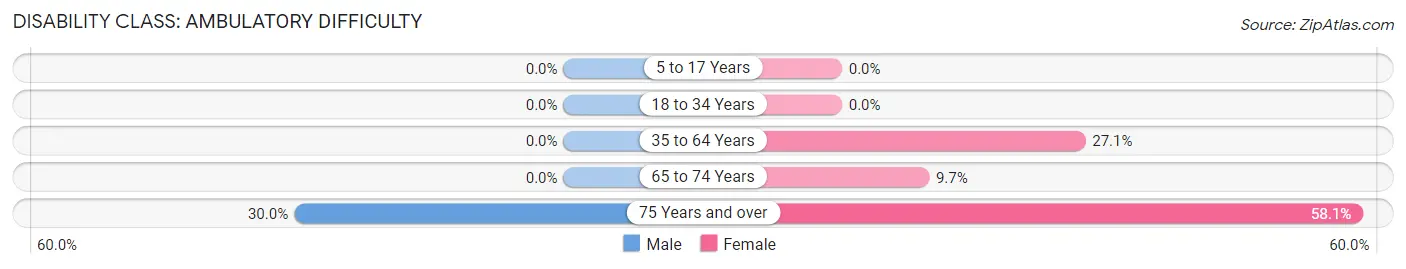
| Age Bracket | Male | Female |
| 5 to 17 Years | 0 (0.0%) | 0 (0.0%) |
| 18 to 34 Years | 0 (0.0%) | 0 (0.0%) |
| 35 to 64 Years | 0 (0.0%) | 32 (27.1%) |
| 65 to 74 Years | 0 (0.0%) | 10 (9.7%) |
| 75 Years and over | 12 (30.0%) | 18 (58.1%) |
Disability Class: Self-Care Difficulty
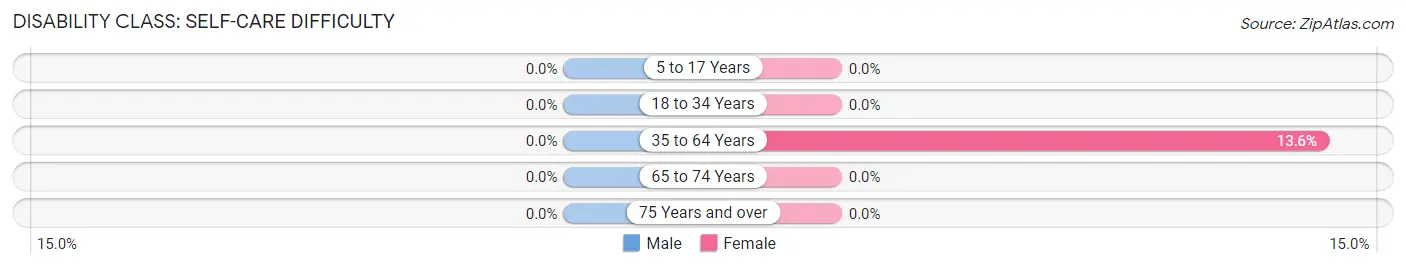
| Age Bracket | Male | Female |
| 5 to 17 Years | 0 (0.0%) | 0 (0.0%) |
| 18 to 34 Years | 0 (0.0%) | 0 (0.0%) |
| 35 to 64 Years | 0 (0.0%) | 16 (13.6%) |
| 65 to 74 Years | 0 (0.0%) | 0 (0.0%) |
| 75 Years and over | 0 (0.0%) | 0 (0.0%) |
Technology Access in Callender Lake
Computing Device Access in Callender Lake
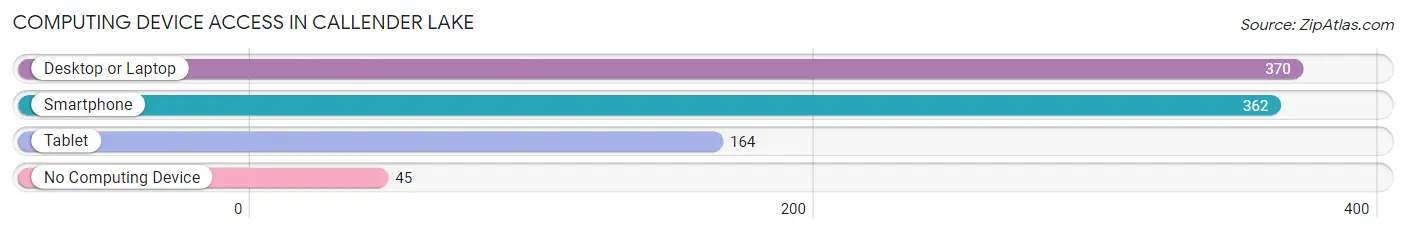
| Device Type | # Households | % Households |
| Desktop or Laptop | 370 | 85.1% |
| Smartphone | 362 | 83.2% |
| Tablet | 164 | 37.7% |
| No Computing Device | 45 | 10.3% |
| Total | 435 | 100.0% |
Internet Access in Callender Lake
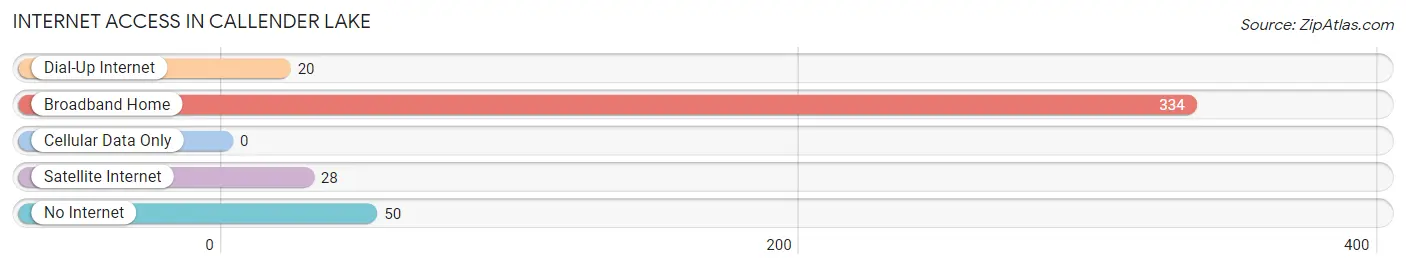
| Internet Type | # Households | % Households |
| Dial-Up Internet | 20 | 4.6% |
| Broadband Home | 334 | 76.8% |
| Cellular Data Only | 0 | 0.0% |
| Satellite Internet | 28 | 6.4% |
| No Internet | 50 | 11.5% |
| Total | 435 | 100.0% |
Callender Lake Summary
Callender Lake is a small lake located in East Texas, near the town of Quitman. It is a popular destination for fishing, boating, and other recreational activities. The lake is part of the Quitman Independent School District and is located in Wood County.
History
Callender Lake was created in the early 1900s when the Quitman Independent School District purchased the land from the Callender family. The lake was originally used as a water source for the school district, but it soon became a popular recreational spot. The lake was stocked with fish in the 1930s and has since become a popular fishing destination.
Geography
Callender Lake is located in East Texas, near the town of Quitman. It is a small lake, covering an area of approximately 1,000 acres. The lake is surrounded by wooded hills and is fed by several small creeks. The lake is located at an elevation of approximately 400 feet above sea level.
Economy
The economy of Callender Lake is largely based on tourism and recreation. The lake is a popular destination for fishing, boating, and other recreational activities. There are several marinas and boat ramps located around the lake, as well as several campgrounds. The lake is also home to several restaurants and other businesses that cater to visitors.
Demographics
As of the 2010 census, the population of Callender Lake was 1,845. The population is largely white (90.3%), with a small percentage of African Americans (4.2%) and Hispanics (3.2%). The median household income is $37,917, and the median age is 43.7 years.
Conclusion
Callender Lake is a small lake located in East Texas, near the town of Quitman. It is a popular destination for fishing, boating, and other recreational activities. The lake is part of the Quitman Independent School District and is home to a population of 1,845 people. The economy of Callender Lake is largely based on tourism and recreation, and the lake is home to several marinas, boat ramps, campgrounds, and other businesses.
Common Questions
What is Per Capita Income in Callender Lake?
Per Capita income in Callender Lake is $49,541.
What is the Median Household income in Callender Lake?
Median Household Income in Callender Lake is $43,717.
What is Income or Wage Gap in Callender Lake?
Income or Wage Gap in Callender Lake is 73.5%.
Women in Callender Lake earn 26.5 cents for every dollar earned by a man.
What is Inequality or Gini Index in Callender Lake?
Inequality or Gini Index in Callender Lake is 0.62.
What is the Total Population of Callender Lake?
Total Population of Callender Lake is 903.
What is the Total Male Population of Callender Lake?
Total Male Population of Callender Lake is 461.
What is the Total Female Population of Callender Lake?
Total Female Population of Callender Lake is 442.
What is the Ratio of Males per 100 Females in Callender Lake?
There are 104.30 Males per 100 Females in Callender Lake.
What is the Ratio of Females per 100 Males in Callender Lake?
There are 95.88 Females per 100 Males in Callender Lake.
What is the Median Population Age in Callender Lake?
Median Population Age in Callender Lake is 27.8 Years.
What is the Average Family Size in Callender Lake
Average Family Size in Callender Lake is 2.6 People.
What is the Average Household Size in Callender Lake
Average Household Size in Callender Lake is 2.1 People.
How Large is the Labor Force in Callender Lake?
There are 428 People in the Labor Forcein in Callender Lake.
What is the Percentage of People in the Labor Force in Callender Lake?
58.9% of People are in the Labor Force in Callender Lake.