Goodlettsville, TN Map & Demographics
Goodlettsville Map
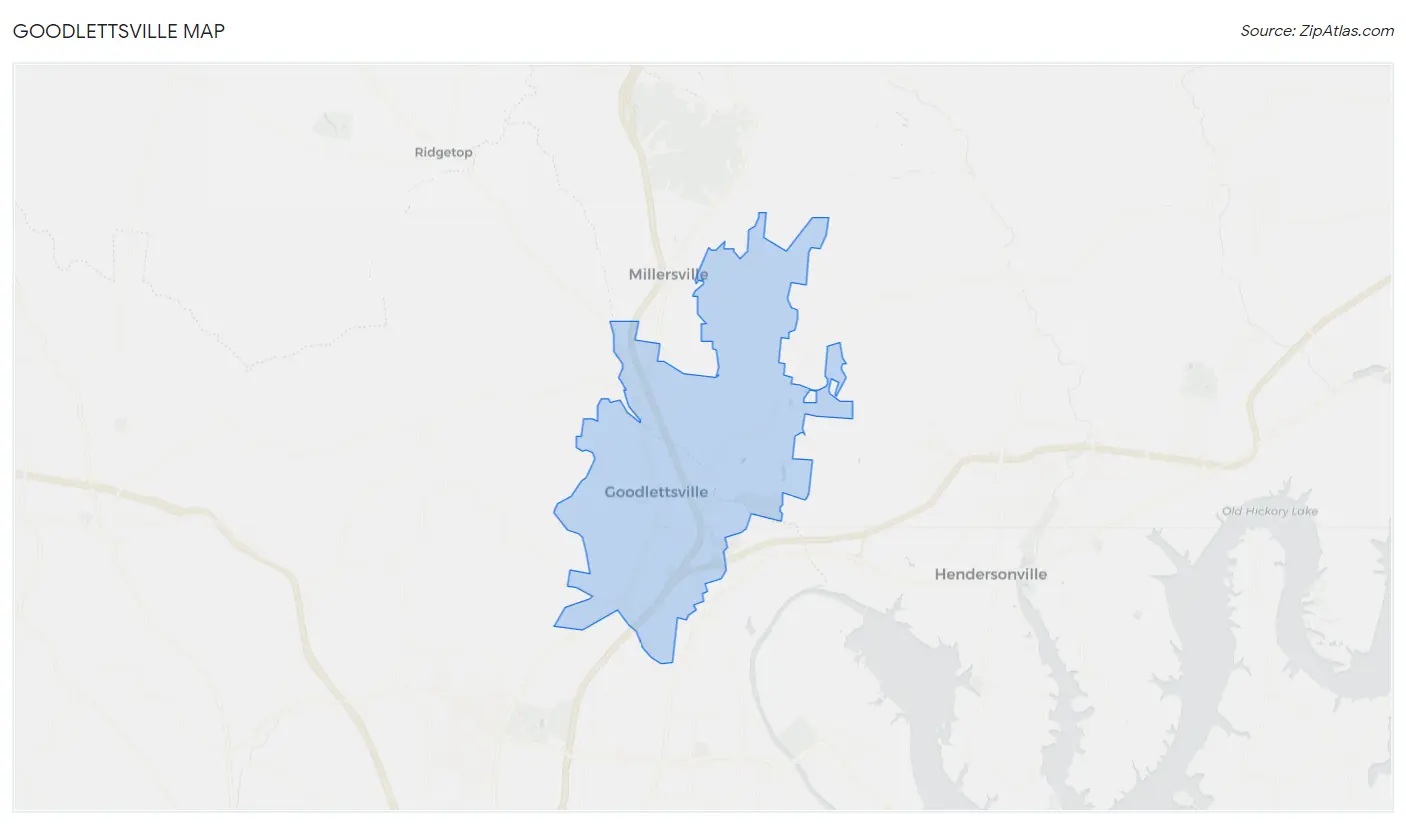
Goodlettsville Overview
$38,619
PER CAPITA INCOME
$93,595
AVG FAMILY INCOME
$64,581
AVG HOUSEHOLD INCOME
25.1%
WAGE / INCOME GAP [ % ]
74.9¢/ $1
WAGE / INCOME GAP [ $ ]
0.47
INEQUALITY / GINI INDEX
17,500
TOTAL POPULATION
7,769
MALE POPULATION
9,731
FEMALE POPULATION
79.84
MALES / 100 FEMALES
125.25
FEMALES / 100 MALES
38.2
MEDIAN AGE
3.0
AVG FAMILY SIZE
2.4
AVG HOUSEHOLD SIZE
9,384
LABOR FORCE [ PEOPLE ]
66.4%
PERCENT IN LABOR FORCE
5.8%
UNEMPLOYMENT RATE
Goodlettsville Zip Codes
Goodlettsville Area Codes
Income in Goodlettsville
Income Overview in Goodlettsville
Per Capita Income in Goodlettsville is $38,619, while median incomes of families and households are $93,595 and $64,581 respectively.
| Characteristic | Number | Measure |
| Per Capita Income | 17,500 | $38,619 |
| Median Family Income | 4,384 | $93,595 |
| Mean Family Income | 4,384 | $119,295 |
| Median Household Income | 7,283 | $64,581 |
| Mean Household Income | 7,283 | $92,030 |
| Income Deficit | 4,384 | $0 |
| Wage / Income Gap (%) | 17,500 | 25.10% |
| Wage / Income Gap ($) | 17,500 | 74.90¢ per $1 |
| Gini / Inequality Index | 17,500 | 0.47 |
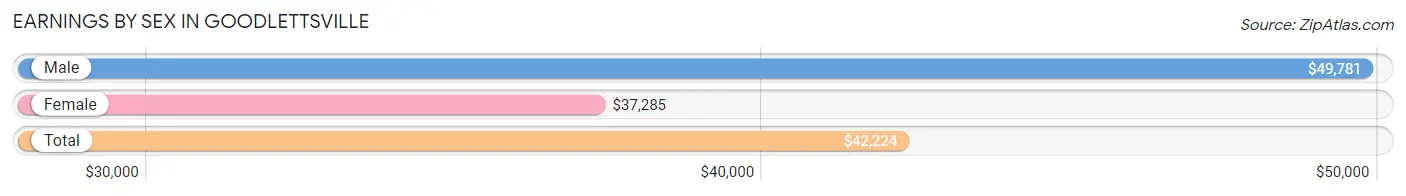
Earnings by Sex in Goodlettsville
Average Earnings in Goodlettsville are $42,224, $49,781 for men and $37,285 for women, a difference of 25.1%.
| Sex | Number | Average Earnings |
| Male | 4,572 (46.1%) | $49,781 |
| Female | 5,356 (53.9%) | $37,285 |
| Total | 9,928 (100.0%) | $42,224 |
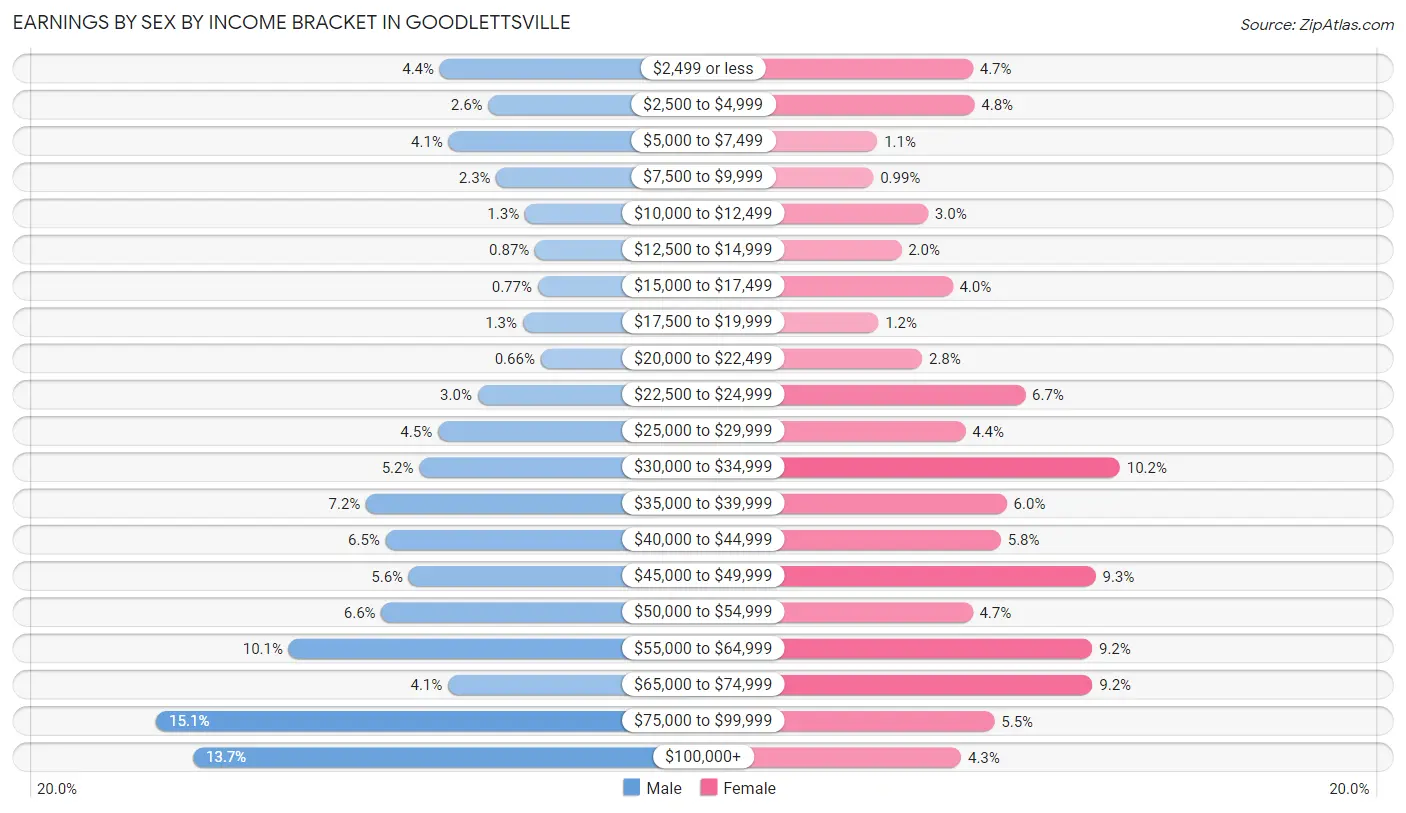
Earnings by Sex by Income Bracket in Goodlettsville
The most common earnings brackets in Goodlettsville are $75,000 to $99,999 for men (689 | 15.1%) and $30,000 to $34,999 for women (548 | 10.2%).
| Income | Male | Female |
| $2,499 or less | 203 (4.4%) | 253 (4.7%) |
| $2,500 to $4,999 | 120 (2.6%) | 256 (4.8%) |
| $5,000 to $7,499 | 188 (4.1%) | 61 (1.1%) |
| $7,500 to $9,999 | 106 (2.3%) | 53 (1.0%) |
| $10,000 to $12,499 | 57 (1.3%) | 163 (3.0%) |
| $12,500 to $14,999 | 40 (0.9%) | 109 (2.0%) |
| $15,000 to $17,499 | 35 (0.8%) | 212 (4.0%) |
| $17,500 to $19,999 | 61 (1.3%) | 63 (1.2%) |
| $20,000 to $22,499 | 30 (0.7%) | 151 (2.8%) |
| $22,500 to $24,999 | 138 (3.0%) | 358 (6.7%) |
| $25,000 to $29,999 | 206 (4.5%) | 238 (4.4%) |
| $30,000 to $34,999 | 238 (5.2%) | 548 (10.2%) |
| $35,000 to $39,999 | 329 (7.2%) | 321 (6.0%) |
| $40,000 to $44,999 | 296 (6.5%) | 309 (5.8%) |
| $45,000 to $49,999 | 256 (5.6%) | 499 (9.3%) |
| $50,000 to $54,999 | 303 (6.6%) | 252 (4.7%) |
| $55,000 to $64,999 | 462 (10.1%) | 492 (9.2%) |
| $65,000 to $74,999 | 189 (4.1%) | 493 (9.2%) |
| $75,000 to $99,999 | 689 (15.1%) | 296 (5.5%) |
| $100,000+ | 626 (13.7%) | 229 (4.3%) |
| Total | 4,572 (100.0%) | 5,356 (100.0%) |
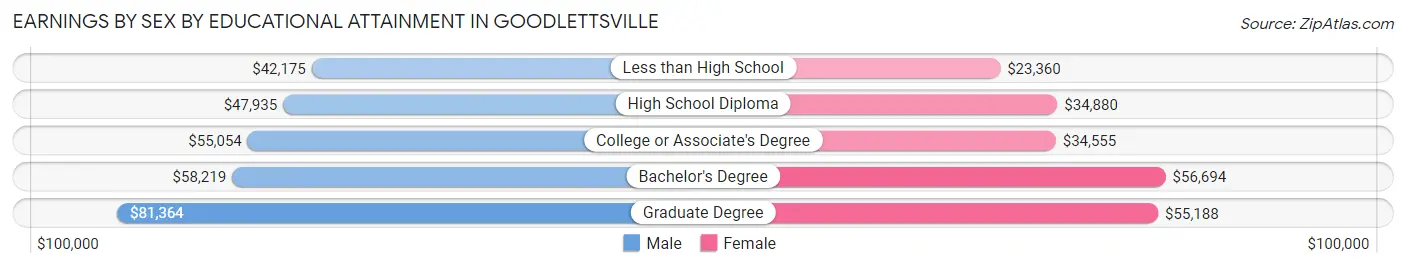
Earnings by Sex by Educational Attainment in Goodlettsville
Average earnings in Goodlettsville are $55,798 for men and $41,921 for women, a difference of 24.9%. Men with an educational attainment of graduate degree enjoy the highest average annual earnings of $81,364, while those with less than high school education earn the least with $42,175. Women with an educational attainment of bachelor's degree earn the most with the average annual earnings of $56,694, while those with less than high school education have the smallest earnings of $23,360.
| Educational Attainment | Male Income | Female Income |
| Less than High School | $42,175 | $23,360 |
| High School Diploma | $47,935 | $34,880 |
| College or Associate's Degree | $55,054 | $34,555 |
| Bachelor's Degree | $58,219 | $56,694 |
| Graduate Degree | $81,364 | $55,188 |
| Total | $55,798 | $41,921 |
Family Income in Goodlettsville
Family Income Brackets in Goodlettsville
According to the Goodlettsville family income data, there are 1,061 families falling into the $100,000 to $149,999 income range, which is the most common income bracket and makes up 24.2% of all families. Conversely, the $10,000 to $14,999 income bracket is the least frequent group with only 22 families (0.5%) belonging to this category.
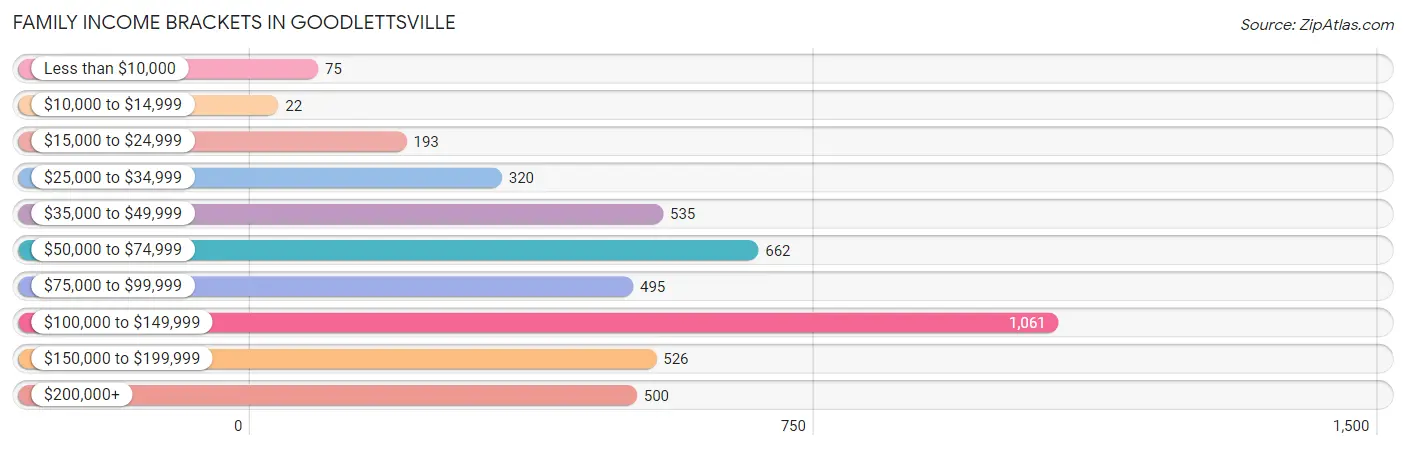
| Income Bracket | # Families | % Families |
| Less than $10,000 | 75 | 1.7% |
| $10,000 to $14,999 | 22 | 0.5% |
| $15,000 to $24,999 | 193 | 4.4% |
| $25,000 to $34,999 | 320 | 7.3% |
| $35,000 to $49,999 | 535 | 12.2% |
| $50,000 to $74,999 | 662 | 15.1% |
| $75,000 to $99,999 | 495 | 11.3% |
| $100,000 to $149,999 | 1,061 | 24.2% |
| $150,000 to $199,999 | 526 | 12.0% |
| $200,000+ | 500 | 11.4% |
Family Income by Famaliy Size in Goodlettsville
7+ person families (102 | 2.3%) account for the highest median family income in Goodlettsville with $250,001 per family, while 2-person families (2,344 | 53.5%) have the highest median income of $41,072 per family member.
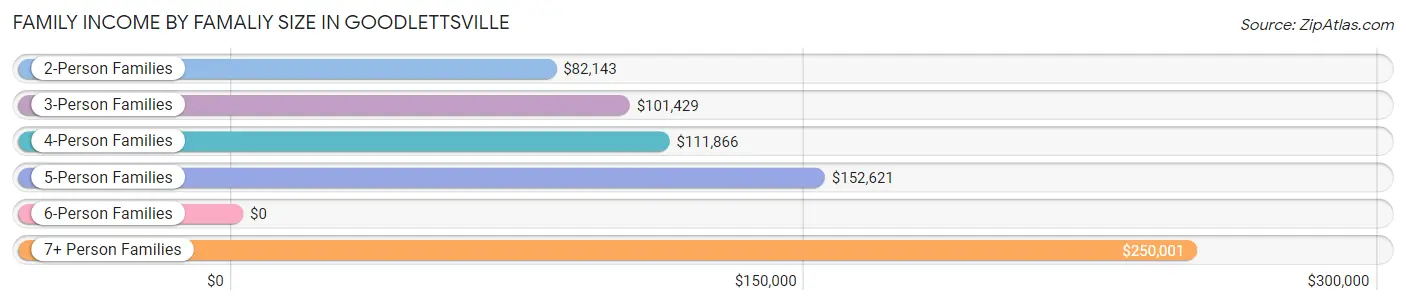
| Income Bracket | # Families | Median Income |
| 2-Person Families | 2,344 (53.5%) | $82,143 |
| 3-Person Families | 698 (15.9%) | $101,429 |
| 4-Person Families | 931 (21.2%) | $111,866 |
| 5-Person Families | 209 (4.8%) | $152,621 |
| 6-Person Families | 100 (2.3%) | $0 |
| 7+ Person Families | 102 (2.3%) | $250,001 |
| Total | 4,384 (100.0%) | $93,595 |
Family Income by Number of Earners in Goodlettsville
The median family income in Goodlettsville is $93,595, with families comprising 3+ earners (393) having the highest median family income of $154,830, while families with 1 earner (1,240) have the lowest median family income of $52,500, accounting for 9.0% and 28.3% of families, respectively.
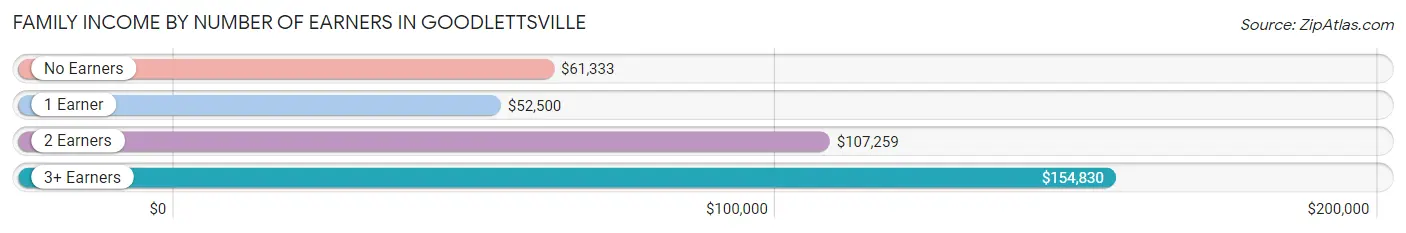
| Number of Earners | # Families | Median Income |
| No Earners | 432 (9.9%) | $61,333 |
| 1 Earner | 1,240 (28.3%) | $52,500 |
| 2 Earners | 2,319 (52.9%) | $107,259 |
| 3+ Earners | 393 (9.0%) | $154,830 |
| Total | 4,384 (100.0%) | $93,595 |
Household Income in Goodlettsville
Household Income Brackets in Goodlettsville
With 1,580 households falling in the category, the $50,000 to $74,999 income range is the most frequent in Goodlettsville, accounting for 21.7% of all households. In contrast, only 182 households (2.5%) fall into the $10,000 to $14,999 income bracket, making it the least populous group.
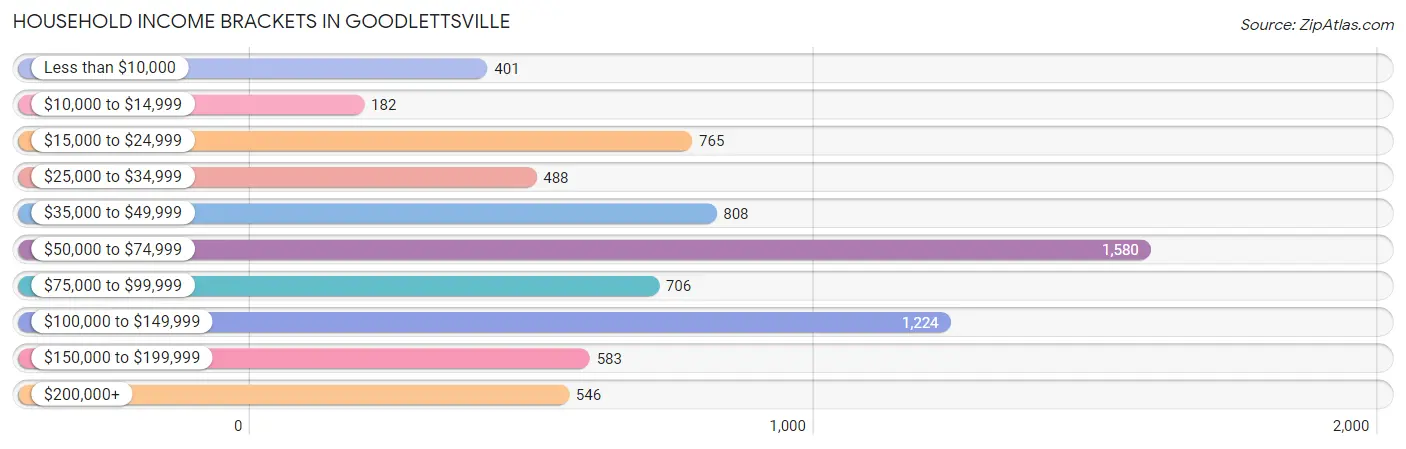
| Income Bracket | # Households | % Households |
| Less than $10,000 | 401 | 5.5% |
| $10,000 to $14,999 | 182 | 2.5% |
| $15,000 to $24,999 | 765 | 10.5% |
| $25,000 to $34,999 | 488 | 6.7% |
| $35,000 to $49,999 | 808 | 11.1% |
| $50,000 to $74,999 | 1,580 | 21.7% |
| $75,000 to $99,999 | 706 | 9.7% |
| $100,000 to $149,999 | 1,224 | 16.8% |
| $150,000 to $199,999 | 583 | 8.0% |
| $200,000+ | 546 | 7.5% |
Household Income by Householder Age in Goodlettsville
The median household income in Goodlettsville is $64,581, with the highest median household income of $74,257 found in the 25 to 44 years age bracket for the primary householder. A total of 2,485 households (34.1%) fall into this category. Meanwhile, the 15 to 24 years age bracket for the primary householder has the lowest median household income of $33,375, with 340 households (4.7%) in this group.
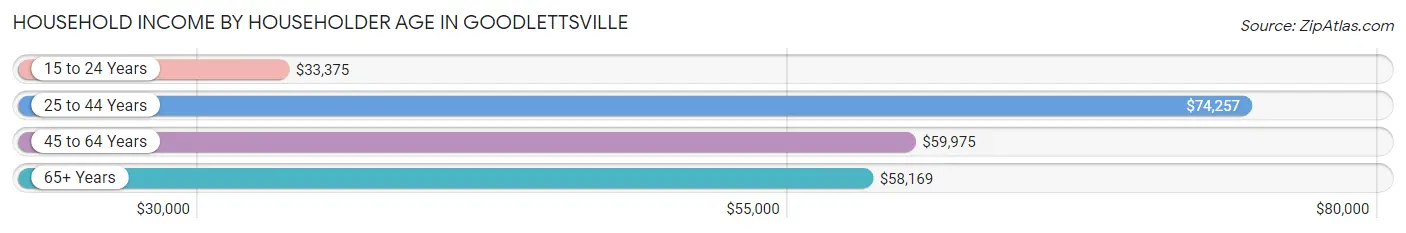
| Income Bracket | # Households | Median Income |
| 15 to 24 Years | 340 (4.7%) | $33,375 |
| 25 to 44 Years | 2,485 (34.1%) | $74,257 |
| 45 to 64 Years | 2,380 (32.7%) | $59,975 |
| 65+ Years | 2,078 (28.5%) | $58,169 |
| Total | 7,283 (100.0%) | $64,581 |
Poverty in Goodlettsville
Income Below Poverty by Sex and Age in Goodlettsville
With 10.7% poverty level for males and 11.3% for females among the residents of Goodlettsville, 15 year old males and 65 to 74 year old females are the most vulnerable to poverty, with 67 males (81.7%) and 290 females (31.7%) in their respective age groups living below the poverty level.
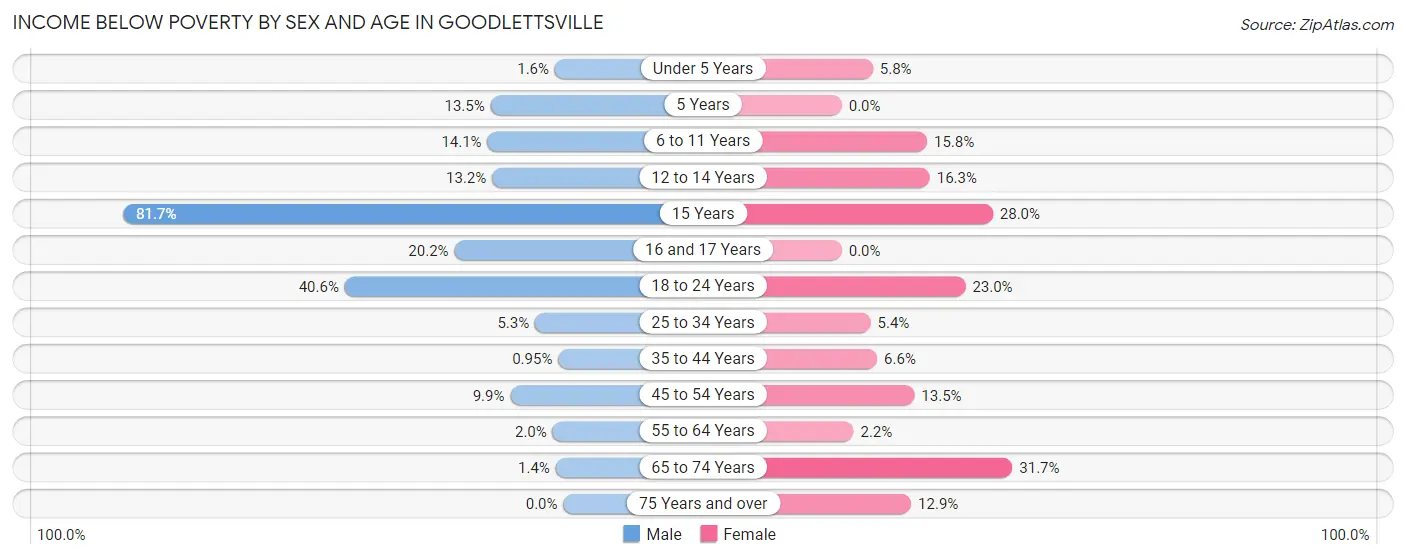
| Age Bracket | Male | Female |
| Under 5 Years | 7 (1.6%) | 34 (5.8%) |
| 5 Years | 30 (13.5%) | 0 (0.0%) |
| 6 to 11 Years | 63 (14.1%) | 57 (15.8%) |
| 12 to 14 Years | 32 (13.2%) | 50 (16.3%) |
| 15 Years | 67 (81.7%) | 30 (28.0%) |
| 16 and 17 Years | 36 (20.2%) | 0 (0.0%) |
| 18 to 24 Years | 403 (40.6%) | 148 (23.0%) |
| 25 to 34 Years | 53 (5.2%) | 84 (5.3%) |
| 35 to 44 Years | 11 (0.9%) | 82 (6.6%) |
| 45 to 54 Years | 84 (9.9%) | 158 (13.5%) |
| 55 to 64 Years | 19 (2.0%) | 28 (2.2%) |
| 65 to 74 Years | 9 (1.4%) | 290 (31.7%) |
| 75 Years and over | 0 (0.0%) | 105 (12.9%) |
| Total | 814 (10.7%) | 1,066 (11.3%) |
Income Above Poverty by Sex and Age in Goodlettsville
According to the poverty statistics in Goodlettsville, males aged 75 years and over and females aged 5 years are the age groups that are most secure financially, with 100.0% of males and 100.0% of females in these age groups living above the poverty line.
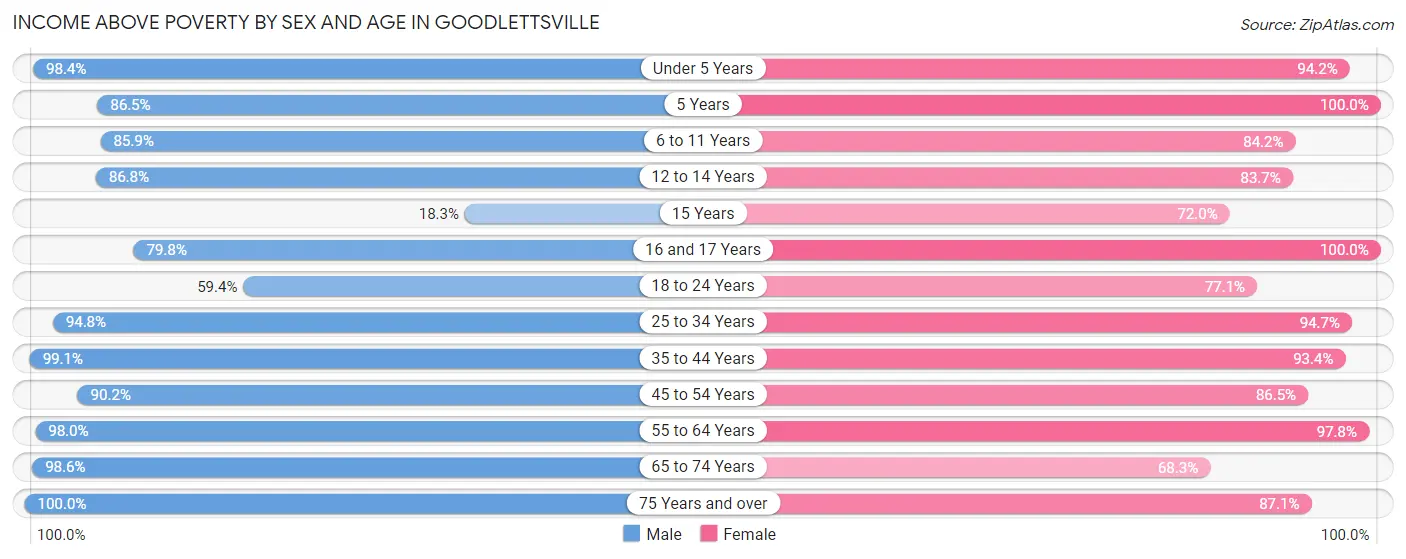
| Age Bracket | Male | Female |
| Under 5 Years | 437 (98.4%) | 556 (94.2%) |
| 5 Years | 192 (86.5%) | 254 (100.0%) |
| 6 to 11 Years | 384 (85.9%) | 303 (84.2%) |
| 12 to 14 Years | 210 (86.8%) | 256 (83.7%) |
| 15 Years | 15 (18.3%) | 77 (72.0%) |
| 16 and 17 Years | 142 (79.8%) | 182 (100.0%) |
| 18 to 24 Years | 590 (59.4%) | 497 (77.0%) |
| 25 to 34 Years | 957 (94.8%) | 1,486 (94.7%) |
| 35 to 44 Years | 1,152 (99.1%) | 1,168 (93.4%) |
| 45 to 54 Years | 769 (90.1%) | 1,014 (86.5%) |
| 55 to 64 Years | 936 (98.0%) | 1,255 (97.8%) |
| 65 to 74 Years | 625 (98.6%) | 626 (68.3%) |
| 75 Years and over | 400 (100.0%) | 711 (87.1%) |
| Total | 6,809 (89.3%) | 8,385 (88.7%) |
Income Below Poverty Among Married-Couple Families in Goodlettsville
The poverty statistics for married-couple families in Goodlettsville show that 2.6% or 75 of the total 2,913 families live below the poverty line. Families with 3 or 4 children have the highest poverty rate of 34.7%, comprising of 66 families. On the other hand, families with 1 or 2 children have the lowest poverty rate of 0.0%, which includes 0 families.
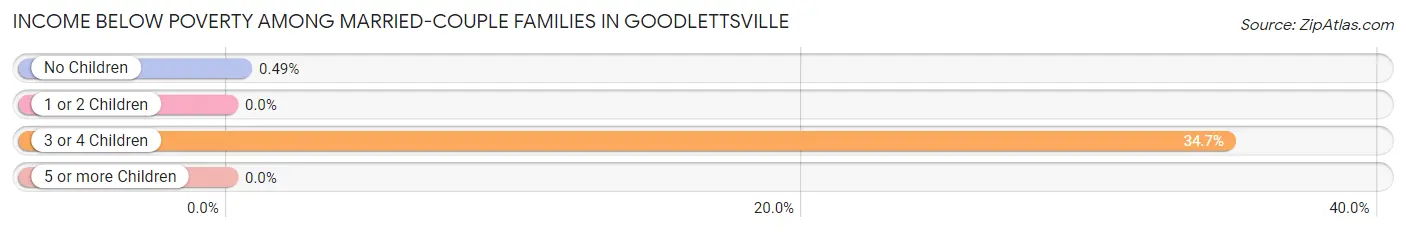
| Children | Above Poverty | Below Poverty |
| No Children | 1,816 (99.5%) | 9 (0.5%) |
| 1 or 2 Children | 898 (100.0%) | 0 (0.0%) |
| 3 or 4 Children | 124 (65.3%) | 66 (34.7%) |
| 5 or more Children | 0 (0.0%) | 0 (0.0%) |
| Total | 2,838 (97.4%) | 75 (2.6%) |
Income Below Poverty Among Single-Parent Households in Goodlettsville
According to the poverty data in Goodlettsville, 2.3% or 6 single-father households and 8.6% or 104 single-mother households are living below the poverty line. Among single-father households, those with 1 or 2 children have the highest poverty rate, with 6 households (3.7%) experiencing poverty. Likewise, among single-mother households, those with 3 or 4 children have the highest poverty rate, with 32 households (24.2%) falling below the poverty line.
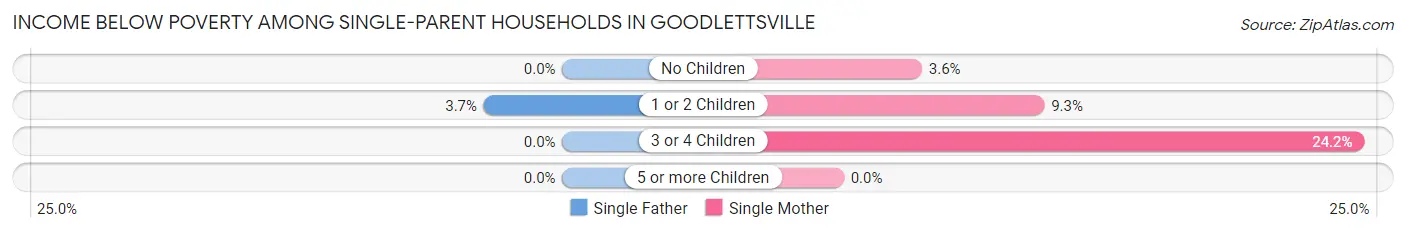
| Children | Single Father | Single Mother |
| No Children | 0 (0.0%) | 18 (3.6%) |
| 1 or 2 Children | 6 (3.7%) | 54 (9.3%) |
| 3 or 4 Children | 0 (0.0%) | 32 (24.2%) |
| 5 or more Children | 0 (0.0%) | 0 (0.0%) |
| Total | 6 (2.3%) | 104 (8.6%) |
Income Below Poverty Among Married-Couple vs Single-Parent Households in Goodlettsville
The poverty data for Goodlettsville shows that 75 of the married-couple family households (2.6%) and 110 of the single-parent households (7.5%) are living below the poverty level. Within the married-couple family households, those with 3 or 4 children have the highest poverty rate, with 66 households (34.7%) falling below the poverty line. Among the single-parent households, those with 3 or 4 children have the highest poverty rate, with 32 household (24.2%) living below poverty.
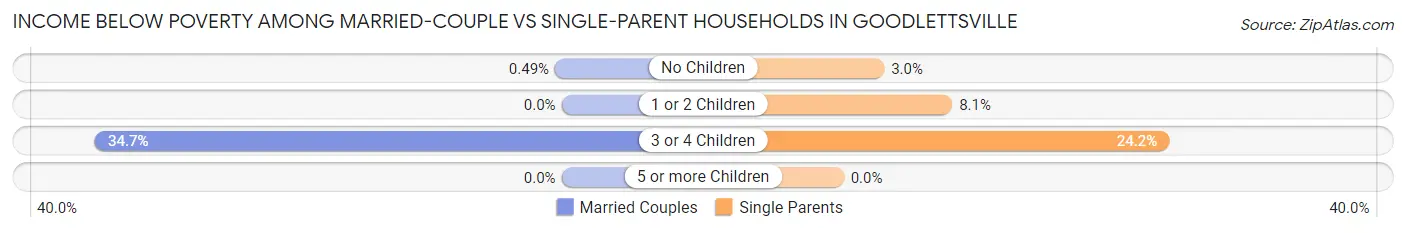
| Children | Married-Couple Families | Single-Parent Households |
| No Children | 9 (0.5%) | 18 (3.0%) |
| 1 or 2 Children | 0 (0.0%) | 60 (8.1%) |
| 3 or 4 Children | 66 (34.7%) | 32 (24.2%) |
| 5 or more Children | 0 (0.0%) | 0 (0.0%) |
| Total | 75 (2.6%) | 110 (7.5%) |
Race in Goodlettsville
The most populous races in Goodlettsville are White / Caucasian (10,717 | 61.2%), Black / African American (3,861 | 22.1%), and Two or more Races (1,547 | 8.8%).
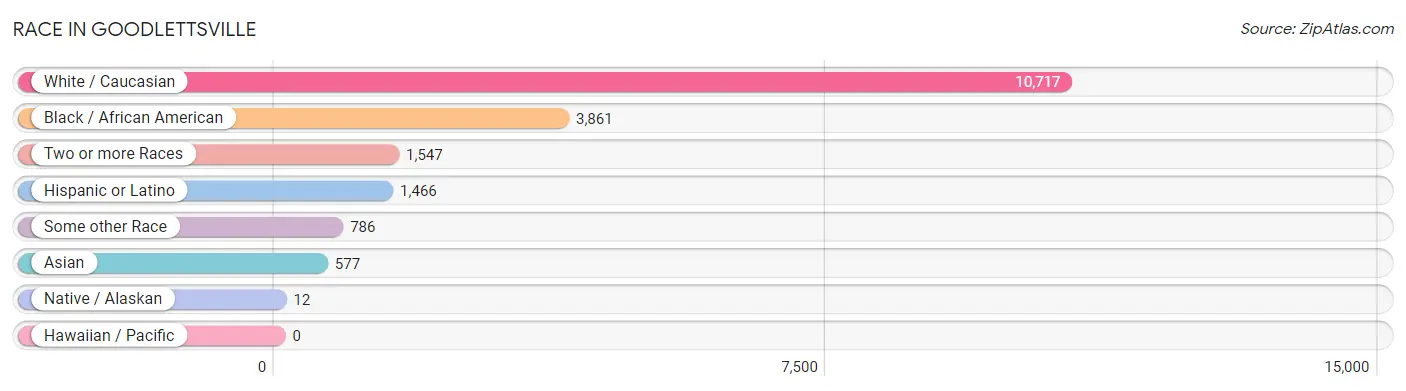
| Race | # Population | % Population |
| Asian | 577 | 3.3% |
| Black / African American | 3,861 | 22.1% |
| Hawaiian / Pacific | 0 | 0.0% |
| Hispanic or Latino | 1,466 | 8.4% |
| Native / Alaskan | 12 | 0.1% |
| White / Caucasian | 10,717 | 61.2% |
| Two or more Races | 1,547 | 8.8% |
| Some other Race | 786 | 4.5% |
| Total | 17,500 | 100.0% |
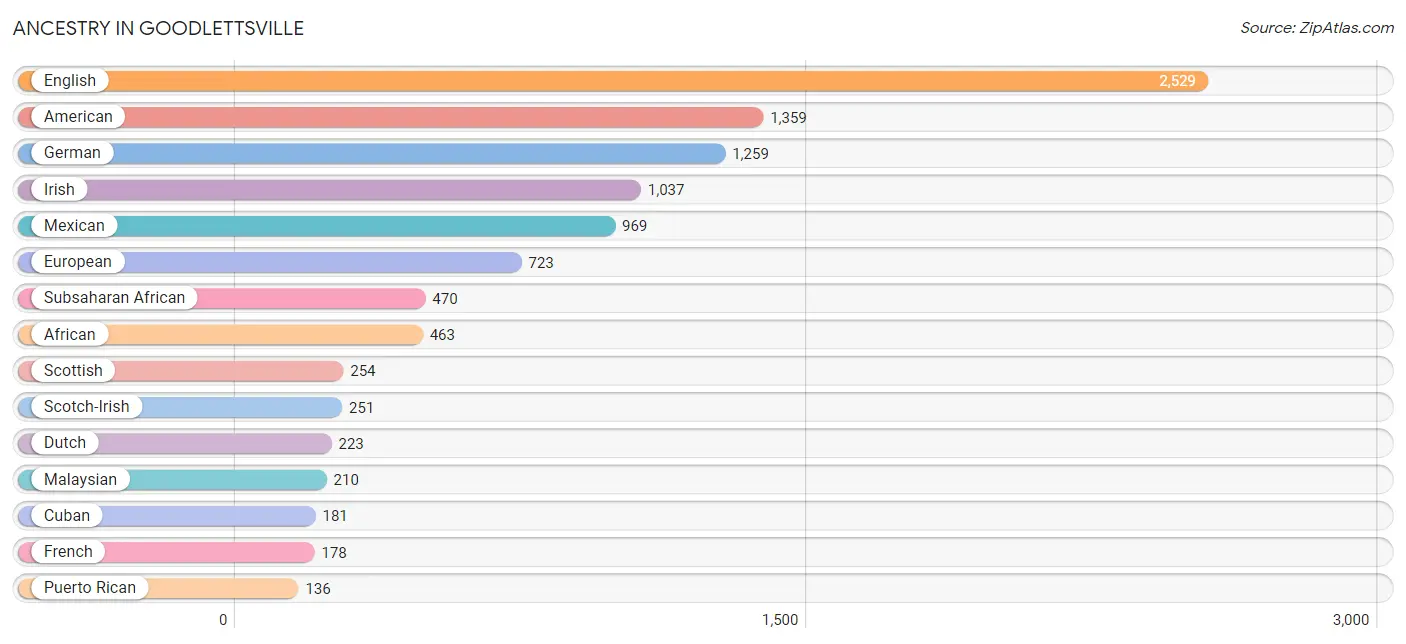
Ancestry in Goodlettsville
The most populous ancestries reported in Goodlettsville are English (2,529 | 14.4%), American (1,359 | 7.8%), German (1,259 | 7.2%), Irish (1,037 | 5.9%), and Mexican (969 | 5.5%), together accounting for 40.9% of all Goodlettsville residents.
| Ancestry | # Population | % Population |
| African | 463 | 2.6% |
| American | 1,359 | 7.8% |
| Arab | 47 | 0.3% |
| Austrian | 6 | 0.0% |
| Bhutanese | 95 | 0.5% |
| Brazilian | 33 | 0.2% |
| British | 111 | 0.6% |
| British West Indian | 11 | 0.1% |
| Canadian | 11 | 0.1% |
| Central American | 71 | 0.4% |
| Cherokee | 13 | 0.1% |
| Chippewa | 1 | 0.0% |
| Colombian | 9 | 0.1% |
| Cuban | 181 | 1.0% |
| Czech | 7 | 0.0% |
| Czechoslovakian | 16 | 0.1% |
| Danish | 52 | 0.3% |
| Dutch | 223 | 1.3% |
| Ecuadorian | 20 | 0.1% |
| Egyptian | 14 | 0.1% |
| English | 2,529 | 14.4% |
| European | 723 | 4.1% |
| French | 178 | 1.0% |
| French Canadian | 42 | 0.2% |
| German | 1,259 | 7.2% |
| Greek | 19 | 0.1% |
| Guatemalan | 23 | 0.1% |
| Honduran | 10 | 0.1% |
| Indian (Asian) | 17 | 0.1% |
| Iranian | 10 | 0.1% |
| Irish | 1,037 | 5.9% |
| Italian | 69 | 0.4% |
| Korean | 93 | 0.5% |
| Lebanese | 17 | 0.1% |
| Lithuanian | 8 | 0.1% |
| Malaysian | 210 | 1.2% |
| Mexican | 969 | 5.5% |
| Native Hawaiian | 56 | 0.3% |
| Nigerian | 7 | 0.0% |
| Northern European | 23 | 0.1% |
| Norwegian | 73 | 0.4% |
| Palestinian | 16 | 0.1% |
| Peruvian | 28 | 0.2% |
| Polish | 71 | 0.4% |
| Puerto Rican | 136 | 0.8% |
| Russian | 26 | 0.2% |
| Salvadoran | 38 | 0.2% |
| Scandinavian | 18 | 0.1% |
| Scotch-Irish | 251 | 1.4% |
| Scottish | 254 | 1.5% |
| South American | 57 | 0.3% |
| Spanish | 23 | 0.1% |
| Sri Lankan | 46 | 0.3% |
| Subsaharan African | 470 | 2.7% |
| Swedish | 79 | 0.4% |
| Swiss | 25 | 0.1% |
| Thai | 132 | 0.7% |
| Welsh | 47 | 0.3% | View All 58 Rows |
Immigrants in Goodlettsville
The most numerous immigrant groups reported in Goodlettsville came from Latin America (535 | 3.1%), Central America (488 | 2.8%), Mexico (438 | 2.5%), Asia (372 | 2.1%), and South Central Asia (153 | 0.9%), together accounting for 11.3% of all Goodlettsville residents.
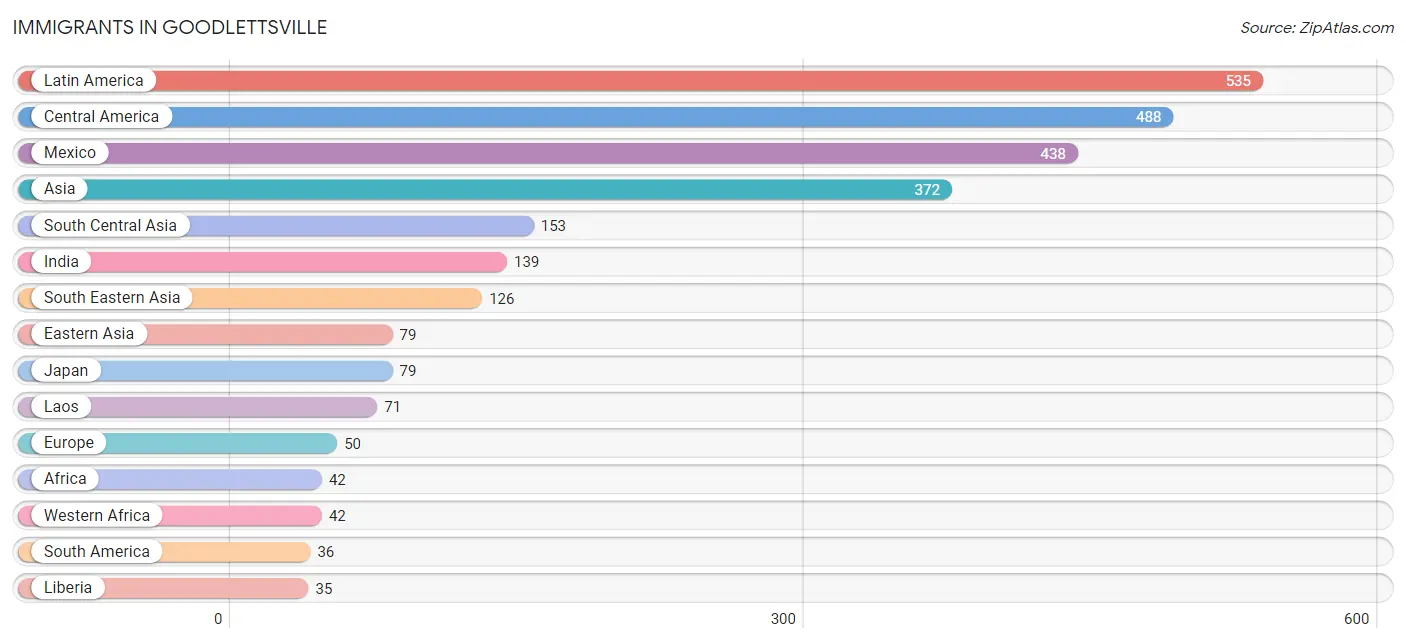
| Immigration Origin | # Population | % Population |
| Africa | 42 | 0.2% |
| Asia | 372 | 2.1% |
| Canada | 32 | 0.2% |
| Caribbean | 11 | 0.1% |
| Central America | 488 | 2.8% |
| Colombia | 8 | 0.1% |
| Eastern Asia | 79 | 0.4% |
| Eastern Europe | 17 | 0.1% |
| El Salvador | 27 | 0.2% |
| Europe | 50 | 0.3% |
| Guatemala | 13 | 0.1% |
| Honduras | 10 | 0.1% |
| India | 139 | 0.8% |
| Iran | 10 | 0.1% |
| Japan | 79 | 0.4% |
| Kazakhstan | 4 | 0.0% |
| Laos | 71 | 0.4% |
| Latin America | 535 | 3.1% |
| Liberia | 35 | 0.2% |
| Mexico | 438 | 2.5% |
| Nigeria | 7 | 0.0% |
| Northern Europe | 33 | 0.2% |
| Peru | 28 | 0.2% |
| Philippines | 24 | 0.1% |
| Poland | 17 | 0.1% |
| Saudi Arabia | 14 | 0.1% |
| South America | 36 | 0.2% |
| South Central Asia | 153 | 0.9% |
| South Eastern Asia | 126 | 0.7% |
| Vietnam | 31 | 0.2% |
| Western Africa | 42 | 0.2% |
| Western Asia | 14 | 0.1% | View All 32 Rows |
Sex and Age in Goodlettsville
Sex and Age in Goodlettsville
The most populous age groups in Goodlettsville are 15 to 19 Years (791 | 10.2%) for men and 25 to 29 Years (831 | 8.5%) for women.
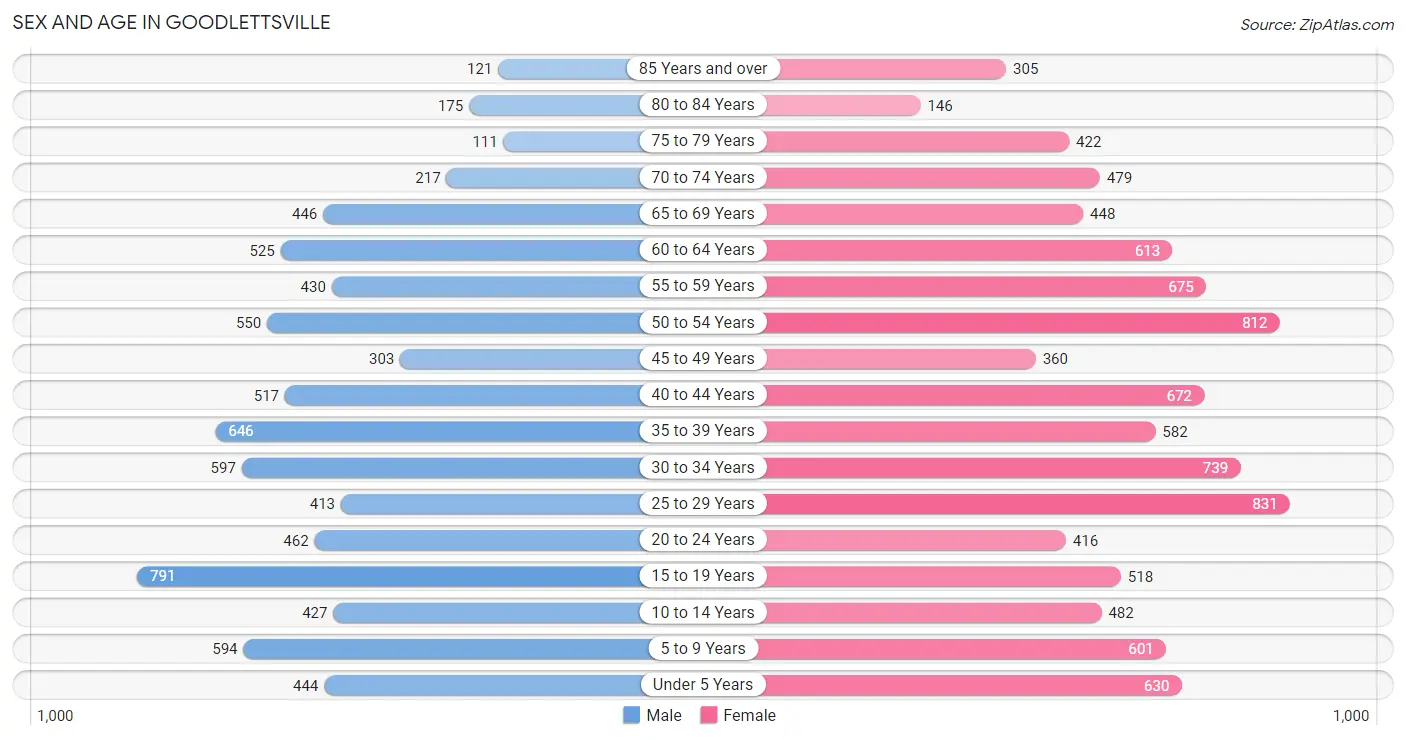
| Age Bracket | Male | Female |
| Under 5 Years | 444 (5.7%) | 630 (6.5%) |
| 5 to 9 Years | 594 (7.6%) | 601 (6.2%) |
| 10 to 14 Years | 427 (5.5%) | 482 (5.0%) |
| 15 to 19 Years | 791 (10.2%) | 518 (5.3%) |
| 20 to 24 Years | 462 (5.9%) | 416 (4.3%) |
| 25 to 29 Years | 413 (5.3%) | 831 (8.5%) |
| 30 to 34 Years | 597 (7.7%) | 739 (7.6%) |
| 35 to 39 Years | 646 (8.3%) | 582 (6.0%) |
| 40 to 44 Years | 517 (6.7%) | 672 (6.9%) |
| 45 to 49 Years | 303 (3.9%) | 360 (3.7%) |
| 50 to 54 Years | 550 (7.1%) | 812 (8.3%) |
| 55 to 59 Years | 430 (5.5%) | 675 (6.9%) |
| 60 to 64 Years | 525 (6.8%) | 613 (6.3%) |
| 65 to 69 Years | 446 (5.7%) | 448 (4.6%) |
| 70 to 74 Years | 217 (2.8%) | 479 (4.9%) |
| 75 to 79 Years | 111 (1.4%) | 422 (4.3%) |
| 80 to 84 Years | 175 (2.2%) | 146 (1.5%) |
| 85 Years and over | 121 (1.6%) | 305 (3.1%) |
| Total | 7,769 (100.0%) | 9,731 (100.0%) |
Families and Households in Goodlettsville
Median Family Size in Goodlettsville
The median family size in Goodlettsville is 2.98 persons per family, with married-couple families (2,913 | 66.4%) accounting for the largest median family size of 3.05 persons per family. On the other hand, single male/father families (266 | 6.1%) represent the smallest median family size with 2.06 persons per family.
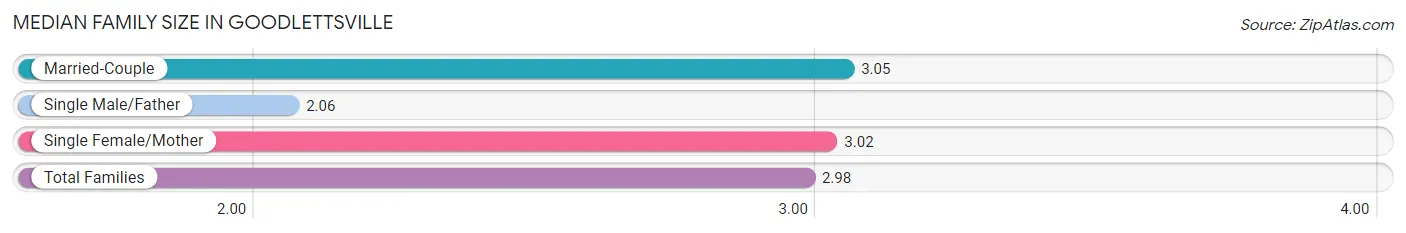
| Family Type | # Families | Family Size |
| Married-Couple | 2,913 (66.4%) | 3.05 |
| Single Male/Father | 266 (6.1%) | 2.06 |
| Single Female/Mother | 1,205 (27.5%) | 3.02 |
| Total Families | 4,384 (100.0%) | 2.98 |
Median Household Size in Goodlettsville
The median household size in Goodlettsville is 2.39 persons per household, with single male/father households (266 | 3.6%) accounting for the largest median household size of 3.48 persons per household. non-family households (2,899 | 39.8%) represent the smallest median household size with 1.24 persons per household.
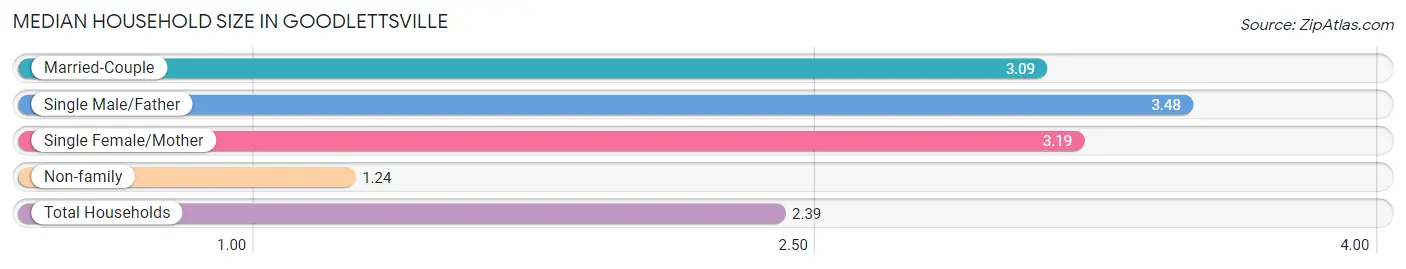
| Household Type | # Households | Household Size |
| Married-Couple | 2,913 (40.0%) | 3.09 |
| Single Male/Father | 266 (3.6%) | 3.48 |
| Single Female/Mother | 1,205 (16.6%) | 3.19 |
| Non-family | 2,899 (39.8%) | 1.24 |
| Total Households | 7,283 (100.0%) | 2.39 |
Household Size by Marriage Status in Goodlettsville
Out of a total of 7,283 households in Goodlettsville, 4,384 (60.2%) are family households, while 2,899 (39.8%) are nonfamily households. The most numerous type of family households are 2-person households, comprising 2,089, and the most common type of nonfamily households are 1-person households, comprising 2,527.
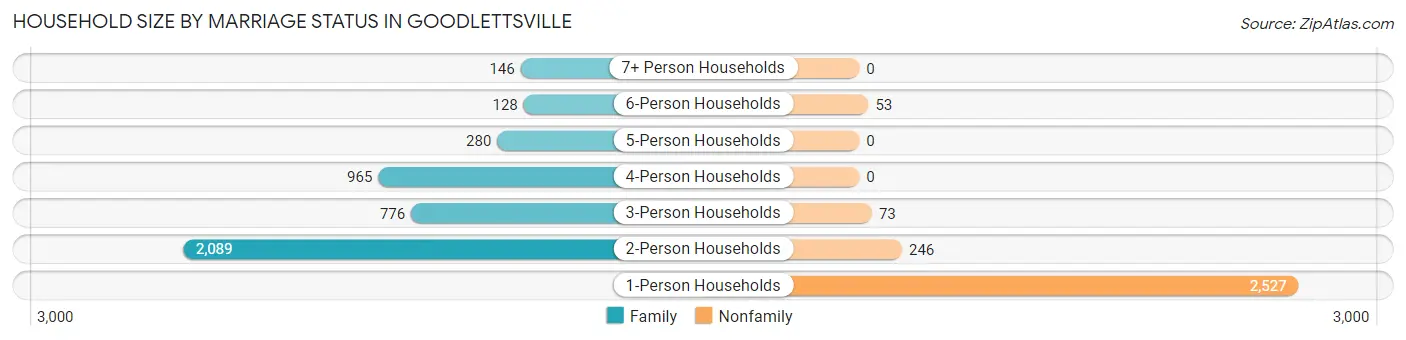
| Household Size | Family Households | Nonfamily Households |
| 1-Person Households | - | 2,527 (34.7%) |
| 2-Person Households | 2,089 (28.7%) | 246 (3.4%) |
| 3-Person Households | 776 (10.6%) | 73 (1.0%) |
| 4-Person Households | 965 (13.3%) | 0 (0.0%) |
| 5-Person Households | 280 (3.8%) | 0 (0.0%) |
| 6-Person Households | 128 (1.8%) | 53 (0.7%) |
| 7+ Person Households | 146 (2.0%) | 0 (0.0%) |
| Total | 4,384 (60.2%) | 2,899 (39.8%) |
Female Fertility in Goodlettsville
Fertility by Age in Goodlettsville
Average fertility rate in Goodlettsville is 67.0 births per 1,000 women. Women in the age bracket of 20 to 34 years have the highest fertility rate with 81.0 births per 1,000 women. Women in the age bracket of 20 to 34 years acount for 55.2% of all women with births.
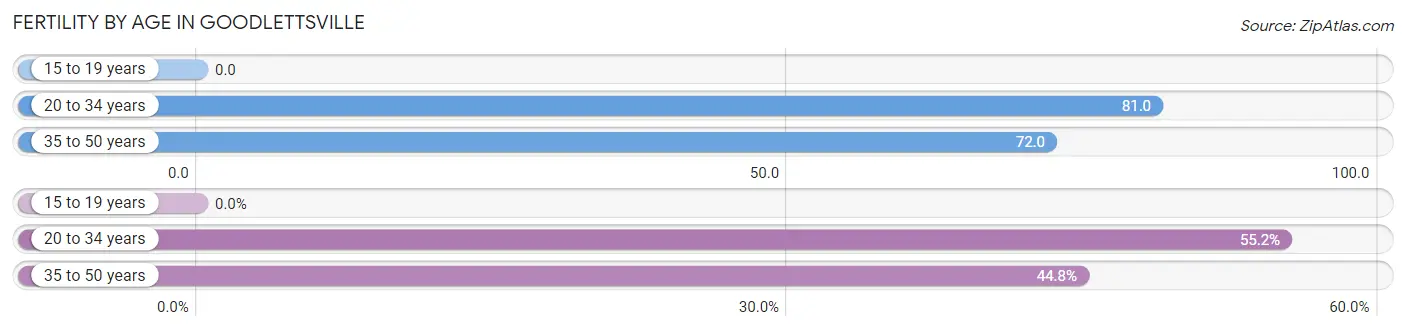
| Age Bracket | Women with Births | Births / 1,000 Women |
| 15 to 19 years | 0 (0.0%) | 0.0 |
| 20 to 34 years | 160 (55.2%) | 81.0 |
| 35 to 50 years | 130 (44.8%) | 72.0 |
| Total | 290 (100.0%) | 67.0 |
Fertility by Age by Marriage Status in Goodlettsville
52.8% of women with births (290) in Goodlettsville are married. The highest percentage of unmarried women with births falls into 35 to 50 years age bracket with 93.9% of them unmarried at the time of birth, while the lowest percentage of unmarried women with births belong to 20 to 34 years age bracket with 9.4% of them unmarried.
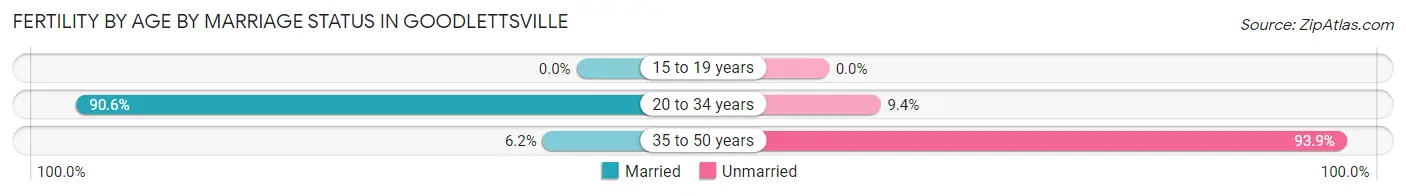
| Age Bracket | Married | Unmarried |
| 15 to 19 years | 0 (0.0%) | 0 (0.0%) |
| 20 to 34 years | 145 (90.6%) | 15 (9.4%) |
| 35 to 50 years | 8 (6.1%) | 122 (93.9%) |
| Total | 153 (52.8%) | 137 (47.2%) |
Fertility by Education in Goodlettsville
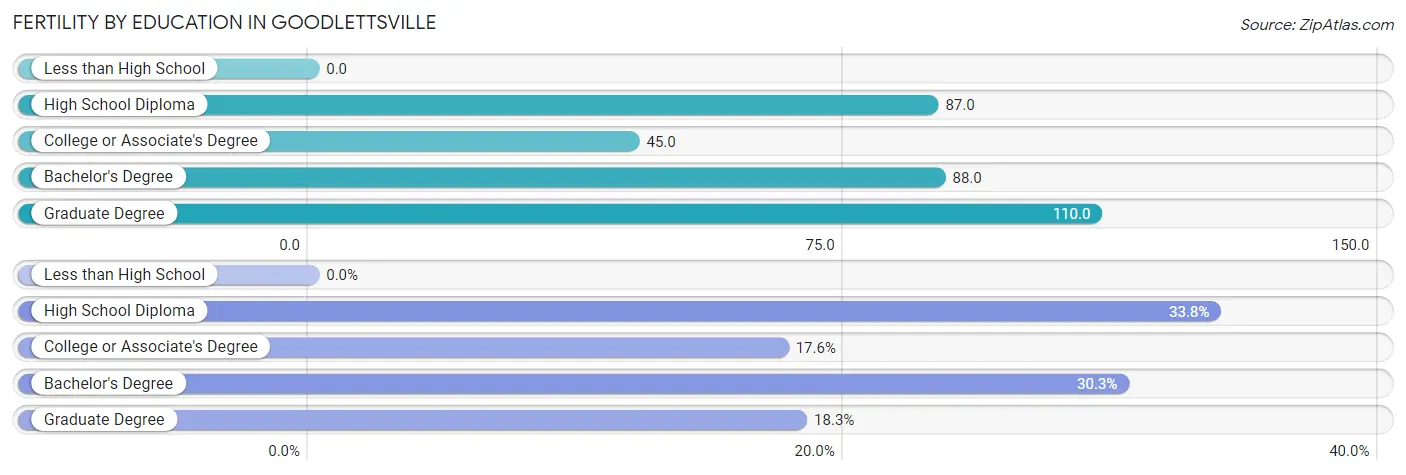
| Educational Attainment | Women with Births | Births / 1,000 Women |
| Less than High School | 0 (0.0%) | 0.0 |
| High School Diploma | 98 (33.8%) | 87.0 |
| College or Associate's Degree | 51 (17.6%) | 45.0 |
| Bachelor's Degree | 88 (30.3%) | 88.0 |
| Graduate Degree | 53 (18.3%) | 110.0 |
| Total | 290 (100.0%) | 67.0 |
Fertility by Education by Marriage Status in Goodlettsville
47.2% of women with births in Goodlettsville are unmarried. Women with the educational attainment of high school diploma are most likely to be married with 84.7% of them married at childbirth, while women with the educational attainment of bachelor's degree are least likely to be married with 90.9% of them unmarried at childbirth.
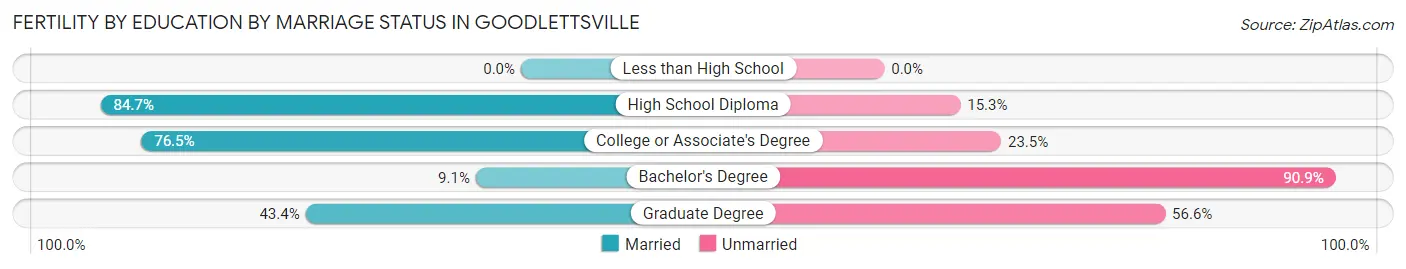
| Educational Attainment | Married | Unmarried |
| Less than High School | 0 (0.0%) | 0 (0.0%) |
| High School Diploma | 83 (84.7%) | 15 (15.3%) |
| College or Associate's Degree | 39 (76.5%) | 12 (23.5%) |
| Bachelor's Degree | 8 (9.1%) | 80 (90.9%) |
| Graduate Degree | 23 (43.4%) | 30 (56.6%) |
| Total | 153 (52.8%) | 137 (47.2%) |
Employment Characteristics in Goodlettsville
Employment by Class of Employer in Goodlettsville
Among the 8,771 employed individuals in Goodlettsville, private company employees (5,744 | 65.5%), local government employees (944 | 10.8%), and not-for-profit organizations (733 | 8.4%) make up the most common classes of employment.
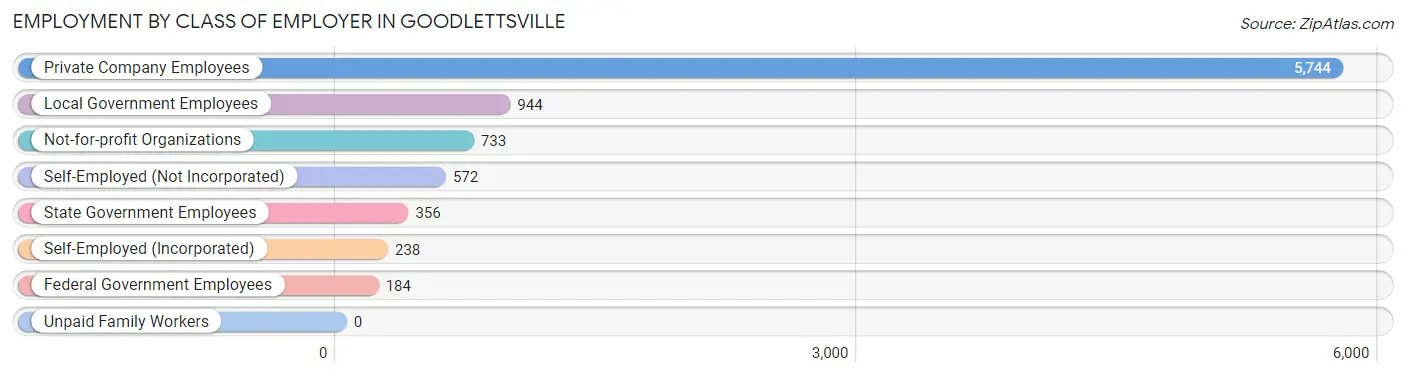
| Employer Class | # Employees | % Employees |
| Private Company Employees | 5,744 | 65.5% |
| Self-Employed (Incorporated) | 238 | 2.7% |
| Self-Employed (Not Incorporated) | 572 | 6.5% |
| Not-for-profit Organizations | 733 | 8.4% |
| Local Government Employees | 944 | 10.8% |
| State Government Employees | 356 | 4.1% |
| Federal Government Employees | 184 | 2.1% |
| Unpaid Family Workers | 0 | 0.0% |
| Total | 8,771 | 100.0% |
Employment Status by Age in Goodlettsville
According to the labor force statistics for Goodlettsville, out of the total population over 16 years of age (14,133), 66.4% or 9,384 individuals are in the labor force, with 5.8% or 544 of them unemployed. The age group with the highest labor force participation rate is 35 to 44 years, with 88.5% or 2,139 individuals in the labor force. Within the labor force, the 16 to 19 years age range has the highest percentage of unemployed individuals, with 24.0% or 128 of them being unemployed.
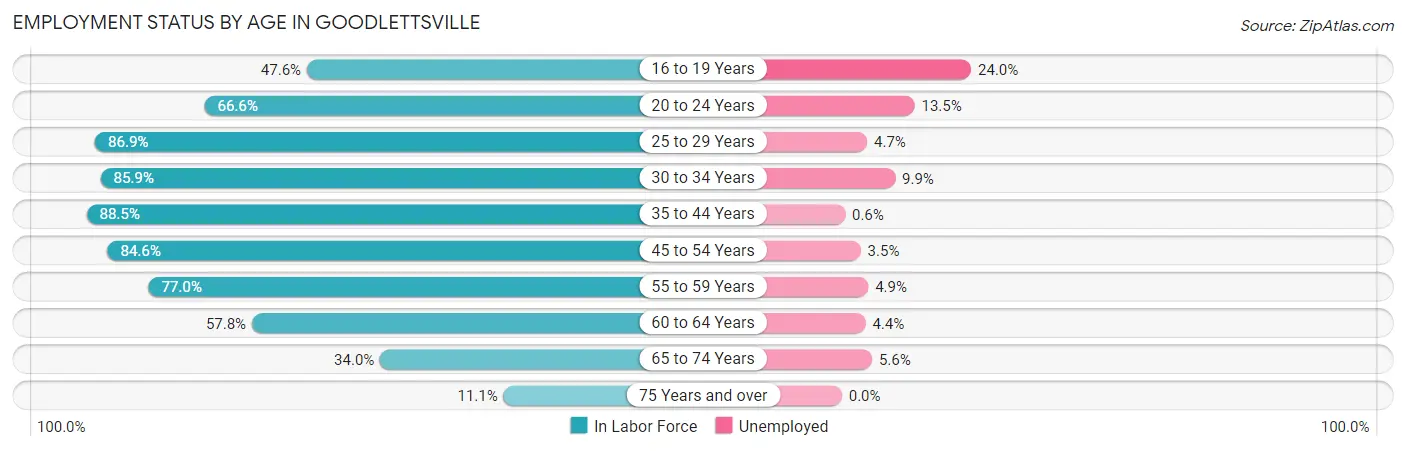
| Age Bracket | In Labor Force | Unemployed |
| 16 to 19 Years | 533 (47.6%) | 128 (24.0%) |
| 20 to 24 Years | 585 (66.6%) | 79 (13.5%) |
| 25 to 29 Years | 1,081 (86.9%) | 51 (4.7%) |
| 30 to 34 Years | 1,148 (85.9%) | 114 (9.9%) |
| 35 to 44 Years | 2,139 (88.5%) | 13 (0.6%) |
| 45 to 54 Years | 1,713 (84.6%) | 60 (3.5%) |
| 55 to 59 Years | 851 (77.0%) | 42 (4.9%) |
| 60 to 64 Years | 658 (57.8%) | 29 (4.4%) |
| 65 to 74 Years | 541 (34.0%) | 30 (5.6%) |
| 75 Years and over | 142 (11.1%) | 0 (0.0%) |
| Total | 9,384 (66.4%) | 544 (5.8%) |
Employment Status by Educational Attainment in Goodlettsville
According to labor force statistics for Goodlettsville, 81.9% of individuals (7,588) out of the total population between 25 and 64 years of age (9,265) are in the labor force, with 4.1% or 311 of them being unemployed. The group with the highest labor force participation rate are those with the educational attainment of bachelor's degree or higher, with 90.3% or 2,984 individuals in the labor force. Within the labor force, individuals with high school diploma education have the highest percentage of unemployment, with 10.5% or 175 of them being unemployed.
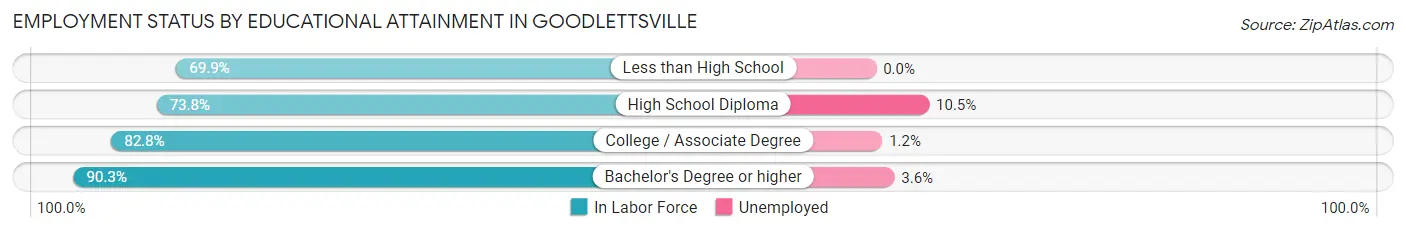
| Educational Attainment | In Labor Force | Unemployed |
| Less than High School | 680 (69.9%) | 0 (0.0%) |
| High School Diploma | 1,670 (73.8%) | 238 (10.5%) |
| College / Associate Degree | 2,255 (82.8%) | 33 (1.2%) |
| Bachelor's Degree or higher | 2,984 (90.3%) | 119 (3.6%) |
| Total | 7,588 (81.9%) | 380 (4.1%) |
Employment Occupations by Sex in Goodlettsville
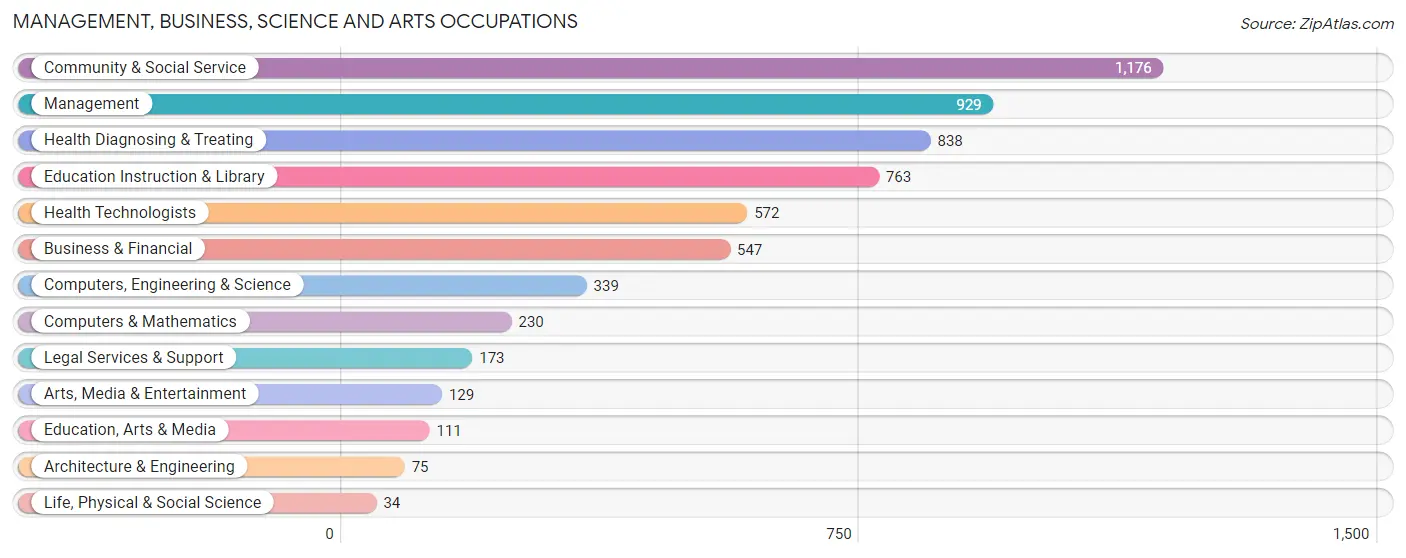
Management, Business, Science and Arts Occupations
The most common Management, Business, Science and Arts occupations in Goodlettsville are Community & Social Service (1,176 | 13.3%), Management (929 | 10.5%), Health Diagnosing & Treating (838 | 9.5%), Education Instruction & Library (763 | 8.6%), and Health Technologists (572 | 6.5%).
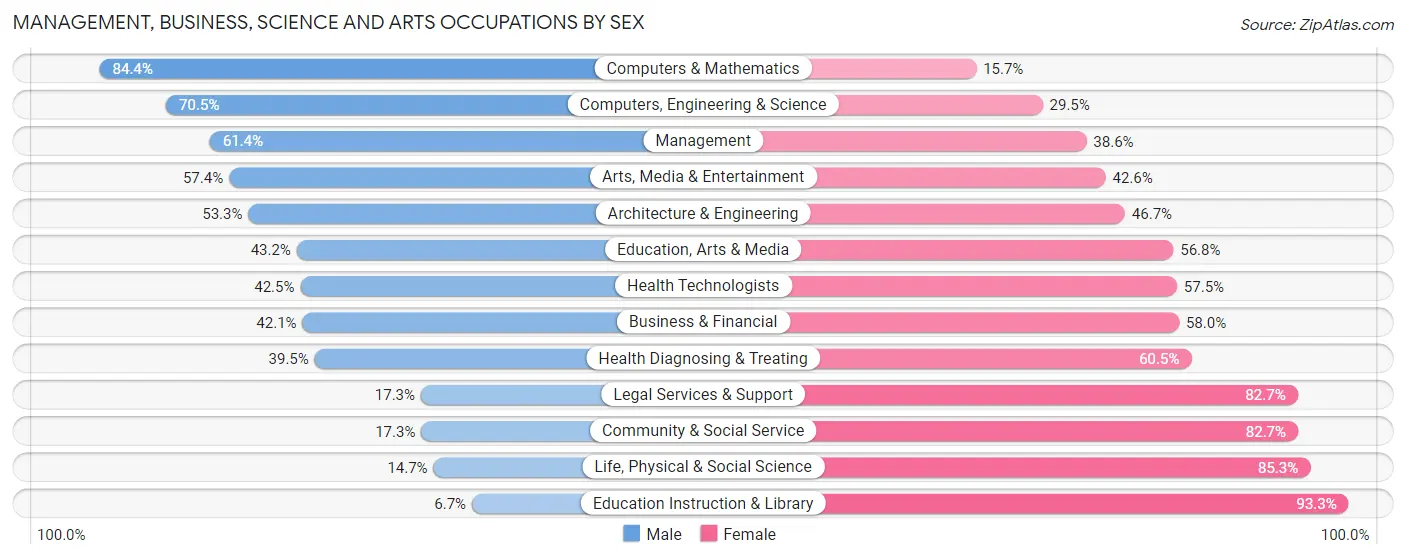
Management, Business, Science and Arts Occupations by Sex
Within the Management, Business, Science and Arts occupations in Goodlettsville, the most male-oriented occupations are Computers & Mathematics (84.4%), Computers, Engineering & Science (70.5%), and Management (61.4%), while the most female-oriented occupations are Education Instruction & Library (93.3%), Life, Physical & Social Science (85.3%), and Community & Social Service (82.7%).
| Occupation | Male | Female |
| Management | 570 (61.4%) | 359 (38.6%) |
| Business & Financial | 230 (42.0%) | 317 (58.0%) |
| Computers, Engineering & Science | 239 (70.5%) | 100 (29.5%) |
| Computers & Mathematics | 194 (84.4%) | 36 (15.7%) |
| Architecture & Engineering | 40 (53.3%) | 35 (46.7%) |
| Life, Physical & Social Science | 5 (14.7%) | 29 (85.3%) |
| Community & Social Service | 203 (17.3%) | 973 (82.7%) |
| Education, Arts & Media | 48 (43.2%) | 63 (56.8%) |
| Legal Services & Support | 30 (17.3%) | 143 (82.7%) |
| Education Instruction & Library | 51 (6.7%) | 712 (93.3%) |
| Arts, Media & Entertainment | 74 (57.4%) | 55 (42.6%) |
| Health Diagnosing & Treating | 331 (39.5%) | 507 (60.5%) |
| Health Technologists | 243 (42.5%) | 329 (57.5%) |
| Total (Category) | 1,573 (41.1%) | 2,256 (58.9%) |
| Total (Overall) | 4,023 (45.5%) | 4,822 (54.5%) |
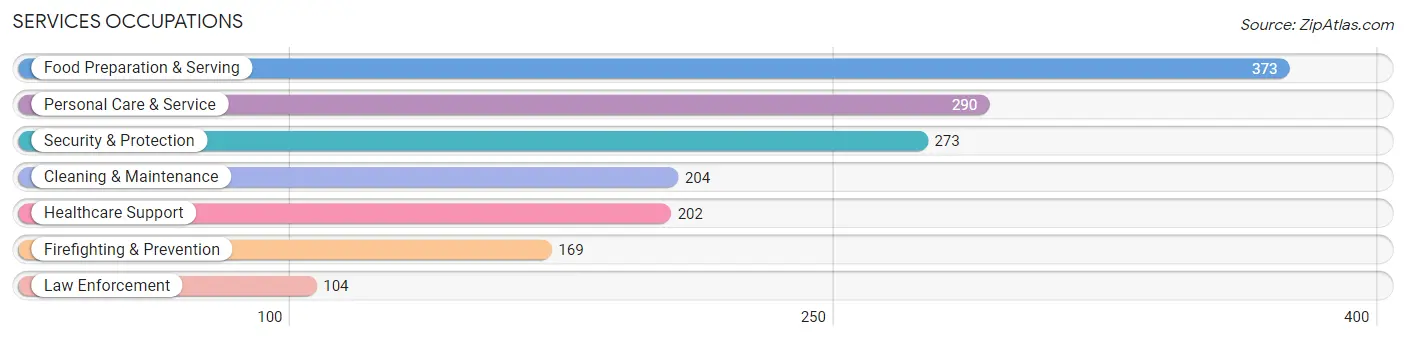
Services Occupations
The most common Services occupations in Goodlettsville are Food Preparation & Serving (373 | 4.2%), Personal Care & Service (290 | 3.3%), Security & Protection (273 | 3.1%), Cleaning & Maintenance (204 | 2.3%), and Healthcare Support (202 | 2.3%).
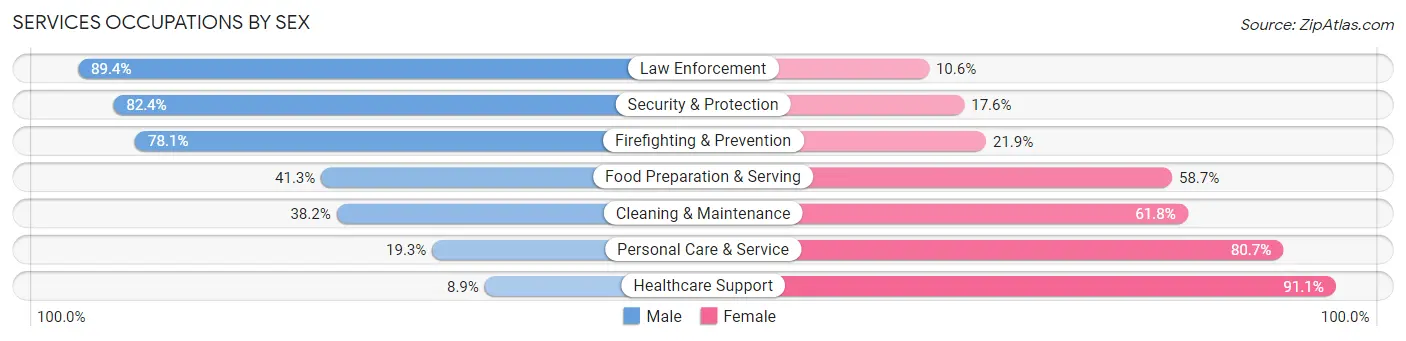
Services Occupations by Sex
Within the Services occupations in Goodlettsville, the most male-oriented occupations are Law Enforcement (89.4%), Security & Protection (82.4%), and Firefighting & Prevention (78.1%), while the most female-oriented occupations are Healthcare Support (91.1%), Personal Care & Service (80.7%), and Cleaning & Maintenance (61.8%).
| Occupation | Male | Female |
| Healthcare Support | 18 (8.9%) | 184 (91.1%) |
| Security & Protection | 225 (82.4%) | 48 (17.6%) |
| Firefighting & Prevention | 132 (78.1%) | 37 (21.9%) |
| Law Enforcement | 93 (89.4%) | 11 (10.6%) |
| Food Preparation & Serving | 154 (41.3%) | 219 (58.7%) |
| Cleaning & Maintenance | 78 (38.2%) | 126 (61.8%) |
| Personal Care & Service | 56 (19.3%) | 234 (80.7%) |
| Total (Category) | 531 (39.6%) | 811 (60.4%) |
| Total (Overall) | 4,023 (45.5%) | 4,822 (54.5%) |
Sales and Office Occupations
The most common Sales and Office occupations in Goodlettsville are Office & Administration (1,241 | 14.0%), and Sales & Related (680 | 7.7%).
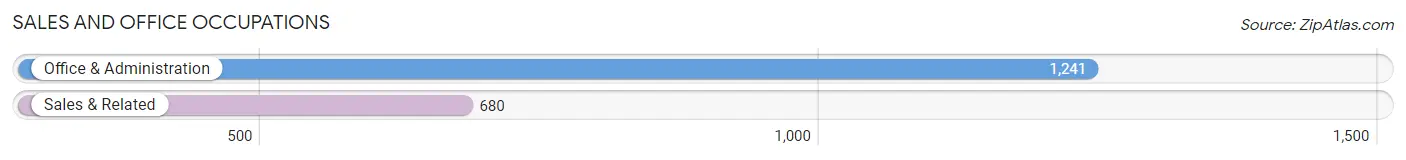
Sales and Office Occupations by Sex
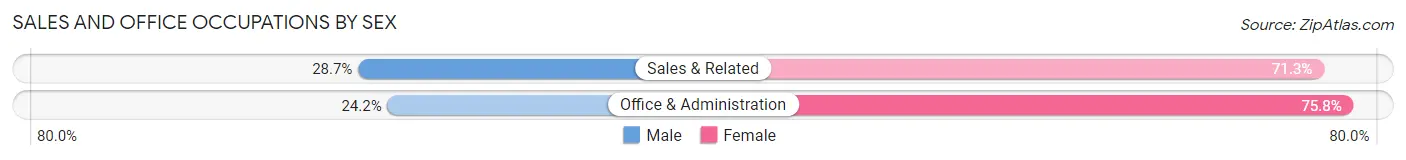
| Occupation | Male | Female |
| Sales & Related | 195 (28.7%) | 485 (71.3%) |
| Office & Administration | 300 (24.2%) | 941 (75.8%) |
| Total (Category) | 495 (25.8%) | 1,426 (74.2%) |
| Total (Overall) | 4,023 (45.5%) | 4,822 (54.5%) |
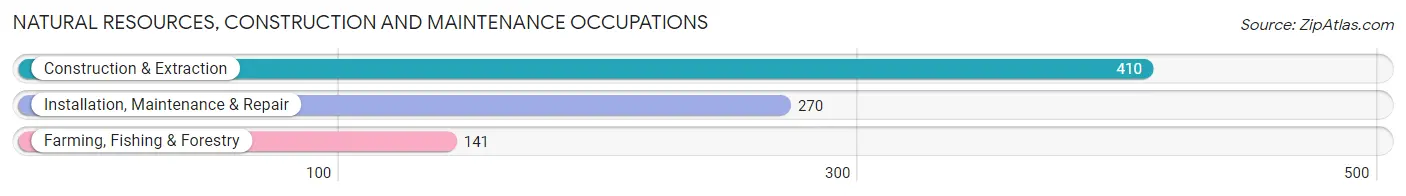
Natural Resources, Construction and Maintenance Occupations
The most common Natural Resources, Construction and Maintenance occupations in Goodlettsville are Construction & Extraction (410 | 4.6%), Installation, Maintenance & Repair (270 | 3.0%), and Farming, Fishing & Forestry (141 | 1.6%).
Natural Resources, Construction and Maintenance Occupations by Sex
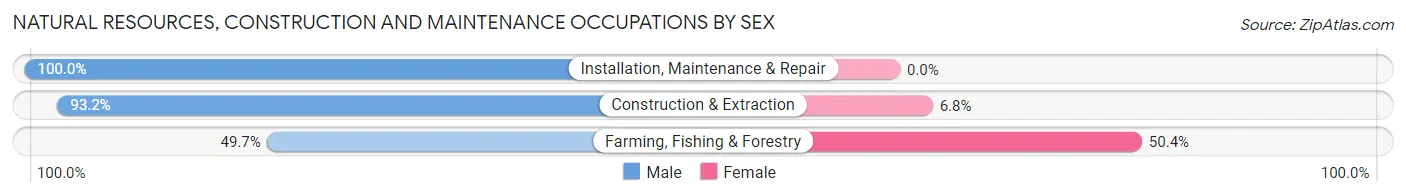
| Occupation | Male | Female |
| Farming, Fishing & Forestry | 70 (49.6%) | 71 (50.3%) |
| Construction & Extraction | 382 (93.2%) | 28 (6.8%) |
| Installation, Maintenance & Repair | 270 (100.0%) | 0 (0.0%) |
| Total (Category) | 722 (87.9%) | 99 (12.1%) |
| Total (Overall) | 4,023 (45.5%) | 4,822 (54.5%) |
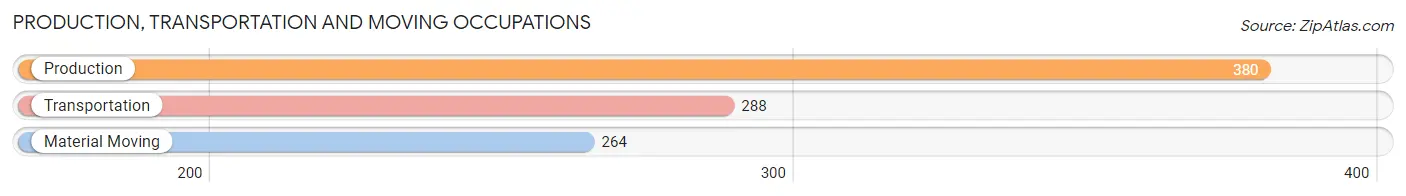
Production, Transportation and Moving Occupations
The most common Production, Transportation and Moving occupations in Goodlettsville are Production (380 | 4.3%), Transportation (288 | 3.3%), and Material Moving (264 | 3.0%).
Production, Transportation and Moving Occupations by Sex
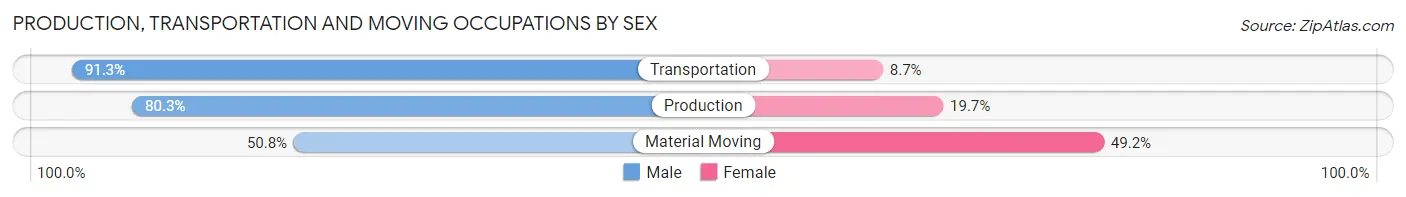
| Occupation | Male | Female |
| Production | 305 (80.3%) | 75 (19.7%) |
| Transportation | 263 (91.3%) | 25 (8.7%) |
| Material Moving | 134 (50.8%) | 130 (49.2%) |
| Total (Category) | 702 (75.3%) | 230 (24.7%) |
| Total (Overall) | 4,023 (45.5%) | 4,822 (54.5%) |
Employment Industries by Sex in Goodlettsville
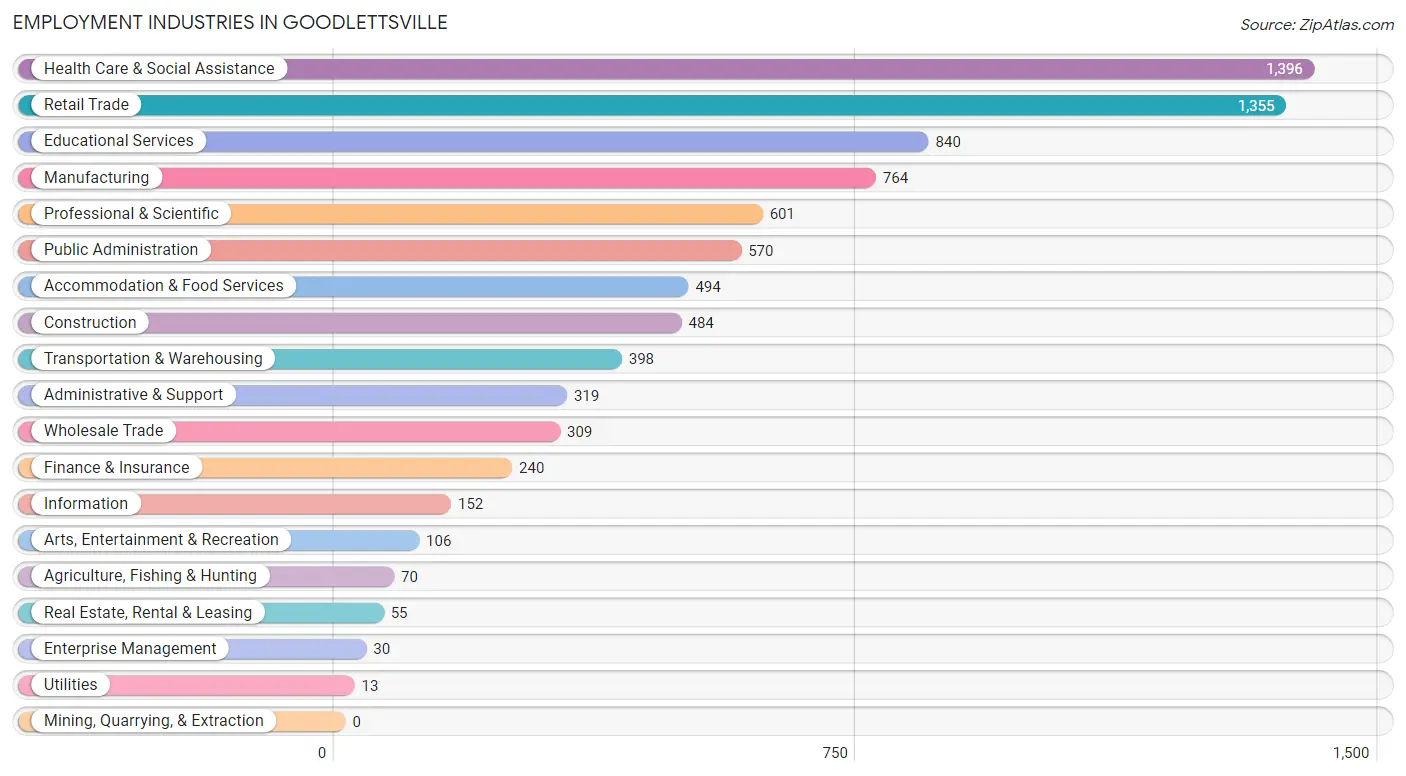
Employment Industries in Goodlettsville
The major employment industries in Goodlettsville include Health Care & Social Assistance (1,396 | 15.8%), Retail Trade (1,355 | 15.3%), Educational Services (840 | 9.5%), Manufacturing (764 | 8.6%), and Professional & Scientific (601 | 6.8%).
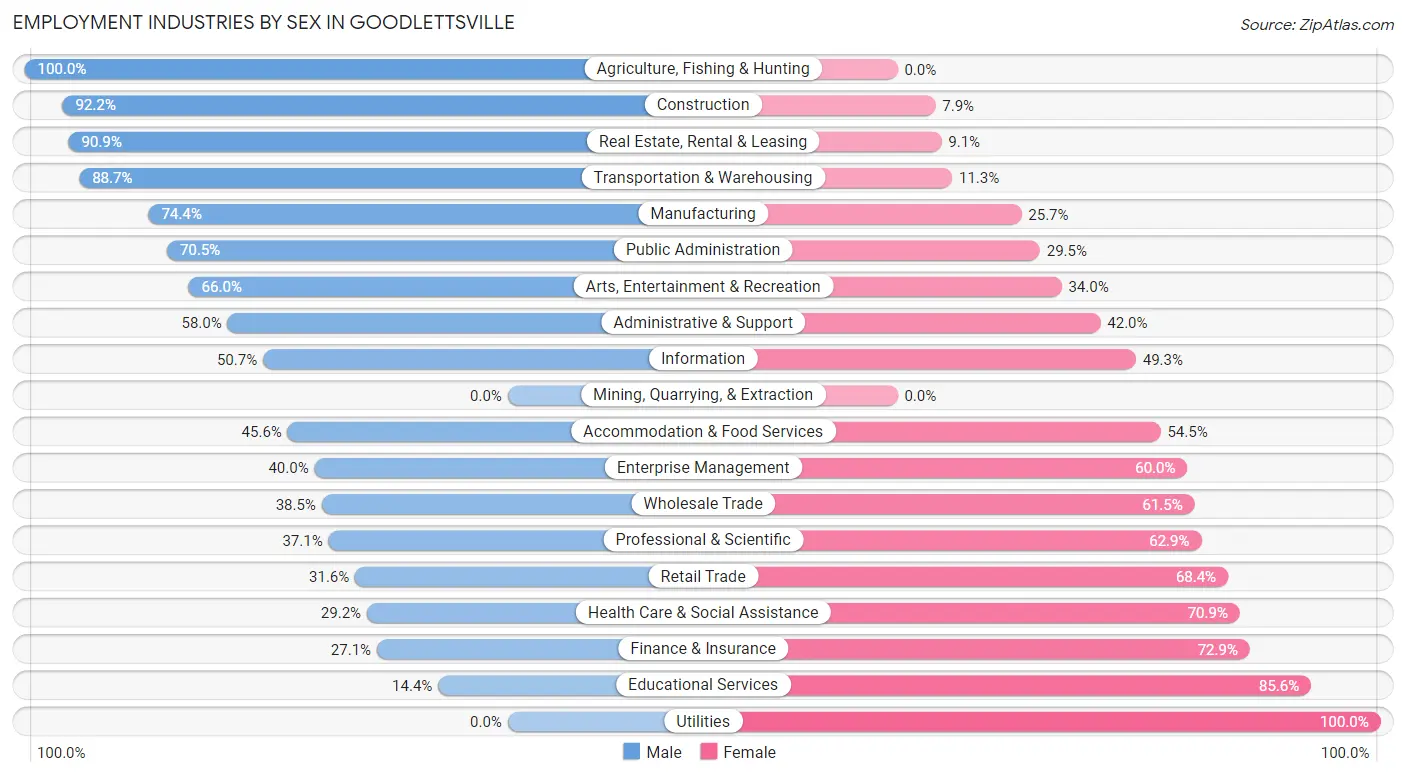
Employment Industries by Sex in Goodlettsville
The Goodlettsville industries that see more men than women are Agriculture, Fishing & Hunting (100.0%), Construction (92.1%), and Real Estate, Rental & Leasing (90.9%), whereas the industries that tend to have a higher number of women are Utilities (100.0%), Educational Services (85.6%), and Finance & Insurance (72.9%).
| Industry | Male | Female |
| Agriculture, Fishing & Hunting | 70 (100.0%) | 0 (0.0%) |
| Mining, Quarrying, & Extraction | 0 (0.0%) | 0 (0.0%) |
| Construction | 446 (92.1%) | 38 (7.9%) |
| Manufacturing | 568 (74.4%) | 196 (25.7%) |
| Wholesale Trade | 119 (38.5%) | 190 (61.5%) |
| Retail Trade | 428 (31.6%) | 927 (68.4%) |
| Transportation & Warehousing | 353 (88.7%) | 45 (11.3%) |
| Utilities | 0 (0.0%) | 13 (100.0%) |
| Information | 77 (50.7%) | 75 (49.3%) |
| Finance & Insurance | 65 (27.1%) | 175 (72.9%) |
| Real Estate, Rental & Leasing | 50 (90.9%) | 5 (9.1%) |
| Professional & Scientific | 223 (37.1%) | 378 (62.9%) |
| Enterprise Management | 12 (40.0%) | 18 (60.0%) |
| Administrative & Support | 185 (58.0%) | 134 (42.0%) |
| Educational Services | 121 (14.4%) | 719 (85.6%) |
| Health Care & Social Assistance | 407 (29.1%) | 989 (70.9%) |
| Arts, Entertainment & Recreation | 70 (66.0%) | 36 (34.0%) |
| Accommodation & Food Services | 225 (45.6%) | 269 (54.4%) |
| Public Administration | 402 (70.5%) | 168 (29.5%) |
| Total | 4,023 (45.5%) | 4,822 (54.5%) |
Education in Goodlettsville
School Enrollment in Goodlettsville
The most common levels of schooling among the 4,356 students in Goodlettsville are college / undergraduate (1,218 | 28.0%), middle school (806 | 18.5%), and high school (699 | 16.1%).
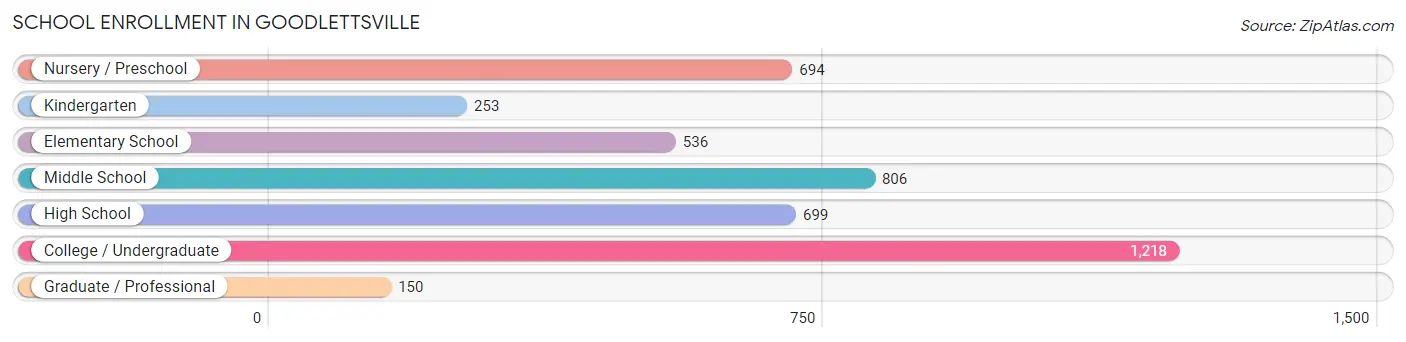
| School Level | # Students | % Students |
| Nursery / Preschool | 694 | 15.9% |
| Kindergarten | 253 | 5.8% |
| Elementary School | 536 | 12.3% |
| Middle School | 806 | 18.5% |
| High School | 699 | 16.1% |
| College / Undergraduate | 1,218 | 28.0% |
| Graduate / Professional | 150 | 3.4% |
| Total | 4,356 | 100.0% |
School Enrollment by Age by Funding Source in Goodlettsville
Out of a total of 4,356 students who are enrolled in schools in Goodlettsville, 588 (13.5%) attend a private institution, while the remaining 3,768 (86.5%) are enrolled in public schools. The age group of 3 to 4 year olds has the highest likelihood of being enrolled in private schools, with 229 (50.9% in the age bracket) enrolled. Conversely, the age group of 10 to 14 year olds has the lowest likelihood of being enrolled in a private school, with 789 (95.5% in the age bracket) attending a public institution.
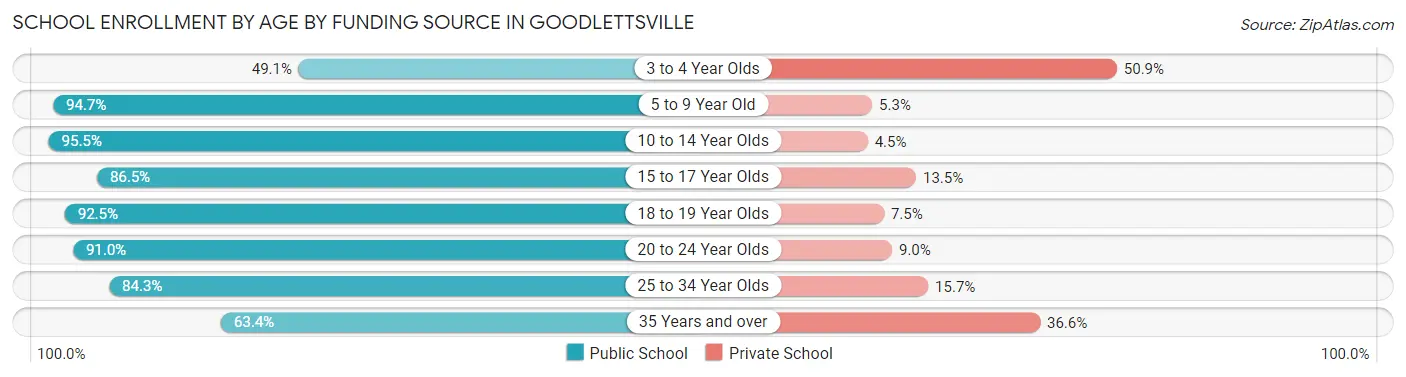
| Age Bracket | Public School | Private School |
| 3 to 4 Year Olds | 221 (49.1%) | 229 (50.9%) |
| 5 to 9 Year Old | 962 (94.7%) | 54 (5.3%) |
| 10 to 14 Year Olds | 789 (95.5%) | 37 (4.5%) |
| 15 to 17 Year Olds | 475 (86.5%) | 74 (13.5%) |
| 18 to 19 Year Olds | 580 (92.5%) | 47 (7.5%) |
| 20 to 24 Year Olds | 293 (91.0%) | 29 (9.0%) |
| 25 to 34 Year Olds | 364 (84.3%) | 68 (15.7%) |
| 35 Years and over | 85 (63.4%) | 49 (36.6%) |
| Total | 3,768 (86.5%) | 588 (13.5%) |
Educational Attainment by Field of Study in Goodlettsville
Business (924 | 20.4%), education (723 | 15.9%), arts & humanities (486 | 10.7%), science & technology (467 | 10.3%), and social sciences (260 | 5.7%) are the most common fields of study among 4,537 individuals in Goodlettsville who have obtained a bachelor's degree or higher.
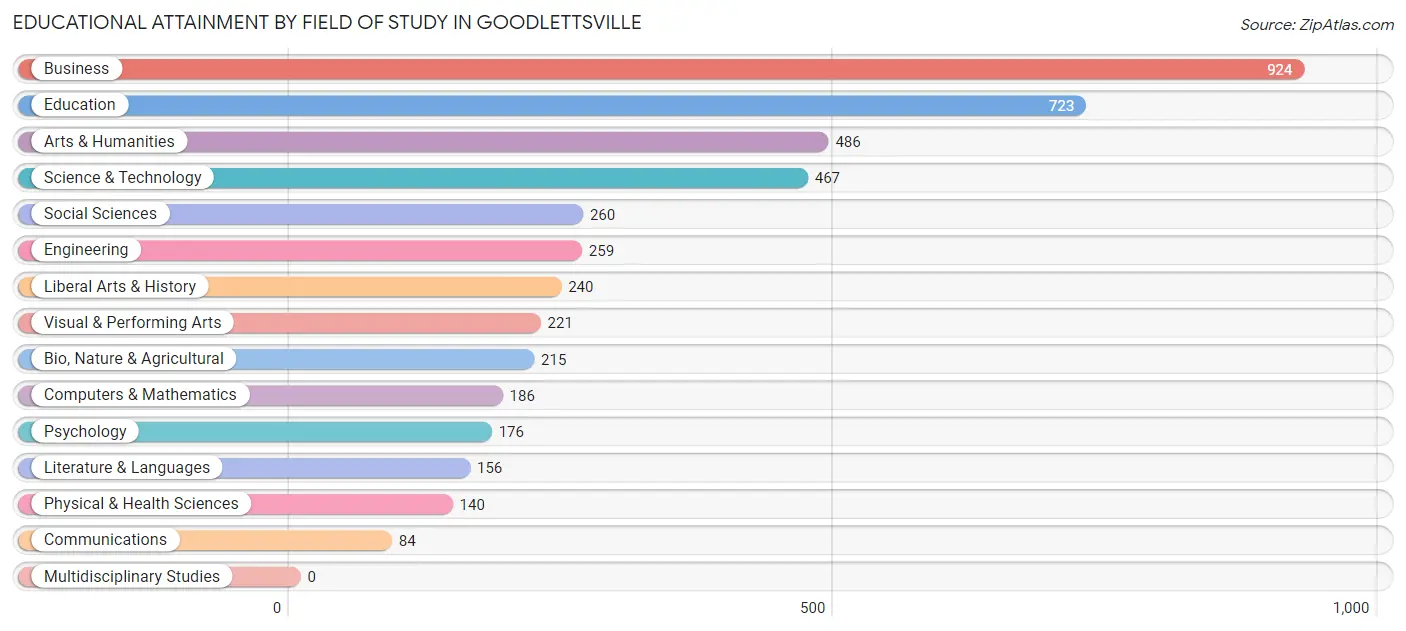
| Field of Study | # Graduates | % Graduates |
| Computers & Mathematics | 186 | 4.1% |
| Bio, Nature & Agricultural | 215 | 4.7% |
| Physical & Health Sciences | 140 | 3.1% |
| Psychology | 176 | 3.9% |
| Social Sciences | 260 | 5.7% |
| Engineering | 259 | 5.7% |
| Multidisciplinary Studies | 0 | 0.0% |
| Science & Technology | 467 | 10.3% |
| Business | 924 | 20.4% |
| Education | 723 | 15.9% |
| Literature & Languages | 156 | 3.4% |
| Liberal Arts & History | 240 | 5.3% |
| Visual & Performing Arts | 221 | 4.9% |
| Communications | 84 | 1.8% |
| Arts & Humanities | 486 | 10.7% |
| Total | 4,537 | 100.0% |
Transportation & Commute in Goodlettsville
Vehicle Availability by Sex in Goodlettsville
The most prevalent vehicle ownership categories in Goodlettsville are males with 2 vehicles (1,684, accounting for 42.1%) and females with 2 vehicles (2,005, making up 35.3%).
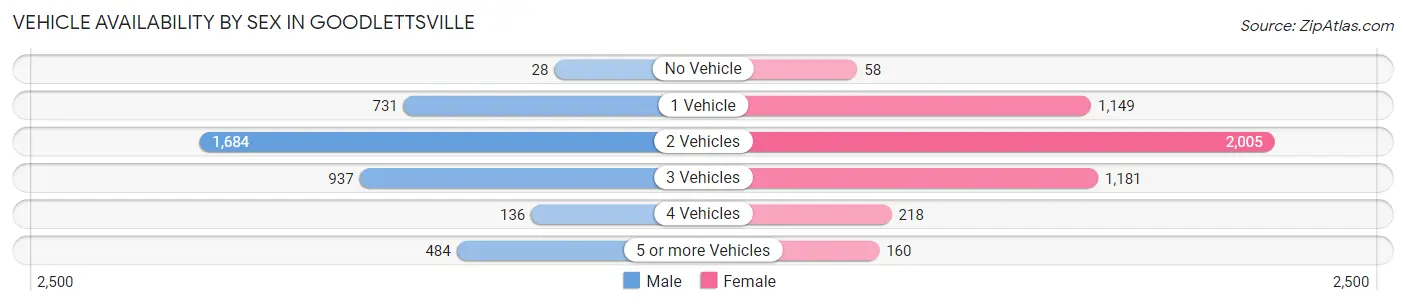
| Vehicles Available | Male | Female |
| No Vehicle | 28 (0.7%) | 58 (1.2%) |
| 1 Vehicle | 731 (18.3%) | 1,149 (24.1%) |
| 2 Vehicles | 1,684 (42.1%) | 2,005 (42.0%) |
| 3 Vehicles | 937 (23.4%) | 1,181 (24.7%) |
| 4 Vehicles | 136 (3.4%) | 218 (4.6%) |
| 5 or more Vehicles | 484 (12.1%) | 160 (3.4%) |
| Total | 4,000 (100.0%) | 4,771 (100.0%) |
Commute Time in Goodlettsville
The most frequently occuring commute durations in Goodlettsville are 30 to 34 minutes (1,159 commuters, 15.0%), 15 to 19 minutes (1,115 commuters, 14.4%), and 20 to 24 minutes (840 commuters, 10.8%).
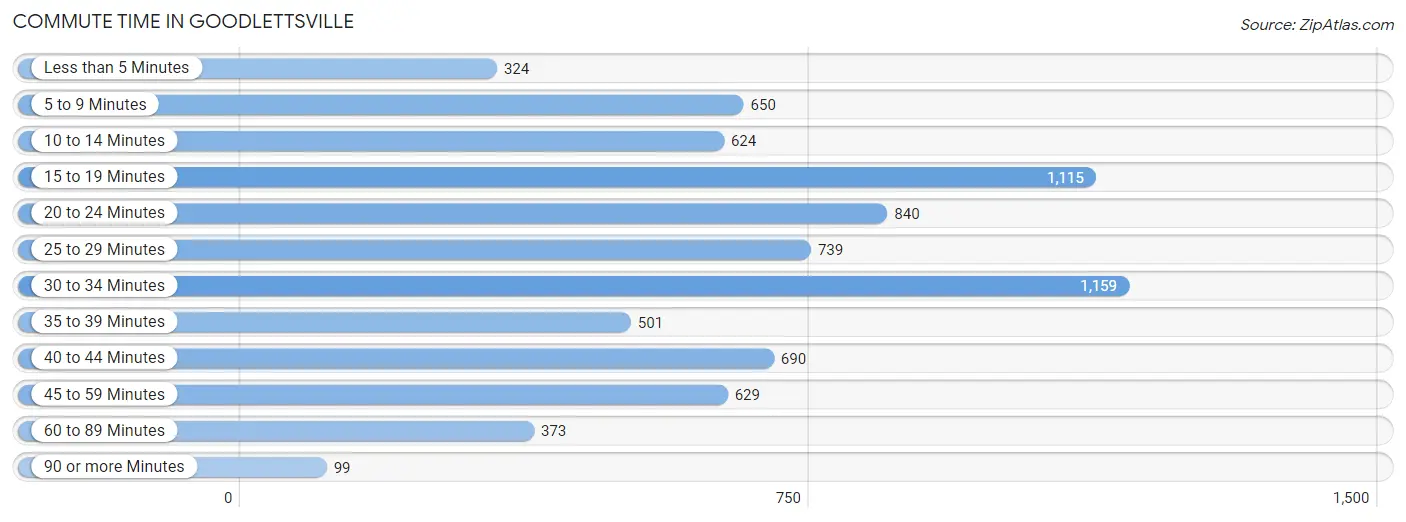
| Commute Time | # Commuters | % Commuters |
| Less than 5 Minutes | 324 | 4.2% |
| 5 to 9 Minutes | 650 | 8.4% |
| 10 to 14 Minutes | 624 | 8.1% |
| 15 to 19 Minutes | 1,115 | 14.4% |
| 20 to 24 Minutes | 840 | 10.8% |
| 25 to 29 Minutes | 739 | 9.5% |
| 30 to 34 Minutes | 1,159 | 15.0% |
| 35 to 39 Minutes | 501 | 6.5% |
| 40 to 44 Minutes | 690 | 8.9% |
| 45 to 59 Minutes | 629 | 8.1% |
| 60 to 89 Minutes | 373 | 4.8% |
| 90 or more Minutes | 99 | 1.3% |
Commute Time by Sex in Goodlettsville
The most common commute times in Goodlettsville are 15 to 19 minutes (564 commuters, 15.7%) for males and 30 to 34 minutes (605 commuters, 14.6%) for females.
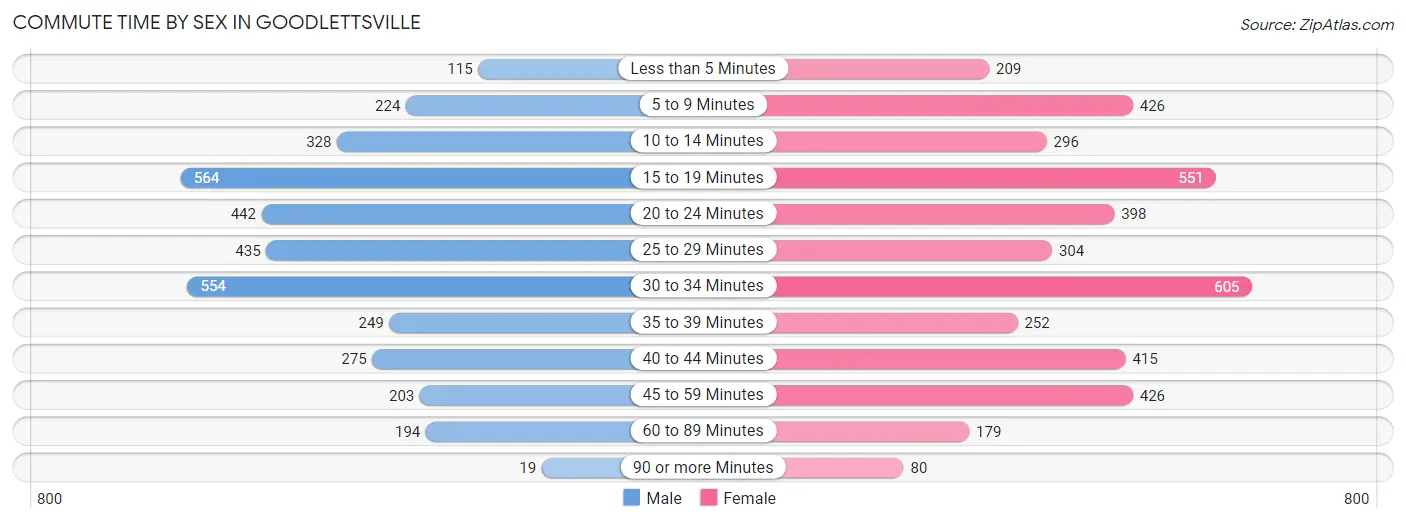
| Commute Time | Male | Female |
| Less than 5 Minutes | 115 (3.2%) | 209 (5.1%) |
| 5 to 9 Minutes | 224 (6.2%) | 426 (10.3%) |
| 10 to 14 Minutes | 328 (9.1%) | 296 (7.1%) |
| 15 to 19 Minutes | 564 (15.7%) | 551 (13.3%) |
| 20 to 24 Minutes | 442 (12.3%) | 398 (9.6%) |
| 25 to 29 Minutes | 435 (12.1%) | 304 (7.3%) |
| 30 to 34 Minutes | 554 (15.4%) | 605 (14.6%) |
| 35 to 39 Minutes | 249 (6.9%) | 252 (6.1%) |
| 40 to 44 Minutes | 275 (7.6%) | 415 (10.0%) |
| 45 to 59 Minutes | 203 (5.6%) | 426 (10.3%) |
| 60 to 89 Minutes | 194 (5.4%) | 179 (4.3%) |
| 90 or more Minutes | 19 (0.5%) | 80 (1.9%) |
Time of Departure to Work by Sex in Goodlettsville
The most frequent times of departure to work in Goodlettsville are 6:00 AM to 6:29 AM (602, 16.7%) for males and 7:00 AM to 7:29 AM (1,064, 25.7%) for females.
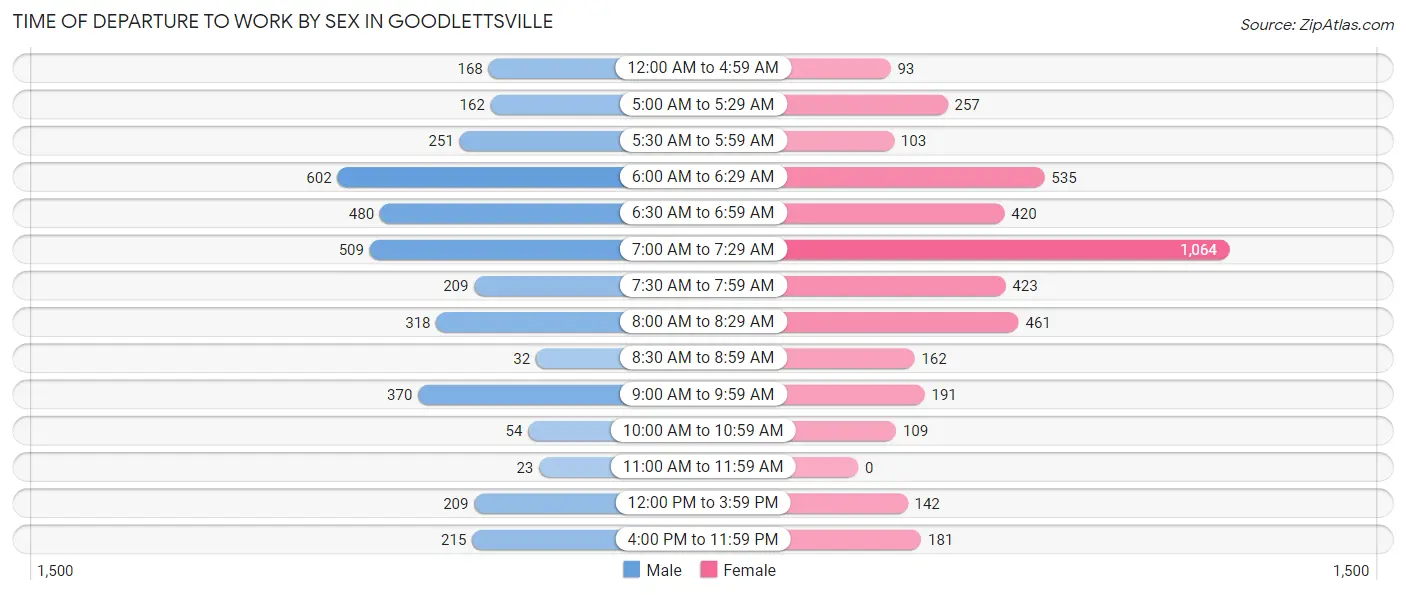
| Time of Departure | Male | Female |
| 12:00 AM to 4:59 AM | 168 (4.7%) | 93 (2.2%) |
| 5:00 AM to 5:29 AM | 162 (4.5%) | 257 (6.2%) |
| 5:30 AM to 5:59 AM | 251 (7.0%) | 103 (2.5%) |
| 6:00 AM to 6:29 AM | 602 (16.7%) | 535 (12.9%) |
| 6:30 AM to 6:59 AM | 480 (13.3%) | 420 (10.1%) |
| 7:00 AM to 7:29 AM | 509 (14.1%) | 1,064 (25.7%) |
| 7:30 AM to 7:59 AM | 209 (5.8%) | 423 (10.2%) |
| 8:00 AM to 8:29 AM | 318 (8.8%) | 461 (11.1%) |
| 8:30 AM to 8:59 AM | 32 (0.9%) | 162 (3.9%) |
| 9:00 AM to 9:59 AM | 370 (10.3%) | 191 (4.6%) |
| 10:00 AM to 10:59 AM | 54 (1.5%) | 109 (2.6%) |
| 11:00 AM to 11:59 AM | 23 (0.6%) | 0 (0.0%) |
| 12:00 PM to 3:59 PM | 209 (5.8%) | 142 (3.4%) |
| 4:00 PM to 11:59 PM | 215 (6.0%) | 181 (4.4%) |
| Total | 3,602 (100.0%) | 4,141 (100.0%) |
Housing Occupancy in Goodlettsville
Occupancy by Ownership in Goodlettsville
Of the total 7,283 dwellings in Goodlettsville, owner-occupied units account for 4,538 (62.3%), while renter-occupied units make up 2,745 (37.7%).
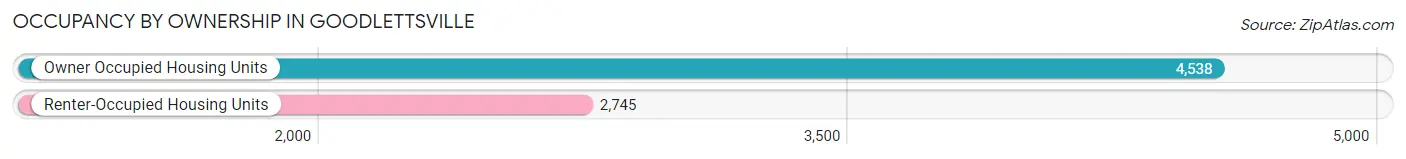
| Occupancy | # Housing Units | % Housing Units |
| Owner Occupied Housing Units | 4,538 | 62.3% |
| Renter-Occupied Housing Units | 2,745 | 37.7% |
| Total Occupied Housing Units | 7,283 | 100.0% |
Occupancy by Household Size in Goodlettsville
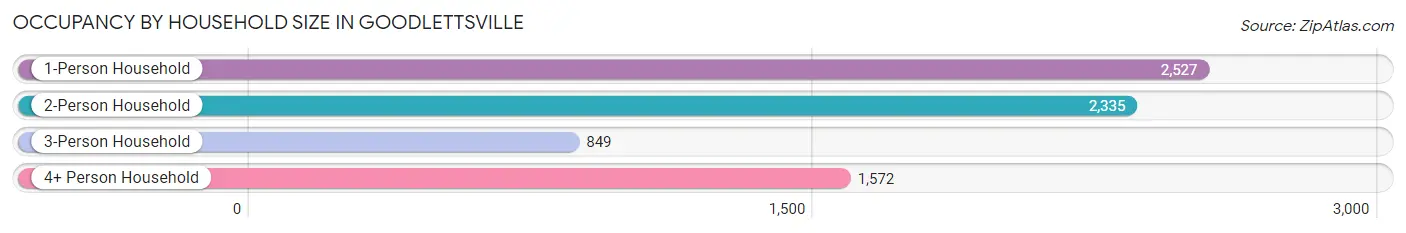
| Household Size | # Housing Units | % Housing Units |
| 1-Person Household | 2,527 | 34.7% |
| 2-Person Household | 2,335 | 32.1% |
| 3-Person Household | 849 | 11.7% |
| 4+ Person Household | 1,572 | 21.6% |
| Total Housing Units | 7,283 | 100.0% |
Occupancy by Ownership by Household Size in Goodlettsville
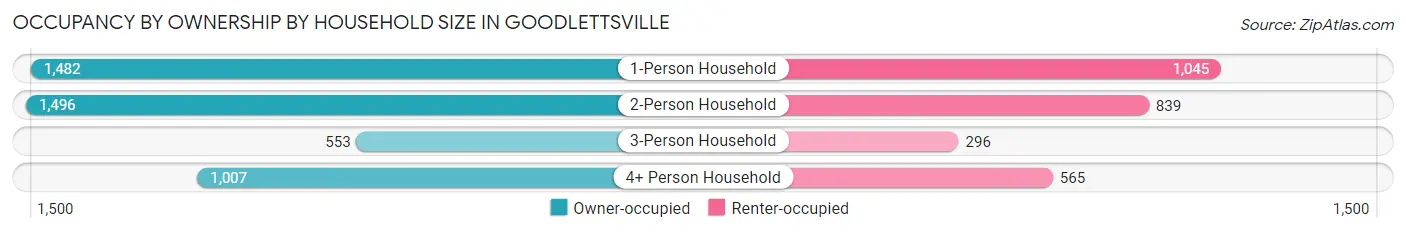
| Household Size | Owner-occupied | Renter-occupied |
| 1-Person Household | 1,482 (58.7%) | 1,045 (41.3%) |
| 2-Person Household | 1,496 (64.1%) | 839 (35.9%) |
| 3-Person Household | 553 (65.1%) | 296 (34.9%) |
| 4+ Person Household | 1,007 (64.1%) | 565 (35.9%) |
| Total Housing Units | 4,538 (62.3%) | 2,745 (37.7%) |
Occupancy by Educational Attainment in Goodlettsville
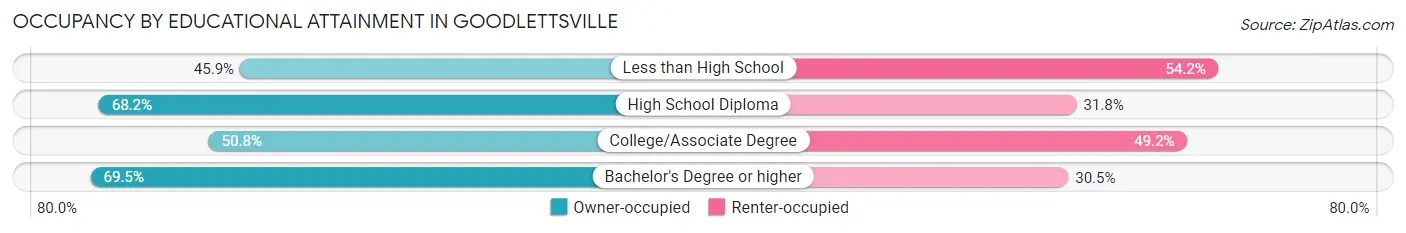
| Household Size | Owner-occupied | Renter-occupied |
| Less than High School | 309 (45.9%) | 365 (54.1%) |
| High School Diploma | 1,359 (68.2%) | 633 (31.8%) |
| College/Associate Degree | 922 (50.8%) | 893 (49.2%) |
| Bachelor's Degree or higher | 1,948 (69.5%) | 854 (30.5%) |
Occupancy by Age of Householder in Goodlettsville
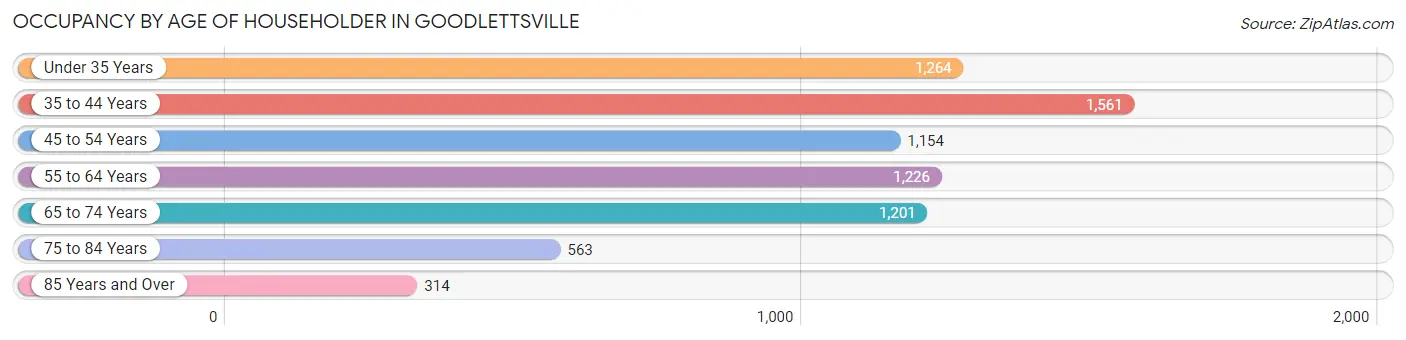
| Age Bracket | # Households | % Households |
| Under 35 Years | 1,264 | 17.4% |
| 35 to 44 Years | 1,561 | 21.4% |
| 45 to 54 Years | 1,154 | 15.9% |
| 55 to 64 Years | 1,226 | 16.8% |
| 65 to 74 Years | 1,201 | 16.5% |
| 75 to 84 Years | 563 | 7.7% |
| 85 Years and Over | 314 | 4.3% |
| Total | 7,283 | 100.0% |
Housing Finances in Goodlettsville
Median Income by Occupancy in Goodlettsville
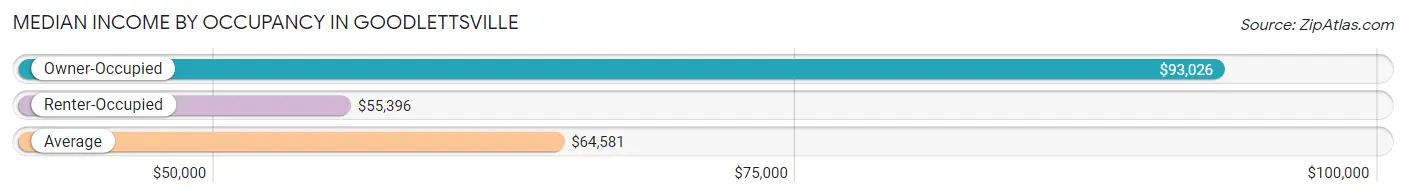
| Occupancy Type | # Households | Median Income |
| Owner-Occupied | 4,538 (62.3%) | $93,026 |
| Renter-Occupied | 2,745 (37.7%) | $55,396 |
| Average | 7,283 (100.0%) | $64,581 |
Occupancy by Householder Income Bracket in Goodlettsville
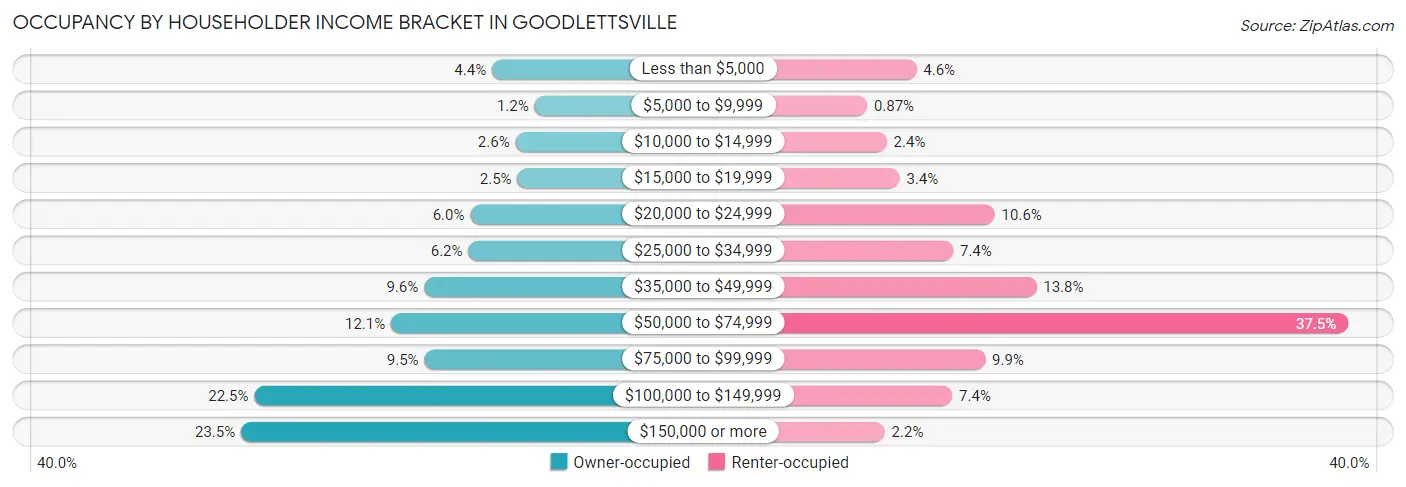
| Income Bracket | Owner-occupied | Renter-occupied |
| Less than $5,000 | 199 (4.4%) | 127 (4.6%) |
| $5,000 to $9,999 | 52 (1.1%) | 24 (0.9%) |
| $10,000 to $14,999 | 118 (2.6%) | 65 (2.4%) |
| $15,000 to $19,999 | 111 (2.5%) | 92 (3.4%) |
| $20,000 to $24,999 | 274 (6.0%) | 291 (10.6%) |
| $25,000 to $34,999 | 281 (6.2%) | 204 (7.4%) |
| $35,000 to $49,999 | 434 (9.6%) | 378 (13.8%) |
| $50,000 to $74,999 | 548 (12.1%) | 1,030 (37.5%) |
| $75,000 to $99,999 | 433 (9.5%) | 271 (9.9%) |
| $100,000 to $149,999 | 1,021 (22.5%) | 202 (7.4%) |
| $150,000 or more | 1,067 (23.5%) | 61 (2.2%) |
| Total | 4,538 (100.0%) | 2,745 (100.0%) |
Monthly Housing Cost Tiers in Goodlettsville
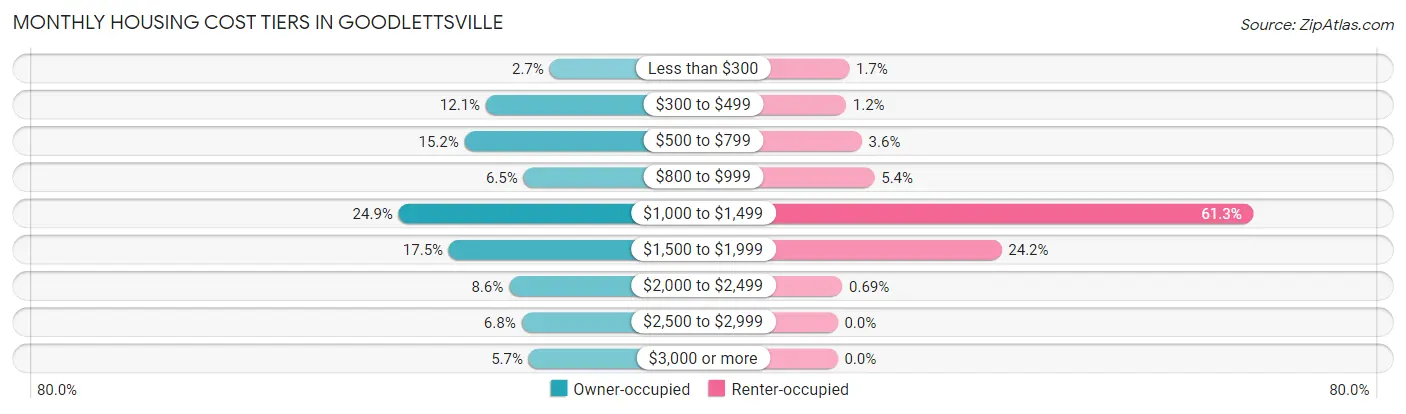
| Monthly Cost | Owner-occupied | Renter-occupied |
| Less than $300 | 121 (2.7%) | 47 (1.7%) |
| $300 to $499 | 547 (12.0%) | 34 (1.2%) |
| $500 to $799 | 690 (15.2%) | 98 (3.6%) |
| $800 to $999 | 295 (6.5%) | 149 (5.4%) |
| $1,000 to $1,499 | 1,130 (24.9%) | 1,682 (61.3%) |
| $1,500 to $1,999 | 794 (17.5%) | 663 (24.1%) |
| $2,000 to $2,499 | 392 (8.6%) | 19 (0.7%) |
| $2,500 to $2,999 | 309 (6.8%) | 0 (0.0%) |
| $3,000 or more | 260 (5.7%) | 0 (0.0%) |
| Total | 4,538 (100.0%) | 2,745 (100.0%) |
Physical Housing Characteristics in Goodlettsville
Housing Structures in Goodlettsville
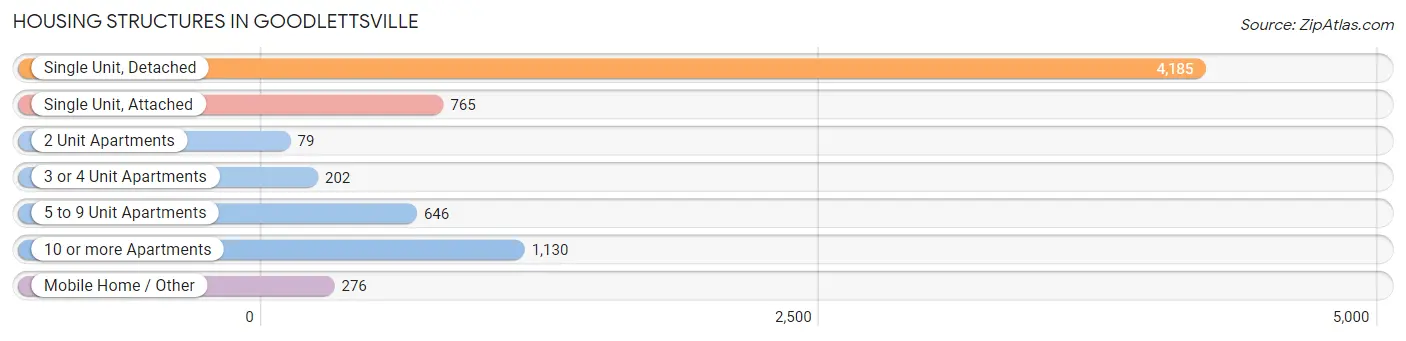
| Structure Type | # Housing Units | % Housing Units |
| Single Unit, Detached | 4,185 | 57.5% |
| Single Unit, Attached | 765 | 10.5% |
| 2 Unit Apartments | 79 | 1.1% |
| 3 or 4 Unit Apartments | 202 | 2.8% |
| 5 to 9 Unit Apartments | 646 | 8.9% |
| 10 or more Apartments | 1,130 | 15.5% |
| Mobile Home / Other | 276 | 3.8% |
| Total | 7,283 | 100.0% |
Housing Structures by Occupancy in Goodlettsville
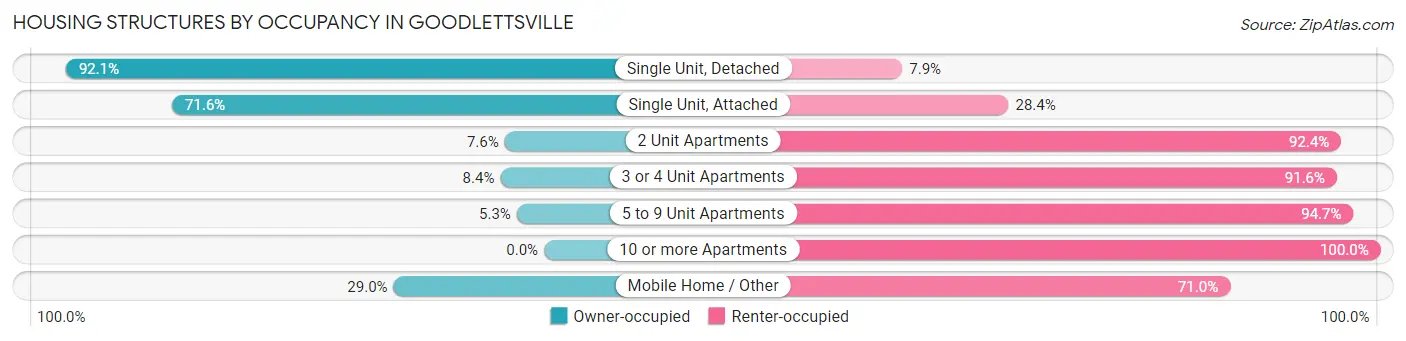
| Structure Type | Owner-occupied | Renter-occupied |
| Single Unit, Detached | 3,853 (92.1%) | 332 (7.9%) |
| Single Unit, Attached | 548 (71.6%) | 217 (28.4%) |
| 2 Unit Apartments | 6 (7.6%) | 73 (92.4%) |
| 3 or 4 Unit Apartments | 17 (8.4%) | 185 (91.6%) |
| 5 to 9 Unit Apartments | 34 (5.3%) | 612 (94.7%) |
| 10 or more Apartments | 0 (0.0%) | 1,130 (100.0%) |
| Mobile Home / Other | 80 (29.0%) | 196 (71.0%) |
| Total | 4,538 (62.3%) | 2,745 (37.7%) |
Housing Structures by Number of Rooms in Goodlettsville
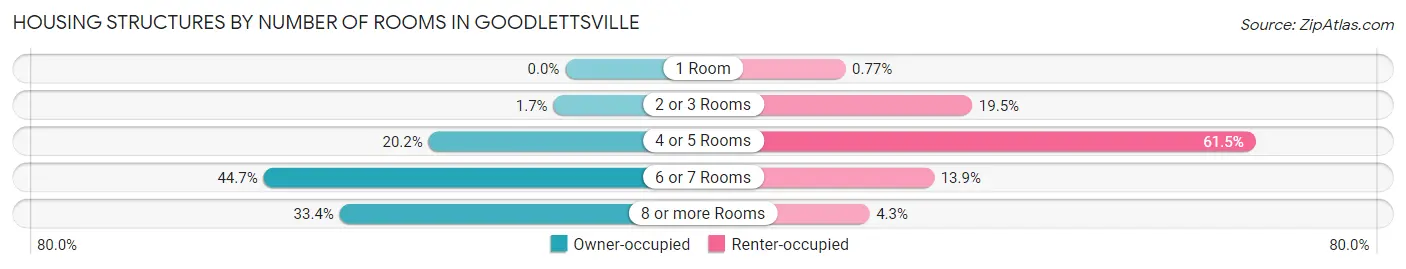
| Number of Rooms | Owner-occupied | Renter-occupied |
| 1 Room | 0 (0.0%) | 21 (0.8%) |
| 2 or 3 Rooms | 79 (1.7%) | 536 (19.5%) |
| 4 or 5 Rooms | 918 (20.2%) | 1,688 (61.5%) |
| 6 or 7 Rooms | 2,026 (44.7%) | 381 (13.9%) |
| 8 or more Rooms | 1,515 (33.4%) | 119 (4.3%) |
| Total | 4,538 (100.0%) | 2,745 (100.0%) |
Housing Structure by Heating Type in Goodlettsville
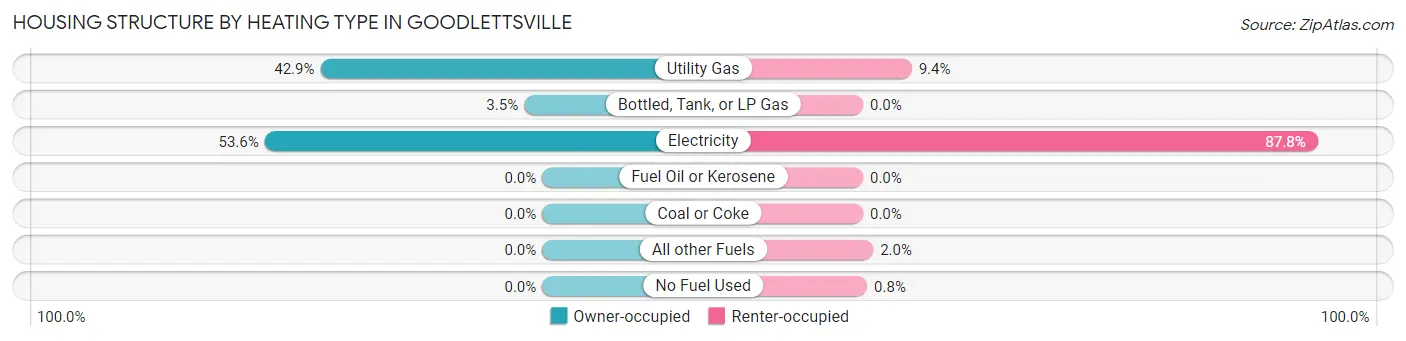
| Heating Type | Owner-occupied | Renter-occupied |
| Utility Gas | 1,945 (42.9%) | 258 (9.4%) |
| Bottled, Tank, or LP Gas | 159 (3.5%) | 0 (0.0%) |
| Electricity | 2,434 (53.6%) | 2,411 (87.8%) |
| Fuel Oil or Kerosene | 0 (0.0%) | 0 (0.0%) |
| Coal or Coke | 0 (0.0%) | 0 (0.0%) |
| All other Fuels | 0 (0.0%) | 54 (2.0%) |
| No Fuel Used | 0 (0.0%) | 22 (0.8%) |
| Total | 4,538 (100.0%) | 2,745 (100.0%) |
Household Vehicle Usage in Goodlettsville
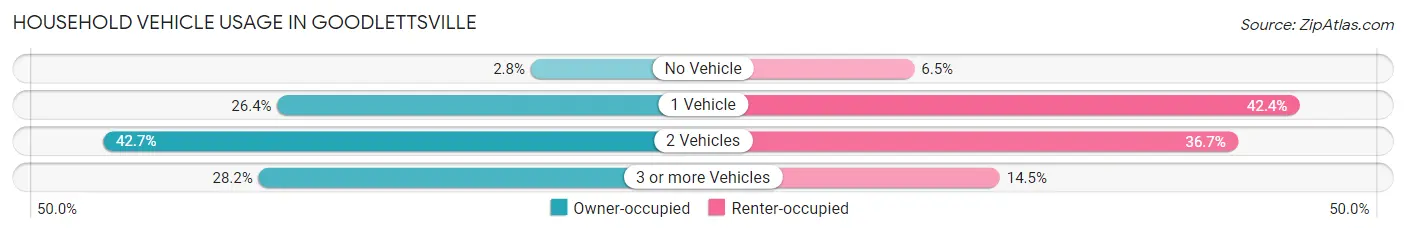
| Vehicles per Household | Owner-occupied | Renter-occupied |
| No Vehicle | 125 (2.8%) | 178 (6.5%) |
| 1 Vehicle | 1,198 (26.4%) | 1,164 (42.4%) |
| 2 Vehicles | 1,937 (42.7%) | 1,006 (36.6%) |
| 3 or more Vehicles | 1,278 (28.2%) | 397 (14.5%) |
| Total | 4,538 (100.0%) | 2,745 (100.0%) |
Real Estate & Mortgages in Goodlettsville
Real Estate and Mortgage Overview in Goodlettsville
| Characteristic | Without Mortgage | With Mortgage |
| Housing Units | 1,478 | 3,060 |
| Median Property Value | $308,400 | $313,800 |
| Median Household Income | $69,717 | $680 |
| Monthly Housing Costs | $552 | $260 |
| Real Estate Taxes | $2,146 | $201 |
Property Value by Mortgage Status in Goodlettsville
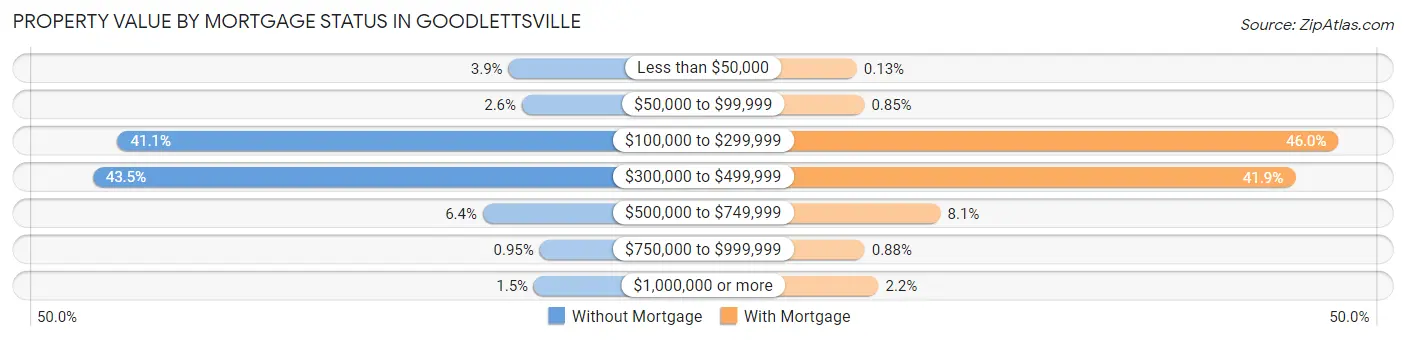
| Property Value | Without Mortgage | With Mortgage |
| Less than $50,000 | 58 (3.9%) | 4 (0.1%) |
| $50,000 to $99,999 | 39 (2.6%) | 26 (0.9%) |
| $100,000 to $299,999 | 608 (41.1%) | 1,407 (46.0%) |
| $300,000 to $499,999 | 643 (43.5%) | 1,281 (41.9%) |
| $500,000 to $749,999 | 94 (6.4%) | 248 (8.1%) |
| $750,000 to $999,999 | 14 (0.9%) | 27 (0.9%) |
| $1,000,000 or more | 22 (1.5%) | 67 (2.2%) |
| Total | 1,478 (100.0%) | 3,060 (100.0%) |
Household Income by Mortgage Status in Goodlettsville
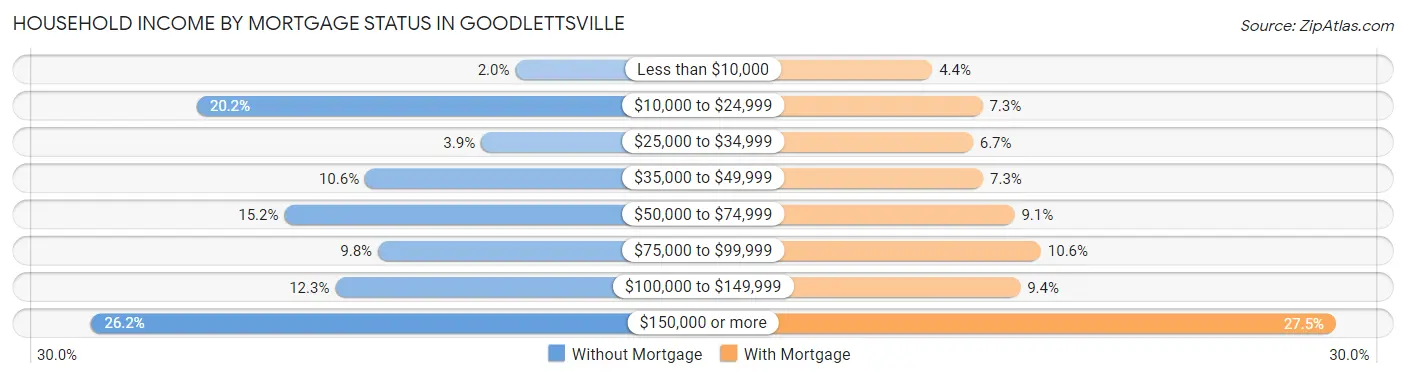
| Household Income | Without Mortgage | With Mortgage |
| Less than $10,000 | 29 (2.0%) | 134 (4.4%) |
| $10,000 to $24,999 | 298 (20.2%) | 222 (7.2%) |
| $25,000 to $34,999 | 58 (3.9%) | 205 (6.7%) |
| $35,000 to $49,999 | 156 (10.5%) | 223 (7.3%) |
| $50,000 to $74,999 | 224 (15.2%) | 278 (9.1%) |
| $75,000 to $99,999 | 145 (9.8%) | 324 (10.6%) |
| $100,000 to $149,999 | 181 (12.2%) | 288 (9.4%) |
| $150,000 or more | 387 (26.2%) | 840 (27.5%) |
| Total | 1,478 (100.0%) | 3,060 (100.0%) |
Property Value to Household Income Ratio in Goodlettsville
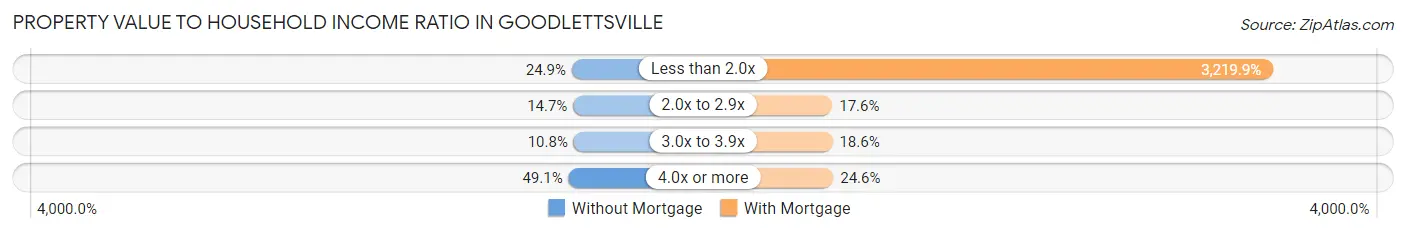
| Value-to-Income Ratio | Without Mortgage | With Mortgage |
| Less than 2.0x | 368 (24.9%) | 98,529 (3,219.9%) |
| 2.0x to 2.9x | 217 (14.7%) | 537 (17.5%) |
| 3.0x to 3.9x | 159 (10.8%) | 569 (18.6%) |
| 4.0x or more | 725 (49.0%) | 752 (24.6%) |
| Total | 1,478 (100.0%) | 3,060 (100.0%) |
Real Estate Taxes by Mortgage Status in Goodlettsville
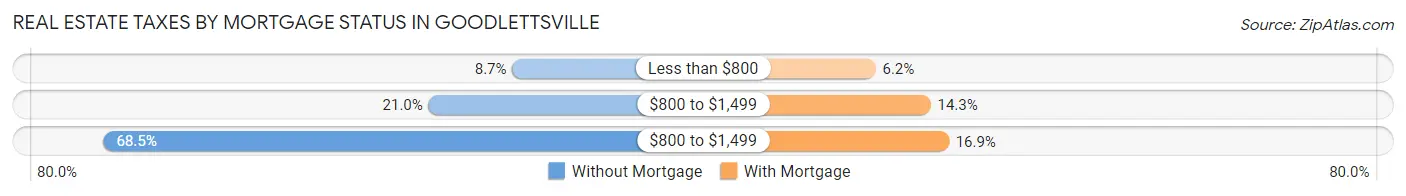
| Property Taxes | Without Mortgage | With Mortgage |
| Less than $800 | 129 (8.7%) | 190 (6.2%) |
| $800 to $1,499 | 310 (21.0%) | 436 (14.2%) |
| $800 to $1,499 | 1,012 (68.5%) | 517 (16.9%) |
| Total | 1,478 (100.0%) | 3,060 (100.0%) |
Health & Disability in Goodlettsville
Health Insurance Coverage by Age in Goodlettsville
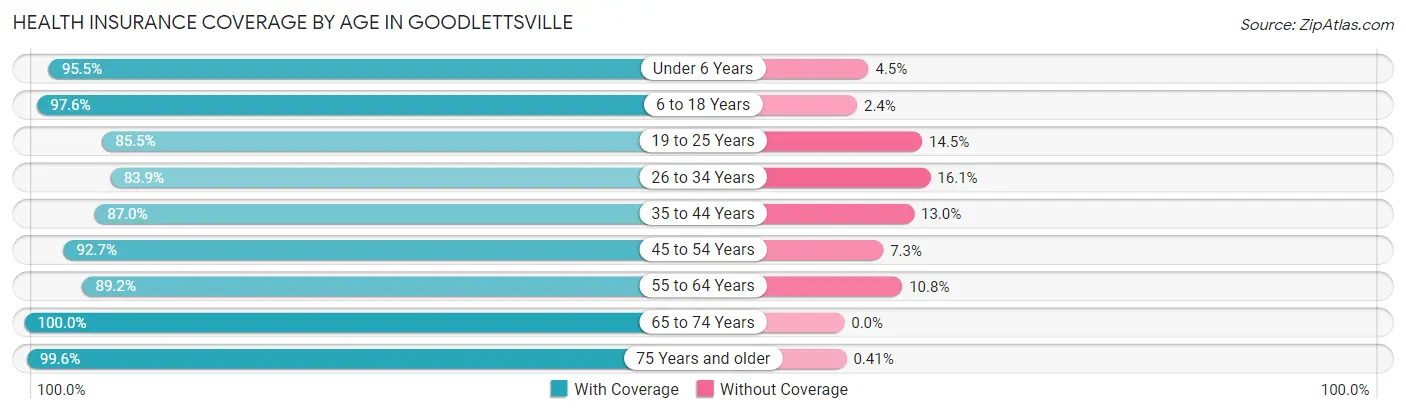
| Age Bracket | With Coverage | Without Coverage |
| Under 6 Years | 1,586 (95.5%) | 75 (4.5%) |
| 6 to 18 Years | 2,461 (97.6%) | 60 (2.4%) |
| 19 to 25 Years | 1,167 (85.5%) | 198 (14.5%) |
| 26 to 34 Years | 2,013 (83.9%) | 385 (16.1%) |
| 35 to 44 Years | 2,099 (87.0%) | 314 (13.0%) |
| 45 to 54 Years | 1,878 (92.7%) | 147 (7.3%) |
| 55 to 64 Years | 1,996 (89.2%) | 242 (10.8%) |
| 65 to 74 Years | 1,550 (100.0%) | 0 (0.0%) |
| 75 Years and older | 1,211 (99.6%) | 5 (0.4%) |
| Total | 15,961 (91.8%) | 1,426 (8.2%) |
Health Insurance Coverage by Citizenship Status in Goodlettsville
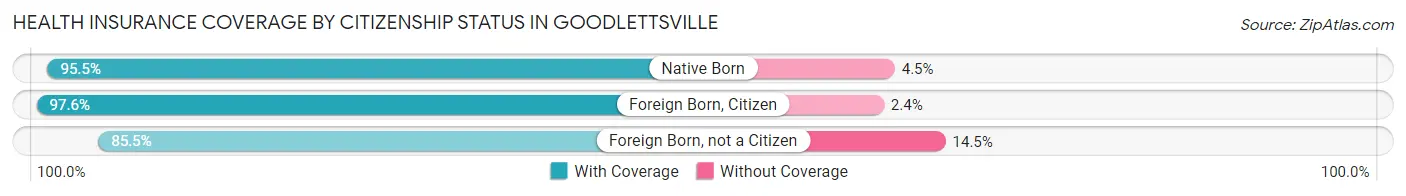
| Citizenship Status | With Coverage | Without Coverage |
| Native Born | 1,586 (95.5%) | 75 (4.5%) |
| Foreign Born, Citizen | 2,461 (97.6%) | 60 (2.4%) |
| Foreign Born, not a Citizen | 1,167 (85.5%) | 198 (14.5%) |
Health Insurance Coverage by Household Income in Goodlettsville
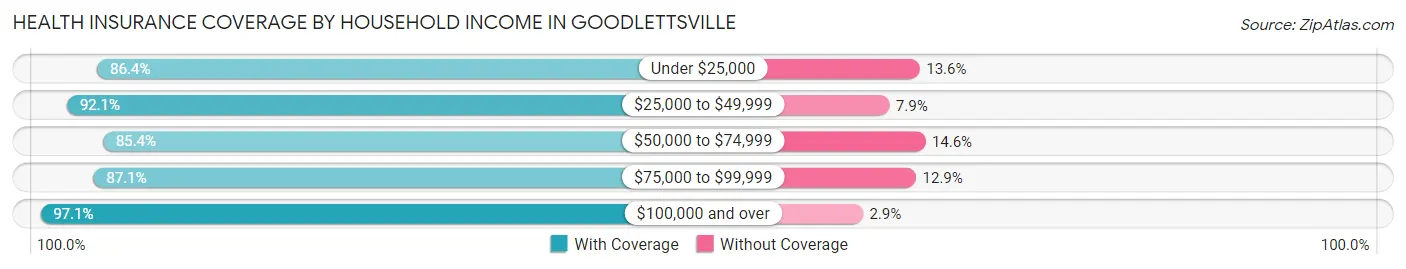
| Household Income | With Coverage | Without Coverage |
| Under $25,000 | 1,521 (86.4%) | 239 (13.6%) |
| $25,000 to $49,999 | 2,615 (92.1%) | 224 (7.9%) |
| $50,000 to $74,999 | 3,095 (85.4%) | 531 (14.6%) |
| $75,000 to $99,999 | 1,392 (87.1%) | 206 (12.9%) |
| $100,000 and over | 7,333 (97.1%) | 221 (2.9%) |
Public vs Private Health Insurance Coverage by Age in Goodlettsville
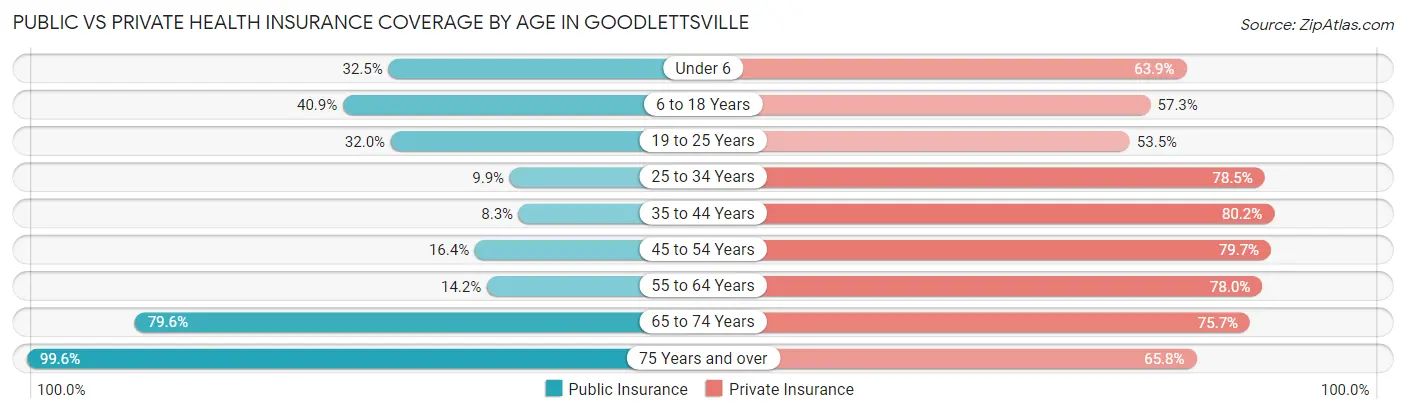
| Age Bracket | Public Insurance | Private Insurance |
| Under 6 | 539 (32.5%) | 1,062 (63.9%) |
| 6 to 18 Years | 1,031 (40.9%) | 1,445 (57.3%) |
| 19 to 25 Years | 437 (32.0%) | 730 (53.5%) |
| 25 to 34 Years | 238 (9.9%) | 1,882 (78.5%) |
| 35 to 44 Years | 199 (8.3%) | 1,936 (80.2%) |
| 45 to 54 Years | 332 (16.4%) | 1,613 (79.6%) |
| 55 to 64 Years | 317 (14.2%) | 1,746 (78.0%) |
| 65 to 74 Years | 1,233 (79.5%) | 1,174 (75.7%) |
| 75 Years and over | 1,211 (99.6%) | 800 (65.8%) |
| Total | 5,537 (31.9%) | 12,388 (71.3%) |
Disability Status by Sex by Age in Goodlettsville
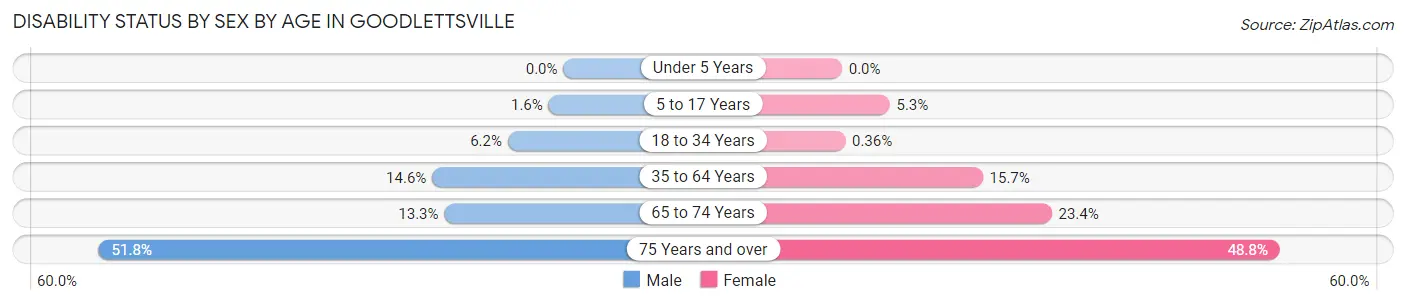
| Age Bracket | Male | Female |
| Under 5 Years | 0 (0.0%) | 0 (0.0%) |
| 5 to 17 Years | 21 (1.6%) | 73 (5.3%) |
| 18 to 34 Years | 124 (6.2%) | 8 (0.4%) |
| 35 to 64 Years | 434 (14.6%) | 581 (15.7%) |
| 65 to 74 Years | 84 (13.3%) | 214 (23.4%) |
| 75 Years and over | 207 (51.7%) | 398 (48.8%) |
Disability Class by Sex by Age in Goodlettsville
Disability Class: Hearing Difficulty
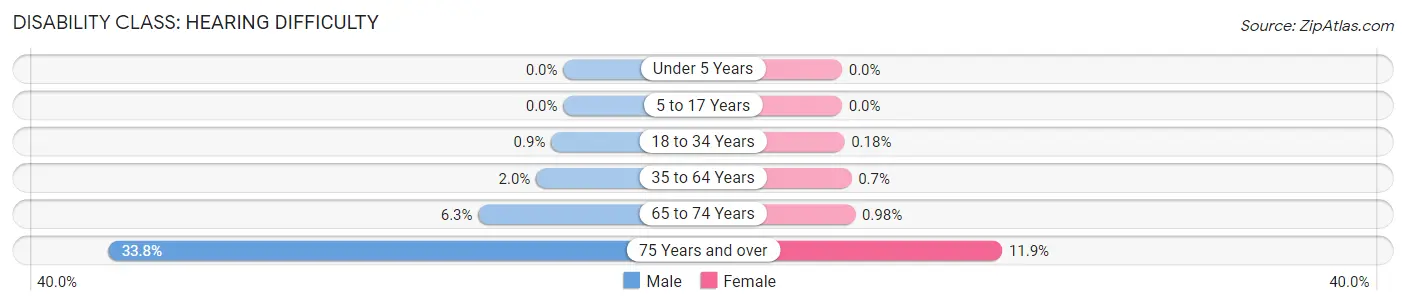
| Age Bracket | Male | Female |
| Under 5 Years | 0 (0.0%) | 0 (0.0%) |
| 5 to 17 Years | 0 (0.0%) | 0 (0.0%) |
| 18 to 34 Years | 18 (0.9%) | 4 (0.2%) |
| 35 to 64 Years | 60 (2.0%) | 26 (0.7%) |
| 65 to 74 Years | 40 (6.3%) | 9 (1.0%) |
| 75 Years and over | 135 (33.8%) | 97 (11.9%) |
Disability Class: Vision Difficulty
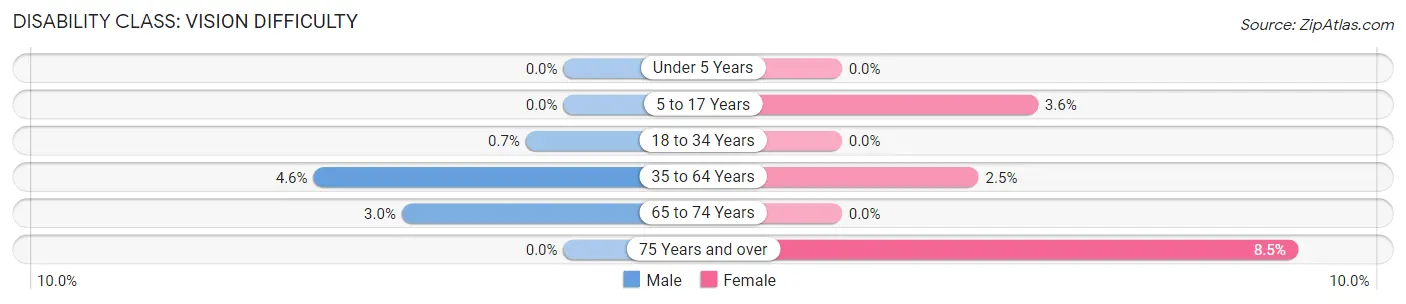
| Age Bracket | Male | Female |
| Under 5 Years | 0 (0.0%) | 0 (0.0%) |
| 5 to 17 Years | 0 (0.0%) | 50 (3.6%) |
| 18 to 34 Years | 14 (0.7%) | 0 (0.0%) |
| 35 to 64 Years | 138 (4.6%) | 94 (2.5%) |
| 65 to 74 Years | 19 (3.0%) | 0 (0.0%) |
| 75 Years and over | 0 (0.0%) | 69 (8.5%) |
Disability Class: Cognitive Difficulty
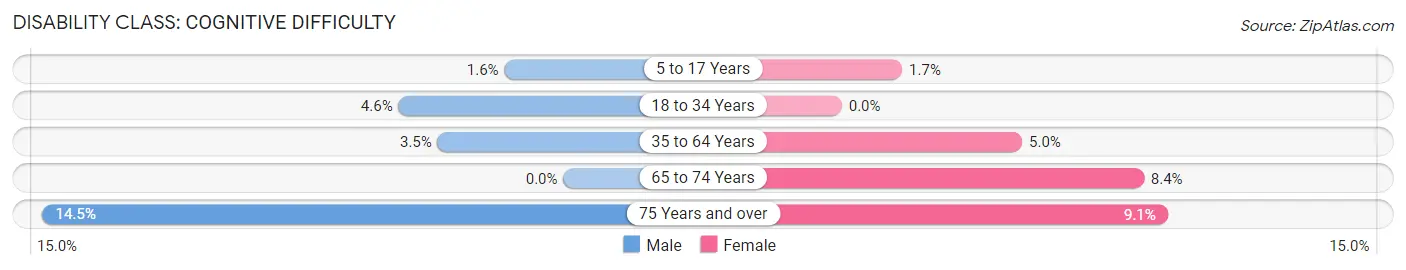
| Age Bracket | Male | Female |
| 5 to 17 Years | 21 (1.6%) | 23 (1.7%) |
| 18 to 34 Years | 92 (4.6%) | 0 (0.0%) |
| 35 to 64 Years | 104 (3.5%) | 186 (5.0%) |
| 65 to 74 Years | 0 (0.0%) | 77 (8.4%) |
| 75 Years and over | 58 (14.5%) | 74 (9.1%) |
Disability Class: Ambulatory Difficulty
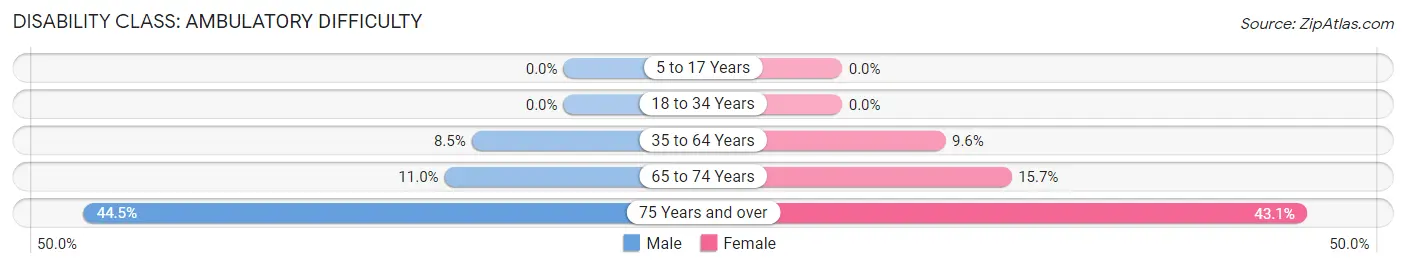
| Age Bracket | Male | Female |
| 5 to 17 Years | 0 (0.0%) | 0 (0.0%) |
| 18 to 34 Years | 0 (0.0%) | 0 (0.0%) |
| 35 to 64 Years | 253 (8.5%) | 355 (9.6%) |
| 65 to 74 Years | 70 (11.0%) | 144 (15.7%) |
| 75 Years and over | 178 (44.5%) | 352 (43.1%) |
Disability Class: Self-Care Difficulty
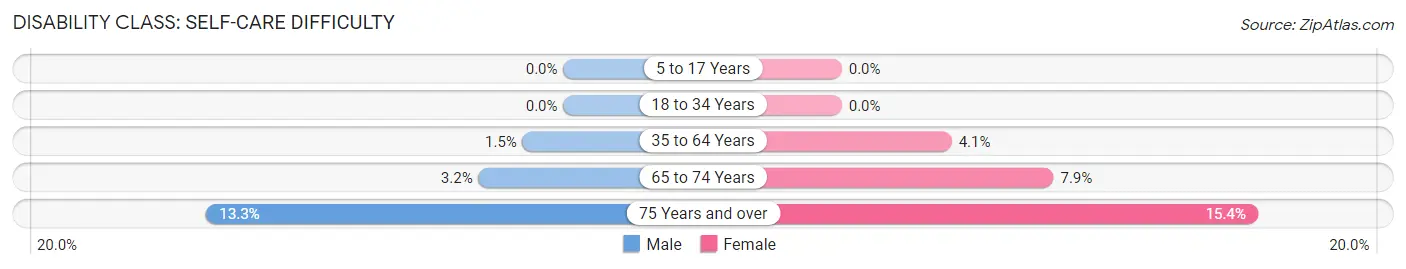
| Age Bracket | Male | Female |
| 5 to 17 Years | 0 (0.0%) | 0 (0.0%) |
| 18 to 34 Years | 0 (0.0%) | 0 (0.0%) |
| 35 to 64 Years | 45 (1.5%) | 151 (4.1%) |
| 65 to 74 Years | 20 (3.2%) | 72 (7.9%) |
| 75 Years and over | 53 (13.3%) | 126 (15.4%) |
Technology Access in Goodlettsville
Computing Device Access in Goodlettsville
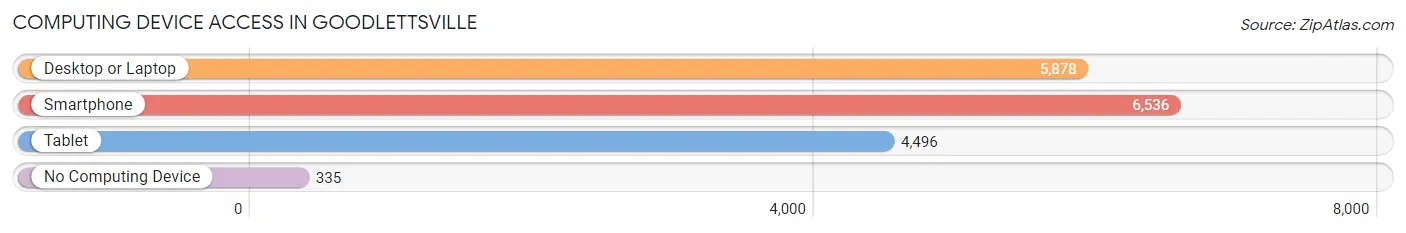
| Device Type | # Households | % Households |
| Desktop or Laptop | 5,878 | 80.7% |
| Smartphone | 6,536 | 89.7% |
| Tablet | 4,496 | 61.7% |
| No Computing Device | 335 | 4.6% |
| Total | 7,283 | 100.0% |
Internet Access in Goodlettsville
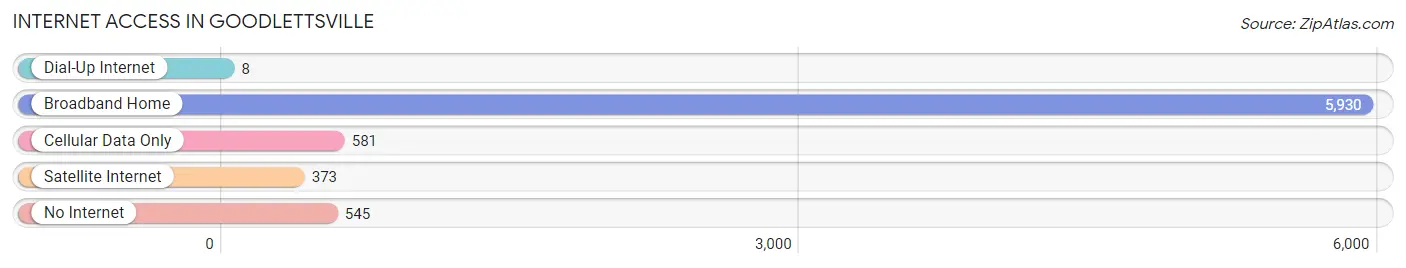
| Internet Type | # Households | % Households |
| Dial-Up Internet | 8 | 0.1% |
| Broadband Home | 5,930 | 81.4% |
| Cellular Data Only | 581 | 8.0% |
| Satellite Internet | 373 | 5.1% |
| No Internet | 545 | 7.5% |
| Total | 7,283 | 100.0% |
Goodlettsville Summary
Goodlettsville, Tennessee is a small city located in Davidson County, just north of Nashville. It is part of the Nashville metropolitan area and has a population of approximately 16,000 people. The city is known for its historic downtown area, which is home to a variety of shops, restaurants, and other businesses.
Goodlettsville was founded in 1826 by William Goodlett, who named the city after himself. The city was originally a farming community, but it quickly grew into a bustling town. In the late 19th century, the city was home to several factories, including a cotton mill, a shoe factory, and a furniture factory. The city also had a railroad station, which connected it to other cities in the area.
Geographically, Goodlettsville is located in the rolling hills of Middle Tennessee. The city is situated on the Cumberland River, which provides a scenic backdrop for the city. The city is also home to several parks, including Moss-Wright Park, which is the largest park in the city.
The economy of Goodlettsville is largely based on retail and services. The city is home to several large retail stores, including Walmart, Target, and Kroger. The city also has a variety of restaurants, bars, and other businesses. In addition, the city is home to several manufacturing companies, including a furniture factory and a printing company.
Goodlettsville has a diverse population. According to the 2010 census, the city had a population of 16,073 people. The racial makeup of the city was 79.3% White, 15.2% African American, 0.7% Native American, 1.2% Asian, 0.1% Pacific Islander, and 3.5% from other races. The median household income in the city was $45,837, and the median family income was $54,837.
Goodlettsville is a great place to live and work. The city has a rich history, a vibrant economy, and a diverse population. It is a great place to raise a family and enjoy the beauty of Middle Tennessee.
Common Questions
What is Per Capita Income in Goodlettsville?
Per Capita income in Goodlettsville is $38,619.
What is the Median Family Income in Goodlettsville?
Median Family Income in Goodlettsville is $93,595.
What is the Median Household income in Goodlettsville?
Median Household Income in Goodlettsville is $64,581.
What is Income or Wage Gap in Goodlettsville?
Income or Wage Gap in Goodlettsville is 25.1%.
Women in Goodlettsville earn 74.9 cents for every dollar earned by a man.
What is Inequality or Gini Index in Goodlettsville?
Inequality or Gini Index in Goodlettsville is 0.47.
What is the Total Population of Goodlettsville?
Total Population of Goodlettsville is 17,500.
What is the Total Male Population of Goodlettsville?
Total Male Population of Goodlettsville is 7,769.
What is the Total Female Population of Goodlettsville?
Total Female Population of Goodlettsville is 9,731.
What is the Ratio of Males per 100 Females in Goodlettsville?
There are 79.84 Males per 100 Females in Goodlettsville.
What is the Ratio of Females per 100 Males in Goodlettsville?
There are 125.25 Females per 100 Males in Goodlettsville.
What is the Median Population Age in Goodlettsville?
Median Population Age in Goodlettsville is 38.2 Years.
What is the Average Family Size in Goodlettsville
Average Family Size in Goodlettsville is 3.0 People.
What is the Average Household Size in Goodlettsville
Average Household Size in Goodlettsville is 2.4 People.
How Large is the Labor Force in Goodlettsville?
There are 9,384 People in the Labor Forcein in Goodlettsville.
What is the Percentage of People in the Labor Force in Goodlettsville?
66.4% of People are in the Labor Force in Goodlettsville.
What is the Unemployment Rate in Goodlettsville?
Unemployment Rate in Goodlettsville is 5.8%.