Thompson s Station, TN Map & Demographics
Thompson s Station Map
Thompson s Station Overview
$54,316
PER CAPITA INCOME
$142,726
AVG FAMILY INCOME
$116,569
AVG HOUSEHOLD INCOME
28.3%
WAGE / INCOME GAP [ % ]
71.7¢/ $1
WAGE / INCOME GAP [ $ ]
0.39
INEQUALITY / GINI INDEX
7,426
TOTAL POPULATION
3,959
MALE POPULATION
3,467
FEMALE POPULATION
114.19
MALES / 100 FEMALES
87.57
FEMALES / 100 MALES
36.1
MEDIAN AGE
3.4
AVG FAMILY SIZE
2.9
AVG HOUSEHOLD SIZE
4,048
LABOR FORCE [ PEOPLE ]
70.8%
PERCENT IN LABOR FORCE
5.1%
UNEMPLOYMENT RATE
Income in Thompson s Station
Income Overview in Thompson s Station
Per Capita Income in Thompson s Station is $54,316, while median incomes of families and households are $142,726 and $116,569 respectively.
| Characteristic | Number | Measure |
| Per Capita Income | 7,426 | $54,316 |
| Median Family Income | 1,813 | $142,726 |
| Mean Family Income | 1,813 | $173,109 |
| Median Household Income | 2,605 | $116,569 |
| Mean Household Income | 2,605 | $145,936 |
| Income Deficit | 1,813 | $0 |
| Wage / Income Gap (%) | 7,426 | 28.34% |
| Wage / Income Gap ($) | 7,426 | 71.66¢ per $1 |
| Gini / Inequality Index | 7,426 | 0.39 |
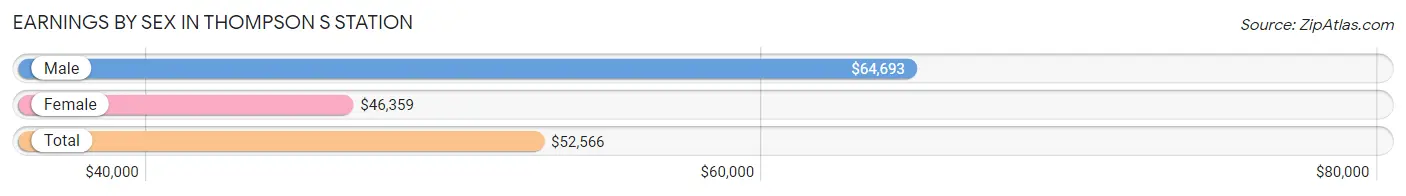
Earnings by Sex in Thompson s Station
Average Earnings in Thompson s Station are $52,566, $64,693 for men and $46,359 for women, a difference of 28.3%.
| Sex | Number | Average Earnings |
| Male | 2,437 (56.1%) | $64,693 |
| Female | 1,905 (43.9%) | $46,359 |
| Total | 4,342 (100.0%) | $52,566 |
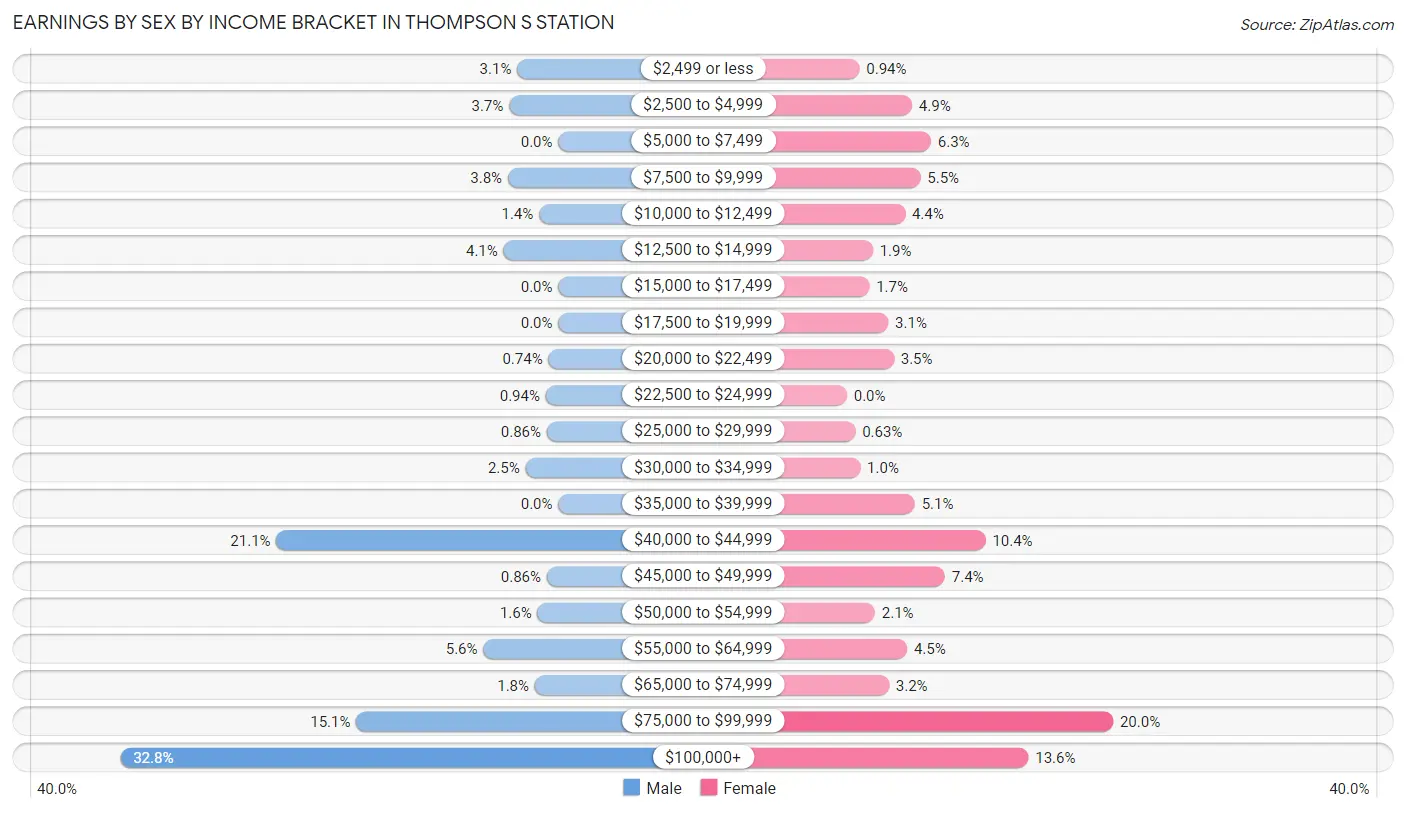
Earnings by Sex by Income Bracket in Thompson s Station
The most common earnings brackets in Thompson s Station are $100,000+ for men (800 | 32.8%) and $75,000 to $99,999 for women (380 | 20.0%).
| Income | Male | Female |
| $2,499 or less | 75 (3.1%) | 18 (0.9%) |
| $2,500 to $4,999 | 90 (3.7%) | 93 (4.9%) |
| $5,000 to $7,499 | 0 (0.0%) | 120 (6.3%) |
| $7,500 to $9,999 | 92 (3.8%) | 105 (5.5%) |
| $10,000 to $12,499 | 35 (1.4%) | 83 (4.4%) |
| $12,500 to $14,999 | 100 (4.1%) | 37 (1.9%) |
| $15,000 to $17,499 | 0 (0.0%) | 32 (1.7%) |
| $17,500 to $19,999 | 0 (0.0%) | 59 (3.1%) |
| $20,000 to $22,499 | 18 (0.7%) | 67 (3.5%) |
| $22,500 to $24,999 | 23 (0.9%) | 0 (0.0%) |
| $25,000 to $29,999 | 21 (0.9%) | 12 (0.6%) |
| $30,000 to $34,999 | 60 (2.5%) | 19 (1.0%) |
| $35,000 to $39,999 | 0 (0.0%) | 97 (5.1%) |
| $40,000 to $44,999 | 515 (21.1%) | 198 (10.4%) |
| $45,000 to $49,999 | 21 (0.9%) | 140 (7.3%) |
| $50,000 to $54,999 | 38 (1.6%) | 40 (2.1%) |
| $55,000 to $64,999 | 137 (5.6%) | 86 (4.5%) |
| $65,000 to $74,999 | 43 (1.8%) | 60 (3.2%) |
| $75,000 to $99,999 | 369 (15.1%) | 380 (20.0%) |
| $100,000+ | 800 (32.8%) | 259 (13.6%) |
| Total | 2,437 (100.0%) | 1,905 (100.0%) |
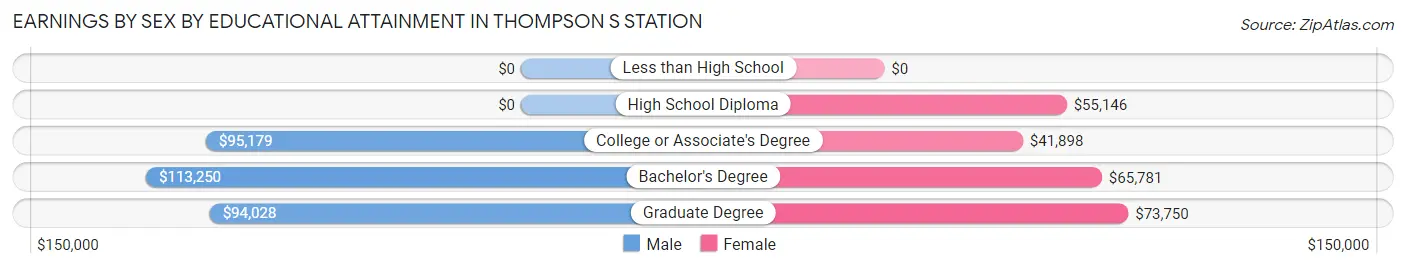
Earnings by Sex by Educational Attainment in Thompson s Station
Average earnings in Thompson s Station are $97,112 for men and $49,188 for women, a difference of 49.3%. Men with an educational attainment of bachelor's degree enjoy the highest average annual earnings of $113,250, while those with graduate degree education earn the least with $94,028. Women with an educational attainment of graduate degree earn the most with the average annual earnings of $73,750, while those with college or associate's degree education have the smallest earnings of $41,898.
| Educational Attainment | Male Income | Female Income |
| Less than High School | - | - |
| High School Diploma | - | - |
| College or Associate's Degree | $95,179 | $41,898 |
| Bachelor's Degree | $113,250 | $65,781 |
| Graduate Degree | $94,028 | $73,750 |
| Total | $97,112 | $49,188 |
Family Income in Thompson s Station
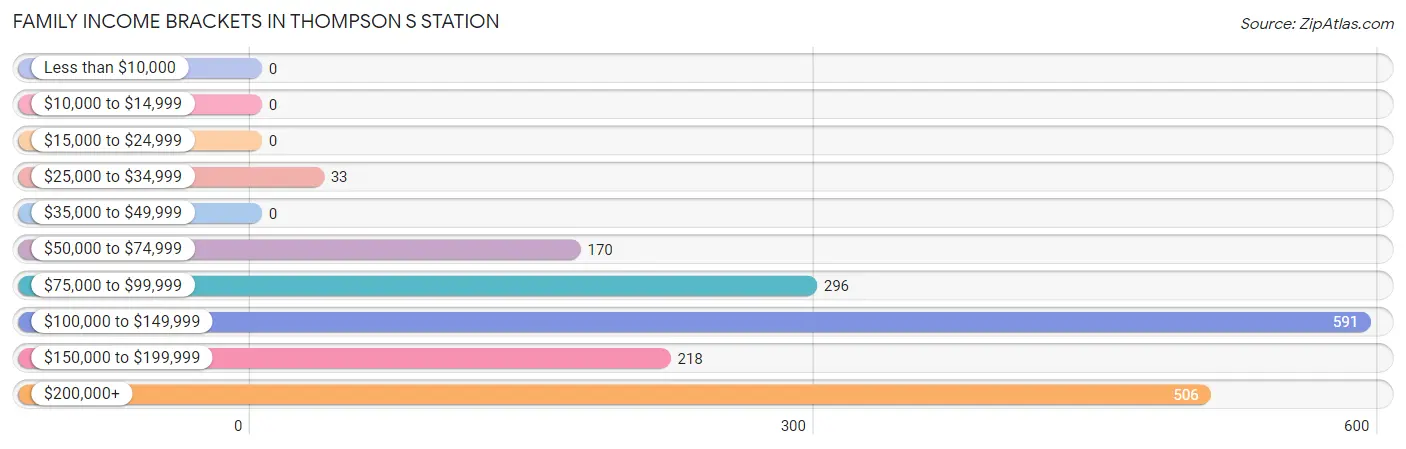
Family Income Brackets in Thompson s Station
According to the Thompson s Station family income data, there are 591 families falling into the $100,000 to $149,999 income range, which is the most common income bracket and makes up 32.6% of all families.
| Income Bracket | # Families | % Families |
| Less than $10,000 | 0 | 0.0% |
| $10,000 to $14,999 | 0 | 0.0% |
| $15,000 to $24,999 | 0 | 0.0% |
| $25,000 to $34,999 | 33 | 1.8% |
| $35,000 to $49,999 | 0 | 0.0% |
| $50,000 to $74,999 | 170 | 9.4% |
| $75,000 to $99,999 | 296 | 16.3% |
| $100,000 to $149,999 | 591 | 32.6% |
| $150,000 to $199,999 | 218 | 12.0% |
| $200,000+ | 506 | 27.9% |
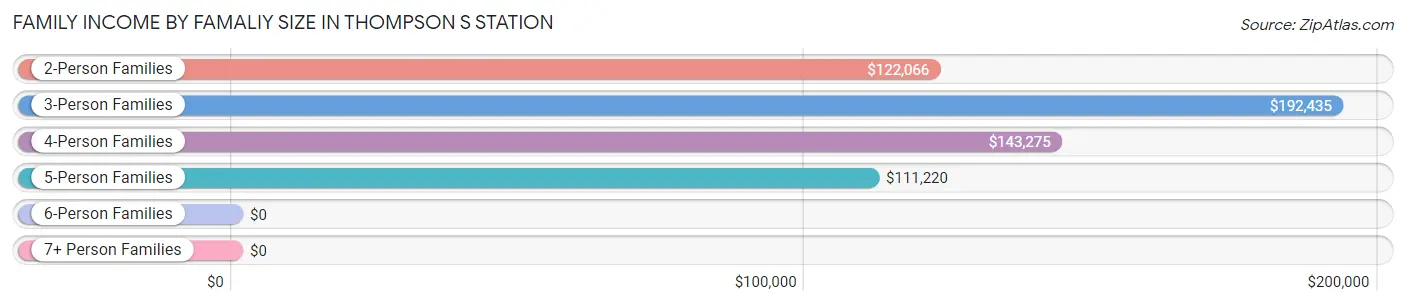
Family Income by Famaliy Size in Thompson s Station
3-person families (259 | 14.3%) account for the highest median family income in Thompson s Station with $192,435 per family, while 3-person families (259 | 14.3%) have the highest median income of $64,145 per family member.
| Income Bracket | # Families | Median Income |
| 2-Person Families | 823 (45.4%) | $122,066 |
| 3-Person Families | 259 (14.3%) | $192,435 |
| 4-Person Families | 391 (21.6%) | $143,275 |
| 5-Person Families | 206 (11.4%) | $111,220 |
| 6-Person Families | 104 (5.7%) | $0 |
| 7+ Person Families | 30 (1.7%) | $0 |
| Total | 1,813 (100.0%) | $142,726 |
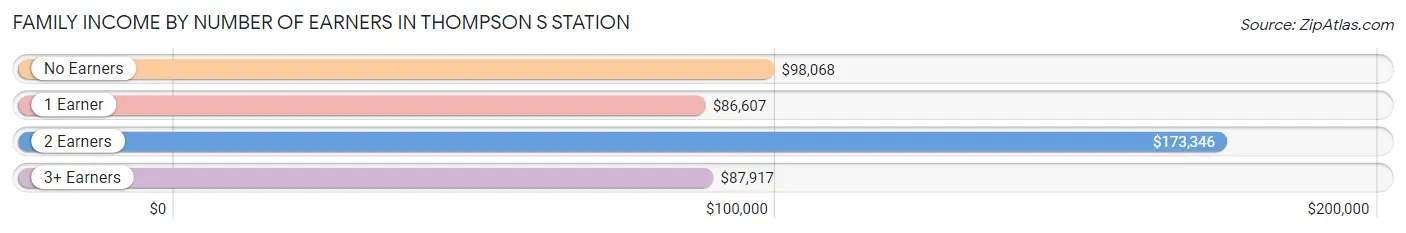
Family Income by Number of Earners in Thompson s Station
The median family income in Thompson s Station is $142,726, with families comprising 2 earners (1,111) having the highest median family income of $173,346, while families with 1 earner (362) have the lowest median family income of $86,607, accounting for 61.3% and 20.0% of families, respectively.
| Number of Earners | # Families | Median Income |
| No Earners | 139 (7.7%) | $98,068 |
| 1 Earner | 362 (20.0%) | $86,607 |
| 2 Earners | 1,111 (61.3%) | $173,346 |
| 3+ Earners | 201 (11.1%) | $87,917 |
| Total | 1,813 (100.0%) | $142,726 |
Household Income in Thompson s Station
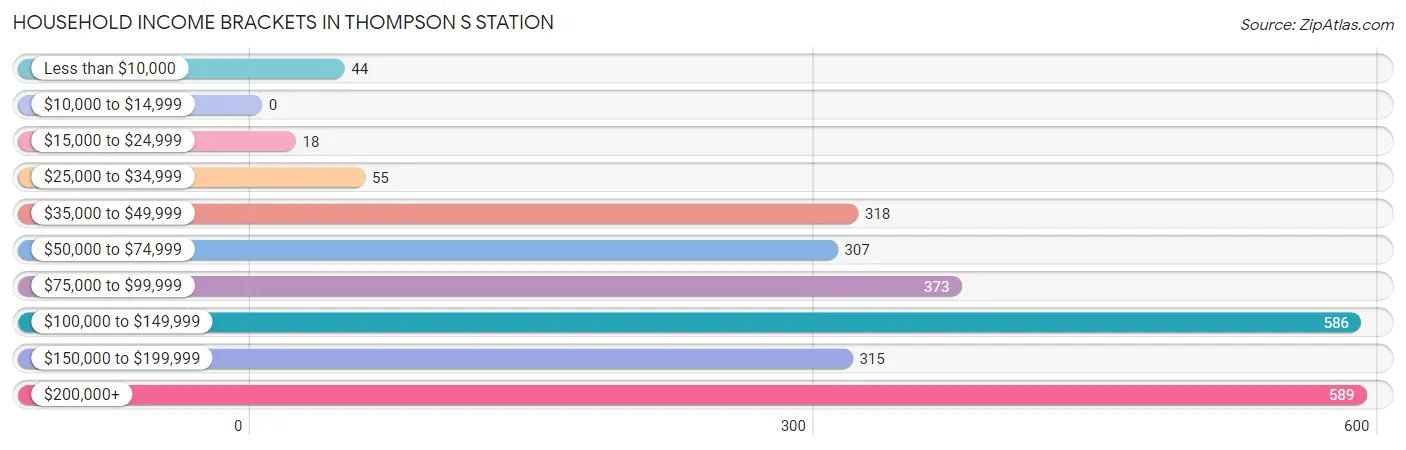
Household Income Brackets in Thompson s Station
With 589 households falling in the category, the $200,000+ income range is the most frequent in Thompson s Station, accounting for 22.6% of all households.
| Income Bracket | # Households | % Households |
| Less than $10,000 | 44 | 1.7% |
| $10,000 to $14,999 | 0 | 0.0% |
| $15,000 to $24,999 | 18 | 0.7% |
| $25,000 to $34,999 | 55 | 2.1% |
| $35,000 to $49,999 | 318 | 12.2% |
| $50,000 to $74,999 | 307 | 11.8% |
| $75,000 to $99,999 | 373 | 14.3% |
| $100,000 to $149,999 | 586 | 22.5% |
| $150,000 to $199,999 | 315 | 12.1% |
| $200,000+ | 589 | 22.6% |
Household Income by Householder Age in Thompson s Station
The median household income in Thompson s Station is $116,569, with the highest median household income of $146,463 found in the 25 to 44 years age bracket for the primary householder. A total of 781 households (30.0%) fall into this category. Meanwhile, the 15 to 24 years age bracket for the primary householder has the lowest median household income of $51,781, with 145 households (5.6%) in this group.
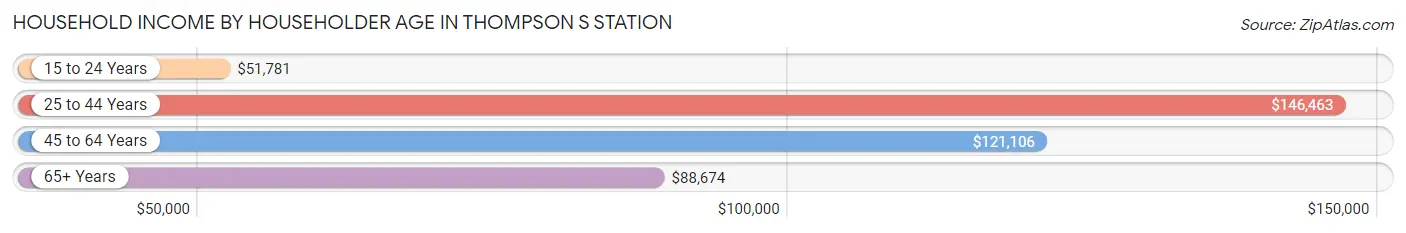
| Income Bracket | # Households | Median Income |
| 15 to 24 Years | 145 (5.6%) | $51,781 |
| 25 to 44 Years | 781 (30.0%) | $146,463 |
| 45 to 64 Years | 1,116 (42.8%) | $121,106 |
| 65+ Years | 563 (21.6%) | $88,674 |
| Total | 2,605 (100.0%) | $116,569 |
Poverty in Thompson s Station
Income Below Poverty by Sex and Age in Thompson s Station
With 6.1% poverty level for males and 0.4% for females among the residents of Thompson s Station, 45 to 54 year old males and 65 to 74 year old females are the most vulnerable to poverty, with 206 males (32.1%) and 15 females (5.5%) in their respective age groups living below the poverty level.
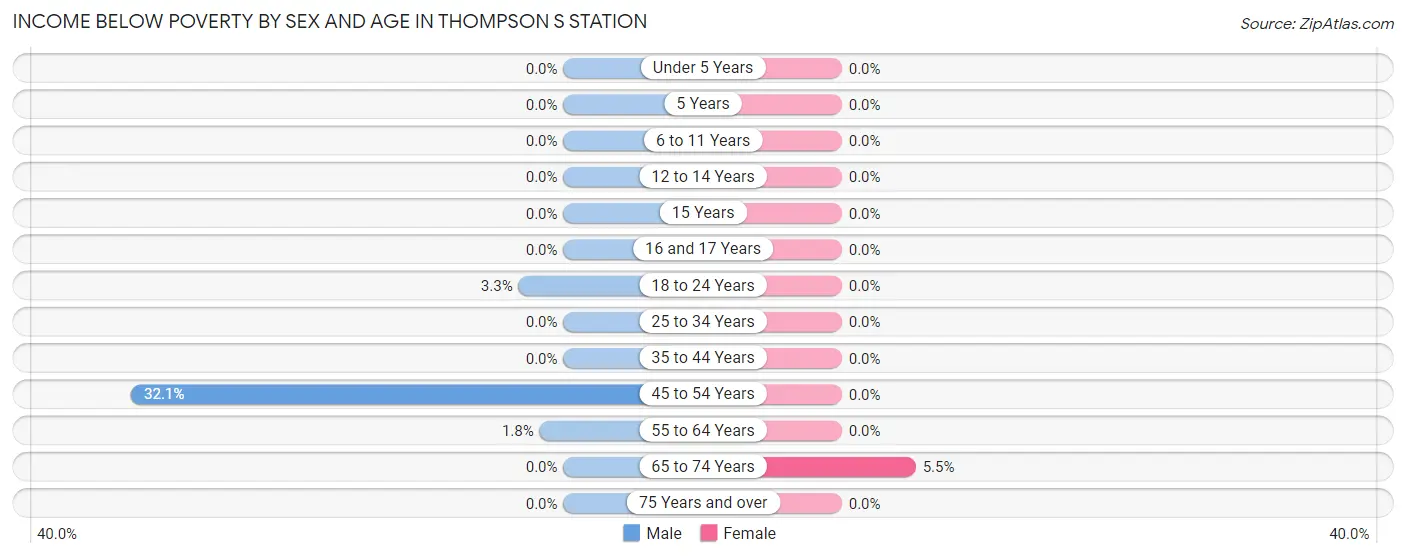
| Age Bracket | Male | Female |
| Under 5 Years | 0 (0.0%) | 0 (0.0%) |
| 5 Years | 0 (0.0%) | 0 (0.0%) |
| 6 to 11 Years | 0 (0.0%) | 0 (0.0%) |
| 12 to 14 Years | 0 (0.0%) | 0 (0.0%) |
| 15 Years | 0 (0.0%) | 0 (0.0%) |
| 16 and 17 Years | 0 (0.0%) | 0 (0.0%) |
| 18 to 24 Years | 27 (3.3%) | 0 (0.0%) |
| 25 to 34 Years | 0 (0.0%) | 0 (0.0%) |
| 35 to 44 Years | 0 (0.0%) | 0 (0.0%) |
| 45 to 54 Years | 206 (32.1%) | 0 (0.0%) |
| 55 to 64 Years | 7 (1.8%) | 0 (0.0%) |
| 65 to 74 Years | 0 (0.0%) | 15 (5.5%) |
| 75 Years and over | 0 (0.0%) | 0 (0.0%) |
| Total | 240 (6.1%) | 15 (0.4%) |
Income Above Poverty by Sex and Age in Thompson s Station
According to the poverty statistics in Thompson s Station, males aged under 5 years and females aged under 5 years are the age groups that are most secure financially, with 100.0% of males and 100.0% of females in these age groups living above the poverty line.
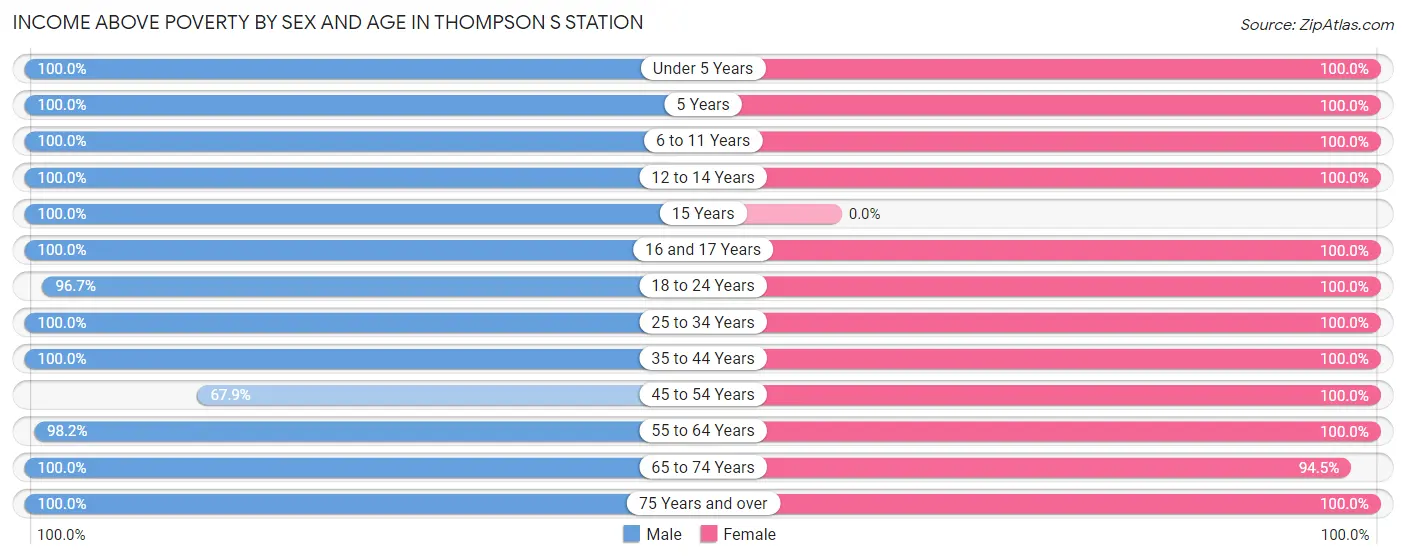
| Age Bracket | Male | Female |
| Under 5 Years | 222 (100.0%) | 307 (100.0%) |
| 5 Years | 13 (100.0%) | 68 (100.0%) |
| 6 to 11 Years | 292 (100.0%) | 372 (100.0%) |
| 12 to 14 Years | 163 (100.0%) | 220 (100.0%) |
| 15 Years | 38 (100.0%) | 0 (0.0%) |
| 16 and 17 Years | 151 (100.0%) | 114 (100.0%) |
| 18 to 24 Years | 785 (96.7%) | 194 (100.0%) |
| 25 to 34 Years | 217 (100.0%) | 339 (100.0%) |
| 35 to 44 Years | 577 (100.0%) | 476 (100.0%) |
| 45 to 54 Years | 436 (67.9%) | 495 (100.0%) |
| 55 to 64 Years | 388 (98.2%) | 488 (100.0%) |
| 65 to 74 Years | 313 (100.0%) | 258 (94.5%) |
| 75 Years and over | 110 (100.0%) | 121 (100.0%) |
| Total | 3,705 (93.9%) | 3,452 (99.6%) |
Income Below Poverty Among Married-Couple Families in Thompson s Station
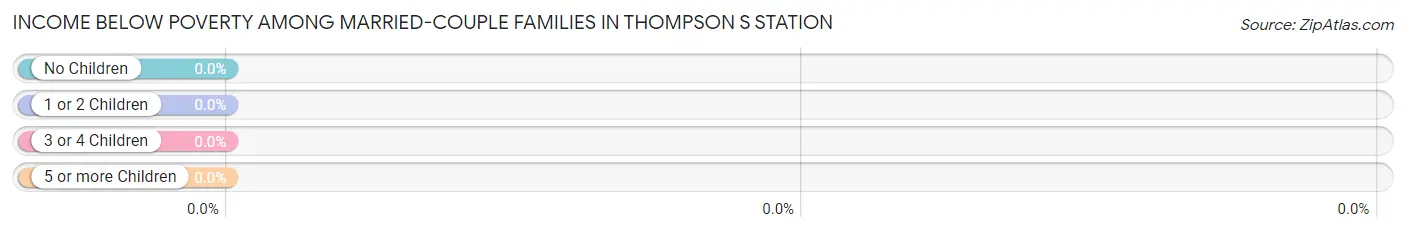
| Children | Above Poverty | Below Poverty |
| No Children | 766 (100.0%) | 0 (0.0%) |
| 1 or 2 Children | 607 (100.0%) | 0 (0.0%) |
| 3 or 4 Children | 225 (100.0%) | 0 (0.0%) |
| 5 or more Children | 0 (0.0%) | 0 (0.0%) |
| Total | 1,598 (100.0%) | 0 (0.0%) |
Income Below Poverty Among Single-Parent Households in Thompson s Station
| Children | Single Father | Single Mother |
| No Children | 0 (0.0%) | 0 (0.0%) |
| 1 or 2 Children | 0 (0.0%) | 0 (0.0%) |
| 3 or 4 Children | 0 (0.0%) | 0 (0.0%) |
| 5 or more Children | 0 (0.0%) | 0 (0.0%) |
| Total | 0 (0.0%) | 0 (0.0%) |
Income Below Poverty Among Married-Couple vs Single-Parent Households in Thompson s Station
| Children | Married-Couple Families | Single-Parent Households |
| No Children | 0 (0.0%) | 0 (0.0%) |
| 1 or 2 Children | 0 (0.0%) | 0 (0.0%) |
| 3 or 4 Children | 0 (0.0%) | 0 (0.0%) |
| 5 or more Children | 0 (0.0%) | 0 (0.0%) |
| Total | 0 (0.0%) | 0 (0.0%) |
Race in Thompson s Station
The most populous races in Thompson s Station are White / Caucasian (6,193 | 83.4%), Two or more Races (891 | 12.0%), and Asian (332 | 4.5%).
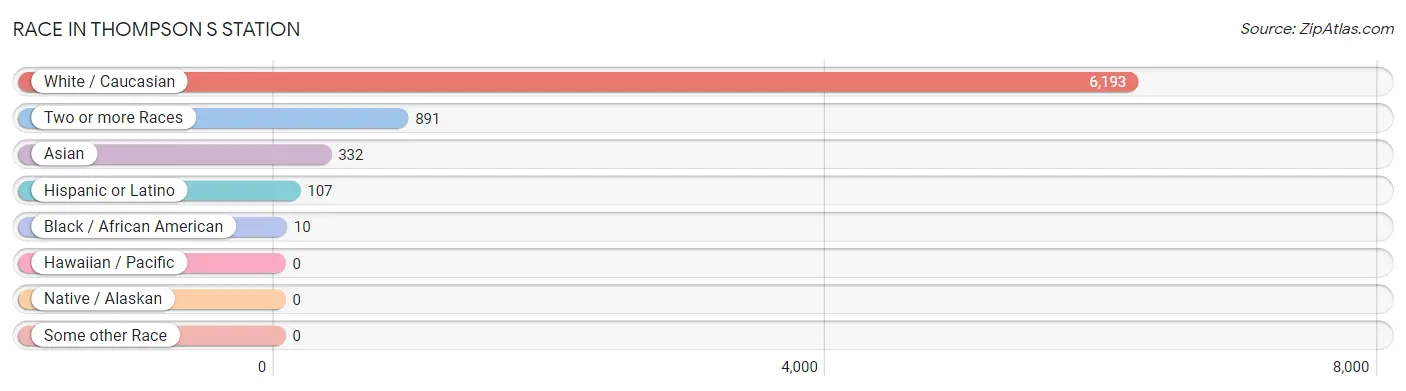
| Race | # Population | % Population |
| Asian | 332 | 4.5% |
| Black / African American | 10 | 0.1% |
| Hawaiian / Pacific | 0 | 0.0% |
| Hispanic or Latino | 107 | 1.4% |
| Native / Alaskan | 0 | 0.0% |
| White / Caucasian | 6,193 | 83.4% |
| Two or more Races | 891 | 12.0% |
| Some other Race | 0 | 0.0% |
| Total | 7,426 | 100.0% |
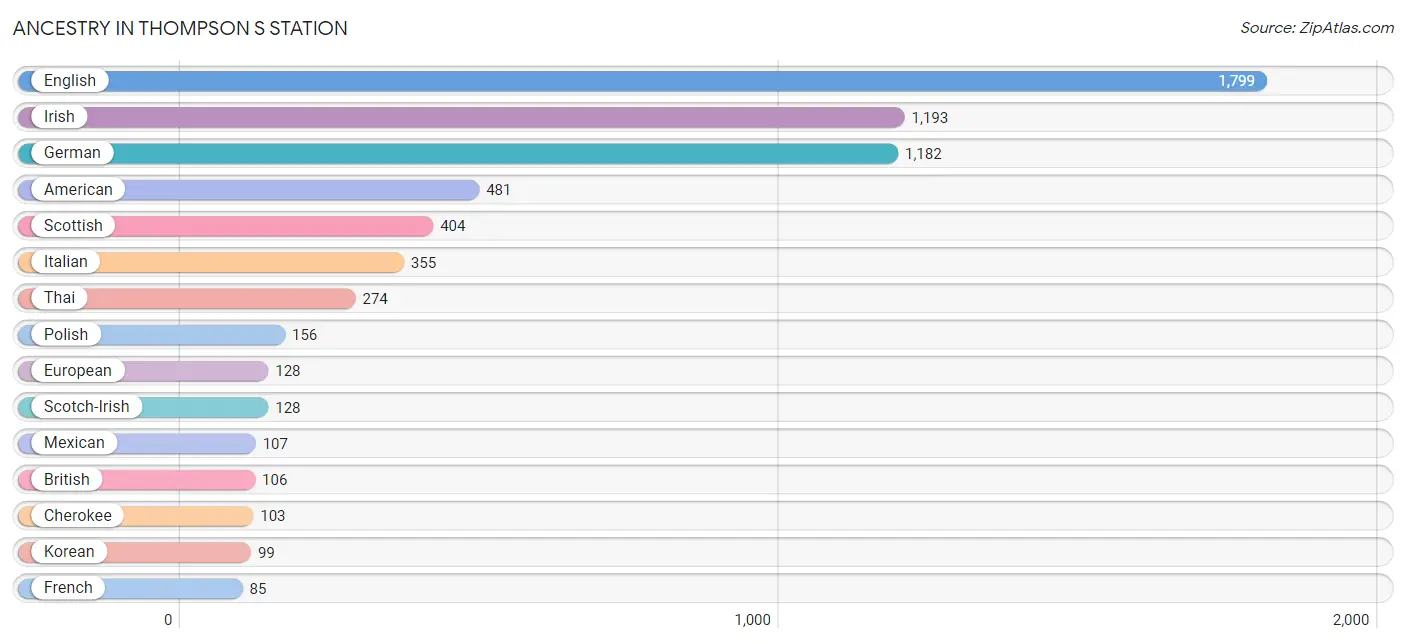
Ancestry in Thompson s Station
The most populous ancestries reported in Thompson s Station are English (1,799 | 24.2%), Irish (1,193 | 16.1%), German (1,182 | 15.9%), American (481 | 6.5%), and Scottish (404 | 5.4%), together accounting for 68.1% of all Thompson s Station residents.
| Ancestry | # Population | % Population |
| American | 481 | 6.5% |
| Austrian | 43 | 0.6% |
| Bhutanese | 14 | 0.2% |
| Blackfeet | 19 | 0.3% |
| British | 106 | 1.4% |
| Cherokee | 103 | 1.4% |
| Croatian | 48 | 0.6% |
| Czech | 16 | 0.2% |
| English | 1,799 | 24.2% |
| European | 128 | 1.7% |
| French | 85 | 1.1% |
| German | 1,182 | 15.9% |
| Hungarian | 1 | 0.0% |
| Irish | 1,193 | 16.1% |
| Italian | 355 | 4.8% |
| Korean | 99 | 1.3% |
| Latvian | 28 | 0.4% |
| Mexican | 107 | 1.4% |
| Polish | 156 | 2.1% |
| Russian | 42 | 0.6% |
| Scotch-Irish | 128 | 1.7% |
| Scottish | 404 | 5.4% |
| Slovak | 73 | 1.0% |
| Swedish | 28 | 0.4% |
| Thai | 274 | 3.7% |
| Welsh | 45 | 0.6% | View All 26 Rows |
Immigrants in Thompson s Station
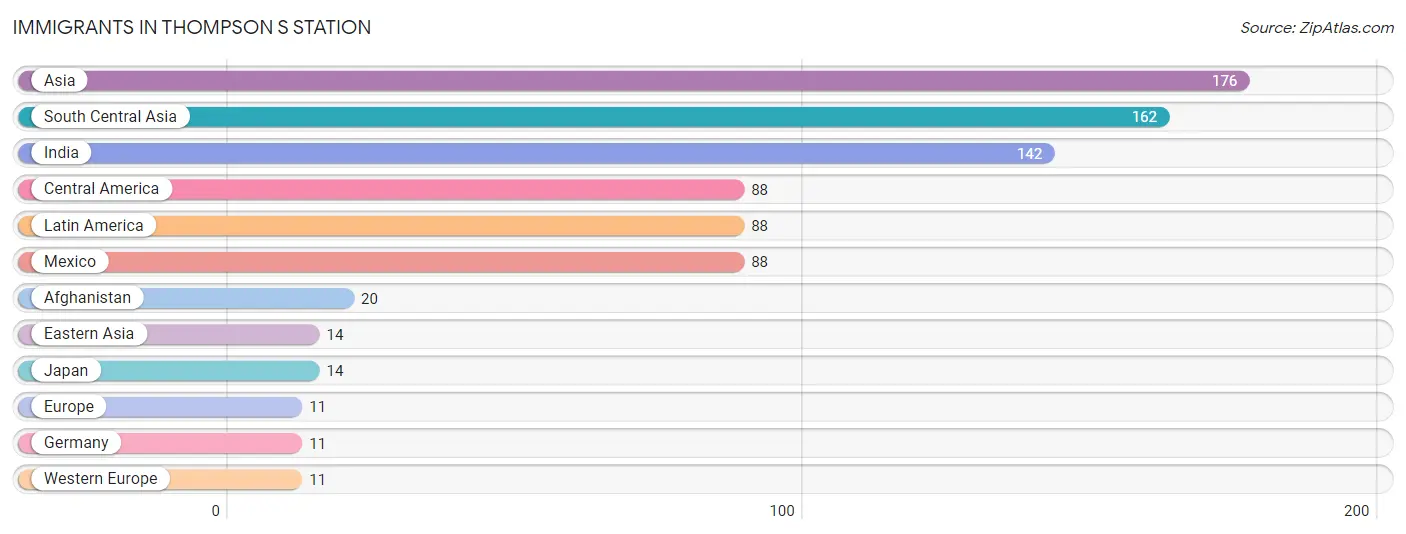
The most numerous immigrant groups reported in Thompson s Station came from Asia (176 | 2.4%), South Central Asia (162 | 2.2%), India (142 | 1.9%), Central America (88 | 1.2%), and Latin America (88 | 1.2%), together accounting for 8.8% of all Thompson s Station residents.
| Immigration Origin | # Population | % Population |
| Afghanistan | 20 | 0.3% |
| Asia | 176 | 2.4% |
| Central America | 88 | 1.2% |
| Eastern Asia | 14 | 0.2% |
| Europe | 11 | 0.2% |
| Germany | 11 | 0.2% |
| India | 142 | 1.9% |
| Japan | 14 | 0.2% |
| Latin America | 88 | 1.2% |
| Mexico | 88 | 1.2% |
| South Central Asia | 162 | 2.2% |
| Western Europe | 11 | 0.2% | View All 12 Rows |
Sex and Age in Thompson s Station
Sex and Age in Thompson s Station
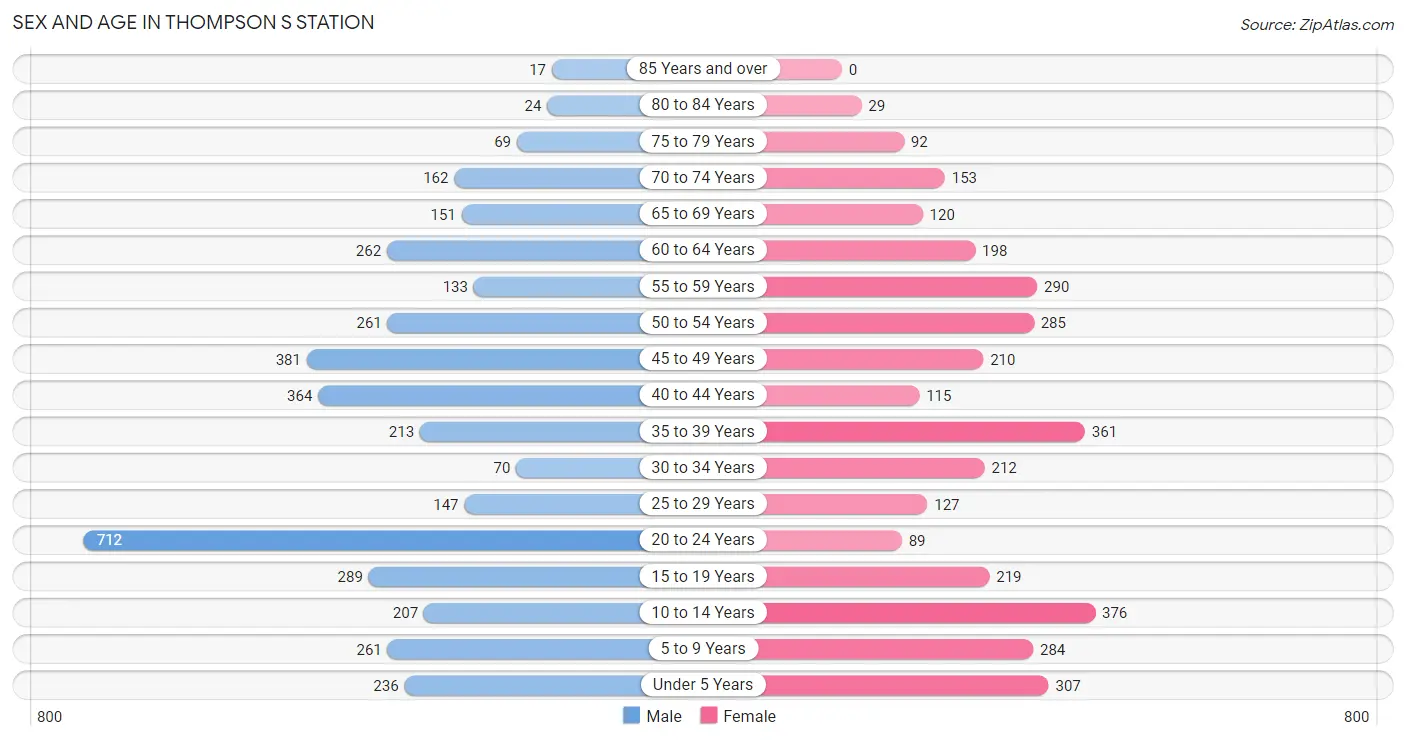
The most populous age groups in Thompson s Station are 20 to 24 Years (712 | 18.0%) for men and 10 to 14 Years (376 | 10.8%) for women.
| Age Bracket | Male | Female |
| Under 5 Years | 236 (6.0%) | 307 (8.8%) |
| 5 to 9 Years | 261 (6.6%) | 284 (8.2%) |
| 10 to 14 Years | 207 (5.2%) | 376 (10.8%) |
| 15 to 19 Years | 289 (7.3%) | 219 (6.3%) |
| 20 to 24 Years | 712 (18.0%) | 89 (2.6%) |
| 25 to 29 Years | 147 (3.7%) | 127 (3.7%) |
| 30 to 34 Years | 70 (1.8%) | 212 (6.1%) |
| 35 to 39 Years | 213 (5.4%) | 361 (10.4%) |
| 40 to 44 Years | 364 (9.2%) | 115 (3.3%) |
| 45 to 49 Years | 381 (9.6%) | 210 (6.1%) |
| 50 to 54 Years | 261 (6.6%) | 285 (8.2%) |
| 55 to 59 Years | 133 (3.4%) | 290 (8.4%) |
| 60 to 64 Years | 262 (6.6%) | 198 (5.7%) |
| 65 to 69 Years | 151 (3.8%) | 120 (3.5%) |
| 70 to 74 Years | 162 (4.1%) | 153 (4.4%) |
| 75 to 79 Years | 69 (1.7%) | 92 (2.6%) |
| 80 to 84 Years | 24 (0.6%) | 29 (0.8%) |
| 85 Years and over | 17 (0.4%) | 0 (0.0%) |
| Total | 3,959 (100.0%) | 3,467 (100.0%) |
Families and Households in Thompson s Station
Median Family Size in Thompson s Station
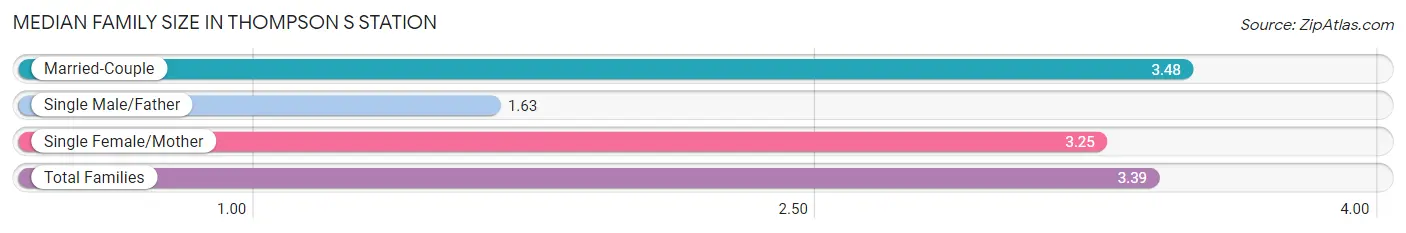
The median family size in Thompson s Station is 3.39 persons per family, with married-couple families (1,598 | 88.1%) accounting for the largest median family size of 3.48 persons per family. On the other hand, single male/father families (71 | 3.9%) represent the smallest median family size with 1.63 persons per family.
| Family Type | # Families | Family Size |
| Married-Couple | 1,598 (88.1%) | 3.48 |
| Single Male/Father | 71 (3.9%) | 1.63 |
| Single Female/Mother | 144 (7.9%) | 3.25 |
| Total Families | 1,813 (100.0%) | 3.39 |
Median Household Size in Thompson s Station
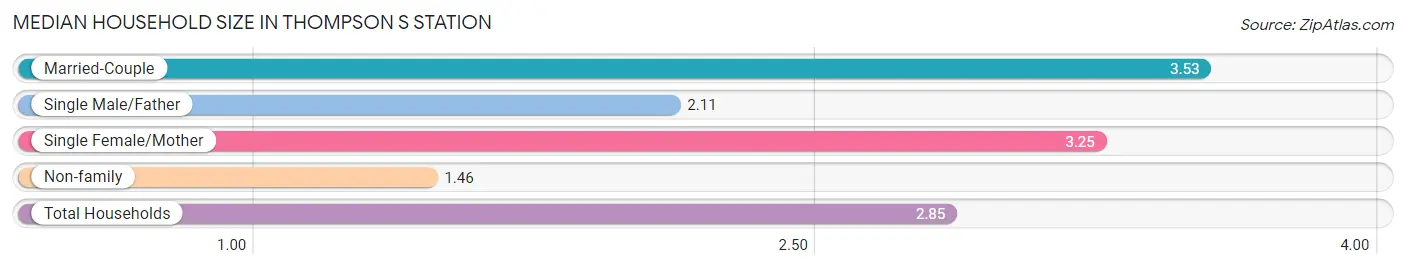
The median household size in Thompson s Station is 2.85 persons per household, with married-couple households (1,598 | 61.3%) accounting for the largest median household size of 3.53 persons per household. non-family households (792 | 30.4%) represent the smallest median household size with 1.46 persons per household.
| Household Type | # Households | Household Size |
| Married-Couple | 1,598 (61.3%) | 3.53 |
| Single Male/Father | 71 (2.7%) | 2.11 |
| Single Female/Mother | 144 (5.5%) | 3.25 |
| Non-family | 792 (30.4%) | 1.46 |
| Total Households | 2,605 (100.0%) | 2.85 |
Household Size by Marriage Status in Thompson s Station
Out of a total of 2,605 households in Thompson s Station, 1,813 (69.6%) are family households, while 792 (30.4%) are nonfamily households. The most numerous type of family households are 2-person households, comprising 753, and the most common type of nonfamily households are 1-person households, comprising 586.
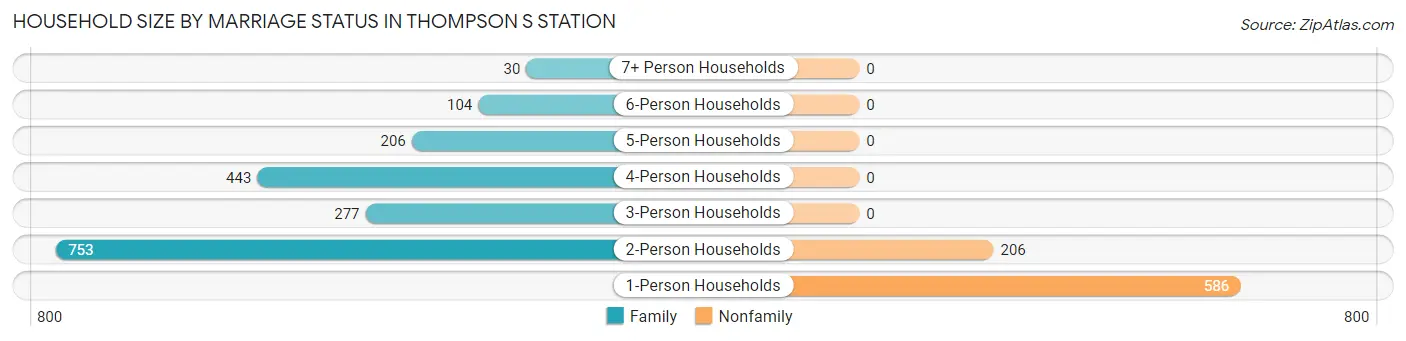
| Household Size | Family Households | Nonfamily Households |
| 1-Person Households | - | 586 (22.5%) |
| 2-Person Households | 753 (28.9%) | 206 (7.9%) |
| 3-Person Households | 277 (10.6%) | 0 (0.0%) |
| 4-Person Households | 443 (17.0%) | 0 (0.0%) |
| 5-Person Households | 206 (7.9%) | 0 (0.0%) |
| 6-Person Households | 104 (4.0%) | 0 (0.0%) |
| 7+ Person Households | 30 (1.1%) | 0 (0.0%) |
| Total | 1,813 (69.6%) | 792 (30.4%) |
Female Fertility in Thompson s Station
Fertility by Age in Thompson s Station
Average fertility rate in Thompson s Station is 26.0 births per 1,000 women. Women in the age bracket of 35 to 50 years have the highest fertility rate with 50.0 births per 1,000 women. Women in the age bracket of 35 to 50 years acount for 100.0% of all women with births.
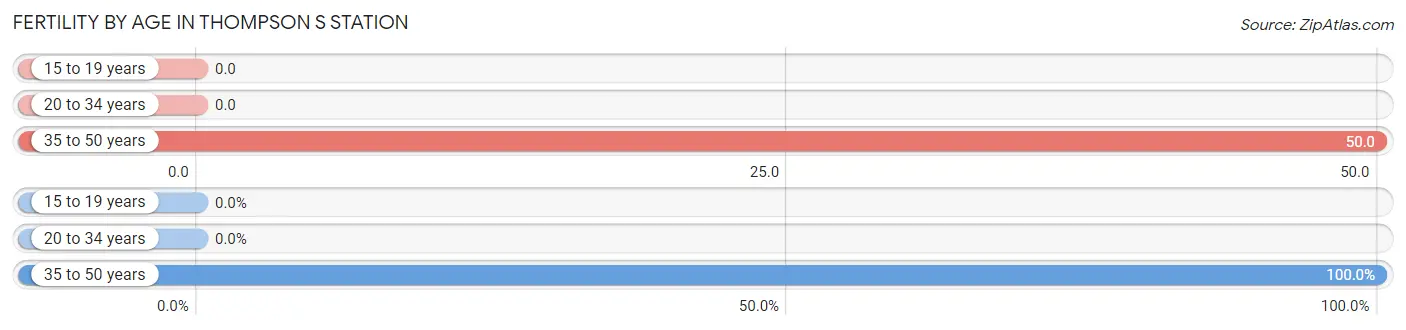
| Age Bracket | Women with Births | Births / 1,000 Women |
| 15 to 19 years | 0 (0.0%) | 0.0 |
| 20 to 34 years | 0 (0.0%) | 0.0 |
| 35 to 50 years | 36 (100.0%) | 50.0 |
| Total | 36 (100.0%) | 26.0 |
Fertility by Age by Marriage Status in Thompson s Station
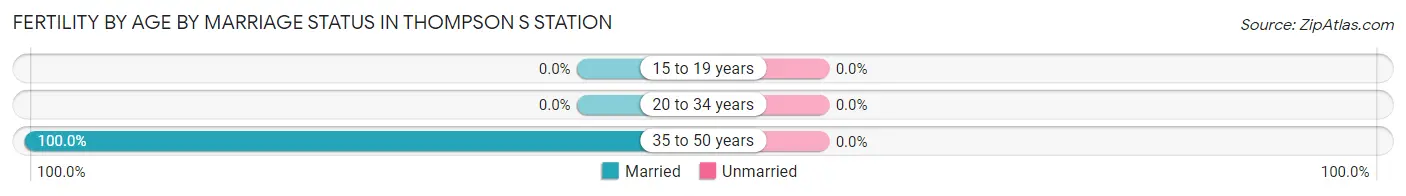
| Age Bracket | Married | Unmarried |
| 15 to 19 years | 0 (0.0%) | 0 (0.0%) |
| 20 to 34 years | 0 (0.0%) | 0 (0.0%) |
| 35 to 50 years | 36 (100.0%) | 0 (0.0%) |
| Total | 36 (100.0%) | 0 (0.0%) |
Fertility by Education in Thompson s Station
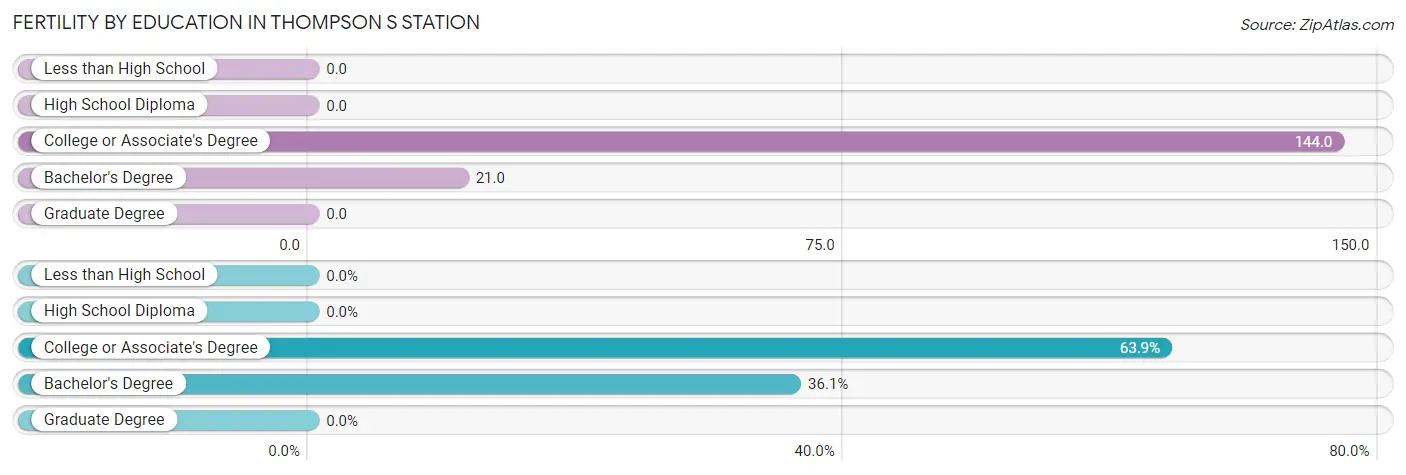
| Educational Attainment | Women with Births | Births / 1,000 Women |
| Less than High School | 0 (0.0%) | 0.0 |
| High School Diploma | 0 (0.0%) | 0.0 |
| College or Associate's Degree | 23 (63.9%) | 144.0 |
| Bachelor's Degree | 13 (36.1%) | 21.0 |
| Graduate Degree | 0 (0.0%) | 0.0 |
| Total | 36 (100.0%) | 26.0 |
Fertility by Education by Marriage Status in Thompson s Station
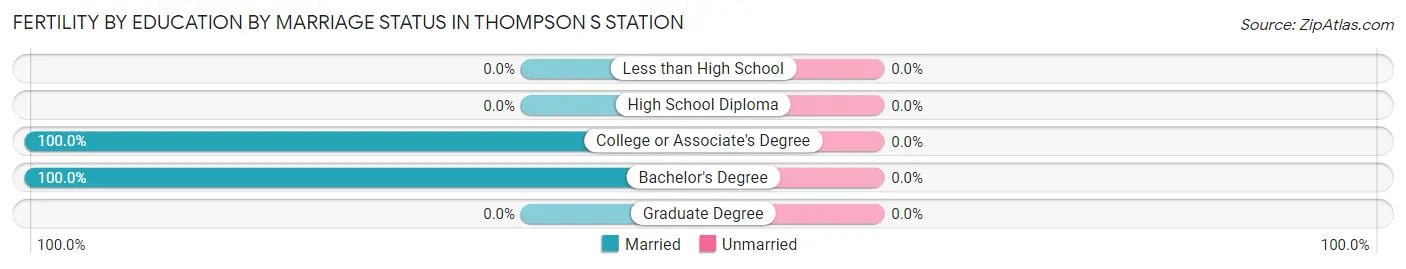
| Educational Attainment | Married | Unmarried |
| Less than High School | 0 (0.0%) | 0 (0.0%) |
| High School Diploma | 0 (0.0%) | 0 (0.0%) |
| College or Associate's Degree | 23 (100.0%) | 0 (0.0%) |
| Bachelor's Degree | 13 (100.0%) | 0 (0.0%) |
| Graduate Degree | 0 (0.0%) | 0 (0.0%) |
| Total | 36 (100.0%) | 0 (0.0%) |
Employment Characteristics in Thompson s Station
Employment by Class of Employer in Thompson s Station
Among the 3,780 employed individuals in Thompson s Station, private company employees (3,032 | 80.2%), local government employees (253 | 6.7%), and self-employed (not incorporated) (194 | 5.1%) make up the most common classes of employment.
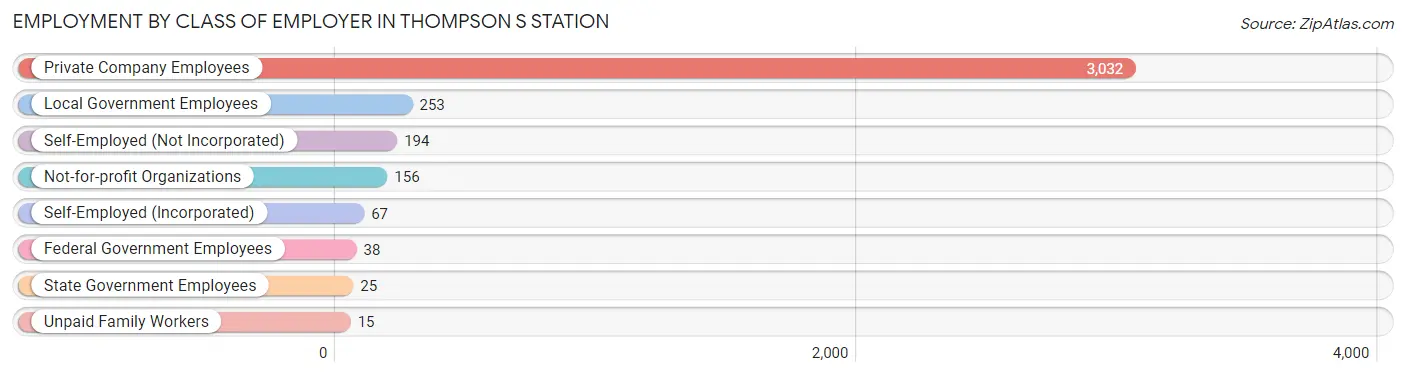
| Employer Class | # Employees | % Employees |
| Private Company Employees | 3,032 | 80.2% |
| Self-Employed (Incorporated) | 67 | 1.8% |
| Self-Employed (Not Incorporated) | 194 | 5.1% |
| Not-for-profit Organizations | 156 | 4.1% |
| Local Government Employees | 253 | 6.7% |
| State Government Employees | 25 | 0.7% |
| Federal Government Employees | 38 | 1.0% |
| Unpaid Family Workers | 15 | 0.4% |
| Total | 3,780 | 100.0% |
Employment Status by Age in Thompson s Station
According to the labor force statistics for Thompson s Station, out of the total population over 16 years of age (5,717), 70.8% or 4,048 individuals are in the labor force, with 5.1% or 206 of them unemployed. The age group with the highest labor force participation rate is 30 to 34 years, with 96.8% or 273 individuals in the labor force. Within the labor force, the 20 to 24 years age range has the highest percentage of unemployed individuals, with 21.8% or 164 of them being unemployed.
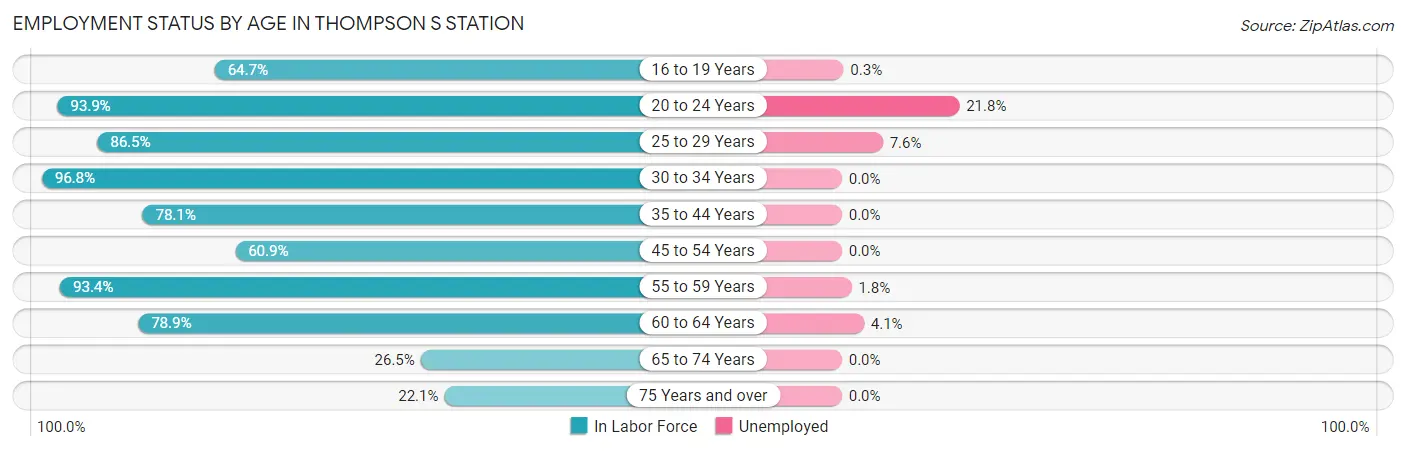
| Age Bracket | In Labor Force | Unemployed |
| 16 to 19 Years | 304 (64.7%) | 1 (0.3%) |
| 20 to 24 Years | 752 (93.9%) | 164 (21.8%) |
| 25 to 29 Years | 237 (86.5%) | 18 (7.6%) |
| 30 to 34 Years | 273 (96.8%) | 0 (0.0%) |
| 35 to 44 Years | 822 (78.1%) | 0 (0.0%) |
| 45 to 54 Years | 692 (60.9%) | 0 (0.0%) |
| 55 to 59 Years | 395 (93.4%) | 7 (1.8%) |
| 60 to 64 Years | 363 (78.9%) | 15 (4.1%) |
| 65 to 74 Years | 155 (26.5%) | 0 (0.0%) |
| 75 Years and over | 51 (22.1%) | 0 (0.0%) |
| Total | 4,048 (70.8%) | 206 (5.1%) |
Employment Status by Educational Attainment in Thompson s Station
According to labor force statistics for Thompson s Station, 76.7% of individuals (2,783) out of the total population between 25 and 64 years of age (3,629) are in the labor force, with 1.4% or 39 of them being unemployed. The group with the highest labor force participation rate are those with the educational attainment of college / associate degree, with 93.3% or 435 individuals in the labor force. Within the labor force, individuals with college / associate degree education have the highest percentage of unemployment, with 5.1% or 22 of them being unemployed.
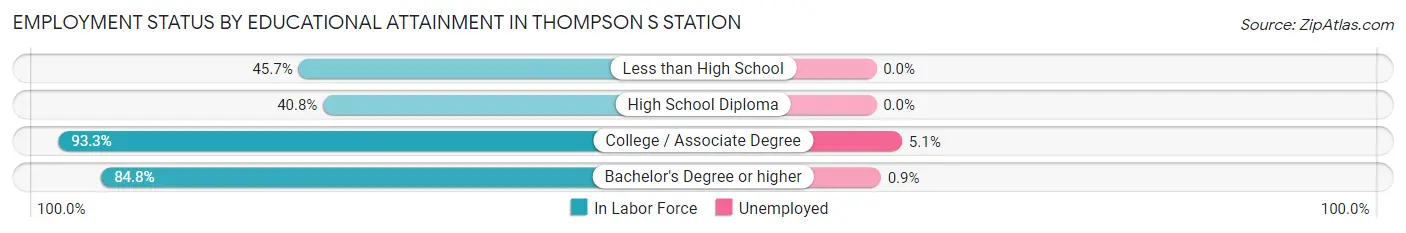
| Educational Attainment | In Labor Force | Unemployed |
| Less than High School | 69 (45.7%) | 0 (0.0%) |
| High School Diploma | 255 (40.8%) | 0 (0.0%) |
| College / Associate Degree | 435 (93.3%) | 24 (5.1%) |
| Bachelor's Degree or higher | 2,024 (84.8%) | 21 (0.9%) |
| Total | 2,783 (76.7%) | 51 (1.4%) |
Employment Occupations by Sex in Thompson s Station
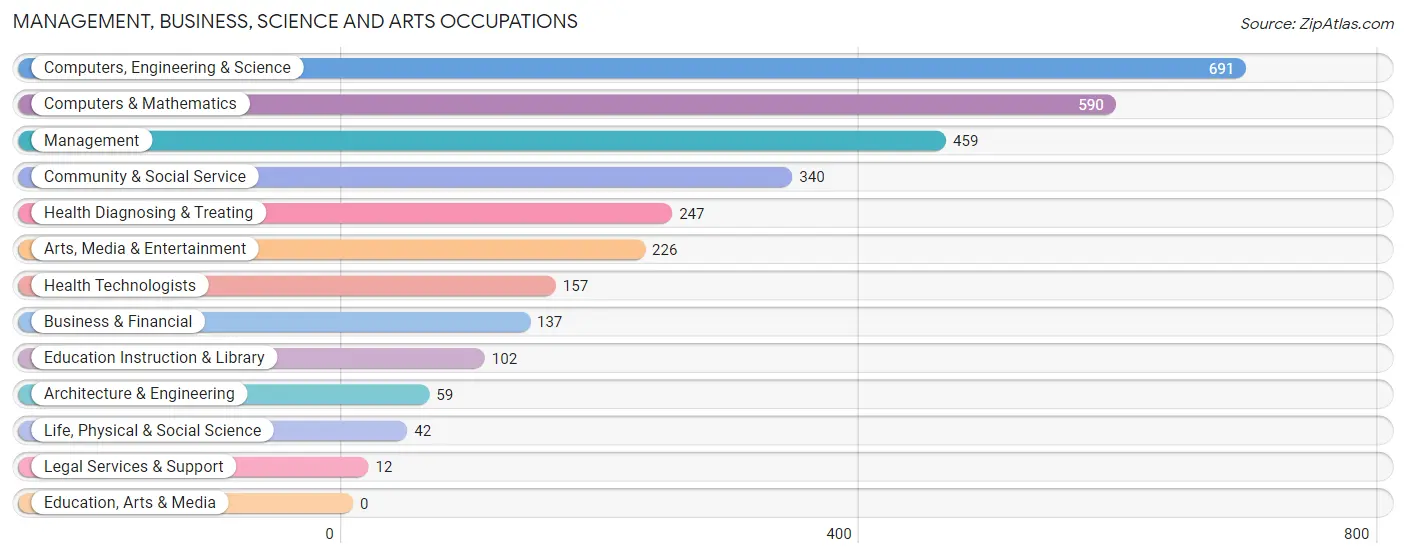
Management, Business, Science and Arts Occupations
The most common Management, Business, Science and Arts occupations in Thompson s Station are Computers, Engineering & Science (691 | 18.0%), Computers & Mathematics (590 | 15.4%), Management (459 | 11.9%), Community & Social Service (340 | 8.8%), and Health Diagnosing & Treating (247 | 6.4%).
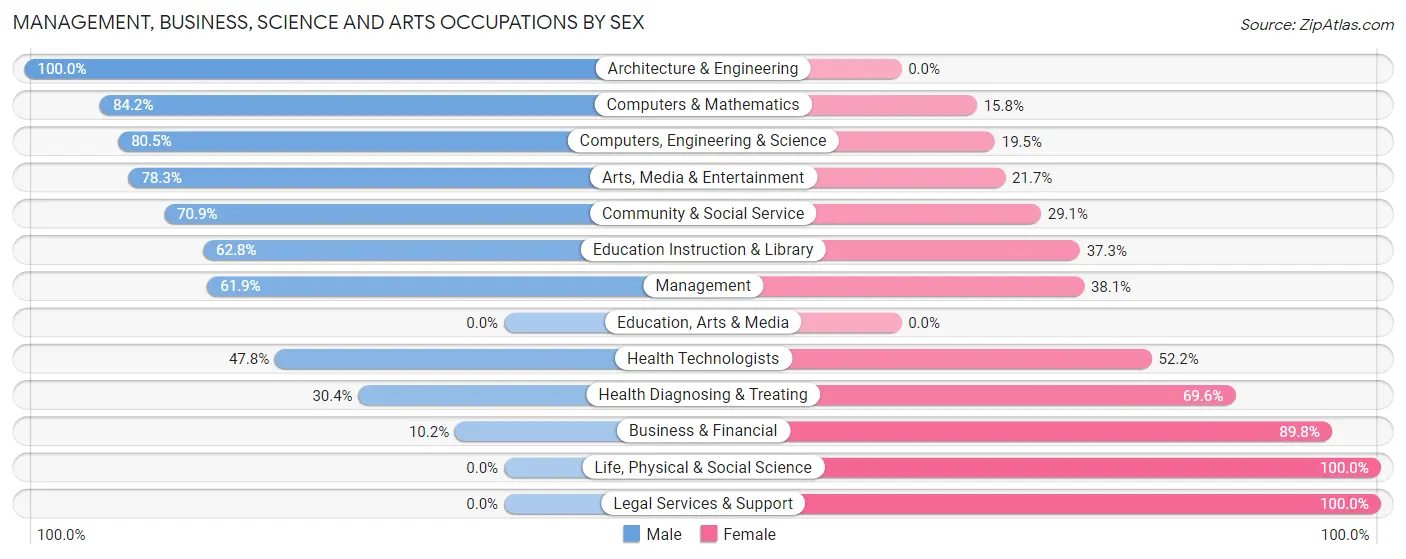
Management, Business, Science and Arts Occupations by Sex
Within the Management, Business, Science and Arts occupations in Thompson s Station, the most male-oriented occupations are Architecture & Engineering (100.0%), Computers & Mathematics (84.2%), and Computers, Engineering & Science (80.5%), while the most female-oriented occupations are Life, Physical & Social Science (100.0%), Legal Services & Support (100.0%), and Business & Financial (89.8%).
| Occupation | Male | Female |
| Management | 284 (61.9%) | 175 (38.1%) |
| Business & Financial | 14 (10.2%) | 123 (89.8%) |
| Computers, Engineering & Science | 556 (80.5%) | 135 (19.5%) |
| Computers & Mathematics | 497 (84.2%) | 93 (15.8%) |
| Architecture & Engineering | 59 (100.0%) | 0 (0.0%) |
| Life, Physical & Social Science | 0 (0.0%) | 42 (100.0%) |
| Community & Social Service | 241 (70.9%) | 99 (29.1%) |
| Education, Arts & Media | 0 (0.0%) | 0 (0.0%) |
| Legal Services & Support | 0 (0.0%) | 12 (100.0%) |
| Education Instruction & Library | 64 (62.7%) | 38 (37.2%) |
| Arts, Media & Entertainment | 177 (78.3%) | 49 (21.7%) |
| Health Diagnosing & Treating | 75 (30.4%) | 172 (69.6%) |
| Health Technologists | 75 (47.8%) | 82 (52.2%) |
| Total (Category) | 1,170 (62.4%) | 704 (37.6%) |
| Total (Overall) | 2,201 (57.3%) | 1,639 (42.7%) |
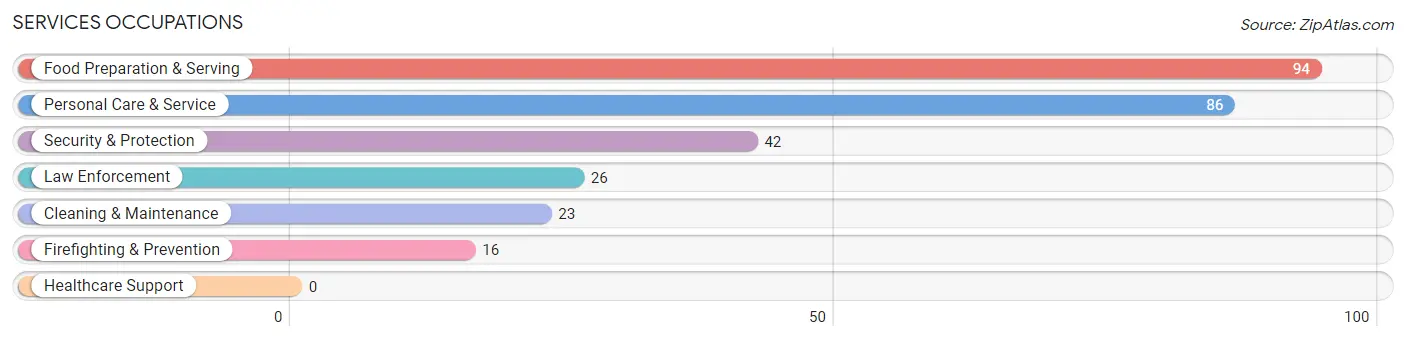
Services Occupations
The most common Services occupations in Thompson s Station are Food Preparation & Serving (94 | 2.5%), Personal Care & Service (86 | 2.2%), Security & Protection (42 | 1.1%), Law Enforcement (26 | 0.7%), and Cleaning & Maintenance (23 | 0.6%).
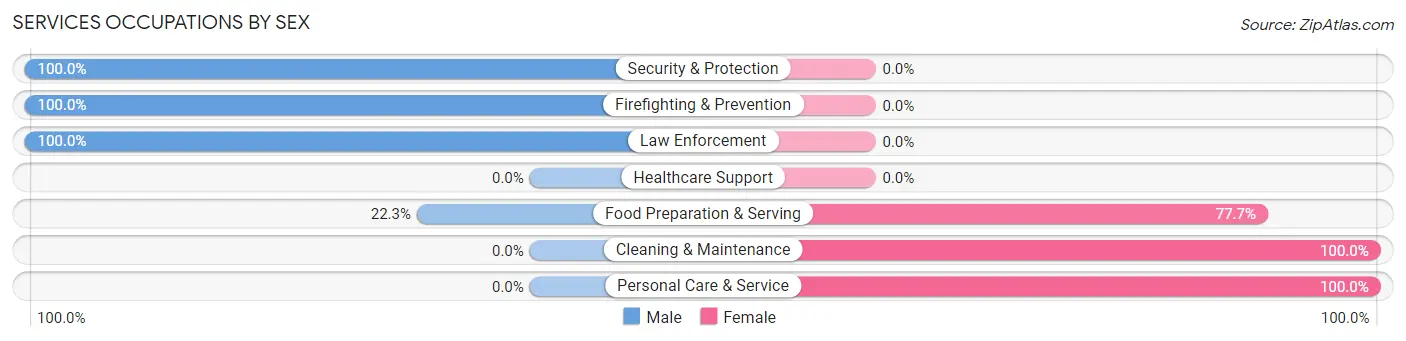
Services Occupations by Sex
Within the Services occupations in Thompson s Station, the most male-oriented occupations are Security & Protection (100.0%), Firefighting & Prevention (100.0%), and Law Enforcement (100.0%), while the most female-oriented occupations are Cleaning & Maintenance (100.0%), Personal Care & Service (100.0%), and Food Preparation & Serving (77.7%).
| Occupation | Male | Female |
| Healthcare Support | 0 (0.0%) | 0 (0.0%) |
| Security & Protection | 42 (100.0%) | 0 (0.0%) |
| Firefighting & Prevention | 16 (100.0%) | 0 (0.0%) |
| Law Enforcement | 26 (100.0%) | 0 (0.0%) |
| Food Preparation & Serving | 21 (22.3%) | 73 (77.7%) |
| Cleaning & Maintenance | 0 (0.0%) | 23 (100.0%) |
| Personal Care & Service | 0 (0.0%) | 86 (100.0%) |
| Total (Category) | 63 (25.7%) | 182 (74.3%) |
| Total (Overall) | 2,201 (57.3%) | 1,639 (42.7%) |
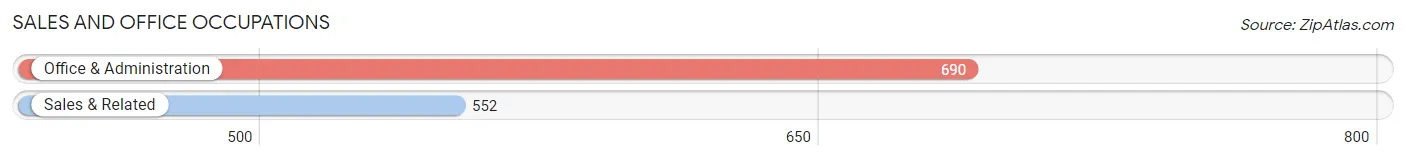
Sales and Office Occupations
The most common Sales and Office occupations in Thompson s Station are Office & Administration (690 | 18.0%), and Sales & Related (552 | 14.4%).
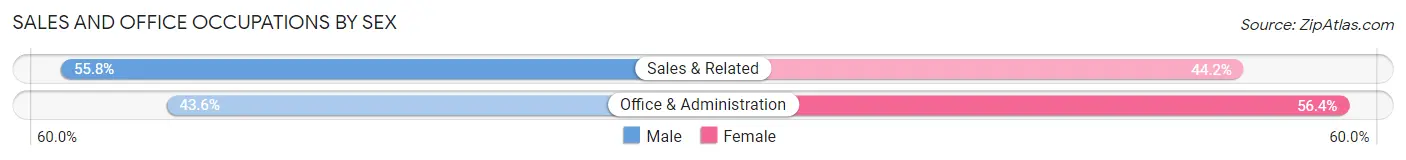
Sales and Office Occupations by Sex
| Occupation | Male | Female |
| Sales & Related | 308 (55.8%) | 244 (44.2%) |
| Office & Administration | 301 (43.6%) | 389 (56.4%) |
| Total (Category) | 609 (49.0%) | 633 (51.0%) |
| Total (Overall) | 2,201 (57.3%) | 1,639 (42.7%) |
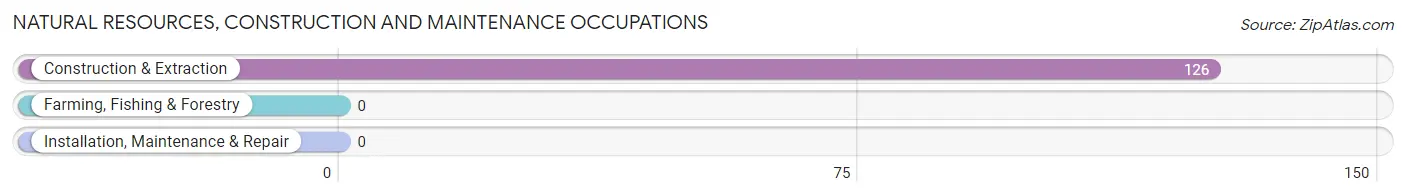
Natural Resources, Construction and Maintenance Occupations
The most common Natural Resources, Construction and Maintenance occupations in Thompson s Station are , and Construction & Extraction (126 | 3.3%).
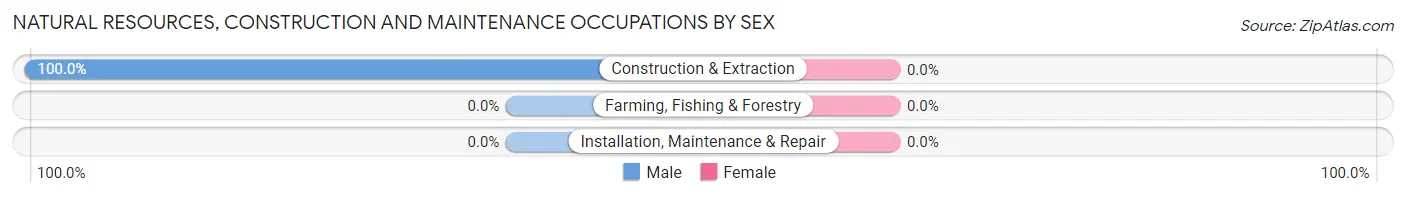
Natural Resources, Construction and Maintenance Occupations by Sex
| Occupation | Male | Female |
| Farming, Fishing & Forestry | 0 (0.0%) | 0 (0.0%) |
| Construction & Extraction | 126 (100.0%) | 0 (0.0%) |
| Installation, Maintenance & Repair | 0 (0.0%) | 0 (0.0%) |
| Total (Category) | 126 (100.0%) | 0 (0.0%) |
| Total (Overall) | 2,201 (57.3%) | 1,639 (42.7%) |
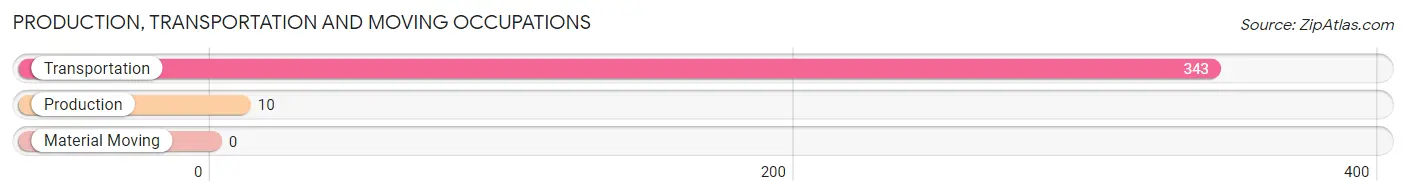
Production, Transportation and Moving Occupations
The most common Production, Transportation and Moving occupations in Thompson s Station are Transportation (343 | 8.9%), and Production (10 | 0.3%).
Production, Transportation and Moving Occupations by Sex
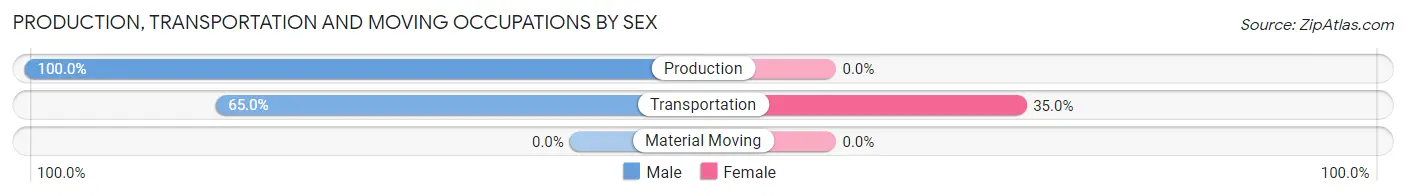
| Occupation | Male | Female |
| Production | 10 (100.0%) | 0 (0.0%) |
| Transportation | 223 (65.0%) | 120 (35.0%) |
| Material Moving | 0 (0.0%) | 0 (0.0%) |
| Total (Category) | 233 (66.0%) | 120 (34.0%) |
| Total (Overall) | 2,201 (57.3%) | 1,639 (42.7%) |
Employment Industries by Sex in Thompson s Station
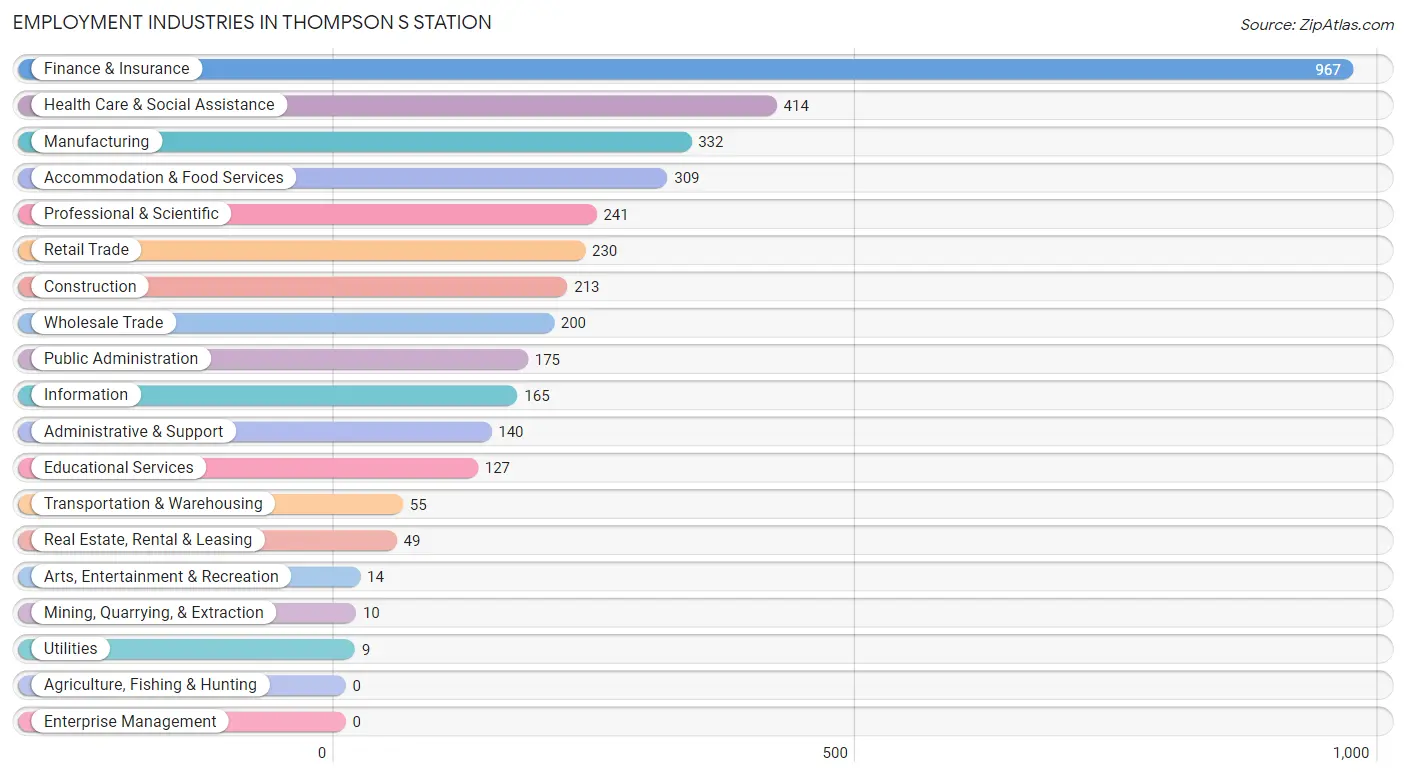
Employment Industries in Thompson s Station
The major employment industries in Thompson s Station include Finance & Insurance (967 | 25.2%), Health Care & Social Assistance (414 | 10.8%), Manufacturing (332 | 8.6%), Accommodation & Food Services (309 | 8.1%), and Professional & Scientific (241 | 6.3%).
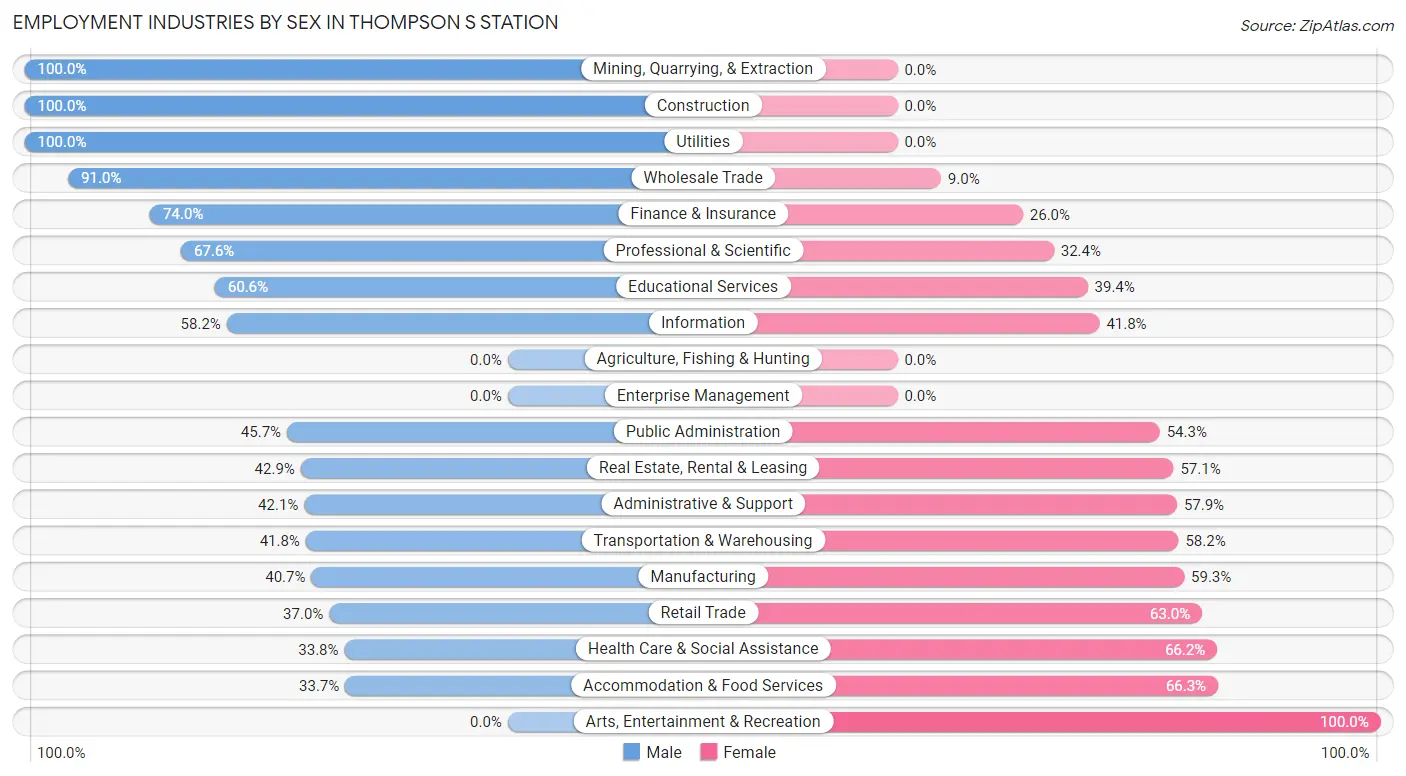
Employment Industries by Sex in Thompson s Station
The Thompson s Station industries that see more men than women are Mining, Quarrying, & Extraction (100.0%), Construction (100.0%), and Utilities (100.0%), whereas the industries that tend to have a higher number of women are Arts, Entertainment & Recreation (100.0%), Accommodation & Food Services (66.3%), and Health Care & Social Assistance (66.2%).
| Industry | Male | Female |
| Agriculture, Fishing & Hunting | 0 (0.0%) | 0 (0.0%) |
| Mining, Quarrying, & Extraction | 10 (100.0%) | 0 (0.0%) |
| Construction | 213 (100.0%) | 0 (0.0%) |
| Manufacturing | 135 (40.7%) | 197 (59.3%) |
| Wholesale Trade | 182 (91.0%) | 18 (9.0%) |
| Retail Trade | 85 (37.0%) | 145 (63.0%) |
| Transportation & Warehousing | 23 (41.8%) | 32 (58.2%) |
| Utilities | 9 (100.0%) | 0 (0.0%) |
| Information | 96 (58.2%) | 69 (41.8%) |
| Finance & Insurance | 716 (74.0%) | 251 (26.0%) |
| Real Estate, Rental & Leasing | 21 (42.9%) | 28 (57.1%) |
| Professional & Scientific | 163 (67.6%) | 78 (32.4%) |
| Enterprise Management | 0 (0.0%) | 0 (0.0%) |
| Administrative & Support | 59 (42.1%) | 81 (57.9%) |
| Educational Services | 77 (60.6%) | 50 (39.4%) |
| Health Care & Social Assistance | 140 (33.8%) | 274 (66.2%) |
| Arts, Entertainment & Recreation | 0 (0.0%) | 14 (100.0%) |
| Accommodation & Food Services | 104 (33.7%) | 205 (66.3%) |
| Public Administration | 80 (45.7%) | 95 (54.3%) |
| Total | 2,201 (57.3%) | 1,639 (42.7%) |
Education in Thompson s Station
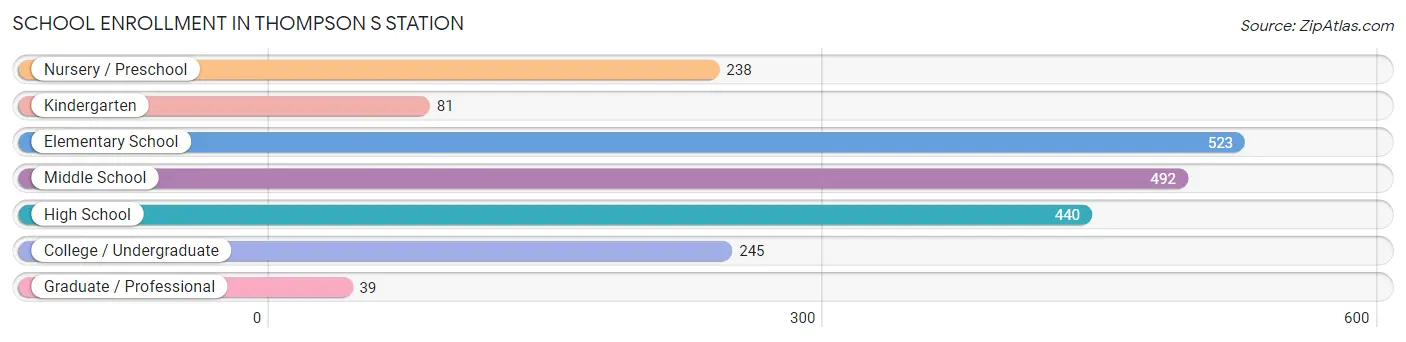
School Enrollment in Thompson s Station
The most common levels of schooling among the 2,058 students in Thompson s Station are elementary school (523 | 25.4%), middle school (492 | 23.9%), and high school (440 | 21.4%).
| School Level | # Students | % Students |
| Nursery / Preschool | 238 | 11.6% |
| Kindergarten | 81 | 3.9% |
| Elementary School | 523 | 25.4% |
| Middle School | 492 | 23.9% |
| High School | 440 | 21.4% |
| College / Undergraduate | 245 | 11.9% |
| Graduate / Professional | 39 | 1.9% |
| Total | 2,058 | 100.0% |
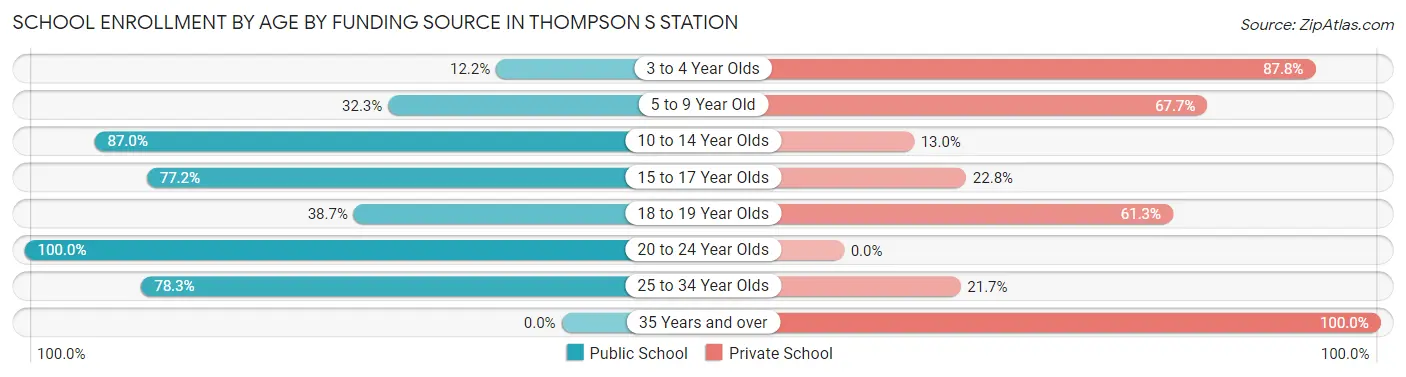
School Enrollment by Age by Funding Source in Thompson s Station
Out of a total of 2,058 students who are enrolled in schools in Thompson s Station, 899 (43.7%) attend a private institution, while the remaining 1,159 (56.3%) are enrolled in public schools. The age group of 35 years and over has the highest likelihood of being enrolled in private schools, with 35 (100.0% in the age bracket) enrolled. Conversely, the age group of 20 to 24 year olds has the lowest likelihood of being enrolled in a private school, with 63 (100.0% in the age bracket) attending a public institution.
| Age Bracket | Public School | Private School |
| 3 to 4 Year Olds | 29 (12.2%) | 209 (87.8%) |
| 5 to 9 Year Old | 176 (32.3%) | 369 (67.7%) |
| 10 to 14 Year Olds | 507 (87.0%) | 76 (13.0%) |
| 15 to 17 Year Olds | 234 (77.2%) | 69 (22.8%) |
| 18 to 19 Year Olds | 77 (38.7%) | 122 (61.3%) |
| 20 to 24 Year Olds | 63 (100.0%) | 0 (0.0%) |
| 25 to 34 Year Olds | 72 (78.3%) | 20 (21.7%) |
| 35 Years and over | 0 (0.0%) | 35 (100.0%) |
| Total | 1,159 (56.3%) | 899 (43.7%) |
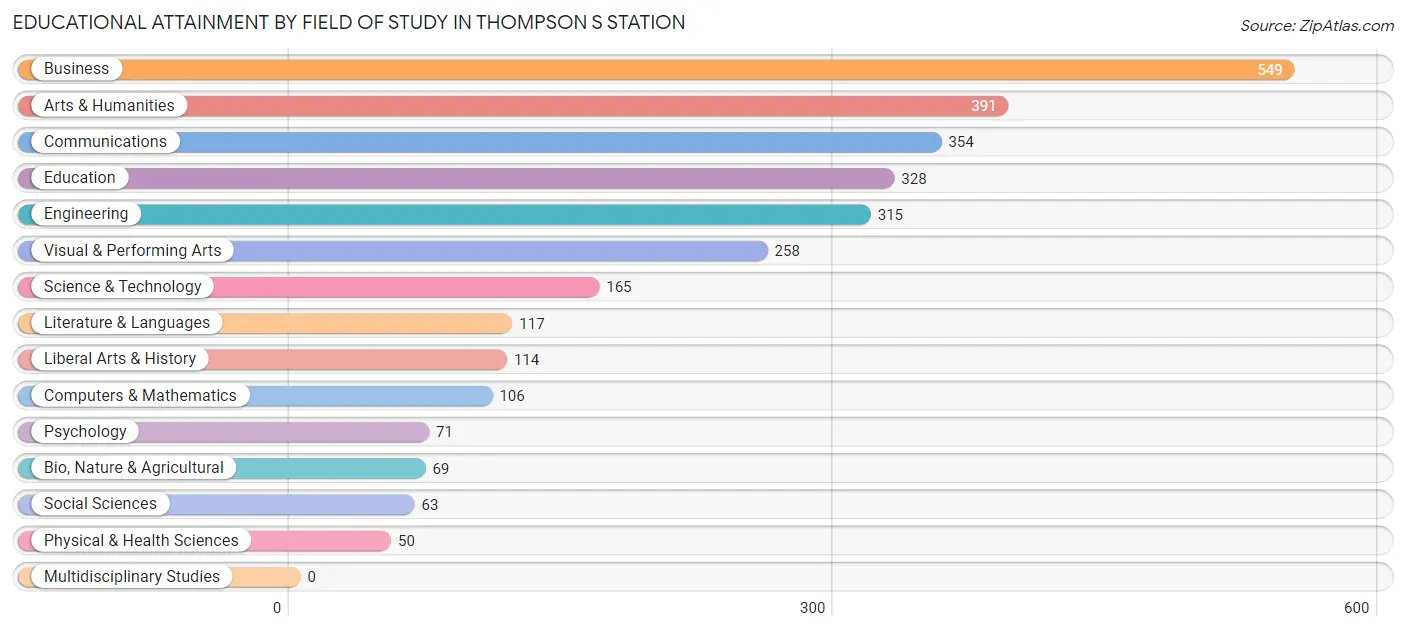
Educational Attainment by Field of Study in Thompson s Station
Business (549 | 18.6%), arts & humanities (391 | 13.3%), communications (354 | 12.0%), education (328 | 11.1%), and engineering (315 | 10.7%) are the most common fields of study among 2,950 individuals in Thompson s Station who have obtained a bachelor's degree or higher.
| Field of Study | # Graduates | % Graduates |
| Computers & Mathematics | 106 | 3.6% |
| Bio, Nature & Agricultural | 69 | 2.3% |
| Physical & Health Sciences | 50 | 1.7% |
| Psychology | 71 | 2.4% |
| Social Sciences | 63 | 2.1% |
| Engineering | 315 | 10.7% |
| Multidisciplinary Studies | 0 | 0.0% |
| Science & Technology | 165 | 5.6% |
| Business | 549 | 18.6% |
| Education | 328 | 11.1% |
| Literature & Languages | 117 | 4.0% |
| Liberal Arts & History | 114 | 3.9% |
| Visual & Performing Arts | 258 | 8.7% |
| Communications | 354 | 12.0% |
| Arts & Humanities | 391 | 13.3% |
| Total | 2,950 | 100.0% |
Transportation & Commute in Thompson s Station
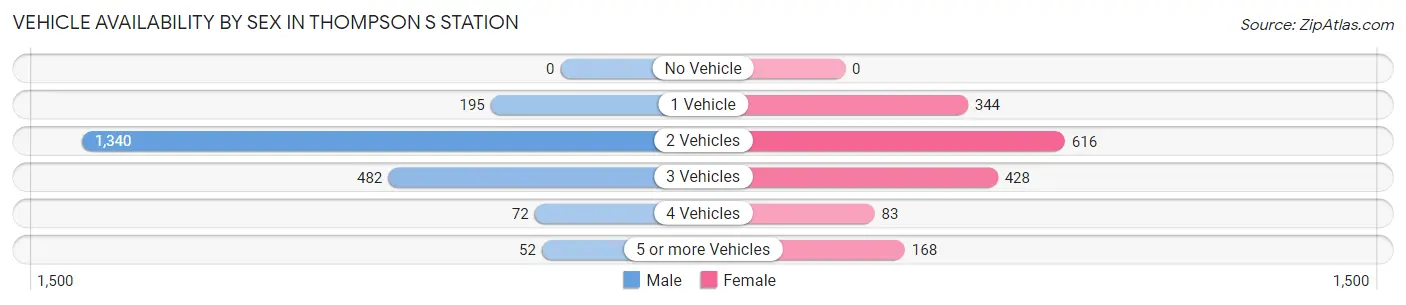
Vehicle Availability by Sex in Thompson s Station
The most prevalent vehicle ownership categories in Thompson s Station are males with 2 vehicles (1,340, accounting for 62.6%) and females with 2 vehicles (616, making up 81.8%).
| Vehicles Available | Male | Female |
| No Vehicle | 0 (0.0%) | 0 (0.0%) |
| 1 Vehicle | 195 (9.1%) | 344 (21.0%) |
| 2 Vehicles | 1,340 (62.6%) | 616 (37.6%) |
| 3 Vehicles | 482 (22.5%) | 428 (26.1%) |
| 4 Vehicles | 72 (3.4%) | 83 (5.1%) |
| 5 or more Vehicles | 52 (2.4%) | 168 (10.2%) |
| Total | 2,141 (100.0%) | 1,639 (100.0%) |
Commute Time in Thompson s Station
The most frequently occuring commute durations in Thompson s Station are 20 to 24 minutes (584 commuters, 19.3%), 15 to 19 minutes (569 commuters, 18.9%), and 60 to 89 minutes (452 commuters, 15.0%).
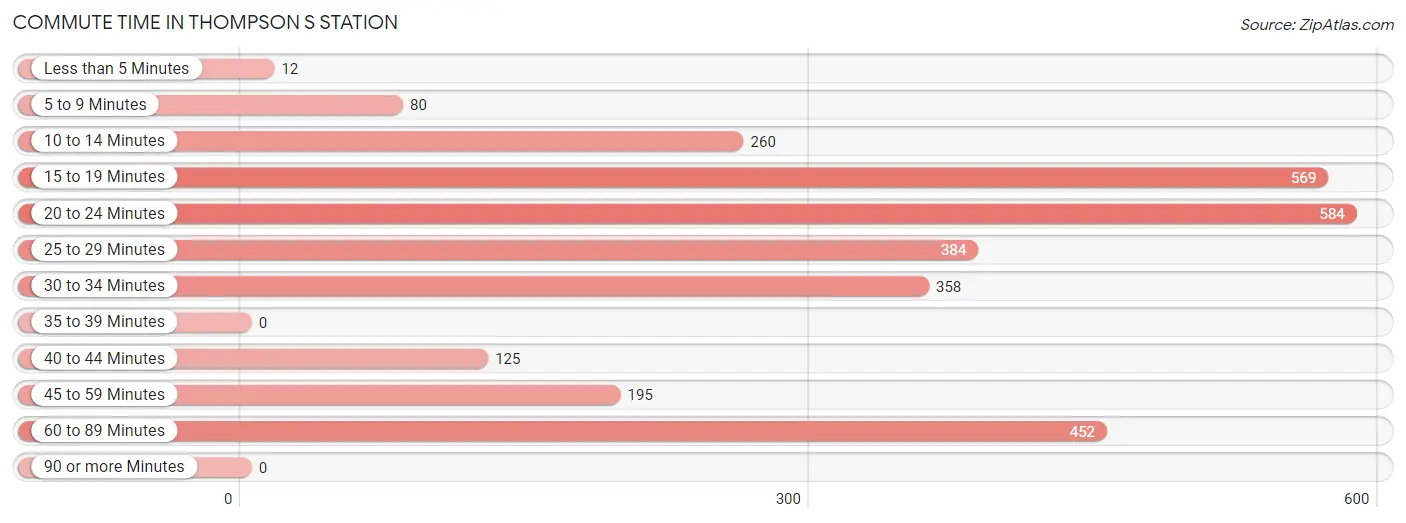
| Commute Time | # Commuters | % Commuters |
| Less than 5 Minutes | 12 | 0.4% |
| 5 to 9 Minutes | 80 | 2.6% |
| 10 to 14 Minutes | 260 | 8.6% |
| 15 to 19 Minutes | 569 | 18.9% |
| 20 to 24 Minutes | 584 | 19.3% |
| 25 to 29 Minutes | 384 | 12.7% |
| 30 to 34 Minutes | 358 | 11.9% |
| 35 to 39 Minutes | 0 | 0.0% |
| 40 to 44 Minutes | 125 | 4.1% |
| 45 to 59 Minutes | 195 | 6.5% |
| 60 to 89 Minutes | 452 | 15.0% |
| 90 or more Minutes | 0 | 0.0% |
Commute Time by Sex in Thompson s Station
The most common commute times in Thompson s Station are 60 to 89 minutes (382 commuters, 21.4%) for males and 20 to 24 minutes (351 commuters, 28.5%) for females.
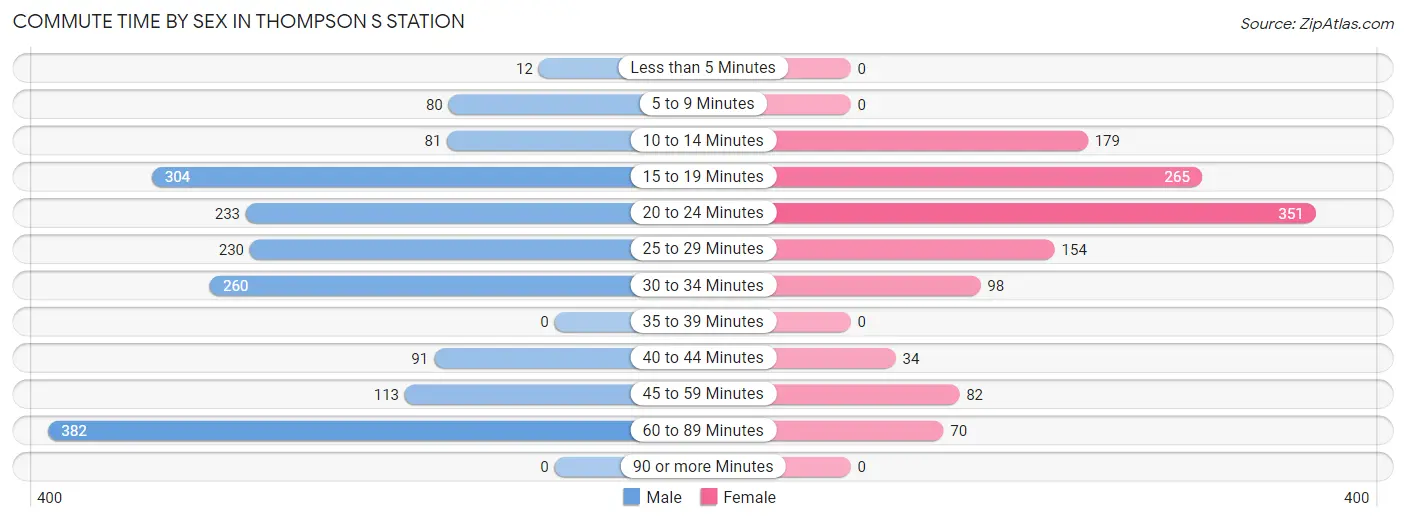
| Commute Time | Male | Female |
| Less than 5 Minutes | 12 (0.7%) | 0 (0.0%) |
| 5 to 9 Minutes | 80 (4.5%) | 0 (0.0%) |
| 10 to 14 Minutes | 81 (4.5%) | 179 (14.5%) |
| 15 to 19 Minutes | 304 (17.0%) | 265 (21.5%) |
| 20 to 24 Minutes | 233 (13.1%) | 351 (28.5%) |
| 25 to 29 Minutes | 230 (12.9%) | 154 (12.5%) |
| 30 to 34 Minutes | 260 (14.6%) | 98 (8.0%) |
| 35 to 39 Minutes | 0 (0.0%) | 0 (0.0%) |
| 40 to 44 Minutes | 91 (5.1%) | 34 (2.8%) |
| 45 to 59 Minutes | 113 (6.3%) | 82 (6.7%) |
| 60 to 89 Minutes | 382 (21.4%) | 70 (5.7%) |
| 90 or more Minutes | 0 (0.0%) | 0 (0.0%) |
Time of Departure to Work by Sex in Thompson s Station
The most frequent times of departure to work in Thompson s Station are 8:00 AM to 8:29 AM (367, 20.5%) for males and 7:30 AM to 7:59 AM (376, 30.5%) for females.
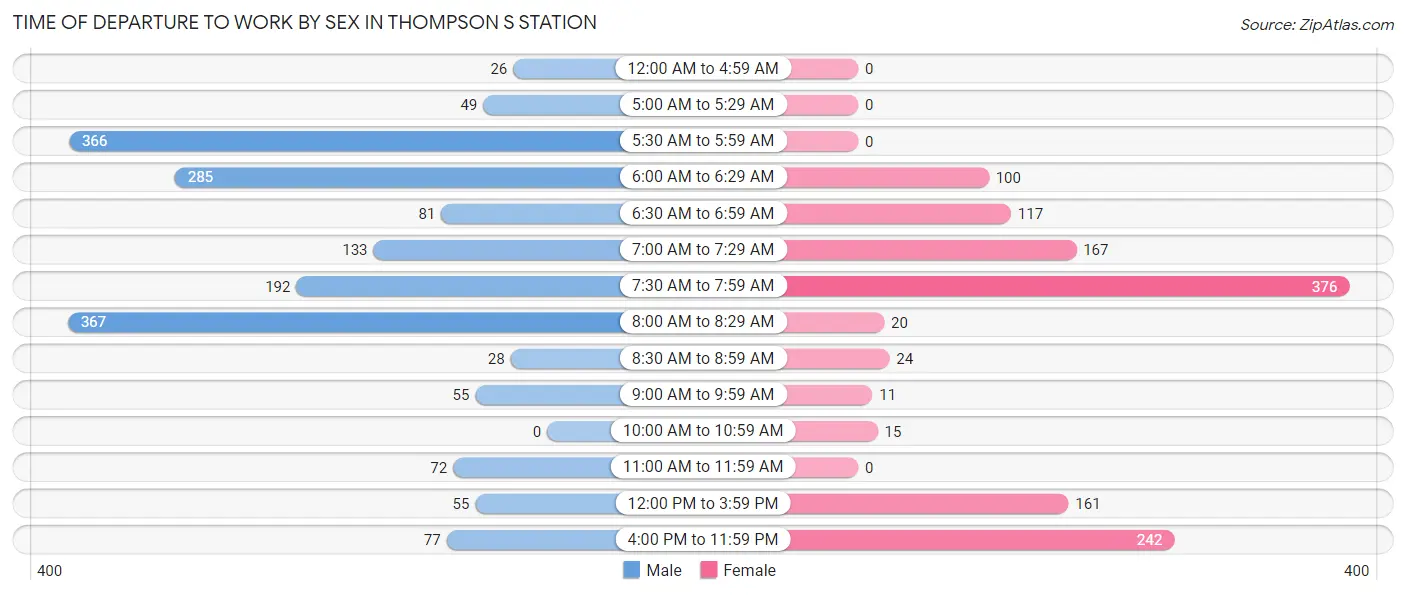
| Time of Departure | Male | Female |
| 12:00 AM to 4:59 AM | 26 (1.5%) | 0 (0.0%) |
| 5:00 AM to 5:29 AM | 49 (2.7%) | 0 (0.0%) |
| 5:30 AM to 5:59 AM | 366 (20.5%) | 0 (0.0%) |
| 6:00 AM to 6:29 AM | 285 (16.0%) | 100 (8.1%) |
| 6:30 AM to 6:59 AM | 81 (4.5%) | 117 (9.5%) |
| 7:00 AM to 7:29 AM | 133 (7.4%) | 167 (13.5%) |
| 7:30 AM to 7:59 AM | 192 (10.7%) | 376 (30.5%) |
| 8:00 AM to 8:29 AM | 367 (20.5%) | 20 (1.6%) |
| 8:30 AM to 8:59 AM | 28 (1.6%) | 24 (1.9%) |
| 9:00 AM to 9:59 AM | 55 (3.1%) | 11 (0.9%) |
| 10:00 AM to 10:59 AM | 0 (0.0%) | 15 (1.2%) |
| 11:00 AM to 11:59 AM | 72 (4.0%) | 0 (0.0%) |
| 12:00 PM to 3:59 PM | 55 (3.1%) | 161 (13.1%) |
| 4:00 PM to 11:59 PM | 77 (4.3%) | 242 (19.6%) |
| Total | 1,786 (100.0%) | 1,233 (100.0%) |
Housing Occupancy in Thompson s Station
Occupancy by Ownership in Thompson s Station
Of the total 2,605 dwellings in Thompson s Station, owner-occupied units account for 1,965 (75.4%), while renter-occupied units make up 640 (24.6%).
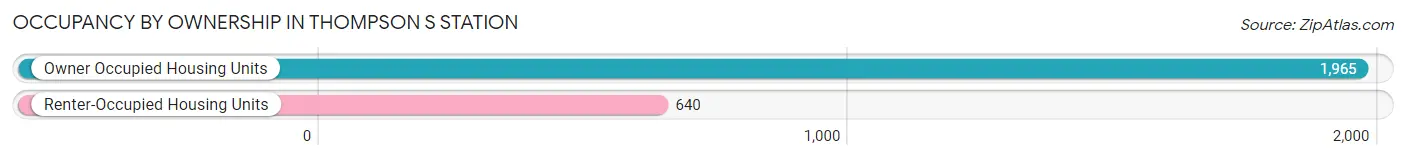
| Occupancy | # Housing Units | % Housing Units |
| Owner Occupied Housing Units | 1,965 | 75.4% |
| Renter-Occupied Housing Units | 640 | 24.6% |
| Total Occupied Housing Units | 2,605 | 100.0% |
Occupancy by Household Size in Thompson s Station
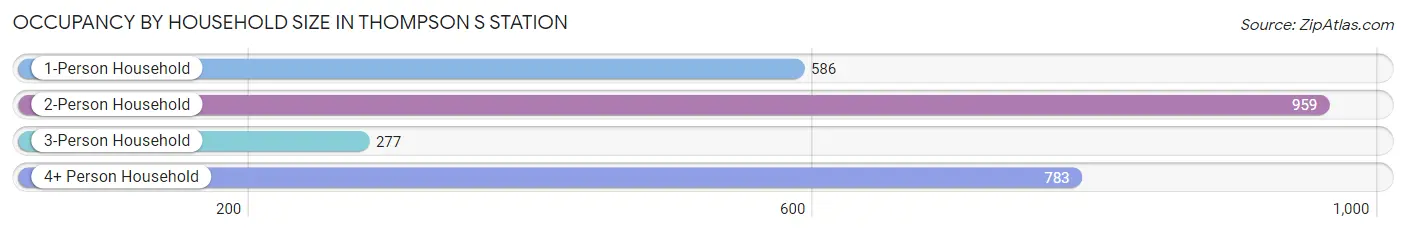
| Household Size | # Housing Units | % Housing Units |
| 1-Person Household | 586 | 22.5% |
| 2-Person Household | 959 | 36.8% |
| 3-Person Household | 277 | 10.6% |
| 4+ Person Household | 783 | 30.1% |
| Total Housing Units | 2,605 | 100.0% |
Occupancy by Ownership by Household Size in Thompson s Station
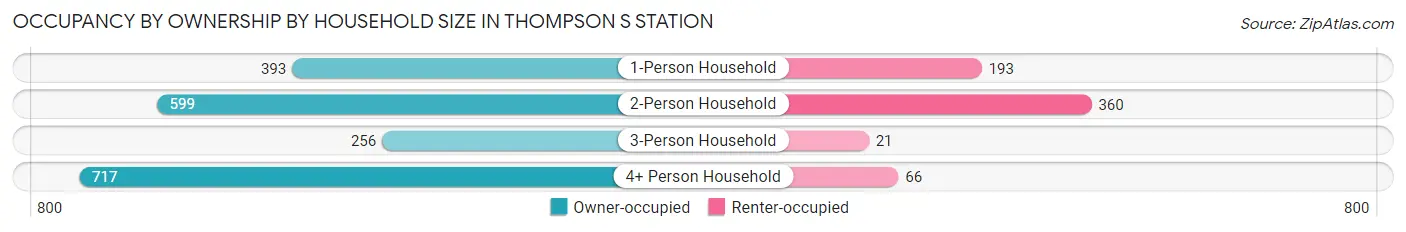
| Household Size | Owner-occupied | Renter-occupied |
| 1-Person Household | 393 (67.1%) | 193 (32.9%) |
| 2-Person Household | 599 (62.5%) | 360 (37.5%) |
| 3-Person Household | 256 (92.4%) | 21 (7.6%) |
| 4+ Person Household | 717 (91.6%) | 66 (8.4%) |
| Total Housing Units | 1,965 (75.4%) | 640 (24.6%) |
Occupancy by Educational Attainment in Thompson s Station
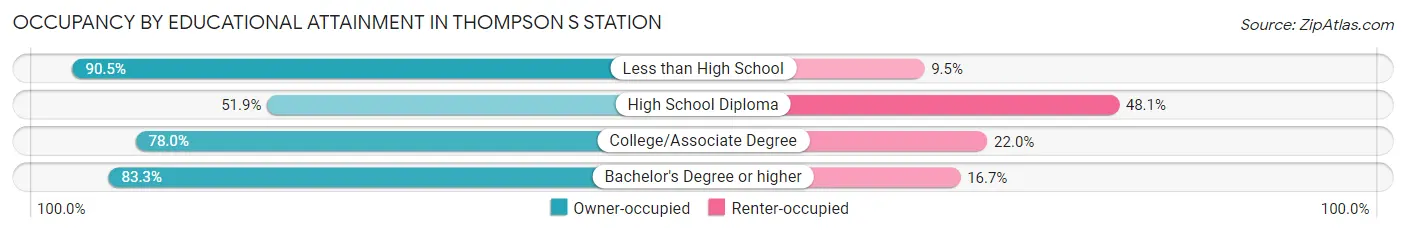
| Household Size | Owner-occupied | Renter-occupied |
| Less than High School | 19 (90.5%) | 2 (9.5%) |
| High School Diploma | 316 (51.9%) | 293 (48.1%) |
| College/Associate Degree | 234 (78.0%) | 66 (22.0%) |
| Bachelor's Degree or higher | 1,396 (83.3%) | 279 (16.7%) |
Occupancy by Age of Householder in Thompson s Station
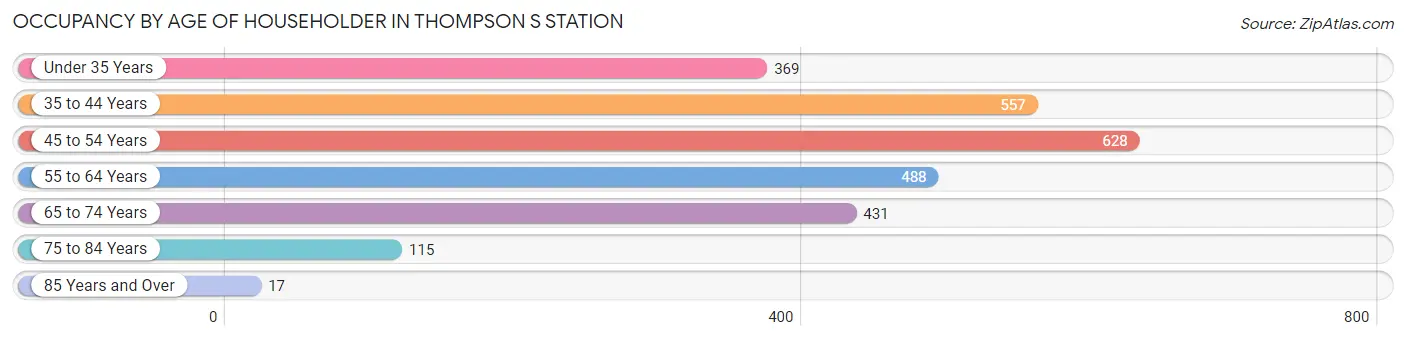
| Age Bracket | # Households | % Households |
| Under 35 Years | 369 | 14.2% |
| 35 to 44 Years | 557 | 21.4% |
| 45 to 54 Years | 628 | 24.1% |
| 55 to 64 Years | 488 | 18.7% |
| 65 to 74 Years | 431 | 16.6% |
| 75 to 84 Years | 115 | 4.4% |
| 85 Years and Over | 17 | 0.6% |
| Total | 2,605 | 100.0% |
Housing Finances in Thompson s Station
Median Income by Occupancy in Thompson s Station
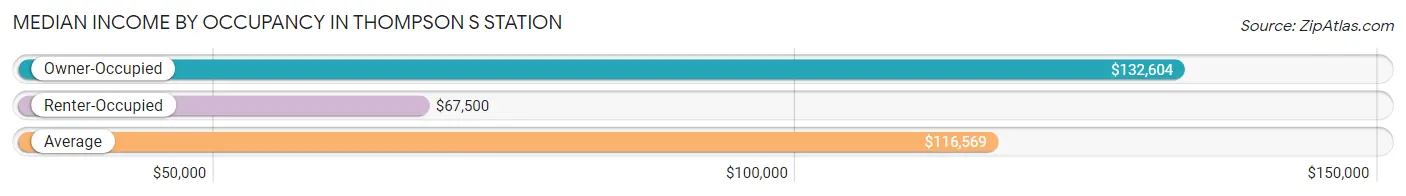
| Occupancy Type | # Households | Median Income |
| Owner-Occupied | 1,965 (75.4%) | $132,604 |
| Renter-Occupied | 640 (24.6%) | $67,500 |
| Average | 2,605 (100.0%) | $116,569 |
Occupancy by Householder Income Bracket in Thompson s Station
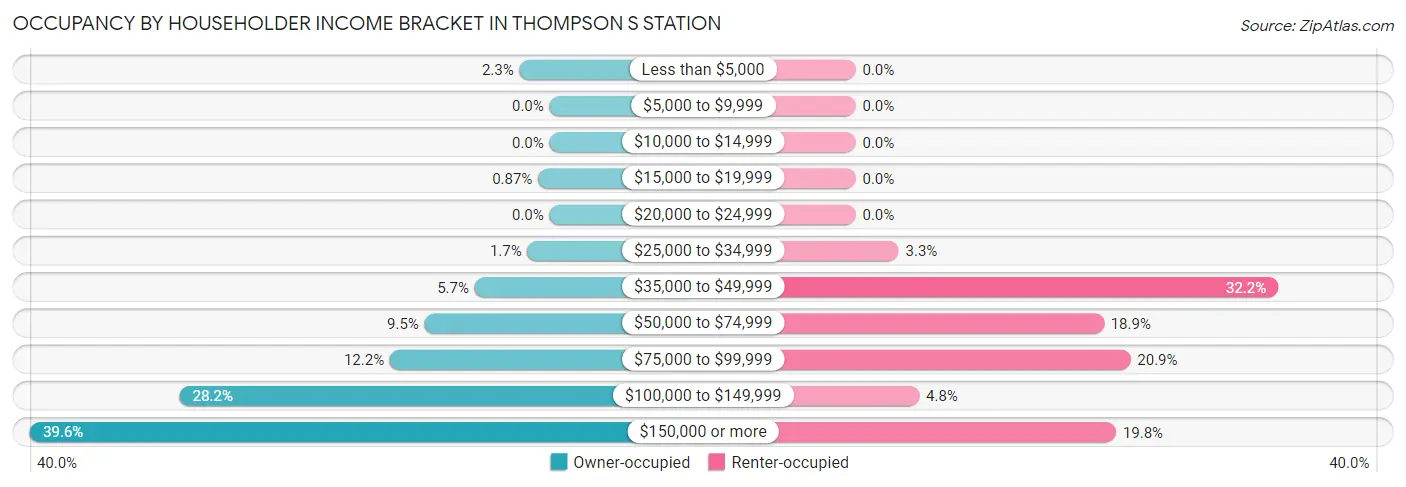
| Income Bracket | Owner-occupied | Renter-occupied |
| Less than $5,000 | 45 (2.3%) | 0 (0.0%) |
| $5,000 to $9,999 | 0 (0.0%) | 0 (0.0%) |
| $10,000 to $14,999 | 0 (0.0%) | 0 (0.0%) |
| $15,000 to $19,999 | 17 (0.9%) | 0 (0.0%) |
| $20,000 to $24,999 | 0 (0.0%) | 0 (0.0%) |
| $25,000 to $34,999 | 33 (1.7%) | 21 (3.3%) |
| $35,000 to $49,999 | 112 (5.7%) | 206 (32.2%) |
| $50,000 to $74,999 | 187 (9.5%) | 121 (18.9%) |
| $75,000 to $99,999 | 239 (12.2%) | 134 (20.9%) |
| $100,000 to $149,999 | 554 (28.2%) | 31 (4.8%) |
| $150,000 or more | 778 (39.6%) | 127 (19.8%) |
| Total | 1,965 (100.0%) | 640 (100.0%) |
Monthly Housing Cost Tiers in Thompson s Station
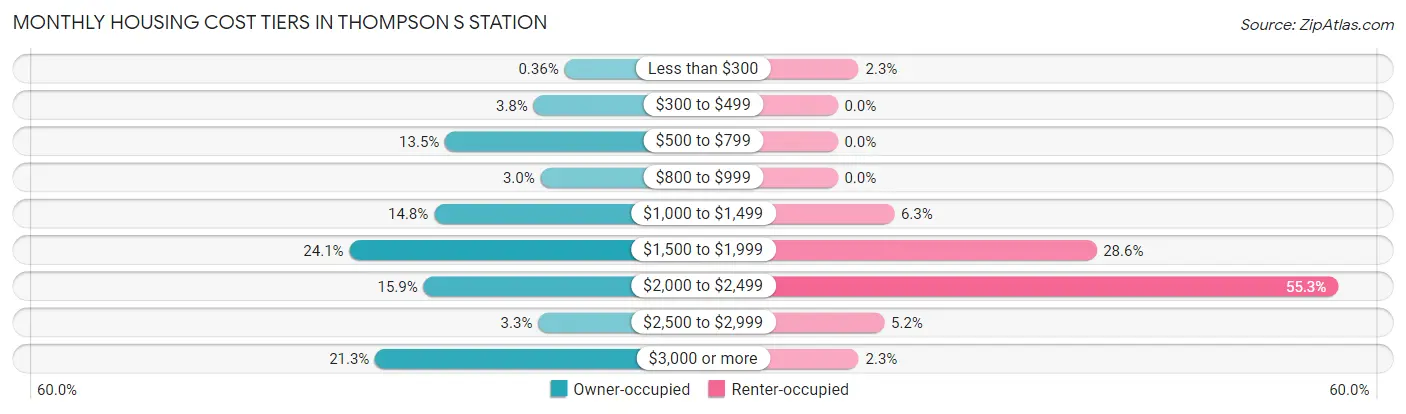
| Monthly Cost | Owner-occupied | Renter-occupied |
| Less than $300 | 7 (0.4%) | 15 (2.3%) |
| $300 to $499 | 74 (3.8%) | 0 (0.0%) |
| $500 to $799 | 266 (13.5%) | 0 (0.0%) |
| $800 to $999 | 59 (3.0%) | 0 (0.0%) |
| $1,000 to $1,499 | 290 (14.8%) | 40 (6.2%) |
| $1,500 to $1,999 | 474 (24.1%) | 183 (28.6%) |
| $2,000 to $2,499 | 313 (15.9%) | 354 (55.3%) |
| $2,500 to $2,999 | 64 (3.3%) | 33 (5.2%) |
| $3,000 or more | 418 (21.3%) | 15 (2.3%) |
| Total | 1,965 (100.0%) | 640 (100.0%) |
Physical Housing Characteristics in Thompson s Station
Housing Structures in Thompson s Station
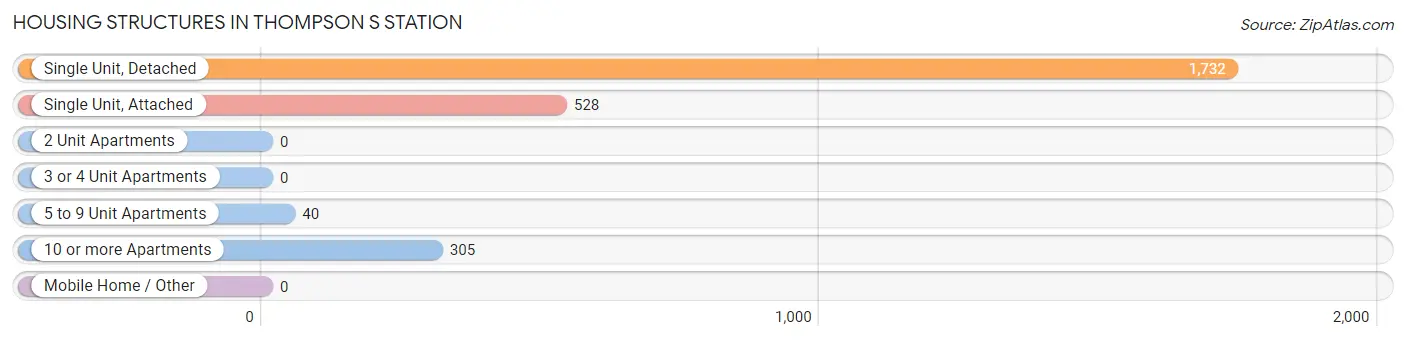
| Structure Type | # Housing Units | % Housing Units |
| Single Unit, Detached | 1,732 | 66.5% |
| Single Unit, Attached | 528 | 20.3% |
| 2 Unit Apartments | 0 | 0.0% |
| 3 or 4 Unit Apartments | 0 | 0.0% |
| 5 to 9 Unit Apartments | 40 | 1.5% |
| 10 or more Apartments | 305 | 11.7% |
| Mobile Home / Other | 0 | 0.0% |
| Total | 2,605 | 100.0% |
Housing Structures by Occupancy in Thompson s Station
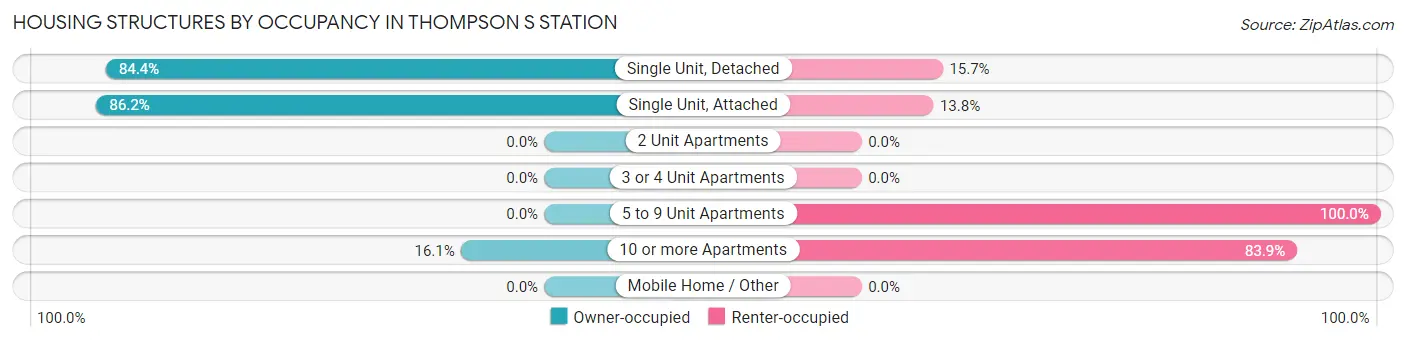
| Structure Type | Owner-occupied | Renter-occupied |
| Single Unit, Detached | 1,461 (84.4%) | 271 (15.7%) |
| Single Unit, Attached | 455 (86.2%) | 73 (13.8%) |
| 2 Unit Apartments | 0 (0.0%) | 0 (0.0%) |
| 3 or 4 Unit Apartments | 0 (0.0%) | 0 (0.0%) |
| 5 to 9 Unit Apartments | 0 (0.0%) | 40 (100.0%) |
| 10 or more Apartments | 49 (16.1%) | 256 (83.9%) |
| Mobile Home / Other | 0 (0.0%) | 0 (0.0%) |
| Total | 1,965 (75.4%) | 640 (24.6%) |
Housing Structures by Number of Rooms in Thompson s Station
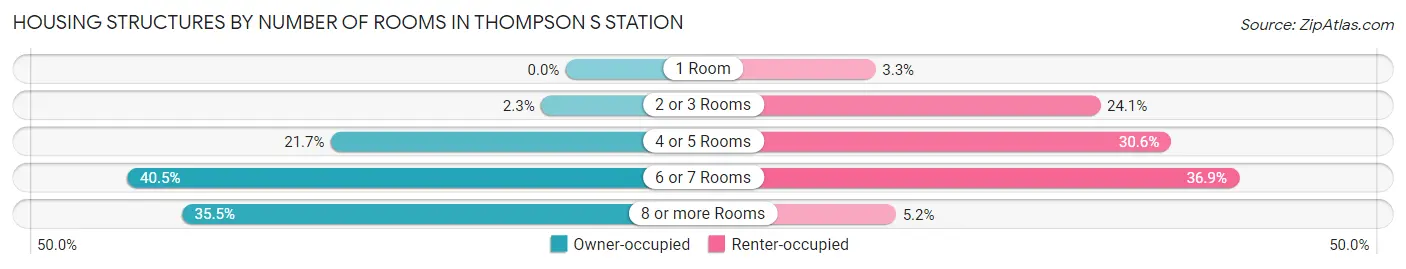
| Number of Rooms | Owner-occupied | Renter-occupied |
| 1 Room | 0 (0.0%) | 21 (3.3%) |
| 2 or 3 Rooms | 45 (2.3%) | 154 (24.1%) |
| 4 or 5 Rooms | 427 (21.7%) | 196 (30.6%) |
| 6 or 7 Rooms | 796 (40.5%) | 236 (36.9%) |
| 8 or more Rooms | 697 (35.5%) | 33 (5.2%) |
| Total | 1,965 (100.0%) | 640 (100.0%) |
Housing Structure by Heating Type in Thompson s Station
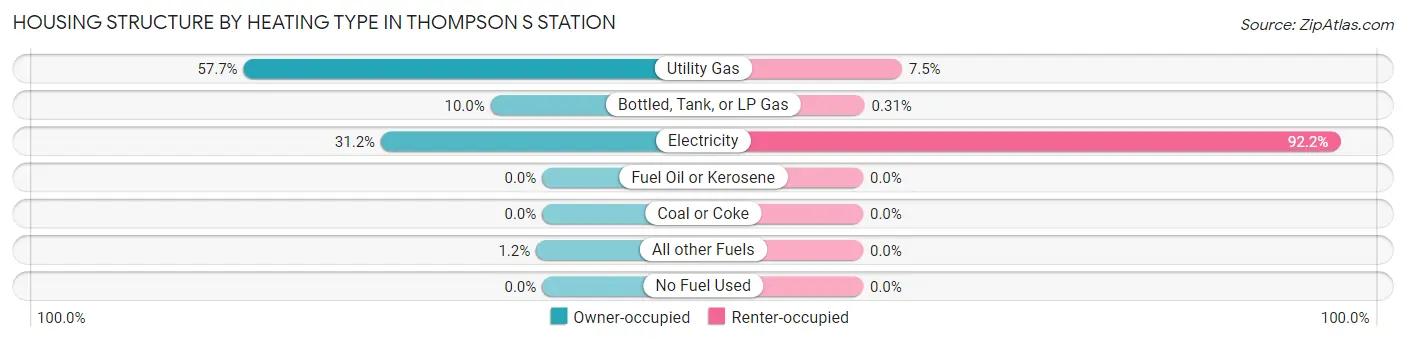
| Heating Type | Owner-occupied | Renter-occupied |
| Utility Gas | 1,134 (57.7%) | 48 (7.5%) |
| Bottled, Tank, or LP Gas | 196 (10.0%) | 2 (0.3%) |
| Electricity | 612 (31.1%) | 590 (92.2%) |
| Fuel Oil or Kerosene | 0 (0.0%) | 0 (0.0%) |
| Coal or Coke | 0 (0.0%) | 0 (0.0%) |
| All other Fuels | 23 (1.2%) | 0 (0.0%) |
| No Fuel Used | 0 (0.0%) | 0 (0.0%) |
| Total | 1,965 (100.0%) | 640 (100.0%) |
Household Vehicle Usage in Thompson s Station
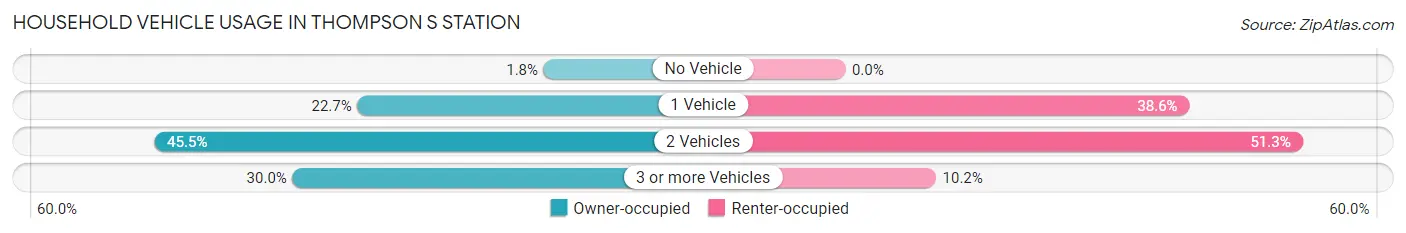
| Vehicles per Household | Owner-occupied | Renter-occupied |
| No Vehicle | 36 (1.8%) | 0 (0.0%) |
| 1 Vehicle | 446 (22.7%) | 247 (38.6%) |
| 2 Vehicles | 894 (45.5%) | 328 (51.2%) |
| 3 or more Vehicles | 589 (30.0%) | 65 (10.2%) |
| Total | 1,965 (100.0%) | 640 (100.0%) |
Real Estate & Mortgages in Thompson s Station
Real Estate and Mortgage Overview in Thompson s Station
| Characteristic | Without Mortgage | With Mortgage |
| Housing Units | 457 | 1,508 |
| Median Property Value | $607,500 | $527,000 |
| Median Household Income | $120,485 | $652 |
| Monthly Housing Costs | $678 | $418 |
| Real Estate Taxes | $2,704 | $12 |
Property Value by Mortgage Status in Thompson s Station
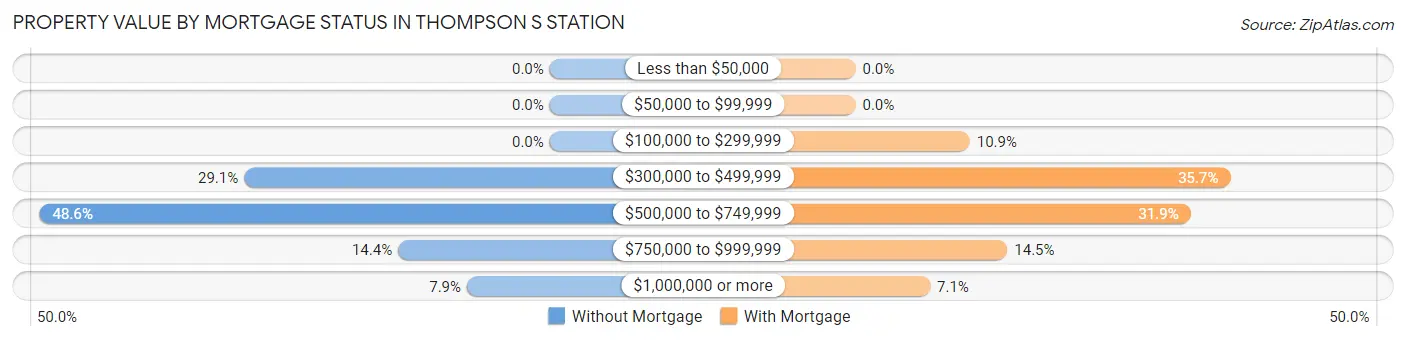
| Property Value | Without Mortgage | With Mortgage |
| Less than $50,000 | 0 (0.0%) | 0 (0.0%) |
| $50,000 to $99,999 | 0 (0.0%) | 0 (0.0%) |
| $100,000 to $299,999 | 0 (0.0%) | 164 (10.9%) |
| $300,000 to $499,999 | 133 (29.1%) | 538 (35.7%) |
| $500,000 to $749,999 | 222 (48.6%) | 481 (31.9%) |
| $750,000 to $999,999 | 66 (14.4%) | 218 (14.5%) |
| $1,000,000 or more | 36 (7.9%) | 107 (7.1%) |
| Total | 457 (100.0%) | 1,508 (100.0%) |
Household Income by Mortgage Status in Thompson s Station
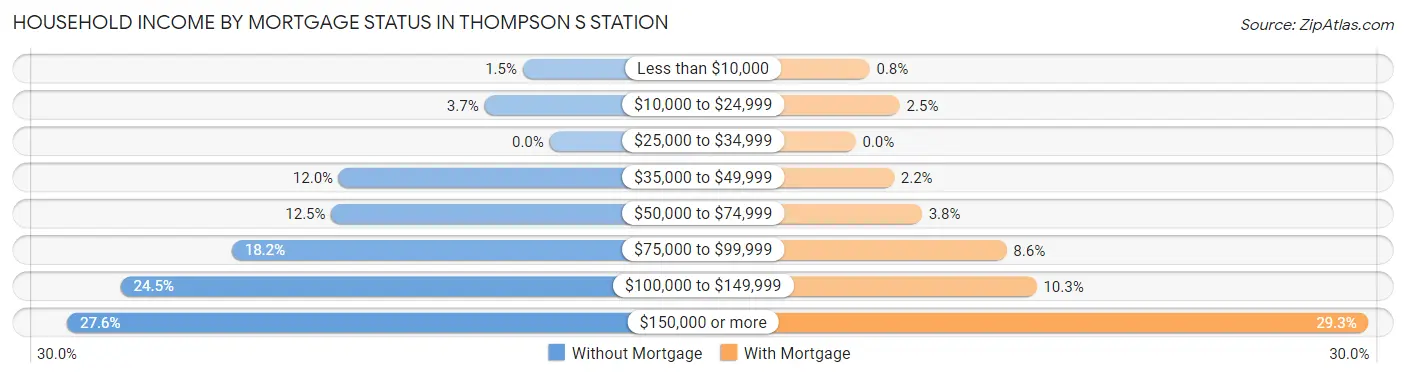
| Household Income | Without Mortgage | With Mortgage |
| Less than $10,000 | 7 (1.5%) | 12 (0.8%) |
| $10,000 to $24,999 | 17 (3.7%) | 38 (2.5%) |
| $25,000 to $34,999 | 0 (0.0%) | 0 (0.0%) |
| $35,000 to $49,999 | 55 (12.0%) | 33 (2.2%) |
| $50,000 to $74,999 | 57 (12.5%) | 57 (3.8%) |
| $75,000 to $99,999 | 83 (18.2%) | 130 (8.6%) |
| $100,000 to $149,999 | 112 (24.5%) | 156 (10.3%) |
| $150,000 or more | 126 (27.6%) | 442 (29.3%) |
| Total | 457 (100.0%) | 1,508 (100.0%) |
Property Value to Household Income Ratio in Thompson s Station
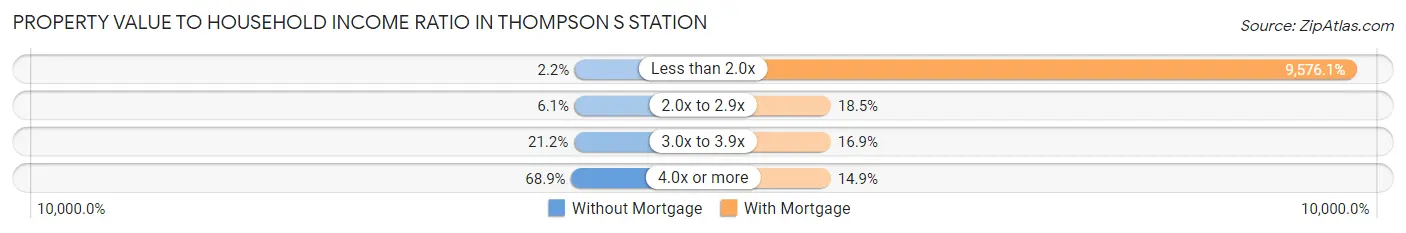
| Value-to-Income Ratio | Without Mortgage | With Mortgage |
| Less than 2.0x | 10 (2.2%) | 144,407 (9,576.1%) |
| 2.0x to 2.9x | 28 (6.1%) | 279 (18.5%) |
| 3.0x to 3.9x | 97 (21.2%) | 255 (16.9%) |
| 4.0x or more | 315 (68.9%) | 225 (14.9%) |
| Total | 457 (100.0%) | 1,508 (100.0%) |
Real Estate Taxes by Mortgage Status in Thompson s Station
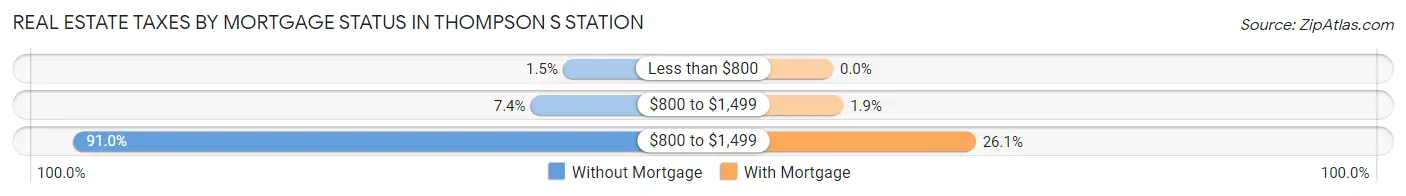
| Property Taxes | Without Mortgage | With Mortgage |
| Less than $800 | 7 (1.5%) | 0 (0.0%) |
| $800 to $1,499 | 34 (7.4%) | 28 (1.9%) |
| $800 to $1,499 | 416 (91.0%) | 393 (26.1%) |
| Total | 457 (100.0%) | 1,508 (100.0%) |
Health & Disability in Thompson s Station
Health Insurance Coverage by Age in Thompson s Station
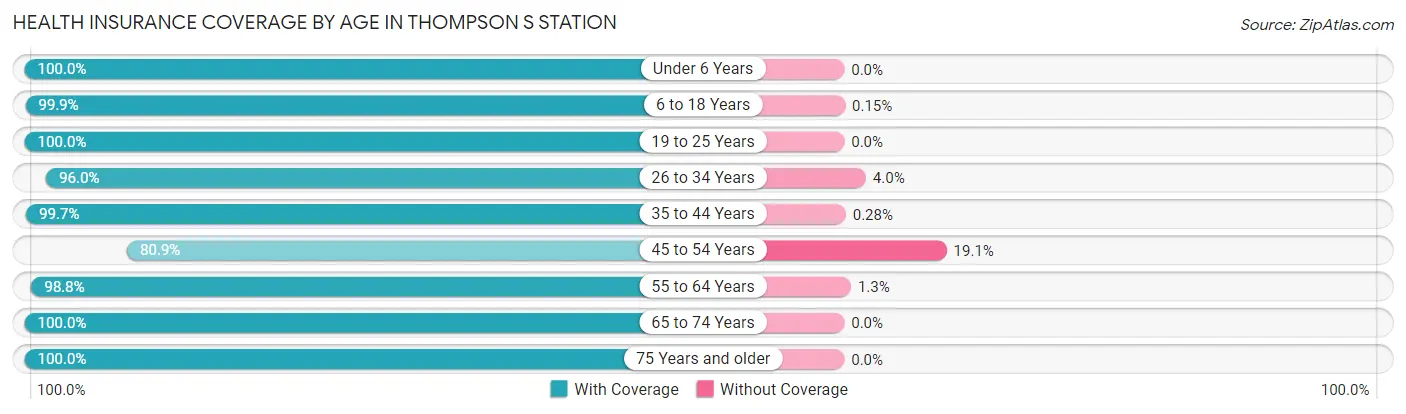
| Age Bracket | With Coverage | Without Coverage |
| Under 6 Years | 624 (100.0%) | 0 (0.0%) |
| 6 to 18 Years | 1,371 (99.9%) | 2 (0.2%) |
| 19 to 25 Years | 1,092 (100.0%) | 0 (0.0%) |
| 26 to 34 Years | 429 (96.0%) | 18 (4.0%) |
| 35 to 44 Years | 1,050 (99.7%) | 3 (0.3%) |
| 45 to 54 Years | 920 (80.9%) | 217 (19.1%) |
| 55 to 64 Years | 872 (98.8%) | 11 (1.3%) |
| 65 to 74 Years | 586 (100.0%) | 0 (0.0%) |
| 75 Years and older | 231 (100.0%) | 0 (0.0%) |
| Total | 7,175 (96.6%) | 251 (3.4%) |
Health Insurance Coverage by Citizenship Status in Thompson s Station
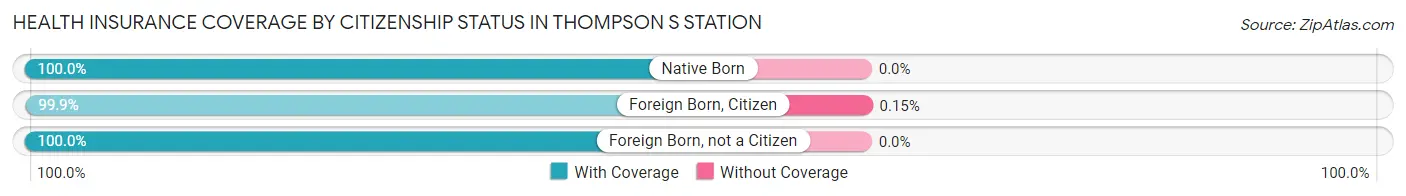
| Citizenship Status | With Coverage | Without Coverage |
| Native Born | 624 (100.0%) | 0 (0.0%) |
| Foreign Born, Citizen | 1,371 (99.9%) | 2 (0.2%) |
| Foreign Born, not a Citizen | 1,092 (100.0%) | 0 (0.0%) |
Health Insurance Coverage by Household Income in Thompson s Station
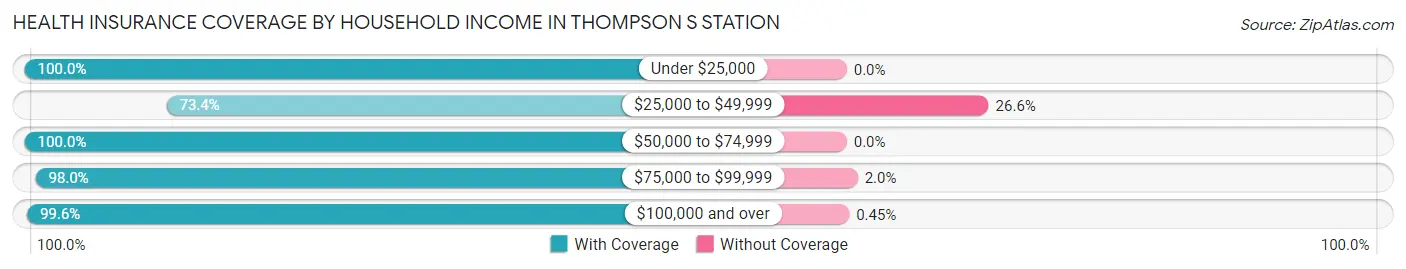
| Household Income | With Coverage | Without Coverage |
| Under $25,000 | 62 (100.0%) | 0 (0.0%) |
| $25,000 to $49,999 | 569 (73.4%) | 206 (26.6%) |
| $50,000 to $74,999 | 601 (100.0%) | 0 (0.0%) |
| $75,000 to $99,999 | 1,107 (98.0%) | 23 (2.0%) |
| $100,000 and over | 4,832 (99.6%) | 22 (0.4%) |
Public vs Private Health Insurance Coverage by Age in Thompson s Station
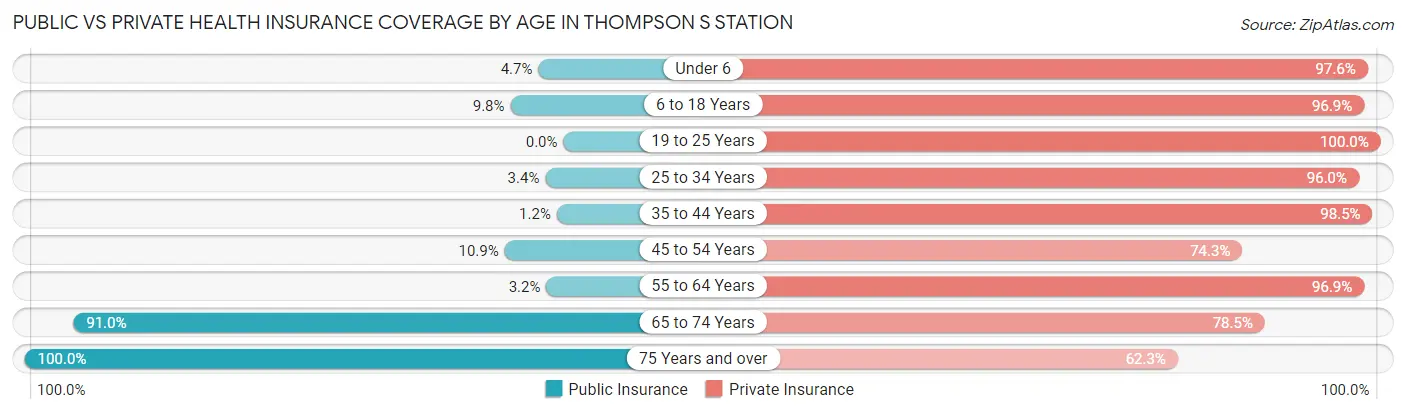
| Age Bracket | Public Insurance | Private Insurance |
| Under 6 | 29 (4.6%) | 609 (97.6%) |
| 6 to 18 Years | 135 (9.8%) | 1,331 (96.9%) |
| 19 to 25 Years | 0 (0.0%) | 1,092 (100.0%) |
| 25 to 34 Years | 15 (3.4%) | 429 (96.0%) |
| 35 to 44 Years | 13 (1.2%) | 1,037 (98.5%) |
| 45 to 54 Years | 124 (10.9%) | 845 (74.3%) |
| 55 to 64 Years | 28 (3.2%) | 856 (96.9%) |
| 65 to 74 Years | 533 (91.0%) | 460 (78.5%) |
| 75 Years and over | 231 (100.0%) | 144 (62.3%) |
| Total | 1,108 (14.9%) | 6,803 (91.6%) |
Disability Status by Sex by Age in Thompson s Station
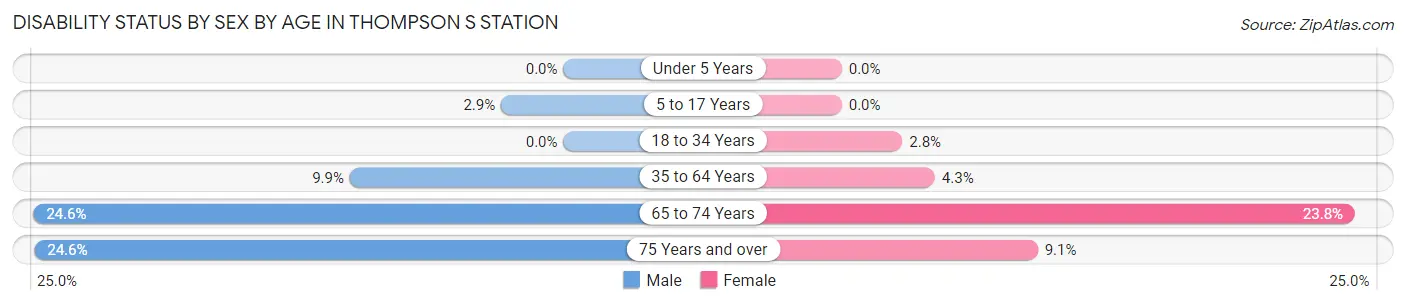
| Age Bracket | Male | Female |
| Under 5 Years | 0 (0.0%) | 0 (0.0%) |
| 5 to 17 Years | 19 (2.9%) | 0 (0.0%) |
| 18 to 34 Years | 0 (0.0%) | 15 (2.8%) |
| 35 to 64 Years | 160 (9.9%) | 63 (4.3%) |
| 65 to 74 Years | 77 (24.6%) | 65 (23.8%) |
| 75 Years and over | 27 (24.5%) | 11 (9.1%) |
Disability Class by Sex by Age in Thompson s Station
Disability Class: Hearing Difficulty
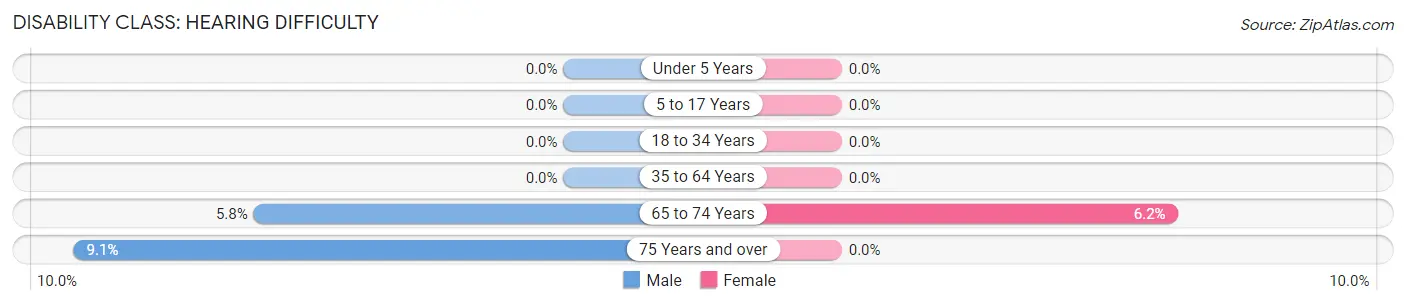
| Age Bracket | Male | Female |
| Under 5 Years | 0 (0.0%) | 0 (0.0%) |
| 5 to 17 Years | 0 (0.0%) | 0 (0.0%) |
| 18 to 34 Years | 0 (0.0%) | 0 (0.0%) |
| 35 to 64 Years | 0 (0.0%) | 0 (0.0%) |
| 65 to 74 Years | 18 (5.8%) | 17 (6.2%) |
| 75 Years and over | 10 (9.1%) | 0 (0.0%) |
Disability Class: Vision Difficulty
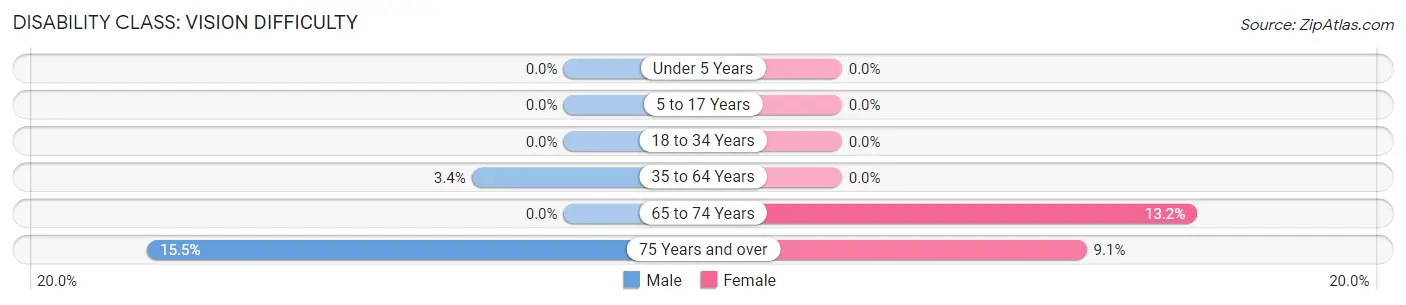
| Age Bracket | Male | Female |
| Under 5 Years | 0 (0.0%) | 0 (0.0%) |
| 5 to 17 Years | 0 (0.0%) | 0 (0.0%) |
| 18 to 34 Years | 0 (0.0%) | 0 (0.0%) |
| 35 to 64 Years | 55 (3.4%) | 0 (0.0%) |
| 65 to 74 Years | 0 (0.0%) | 36 (13.2%) |
| 75 Years and over | 17 (15.4%) | 11 (9.1%) |
Disability Class: Cognitive Difficulty
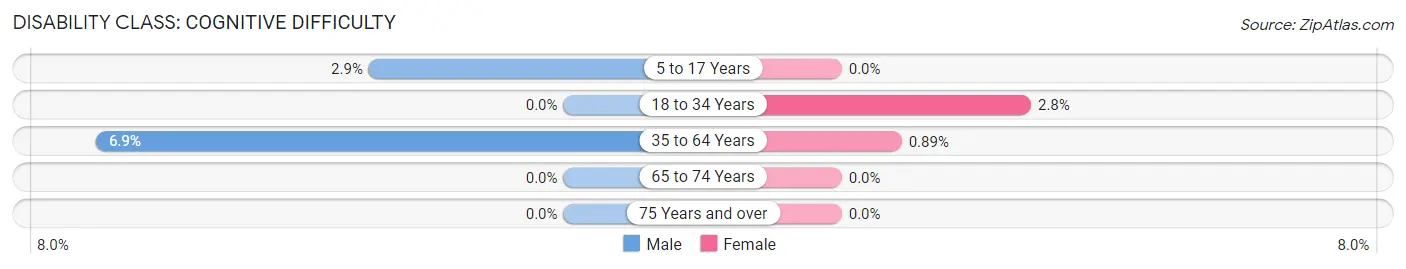
| Age Bracket | Male | Female |
| 5 to 17 Years | 19 (2.9%) | 0 (0.0%) |
| 18 to 34 Years | 0 (0.0%) | 15 (2.8%) |
| 35 to 64 Years | 112 (6.9%) | 13 (0.9%) |
| 65 to 74 Years | 0 (0.0%) | 0 (0.0%) |
| 75 Years and over | 0 (0.0%) | 0 (0.0%) |
Disability Class: Ambulatory Difficulty
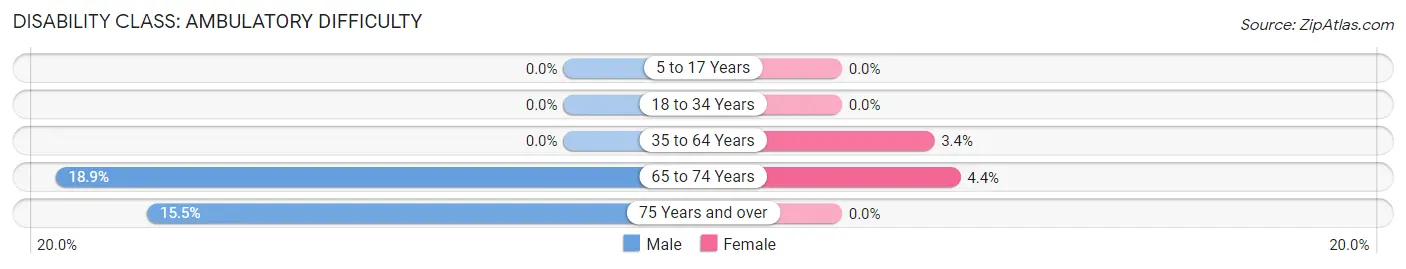
| Age Bracket | Male | Female |
| 5 to 17 Years | 0 (0.0%) | 0 (0.0%) |
| 18 to 34 Years | 0 (0.0%) | 0 (0.0%) |
| 35 to 64 Years | 0 (0.0%) | 50 (3.4%) |
| 65 to 74 Years | 59 (18.9%) | 12 (4.4%) |
| 75 Years and over | 17 (15.4%) | 0 (0.0%) |
Disability Class: Self-Care Difficulty
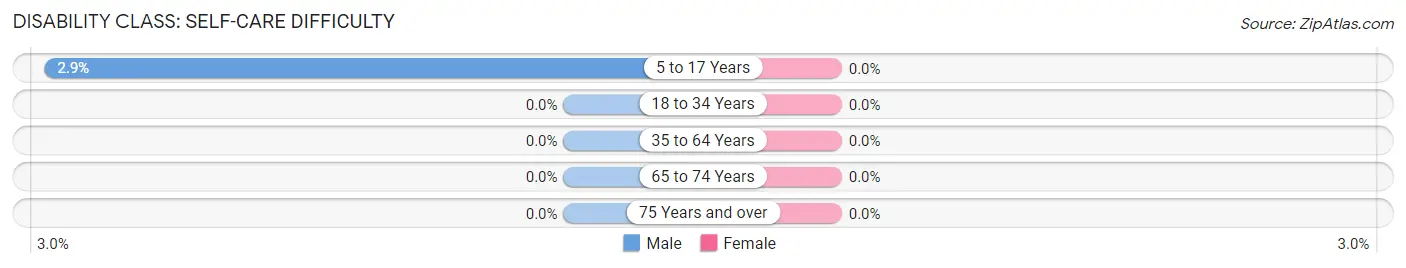
| Age Bracket | Male | Female |
| 5 to 17 Years | 19 (2.9%) | 0 (0.0%) |
| 18 to 34 Years | 0 (0.0%) | 0 (0.0%) |
| 35 to 64 Years | 0 (0.0%) | 0 (0.0%) |
| 65 to 74 Years | 0 (0.0%) | 0 (0.0%) |
| 75 Years and over | 0 (0.0%) | 0 (0.0%) |
Technology Access in Thompson s Station
Computing Device Access in Thompson s Station
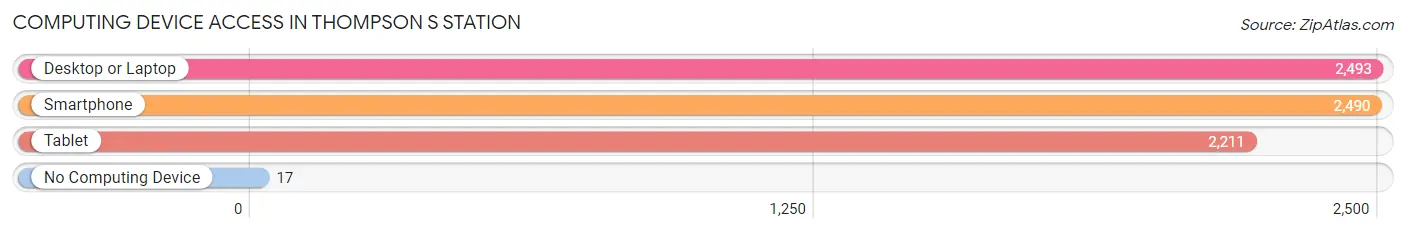
| Device Type | # Households | % Households |
| Desktop or Laptop | 2,493 | 95.7% |
| Smartphone | 2,490 | 95.6% |
| Tablet | 2,211 | 84.9% |
| No Computing Device | 17 | 0.6% |
| Total | 2,605 | 100.0% |
Internet Access in Thompson s Station
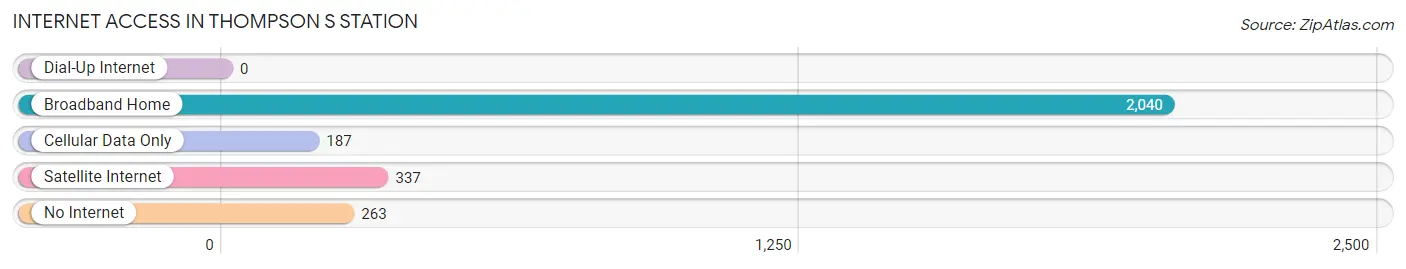
| Internet Type | # Households | % Households |
| Dial-Up Internet | 0 | 0.0% |
| Broadband Home | 2,040 | 78.3% |
| Cellular Data Only | 187 | 7.2% |
| Satellite Internet | 337 | 12.9% |
| No Internet | 263 | 10.1% |
| Total | 2,605 | 100.0% |
Thompson s Station Summary
Thompson’s Station is a small town located in Williamson County, Tennessee. It is situated about 30 miles south of Nashville and is part of the Nashville metropolitan area. The town was founded in 1817 and was named after Dr. William “Billy” Thompson, who was a prominent local doctor and landowner. The town has a population of about 2,000 people and is known for its rural charm and small-town atmosphere.
History
Thompson’s Station was founded in 1817 by Dr. William “Billy” Thompson, who was a prominent local doctor and landowner. The town was originally known as “Thompson’s Crossroads” and was located at the intersection of two major roads. The town was later renamed “Thompson’s Station” in 1854 when the Nashville and Decatur Railroad was built through the area. The railroad brought new economic opportunities to the area and helped to spur growth in the town.
In the late 19th century, Thompson’s Station was a thriving agricultural community. The town was home to several cotton gins, a grist mill, and a sawmill. The town also had a post office, a general store, and several churches.
In the early 20th century, the town began to decline as the railroad industry declined and the population began to move away. The town was nearly abandoned by the 1950s, but in the late 1970s, the town began to experience a resurgence. The town was incorporated in 1985 and has since become a popular destination for those looking for a rural lifestyle.
Geography
Thompson’s Station is located in Williamson County, Tennessee. The town is situated about 30 miles south of Nashville and is part of the Nashville metropolitan area. The town is located in a rural area and is surrounded by rolling hills and farmland. The town is located near the Harpeth River and is home to several parks and recreational areas.
Economy
Thompson’s Station is a small town with a population of about 2,000 people. The town’s economy is largely based on agriculture and tourism. The town is home to several farms and is a popular destination for those looking for a rural lifestyle. The town also has several small businesses, including restaurants, shops, and a winery.
Demographics
As of the 2010 census, the population of Thompson’s Station was 2,194. The town is predominantly white, with about 90% of the population being white. The median household income is $76,000 and the median home value is $250,000. The town has a low unemployment rate of 3.7%.
Common Questions
What is Per Capita Income in Thompson s Station?
Per Capita income in Thompson s Station is $54,316.
What is the Median Family Income in Thompson s Station?
Median Family Income in Thompson s Station is $142,726.
What is the Median Household income in Thompson s Station?
Median Household Income in Thompson s Station is $116,569.
What is Income or Wage Gap in Thompson s Station?
Income or Wage Gap in Thompson s Station is 28.3%.
Women in Thompson s Station earn 71.7 cents for every dollar earned by a man.
What is Inequality or Gini Index in Thompson s Station?
Inequality or Gini Index in Thompson s Station is 0.39.
What is the Total Population of Thompson s Station?
Total Population of Thompson s Station is 7,426.
What is the Total Male Population of Thompson s Station?
Total Male Population of Thompson s Station is 3,959.
What is the Total Female Population of Thompson s Station?
Total Female Population of Thompson s Station is 3,467.
What is the Ratio of Males per 100 Females in Thompson s Station?
There are 114.19 Males per 100 Females in Thompson s Station.
What is the Ratio of Females per 100 Males in Thompson s Station?
There are 87.57 Females per 100 Males in Thompson s Station.
What is the Median Population Age in Thompson s Station?
Median Population Age in Thompson s Station is 36.1 Years.
What is the Average Family Size in Thompson s Station
Average Family Size in Thompson s Station is 3.4 People.
What is the Average Household Size in Thompson s Station
Average Household Size in Thompson s Station is 2.9 People.
How Large is the Labor Force in Thompson s Station?
There are 4,048 People in the Labor Forcein in Thompson s Station.
What is the Percentage of People in the Labor Force in Thompson s Station?
70.8% of People are in the Labor Force in Thompson s Station.
What is the Unemployment Rate in Thompson s Station?
Unemployment Rate in Thompson s Station is 5.1%.