Zip Codes with the Highest Percentage of Families with Income Above $200,000 in Memphis, TN
RELATED REPORTS & OPTIONS
Family Income | $200k+
Memphis
Compare Zip Codes
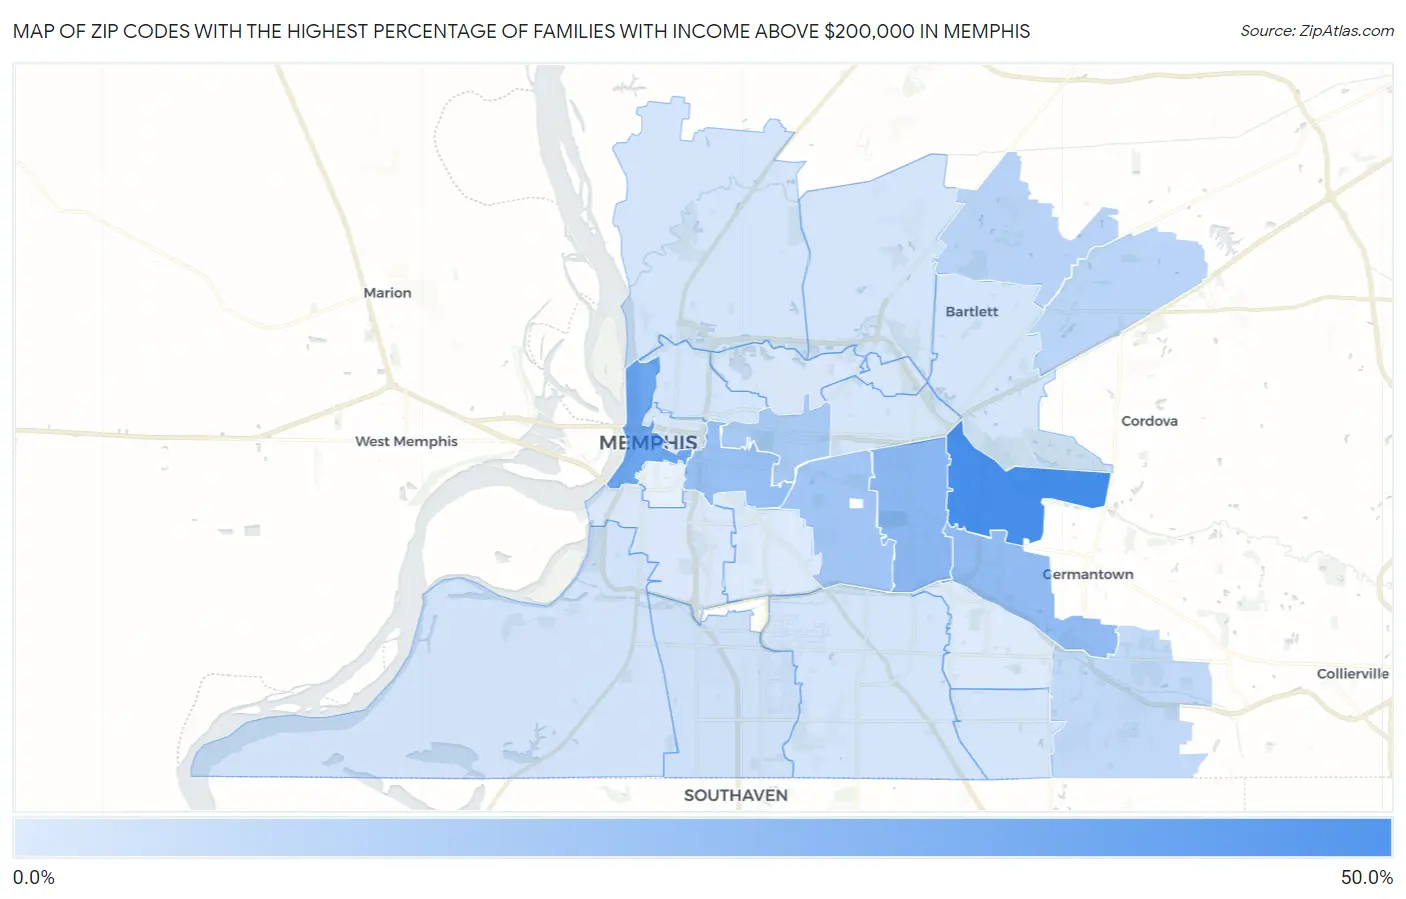
Map of Zip Codes with the Highest Percentage of Families with Income Above $200,000 in Memphis
0.60%
43.9%
Zip Codes with the Highest Percentage of Families with Income Above $200,000 in Memphis, TN
| Zip Code | Families with Income > $200k | vs State | vs National | |
| 1. | 38120 | 43.9% | 9.7%(+34.2)#8 | 14.8%(+29.1)#999 |
| 2. | 38103 | 31.4% | 9.7%(+21.7)#21 | 14.8%(+16.6)#2,310 |
| 3. | 38117 | 22.8% | 9.7%(+13.1)#31 | 14.8%(+8.00)#3,992 |
| 4. | 38119 | 20.8% | 9.7%(+11.1)#38 | 14.8%(+6.00)#4,569 |
| 5. | 38104 | 18.7% | 9.7%(+9.00)#43 | 14.8%(+3.90)#5,283 |
| 6. | 38111 | 15.9% | 9.7%(+6.20)#55 | 14.8%(+1.10)#6,488 |
| 7. | 38112 | 14.5% | 9.7%(+4.80)#64 | 14.8%(-0.300)#7,272 |
| 8. | 38135 | 10.1% | 9.7%(+0.400)#115 | 14.8%(-4.70)#10,691 |
| 9. | 38133 | 9.1% | 9.7%(-0.600)#130 | 14.8%(-5.70)#11,782 |
| 10. | 38125 | 7.5% | 9.7%(-2.20)#172 | 14.8%(-7.30)#13,863 |
| 11. | 38116 | 3.8% | 9.7%(-5.90)#347 | 14.8%(-11.0)#20,829 |
| 12. | 38109 | 3.4% | 9.7%(-6.30)#370 | 14.8%(-11.4)#21,648 |
| 13. | 38127 | 2.8% | 9.7%(-6.90)#410 | 14.8%(-12.0)#22,884 |
| 14. | 38128 | 2.7% | 9.7%(-7.00)#417 | 14.8%(-12.1)#23,077 |
| 15. | 38134 | 2.7% | 9.7%(-7.00)#418 | 14.8%(-12.1)#23,078 |
| 16. | 38107 | 2.7% | 9.7%(-7.00)#419 | 14.8%(-12.1)#23,120 |
| 17. | 38118 | 2.6% | 9.7%(-7.10)#425 | 14.8%(-12.2)#23,298 |
| 18. | 38141 | 2.6% | 9.7%(-7.10)#427 | 14.8%(-12.2)#23,318 |
| 19. | 38122 | 2.5% | 9.7%(-7.20)#433 | 14.8%(-12.3)#23,496 |
| 20. | 38105 | 1.7% | 9.7%(-8.00)#470 | 14.8%(-13.1)#25,021 |
| 21. | 38108 | 1.6% | 9.7%(-8.10)#474 | 14.8%(-13.2)#25,167 |
| 22. | 38106 | 1.0% | 9.7%(-8.70)#508 | 14.8%(-13.8)#26,077 |
| 23. | 38114 | 0.80% | 9.7%(-8.90)#513 | 14.8%(-14.0)#26,348 |
| 24. | 38115 | 0.60% | 9.7%(-9.10)#521 | 14.8%(-14.2)#26,582 |
1
Common Questions
What are the Top 10 Zip Codes with the Highest Percentage of Families with Income Above $200,000 in Memphis, TN?
Top 10 Zip Codes with the Highest Percentage of Families with Income Above $200,000 in Memphis, TN are:
What zip code has the Highest Percentage of Families with Income Above $200,000 in Memphis, TN?
38120 has the Highest Percentage of Families with Income Above $200,000 in Memphis, TN with 43.9%.
What is the Percentage of Families with Income Above $200,000 in Memphis, TN?
Percentage of Families with Income Above $200,000 in Memphis is 7.9%.
What is the Percentage of Families with Income Above $200,000 in Tennessee?
Percentage of Families with Income Above $200,000 in Tennessee is 9.7%.
What is the Percentage of Families with Income Above $200,000 in the United States?
Percentage of Families with Income Above $200,000 in the United States is 14.8%.