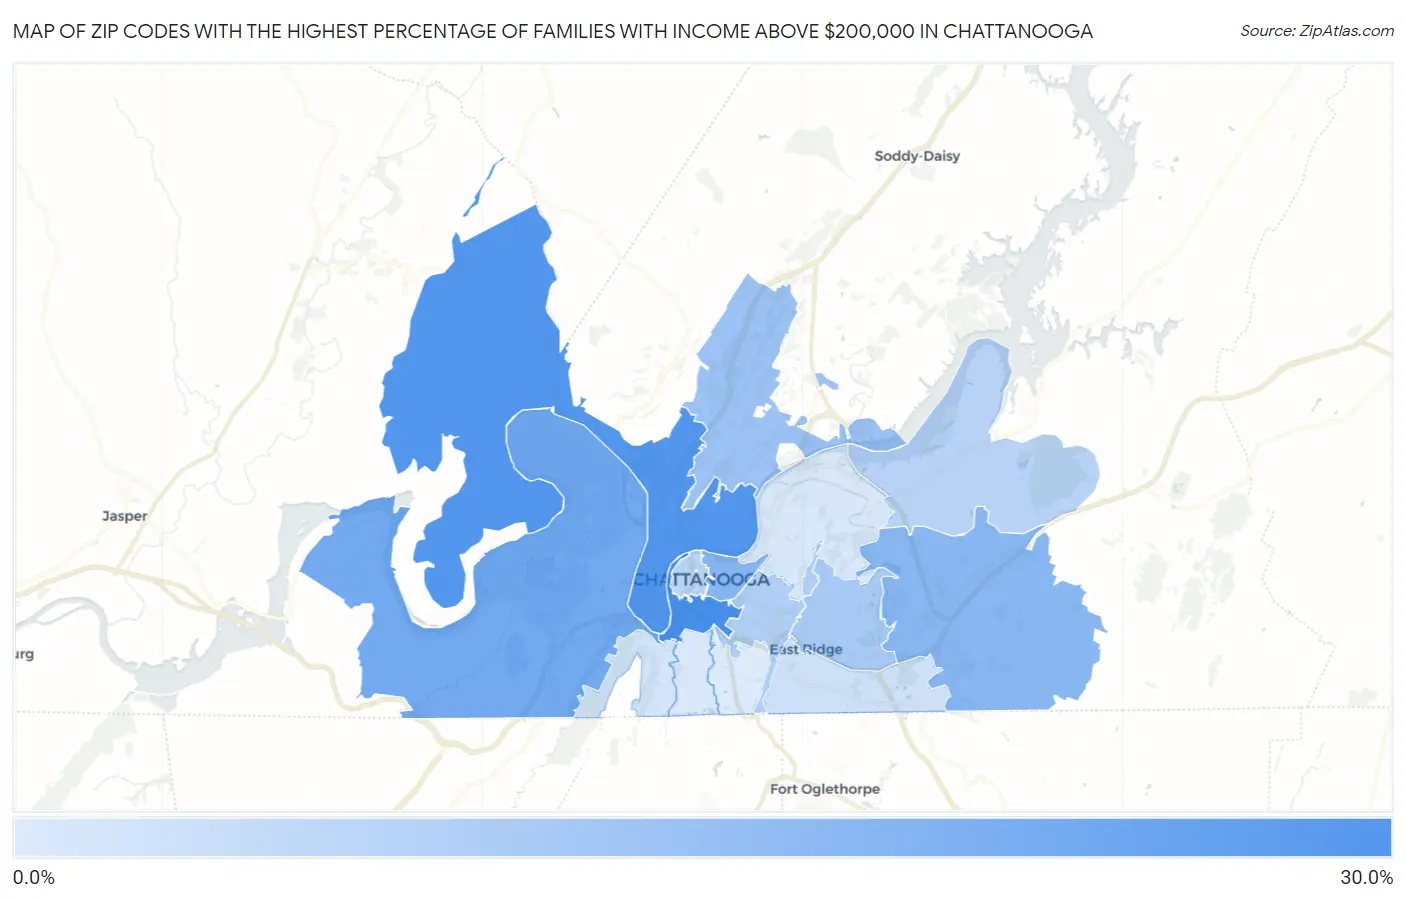
Zip Codes with the Highest Percentage of Families with Income Above $200,000 in Chattanooga, TN
RELATED REPORTS & OPTIONS
Family Income | $200k+
Chattanooga
Compare Zip Codes
Map of Zip Codes with the Highest Percentage of Families with Income Above $200,000 in Chattanooga
0.30%
26.9%
Zip Codes with the Highest Percentage of Families with Income Above $200,000 in Chattanooga, TN
| Zip Code | Families with Income > $200k | vs State | vs National | |
| 1. | 37408 | 26.9% | 9.7%(+17.2)#26 | 14.8%(+12.1)#3,072 |
| 2. | 37405 | 24.6% | 9.7%(+14.9)#29 | 14.8%(+9.80)#3,572 |
| 3. | 37419 | 18.4% | 9.7%(+8.70)#46 | 14.8%(+3.60)#5,426 |
| 4. | 37403 | 14.8% | 9.7%(+5.10)#58 | 14.8%(=0.000)#7,102 |
| 5. | 37421 | 14.6% | 9.7%(+4.90)#61 | 14.8%(-0.200)#7,203 |
| 6. | 37415 | 11.0% | 9.7%(+1.30)#95 | 14.8%(-3.80)#9,818 |
| 7. | 37411 | 9.0% | 9.7%(-0.700)#133 | 14.8%(-5.80)#11,915 |
| 8. | 37404 | 7.6% | 9.7%(-2.10)#170 | 14.8%(-7.20)#13,744 |
| 9. | 37416 | 6.1% | 9.7%(-3.60)#222 | 14.8%(-8.70)#16,286 |
| 10. | 37402 | 5.8% | 9.7%(-3.90)#236 | 14.8%(-9.00)#16,857 |
| 11. | 37412 | 2.6% | 9.7%(-7.10)#428 | 14.8%(-12.2)#23,320 |
| 12. | 37409 | 1.7% | 9.7%(-8.00)#471 | 14.8%(-13.1)#25,041 |
| 13. | 37406 | 1.2% | 9.7%(-8.50)#495 | 14.8%(-13.6)#25,790 |
| 14. | 37410 | 0.70% | 9.7%(-9.00)#518 | 14.8%(-14.1)#26,502 |
| 15. | 37407 | 0.30% | 9.7%(-9.40)#531 | 14.8%(-14.5)#26,897 |
1
Common Questions
What are the Top 10 Zip Codes with the Highest Percentage of Families with Income Above $200,000 in Chattanooga, TN?
Top 10 Zip Codes with the Highest Percentage of Families with Income Above $200,000 in Chattanooga, TN are:
What zip code has the Highest Percentage of Families with Income Above $200,000 in Chattanooga, TN?
37408 has the Highest Percentage of Families with Income Above $200,000 in Chattanooga, TN with 26.9%.
What is the Percentage of Families with Income Above $200,000 in Chattanooga, TN?
Percentage of Families with Income Above $200,000 in Chattanooga is 11.0%.
What is the Percentage of Families with Income Above $200,000 in Tennessee?
Percentage of Families with Income Above $200,000 in Tennessee is 9.7%.
What is the Percentage of Families with Income Above $200,000 in the United States?
Percentage of Families with Income Above $200,000 in the United States is 14.8%.