La Grange, TN Map & Demographics
La Grange Map
La Grange Overview
$44,562
PER CAPITA INCOME
$83,750
AVG FAMILY INCOME
$59,375
AVG HOUSEHOLD INCOME
0.37
INEQUALITY / GINI INDEX
68
TOTAL POPULATION
32
MALE POPULATION
36
FEMALE POPULATION
88.89
MALES / 100 FEMALES
112.50
FEMALES / 100 MALES
66.4
MEDIAN AGE
2.2
AVG FAMILY SIZE
1.6
AVG HOUSEHOLD SIZE
35
LABOR FORCE [ PEOPLE ]
54.7%
PERCENT IN LABOR FORCE
La Grange Zip Codes
La Grange Area Codes
Income in La Grange
Income Overview in La Grange
Per Capita Income in La Grange is $44,562, while median incomes of families and households are $83,750 and $59,375 respectively.
| Characteristic | Number | Measure |
| Per Capita Income | 68 | $44,562 |
| Median Family Income | 21 | $83,750 |
| Mean Family Income | 21 | $96,057 |
| Median Household Income | 43 | $59,375 |
| Mean Household Income | 43 | $71,521 |
| Income Deficit | 21 | $0 |
| Wage / Income Gap (%) | 68 | 0.00% |
| Wage / Income Gap ($) | 68 | 100.00¢ per $1 |
| Gini / Inequality Index | 68 | 0.37 |
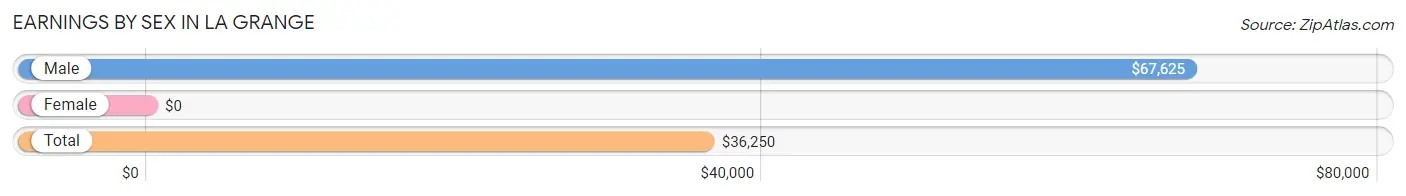
Earnings by Sex in La Grange
| Sex | Number | Average Earnings |
| Male | 23 (57.5%) | $67,625 |
| Female | 17 (42.5%) | $0 |
| Total | 40 (100.0%) | $36,250 |
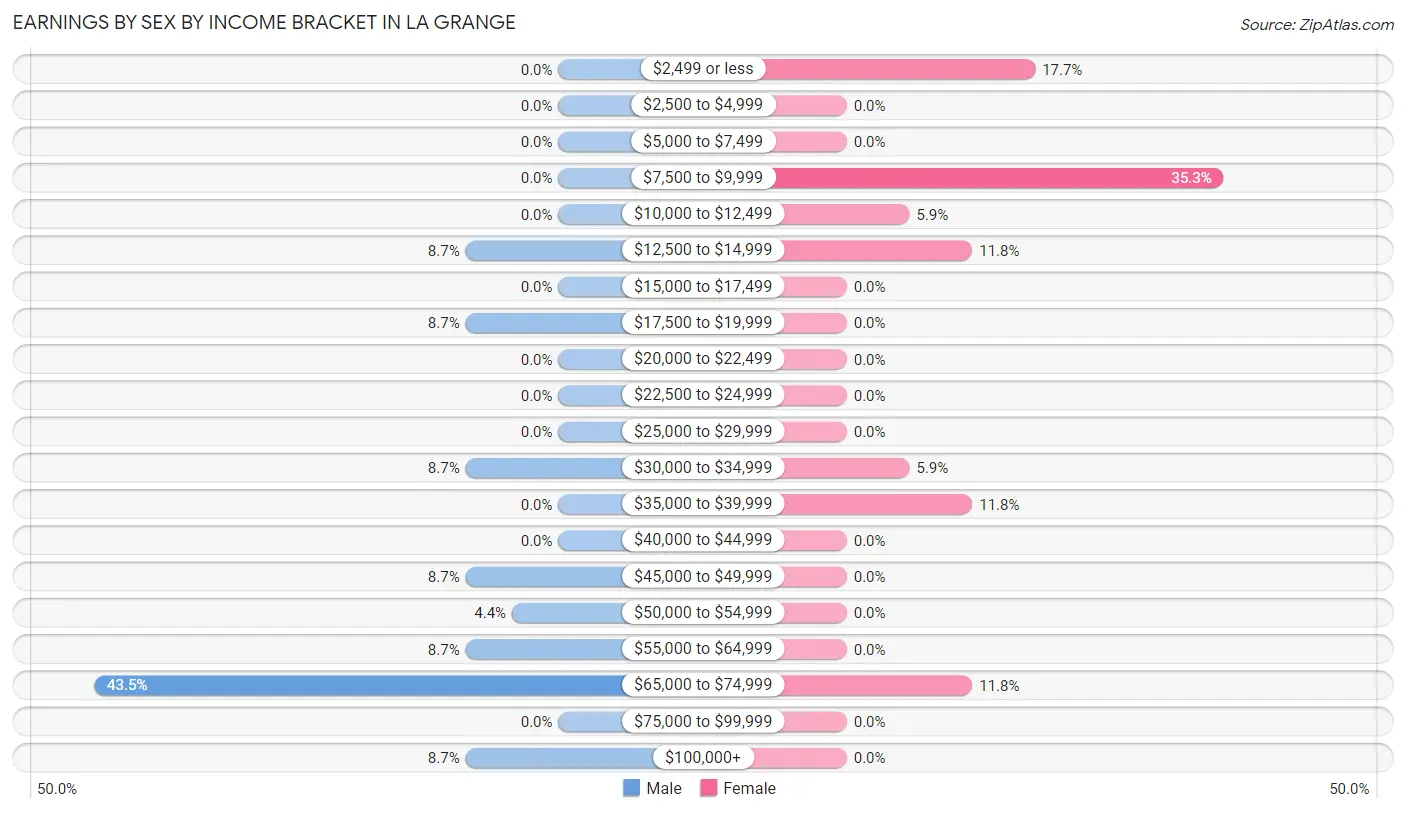
Earnings by Sex by Income Bracket in La Grange
The most common earnings brackets in La Grange are $65,000 to $74,999 for men (10 | 43.5%) and $7,500 to $9,999 for women (6 | 35.3%).
| Income | Male | Female |
| $2,499 or less | 0 (0.0%) | 3 (17.6%) |
| $2,500 to $4,999 | 0 (0.0%) | 0 (0.0%) |
| $5,000 to $7,499 | 0 (0.0%) | 0 (0.0%) |
| $7,500 to $9,999 | 0 (0.0%) | 6 (35.3%) |
| $10,000 to $12,499 | 0 (0.0%) | 1 (5.9%) |
| $12,500 to $14,999 | 2 (8.7%) | 2 (11.8%) |
| $15,000 to $17,499 | 0 (0.0%) | 0 (0.0%) |
| $17,500 to $19,999 | 2 (8.7%) | 0 (0.0%) |
| $20,000 to $22,499 | 0 (0.0%) | 0 (0.0%) |
| $22,500 to $24,999 | 0 (0.0%) | 0 (0.0%) |
| $25,000 to $29,999 | 0 (0.0%) | 0 (0.0%) |
| $30,000 to $34,999 | 2 (8.7%) | 1 (5.9%) |
| $35,000 to $39,999 | 0 (0.0%) | 2 (11.8%) |
| $40,000 to $44,999 | 0 (0.0%) | 0 (0.0%) |
| $45,000 to $49,999 | 2 (8.7%) | 0 (0.0%) |
| $50,000 to $54,999 | 1 (4.3%) | 0 (0.0%) |
| $55,000 to $64,999 | 2 (8.7%) | 0 (0.0%) |
| $65,000 to $74,999 | 10 (43.5%) | 2 (11.8%) |
| $75,000 to $99,999 | 0 (0.0%) | 0 (0.0%) |
| $100,000+ | 2 (8.7%) | 0 (0.0%) |
| Total | 23 (100.0%) | 17 (100.0%) |
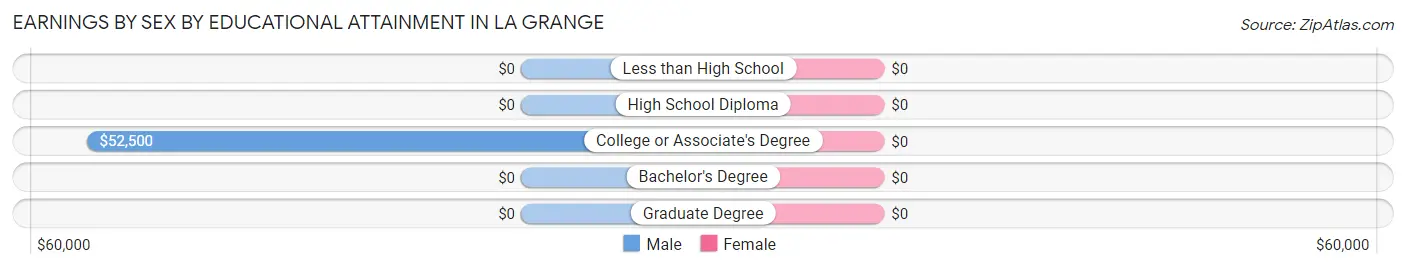
Earnings by Sex by Educational Attainment in La Grange
| Educational Attainment | Male Income | Female Income |
| Less than High School | - | - |
| High School Diploma | - | - |
| College or Associate's Degree | $52,500 | $0 |
| Bachelor's Degree | - | - |
| Graduate Degree | - | - |
| Total | $62,500 | $0 |
Family Income in La Grange
Family Income Brackets in La Grange
According to the La Grange family income data, there are 9 families falling into the $35,000 to $49,999 income range, which is the most common income bracket and makes up 42.9% of all families.
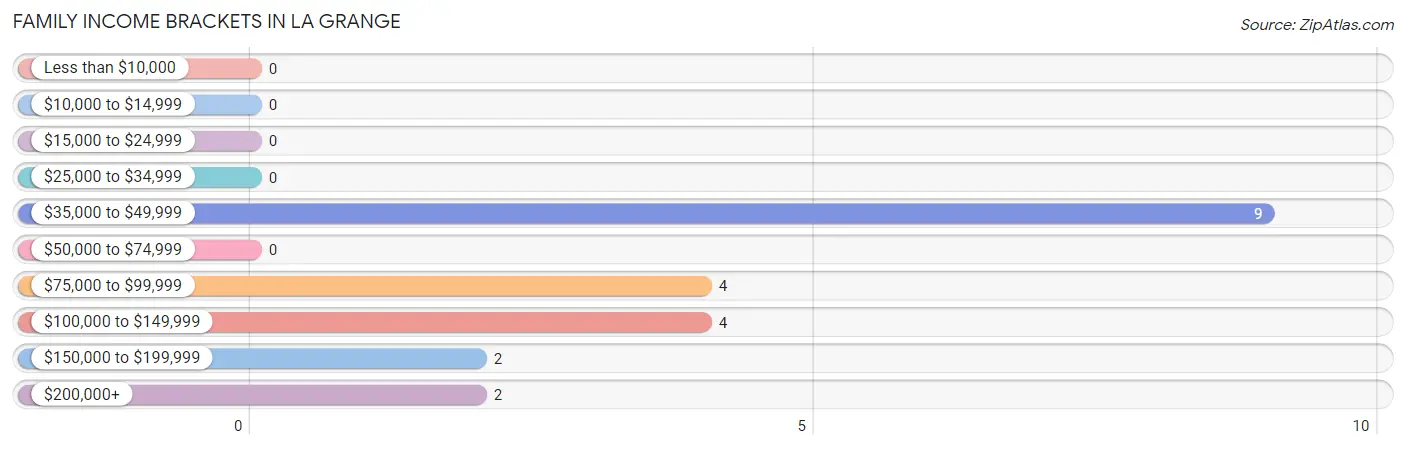
| Income Bracket | # Families | % Families |
| Less than $10,000 | 0 | 0.0% |
| $10,000 to $14,999 | 0 | 0.0% |
| $15,000 to $24,999 | 0 | 0.0% |
| $25,000 to $34,999 | 0 | 0.0% |
| $35,000 to $49,999 | 9 | 42.9% |
| $50,000 to $74,999 | 0 | 0.0% |
| $75,000 to $99,999 | 4 | 19.0% |
| $100,000 to $149,999 | 4 | 19.0% |
| $150,000 to $199,999 | 2 | 9.5% |
| $200,000+ | 2 | 9.5% |
Family Income by Famaliy Size in La Grange
2-person families (16 | 76.2%) account for the highest median family income in La Grange with $87,500 per family, while 2-person families (16 | 76.2%) have the highest median income of $43,750 per family member.
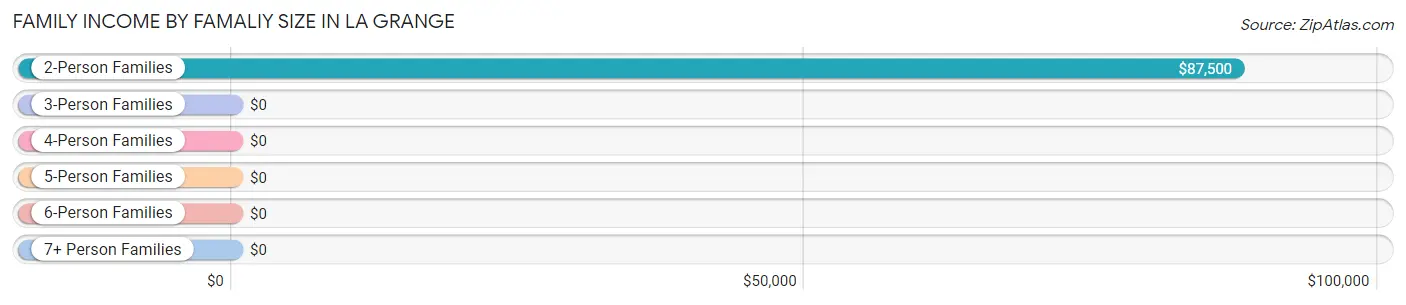
| Income Bracket | # Families | Median Income |
| 2-Person Families | 16 (76.2%) | $87,500 |
| 3-Person Families | 4 (19.1%) | $0 |
| 4-Person Families | 1 (4.8%) | $0 |
| 5-Person Families | 0 (0.0%) | $0 |
| 6-Person Families | 0 (0.0%) | $0 |
| 7+ Person Families | 0 (0.0%) | $0 |
| Total | 21 (100.0%) | $83,750 |
Family Income by Number of Earners in La Grange
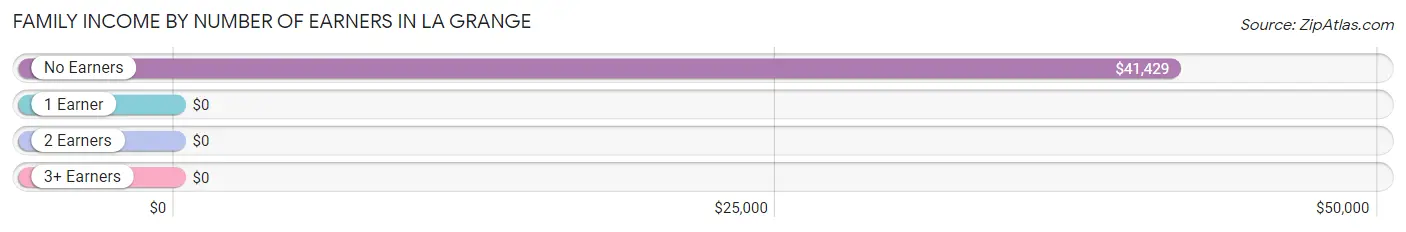
| Number of Earners | # Families | Median Income |
| No Earners | 8 (38.1%) | $41,429 |
| 1 Earner | 6 (28.6%) | $0 |
| 2 Earners | 5 (23.8%) | $0 |
| 3+ Earners | 2 (9.5%) | $0 |
| Total | 21 (100.0%) | $83,750 |
Household Income in La Grange
Household Income Brackets in La Grange
With 11 households falling in the category, the $35,000 to $49,999 income range is the most frequent in La Grange, accounting for 25.6% of all households.
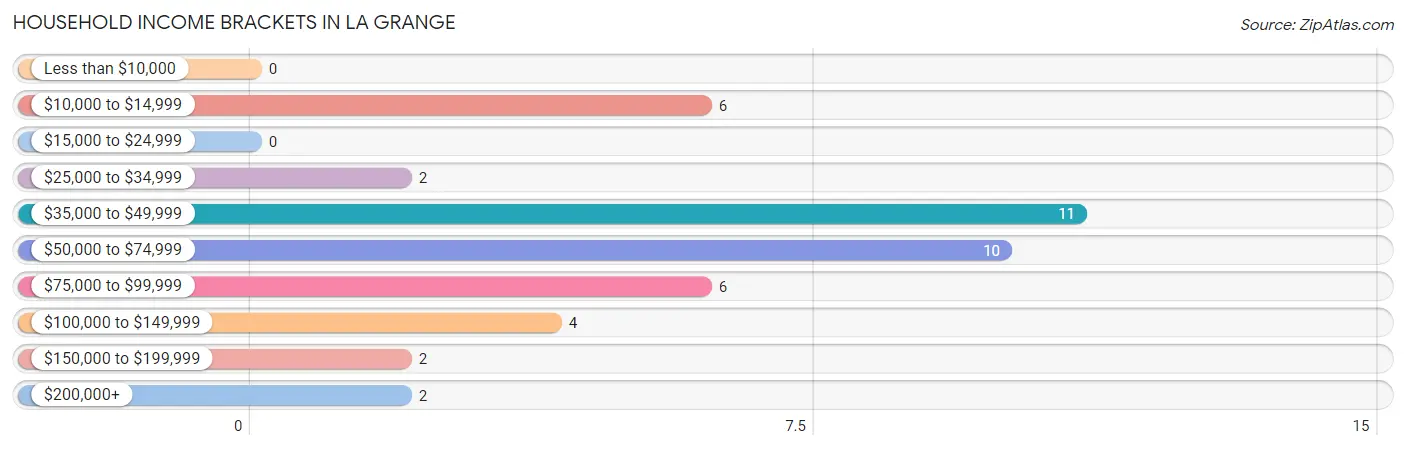
| Income Bracket | # Households | % Households |
| Less than $10,000 | 0 | 0.0% |
| $10,000 to $14,999 | 6 | 14.0% |
| $15,000 to $24,999 | 0 | 0.0% |
| $25,000 to $34,999 | 2 | 4.7% |
| $35,000 to $49,999 | 11 | 25.6% |
| $50,000 to $74,999 | 10 | 23.3% |
| $75,000 to $99,999 | 6 | 14.0% |
| $100,000 to $149,999 | 4 | 9.3% |
| $150,000 to $199,999 | 2 | 4.7% |
| $200,000+ | 2 | 4.7% |
Household Income by Householder Age in La Grange
The median household income in La Grange is $59,375, with the highest median household income of $71,964 found in the 45 to 64 years age bracket for the primary householder. A total of 15 households (34.9%) fall into this category. Meanwhile, the 15 to 24 years age bracket for the primary householder has the lowest median household income of $0, with 1 households (2.3%) in this group.
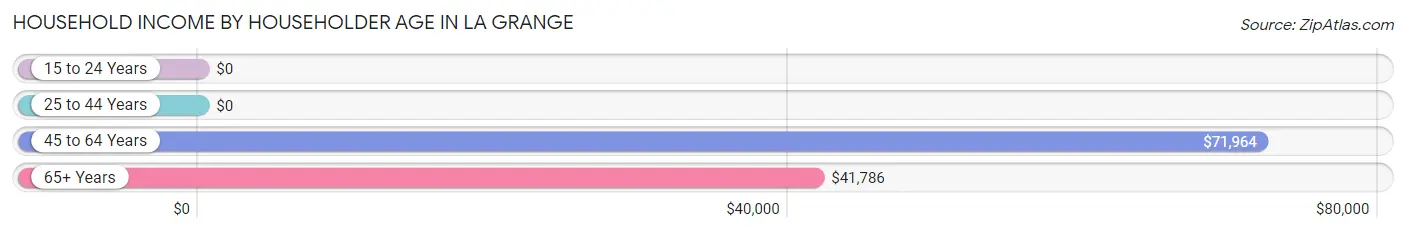
| Income Bracket | # Households | Median Income |
| 15 to 24 Years | 1 (2.3%) | $0 |
| 25 to 44 Years | 1 (2.3%) | $0 |
| 45 to 64 Years | 15 (34.9%) | $71,964 |
| 65+ Years | 26 (60.5%) | $41,786 |
| Total | 43 (100.0%) | $59,375 |
Poverty in La Grange
Income Below Poverty by Sex and Age in La Grange
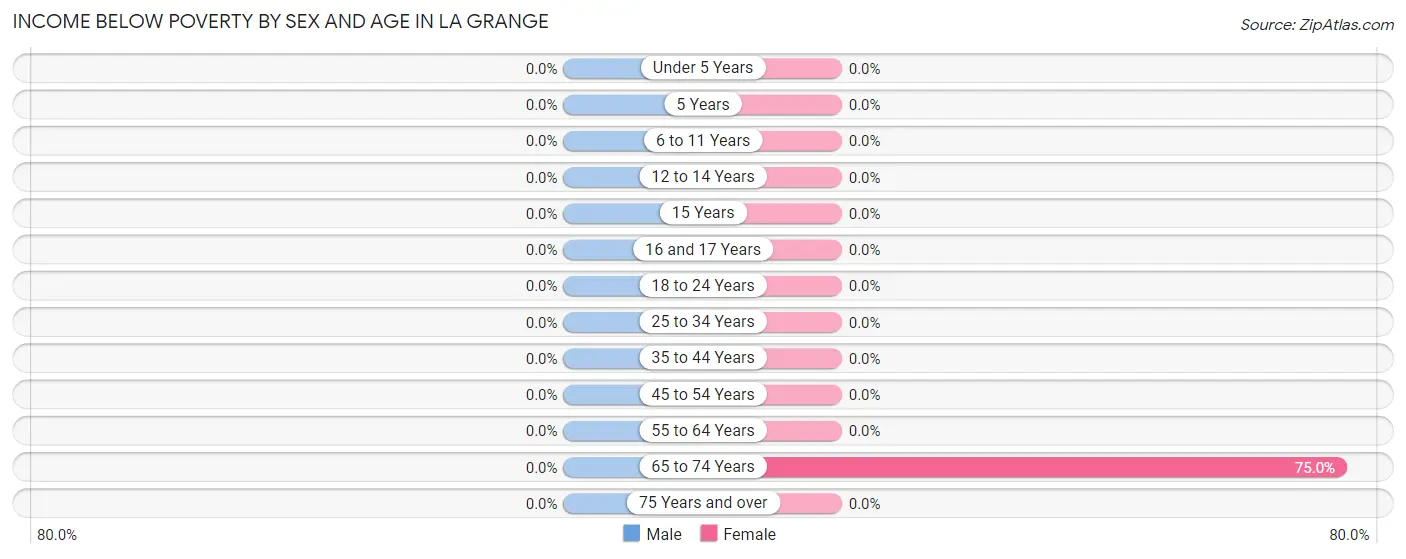
| Age Bracket | Male | Female |
| Under 5 Years | 0 (0.0%) | 0 (0.0%) |
| 5 Years | 0 (0.0%) | 0 (0.0%) |
| 6 to 11 Years | 0 (0.0%) | 0 (0.0%) |
| 12 to 14 Years | 0 (0.0%) | 0 (0.0%) |
| 15 Years | 0 (0.0%) | 0 (0.0%) |
| 16 and 17 Years | 0 (0.0%) | 0 (0.0%) |
| 18 to 24 Years | 0 (0.0%) | 0 (0.0%) |
| 25 to 34 Years | 0 (0.0%) | 0 (0.0%) |
| 35 to 44 Years | 0 (0.0%) | 0 (0.0%) |
| 45 to 54 Years | 0 (0.0%) | 0 (0.0%) |
| 55 to 64 Years | 0 (0.0%) | 0 (0.0%) |
| 65 to 74 Years | 0 (0.0%) | 6 (75.0%) |
| 75 Years and over | 0 (0.0%) | 0 (0.0%) |
| Total | 0 (0.0%) | 6 (16.7%) |
Income Above Poverty by Sex and Age in La Grange
According to the poverty statistics in La Grange, males aged 18 to 24 years and females aged under 5 years are the age groups that are most secure financially, with 100.0% of males and 100.0% of females in these age groups living above the poverty line.
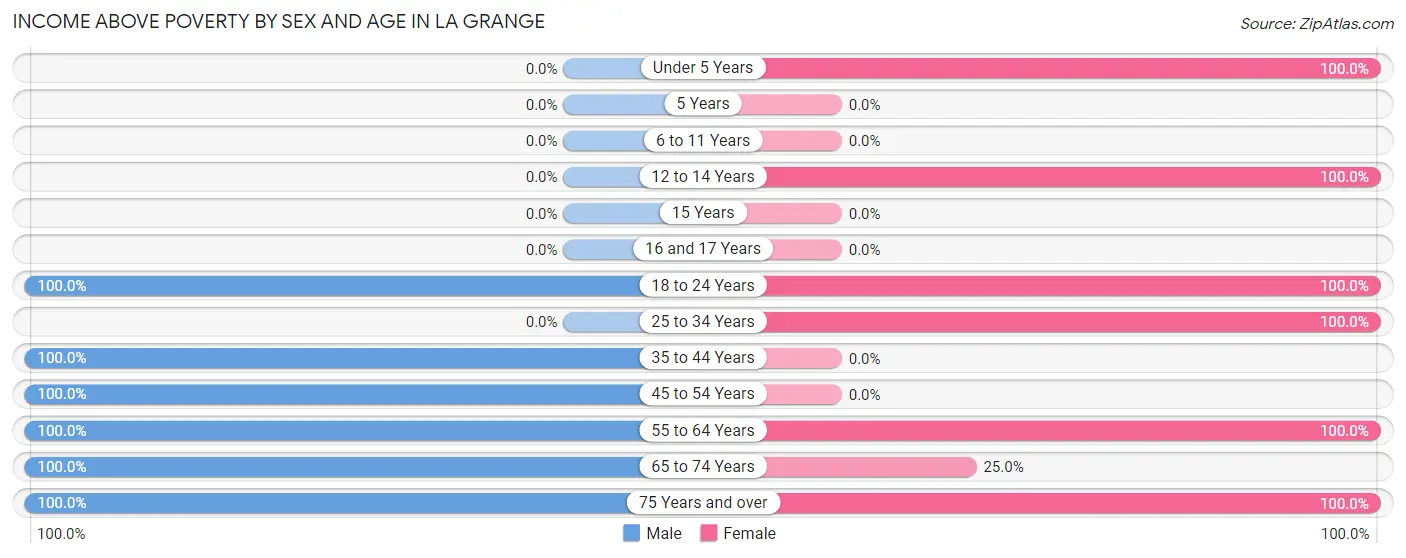
| Age Bracket | Male | Female |
| Under 5 Years | 0 (0.0%) | 2 (100.0%) |
| 5 Years | 0 (0.0%) | 0 (0.0%) |
| 6 to 11 Years | 0 (0.0%) | 0 (0.0%) |
| 12 to 14 Years | 0 (0.0%) | 2 (100.0%) |
| 15 Years | 0 (0.0%) | 0 (0.0%) |
| 16 and 17 Years | 0 (0.0%) | 0 (0.0%) |
| 18 to 24 Years | 1 (100.0%) | 1 (100.0%) |
| 25 to 34 Years | 0 (0.0%) | 2 (100.0%) |
| 35 to 44 Years | 1 (100.0%) | 0 (0.0%) |
| 45 to 54 Years | 9 (100.0%) | 0 (0.0%) |
| 55 to 64 Years | 4 (100.0%) | 9 (100.0%) |
| 65 to 74 Years | 7 (100.0%) | 2 (25.0%) |
| 75 Years and over | 10 (100.0%) | 12 (100.0%) |
| Total | 32 (100.0%) | 30 (83.3%) |
Income Below Poverty Among Married-Couple Families in La Grange
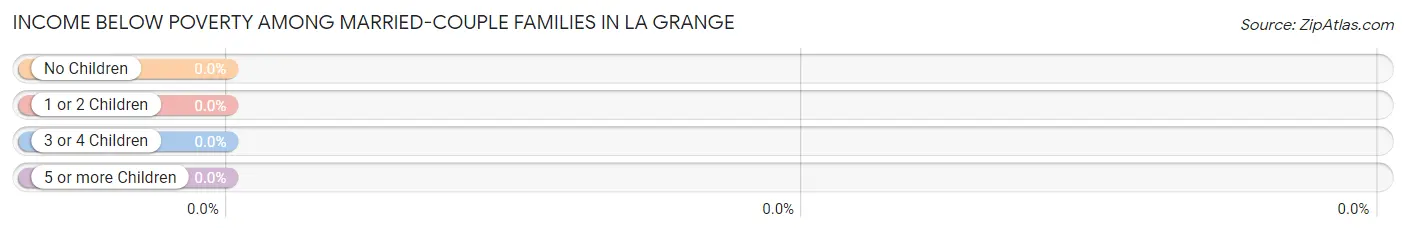
| Children | Above Poverty | Below Poverty |
| No Children | 18 (100.0%) | 0 (0.0%) |
| 1 or 2 Children | 3 (100.0%) | 0 (0.0%) |
| 3 or 4 Children | 0 (0.0%) | 0 (0.0%) |
| 5 or more Children | 0 (0.0%) | 0 (0.0%) |
| Total | 21 (100.0%) | 0 (0.0%) |
Income Below Poverty Among Single-Parent Households in La Grange
| Children | Single Father | Single Mother |
| No Children | 0 (0.0%) | 0 (0.0%) |
| 1 or 2 Children | 0 (0.0%) | 0 (0.0%) |
| 3 or 4 Children | 0 (0.0%) | 0 (0.0%) |
| 5 or more Children | 0 (0.0%) | 0 (0.0%) |
| Total | 0 (0.0%) | 0 (0.0%) |
Income Below Poverty Among Married-Couple vs Single-Parent Households in La Grange
| Children | Married-Couple Families | Single-Parent Households |
| No Children | 0 (0.0%) | 0 (0.0%) |
| 1 or 2 Children | 0 (0.0%) | 0 (0.0%) |
| 3 or 4 Children | 0 (0.0%) | 0 (0.0%) |
| 5 or more Children | 0 (0.0%) | 0 (0.0%) |
| Total | 0 (0.0%) | 0 (0.0%) |
Race in La Grange
The most populous races in La Grange are , and White / Caucasian (68 | 100.0%).
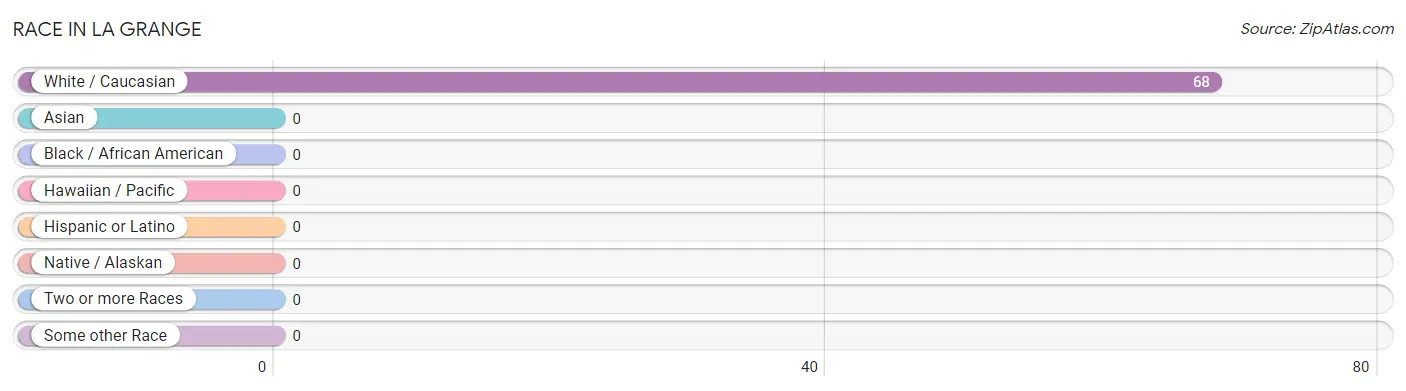
| Race | # Population | % Population |
| Asian | 0 | 0.0% |
| Black / African American | 0 | 0.0% |
| Hawaiian / Pacific | 0 | 0.0% |
| Hispanic or Latino | 0 | 0.0% |
| Native / Alaskan | 0 | 0.0% |
| White / Caucasian | 68 | 100.0% |
| Two or more Races | 0 | 0.0% |
| Some other Race | 0 | 0.0% |
| Total | 68 | 100.0% |
Ancestry in La Grange
The most populous ancestries reported in La Grange are English (22 | 32.4%), American (15 | 22.1%), Scotch-Irish (11 | 16.2%), Irish (9 | 13.2%), and German (2 | 2.9%), together accounting for 86.8% of all La Grange residents.
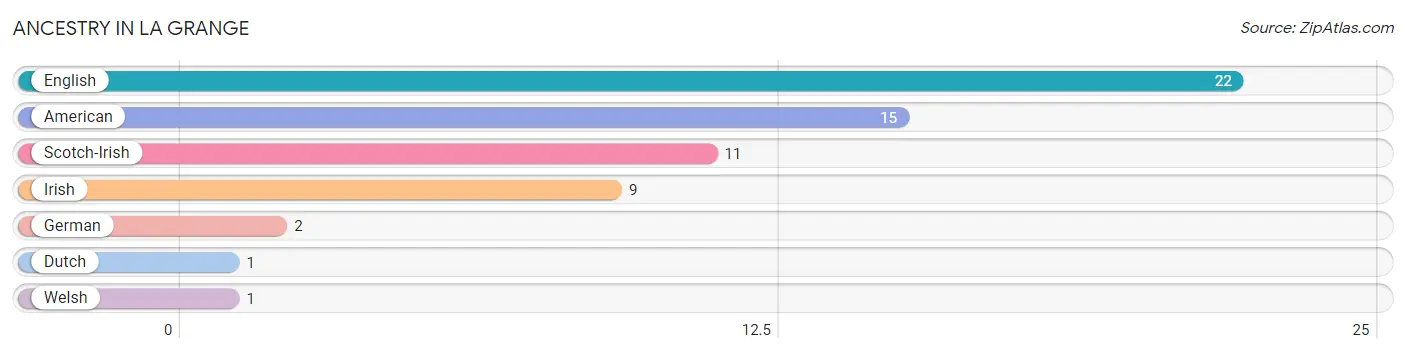
| Ancestry | # Population | % Population |
| American | 15 | 22.1% |
| Dutch | 1 | 1.5% |
| English | 22 | 32.4% |
| German | 2 | 2.9% |
| Irish | 9 | 13.2% |
| Scotch-Irish | 11 | 16.2% |
| Welsh | 1 | 1.5% | View All 7 Rows |
Immigrants in La Grange

| Immigration Origin | # Population | % Population | View All 0 Rows |
Sex and Age in La Grange
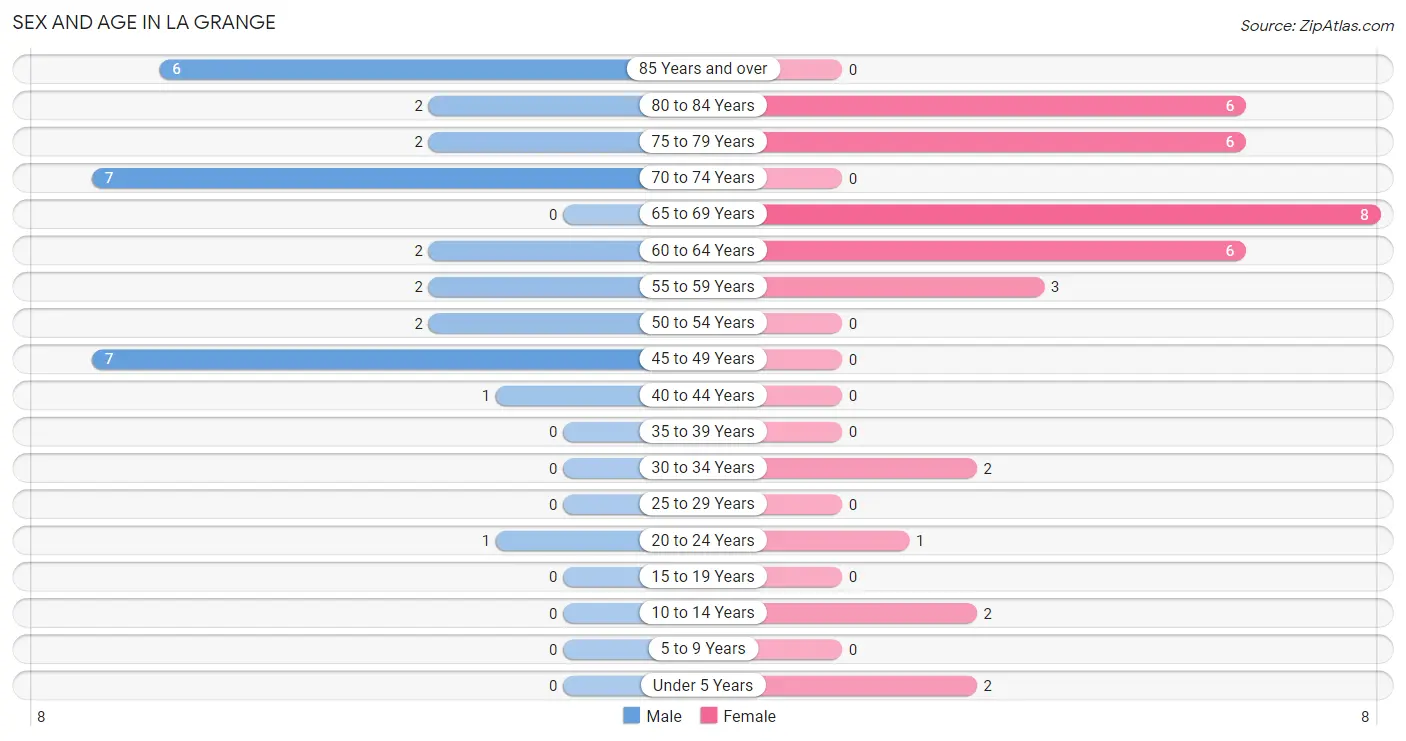
Sex and Age in La Grange
The most populous age groups in La Grange are 45 to 49 Years (7 | 21.9%) for men and 65 to 69 Years (8 | 22.2%) for women.
| Age Bracket | Male | Female |
| Under 5 Years | 0 (0.0%) | 2 (5.6%) |
| 5 to 9 Years | 0 (0.0%) | 0 (0.0%) |
| 10 to 14 Years | 0 (0.0%) | 2 (5.6%) |
| 15 to 19 Years | 0 (0.0%) | 0 (0.0%) |
| 20 to 24 Years | 1 (3.1%) | 1 (2.8%) |
| 25 to 29 Years | 0 (0.0%) | 0 (0.0%) |
| 30 to 34 Years | 0 (0.0%) | 2 (5.6%) |
| 35 to 39 Years | 0 (0.0%) | 0 (0.0%) |
| 40 to 44 Years | 1 (3.1%) | 0 (0.0%) |
| 45 to 49 Years | 7 (21.9%) | 0 (0.0%) |
| 50 to 54 Years | 2 (6.2%) | 0 (0.0%) |
| 55 to 59 Years | 2 (6.2%) | 3 (8.3%) |
| 60 to 64 Years | 2 (6.2%) | 6 (16.7%) |
| 65 to 69 Years | 0 (0.0%) | 8 (22.2%) |
| 70 to 74 Years | 7 (21.9%) | 0 (0.0%) |
| 75 to 79 Years | 2 (6.2%) | 6 (16.7%) |
| 80 to 84 Years | 2 (6.2%) | 6 (16.7%) |
| 85 Years and over | 6 (18.8%) | 0 (0.0%) |
| Total | 32 (100.0%) | 36 (100.0%) |
Families and Households in La Grange
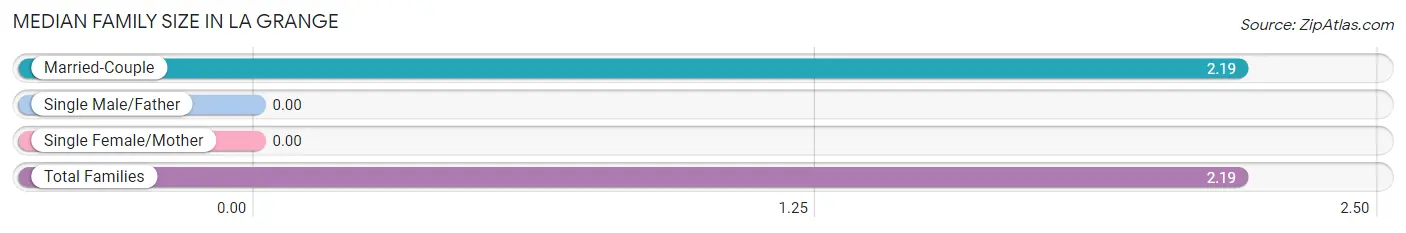
Median Family Size in La Grange
| Family Type | # Families | Family Size |
| Married-Couple | 21 (100.0%) | 2.19 |
| Single Male/Father | 0 (0.0%) | - |
| Single Female/Mother | 0 (0.0%) | - |
| Total Families | 21 (100.0%) | 2.19 |
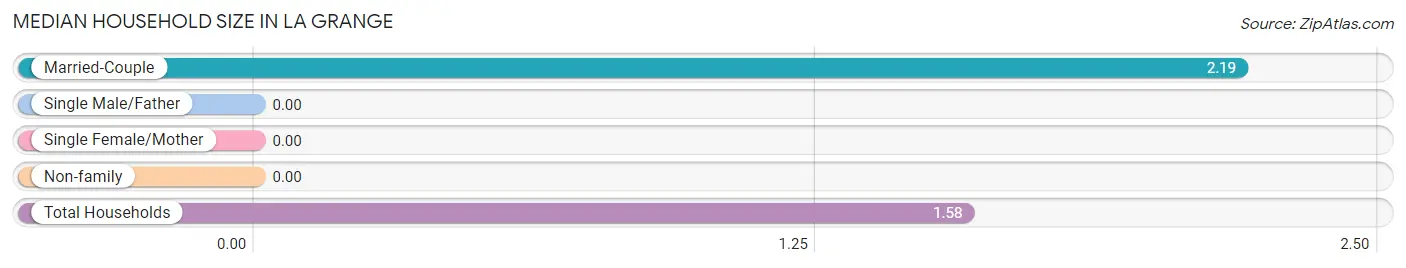
Median Household Size in La Grange
| Household Type | # Households | Household Size |
| Married-Couple | 21 (48.8%) | 2.19 |
| Single Male/Father | 0 (0.0%) | - |
| Single Female/Mother | 0 (0.0%) | - |
| Non-family | 22 (51.2%) | - |
| Total Households | 43 (100.0%) | 1.58 |
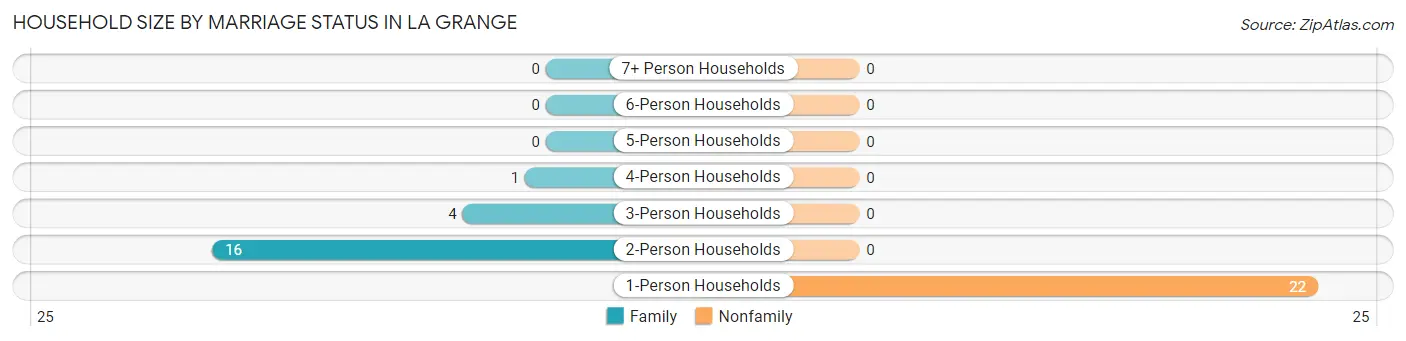
Household Size by Marriage Status in La Grange
Out of a total of 43 households in La Grange, 21 (48.8%) are family households, while 22 (51.2%) are nonfamily households. The most numerous type of family households are 2-person households, comprising 16, and the most common type of nonfamily households are 1-person households, comprising 22.
| Household Size | Family Households | Nonfamily Households |
| 1-Person Households | - | 22 (51.2%) |
| 2-Person Households | 16 (37.2%) | 0 (0.0%) |
| 3-Person Households | 4 (9.3%) | 0 (0.0%) |
| 4-Person Households | 1 (2.3%) | 0 (0.0%) |
| 5-Person Households | 0 (0.0%) | 0 (0.0%) |
| 6-Person Households | 0 (0.0%) | 0 (0.0%) |
| 7+ Person Households | 0 (0.0%) | 0 (0.0%) |
| Total | 21 (48.8%) | 22 (51.2%) |
Female Fertility in La Grange
Fertility by Age in La Grange
| Age Bracket | Women with Births | Births / 1,000 Women |
| 15 to 19 years | 0 (0.0%) | 0.0 |
| 20 to 34 years | 0 (0.0%) | 0.0 |
| 35 to 50 years | 0 (0.0%) | 0.0 |
| Total | 0 (0.0%) | 0.0 |
Fertility by Age by Marriage Status in La Grange
| Age Bracket | Married | Unmarried |
| 15 to 19 years | 0 (0.0%) | 0 (0.0%) |
| 20 to 34 years | 0 (0.0%) | 0 (0.0%) |
| 35 to 50 years | 0 (0.0%) | 0 (0.0%) |
| Total | 0 (0.0%) | 0 (0.0%) |
Fertility by Education in La Grange
| Educational Attainment | Women with Births | Births / 1,000 Women |
| Less than High School | 0 (0.0%) | 0.0 |
| High School Diploma | 0 (0.0%) | 0.0 |
| College or Associate's Degree | 0 (0.0%) | 0.0 |
| Bachelor's Degree | 0 (0.0%) | 0.0 |
| Graduate Degree | 0 (0.0%) | 0.0 |
| Total | 0 (0.0%) | 0.0 |
Fertility by Education by Marriage Status in La Grange
| Educational Attainment | Married | Unmarried |
| Less than High School | 0 (0.0%) | 0 (0.0%) |
| High School Diploma | 0 (0.0%) | 0 (0.0%) |
| College or Associate's Degree | 0 (0.0%) | 0 (0.0%) |
| Bachelor's Degree | 0 (0.0%) | 0 (0.0%) |
| Graduate Degree | 0 (0.0%) | 0 (0.0%) |
| Total | 0 (0.0%) | 0 (0.0%) |
Employment Characteristics in La Grange
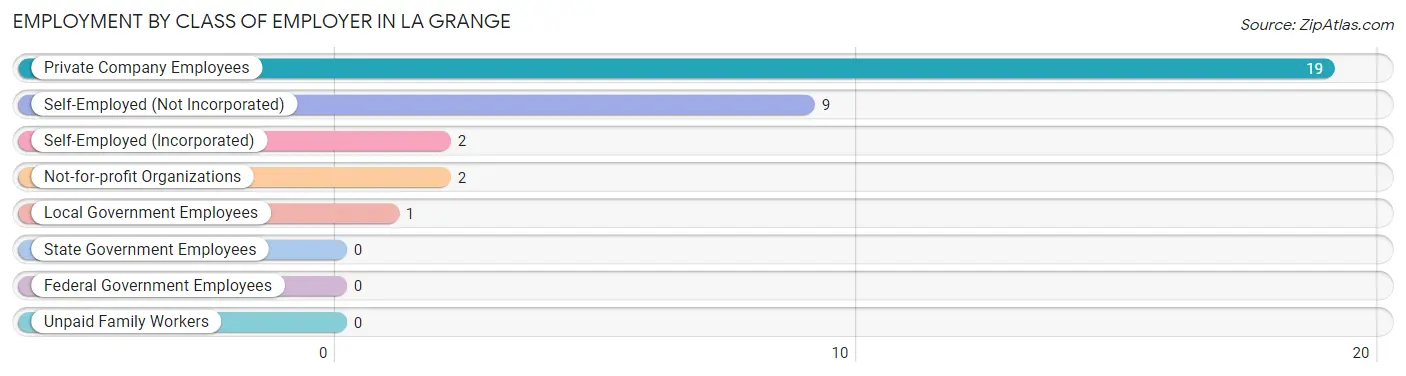
Employment by Class of Employer in La Grange
Among the 33 employed individuals in La Grange, private company employees (19 | 57.6%), self-employed (not incorporated) (9 | 27.3%), and self-employed (incorporated) (2 | 6.1%) make up the most common classes of employment.
| Employer Class | # Employees | % Employees |
| Private Company Employees | 19 | 57.6% |
| Self-Employed (Incorporated) | 2 | 6.1% |
| Self-Employed (Not Incorporated) | 9 | 27.3% |
| Not-for-profit Organizations | 2 | 6.1% |
| Local Government Employees | 1 | 3.0% |
| State Government Employees | 0 | 0.0% |
| Federal Government Employees | 0 | 0.0% |
| Unpaid Family Workers | 0 | 0.0% |
| Total | 33 | 100.0% |
Employment Status by Age in La Grange
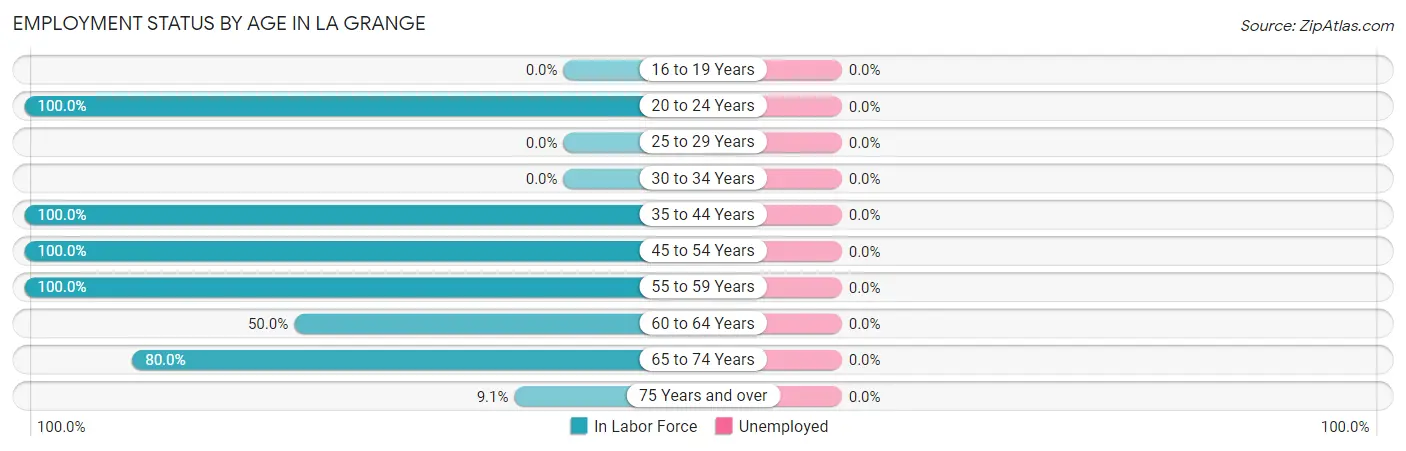
| Age Bracket | In Labor Force | Unemployed |
| 16 to 19 Years | 0 (0.0%) | 0 (0.0%) |
| 20 to 24 Years | 2 (100.0%) | 0 (0.0%) |
| 25 to 29 Years | 0 (0.0%) | 0 (0.0%) |
| 30 to 34 Years | 0 (0.0%) | 0 (0.0%) |
| 35 to 44 Years | 1 (100.0%) | 0 (0.0%) |
| 45 to 54 Years | 9 (100.0%) | 0 (0.0%) |
| 55 to 59 Years | 5 (100.0%) | 0 (0.0%) |
| 60 to 64 Years | 4 (50.0%) | 0 (0.0%) |
| 65 to 74 Years | 12 (80.0%) | 0 (0.0%) |
| 75 Years and over | 2 (9.1%) | 0 (0.0%) |
| Total | 35 (54.7%) | 0 (0.0%) |
Employment Status by Educational Attainment in La Grange
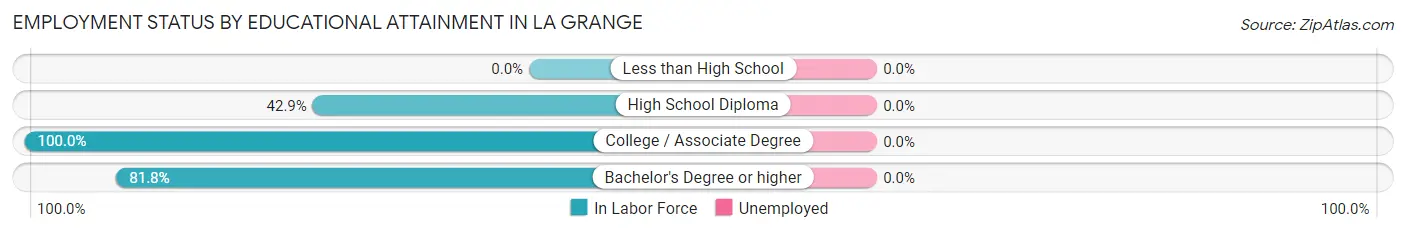
| Educational Attainment | In Labor Force | Unemployed |
| Less than High School | 0 (0.0%) | 0 (0.0%) |
| High School Diploma | 3 (42.9%) | 0 (0.0%) |
| College / Associate Degree | 7 (100.0%) | 0 (0.0%) |
| Bachelor's Degree or higher | 9 (81.8%) | 0 (0.0%) |
| Total | 19 (76.0%) | 0 (0.0%) |
Employment Occupations by Sex in La Grange
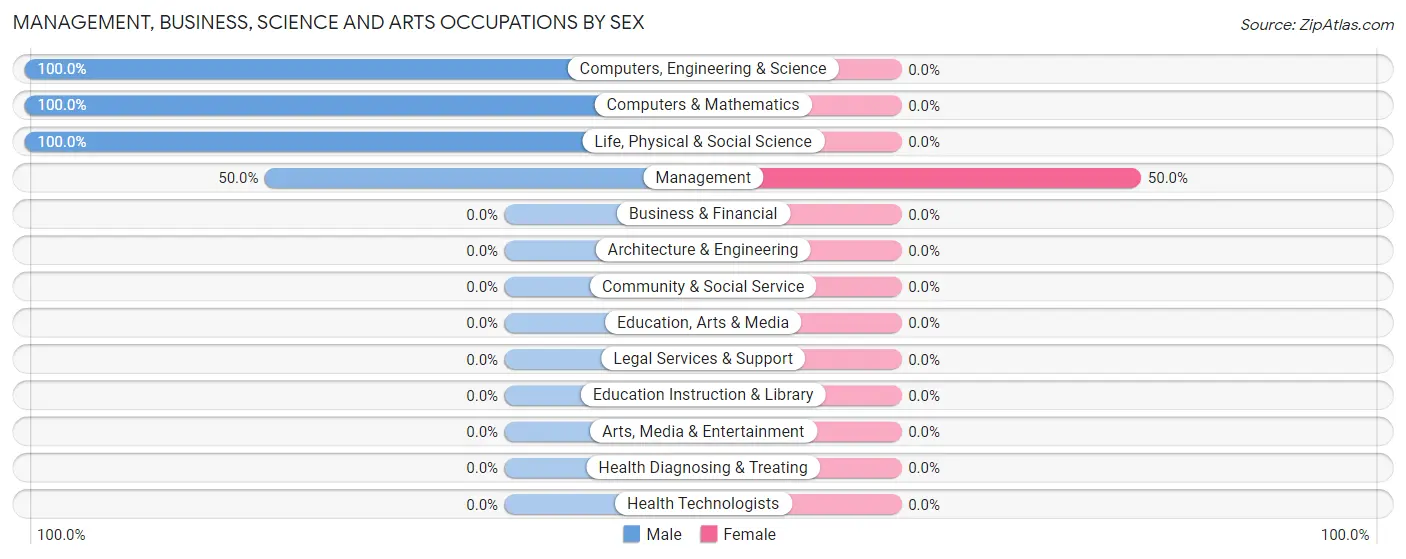
Management, Business, Science and Arts Occupations
The most common Management, Business, Science and Arts occupations in La Grange are Management (4 | 11.4%), Computers, Engineering & Science (3 | 8.6%), Computers & Mathematics (2 | 5.7%), and Life, Physical & Social Science (1 | 2.9%).
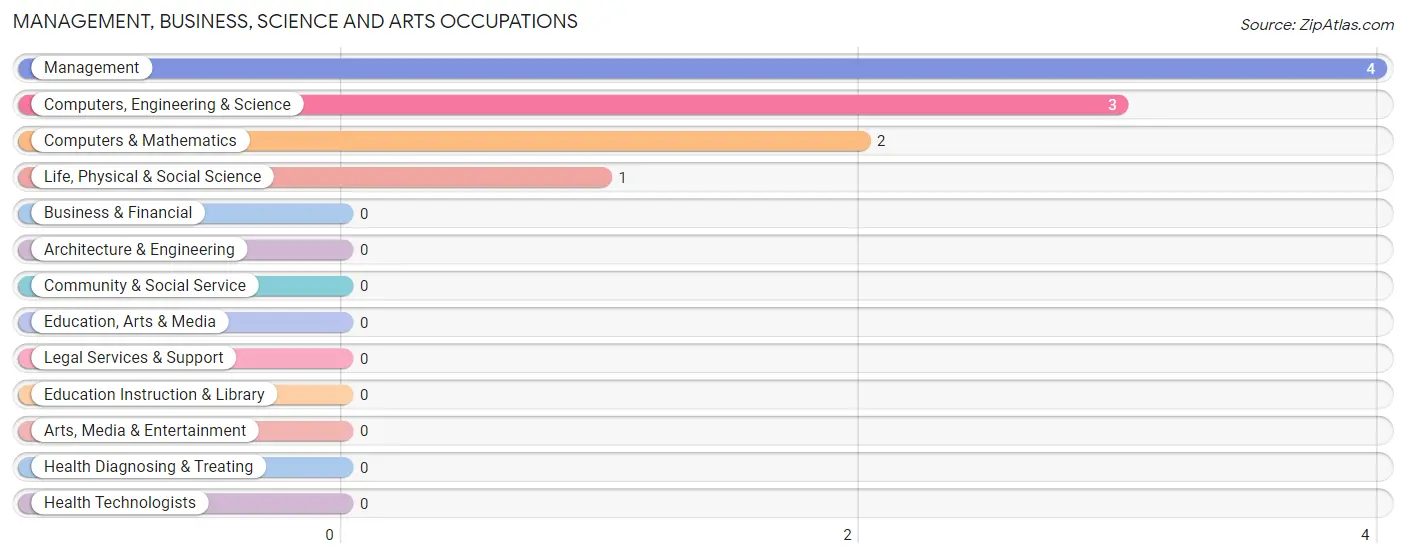
Management, Business, Science and Arts Occupations by Sex
| Occupation | Male | Female |
| Management | 2 (50.0%) | 2 (50.0%) |
| Business & Financial | 0 (0.0%) | 0 (0.0%) |
| Computers, Engineering & Science | 3 (100.0%) | 0 (0.0%) |
| Computers & Mathematics | 2 (100.0%) | 0 (0.0%) |
| Architecture & Engineering | 0 (0.0%) | 0 (0.0%) |
| Life, Physical & Social Science | 1 (100.0%) | 0 (0.0%) |
| Community & Social Service | 0 (0.0%) | 0 (0.0%) |
| Education, Arts & Media | 0 (0.0%) | 0 (0.0%) |
| Legal Services & Support | 0 (0.0%) | 0 (0.0%) |
| Education Instruction & Library | 0 (0.0%) | 0 (0.0%) |
| Arts, Media & Entertainment | 0 (0.0%) | 0 (0.0%) |
| Health Diagnosing & Treating | 0 (0.0%) | 0 (0.0%) |
| Health Technologists | 0 (0.0%) | 0 (0.0%) |
| Total (Category) | 5 (71.4%) | 2 (28.6%) |
| Total (Overall) | 21 (60.0%) | 14 (40.0%) |
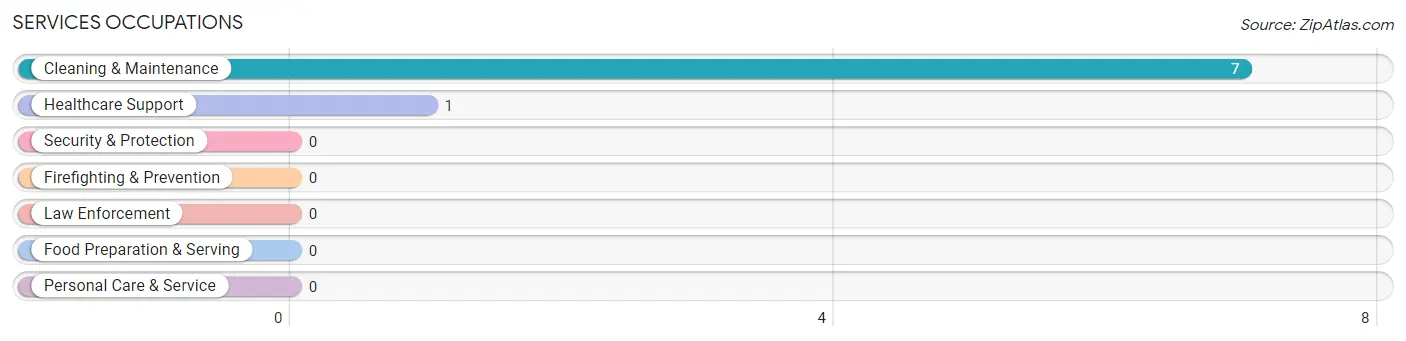
Services Occupations
The most common Services occupations in La Grange are Cleaning & Maintenance (7 | 20.0%), and Healthcare Support (1 | 2.9%).
Services Occupations by Sex
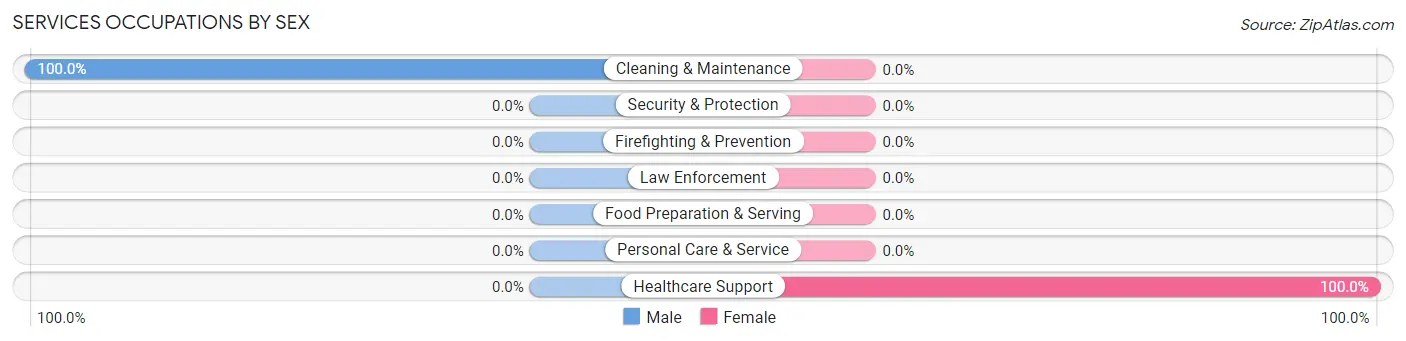
| Occupation | Male | Female |
| Healthcare Support | 0 (0.0%) | 1 (100.0%) |
| Security & Protection | 0 (0.0%) | 0 (0.0%) |
| Firefighting & Prevention | 0 (0.0%) | 0 (0.0%) |
| Law Enforcement | 0 (0.0%) | 0 (0.0%) |
| Food Preparation & Serving | 0 (0.0%) | 0 (0.0%) |
| Cleaning & Maintenance | 7 (100.0%) | 0 (0.0%) |
| Personal Care & Service | 0 (0.0%) | 0 (0.0%) |
| Total (Category) | 7 (87.5%) | 1 (12.5%) |
| Total (Overall) | 21 (60.0%) | 14 (40.0%) |
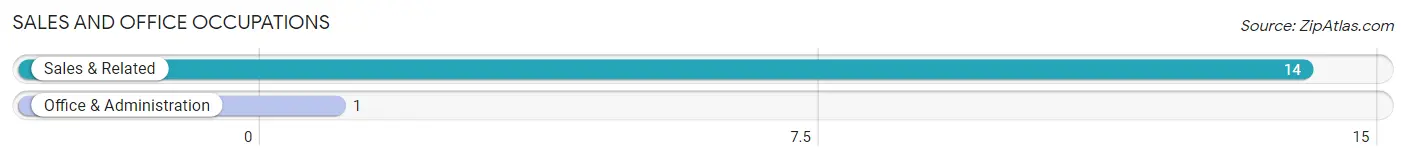
Sales and Office Occupations
The most common Sales and Office occupations in La Grange are Sales & Related (14 | 40.0%), and Office & Administration (1 | 2.9%).
Sales and Office Occupations by Sex

| Occupation | Male | Female |
| Sales & Related | 6 (42.9%) | 8 (57.1%) |
| Office & Administration | 0 (0.0%) | 1 (100.0%) |
| Total (Category) | 6 (40.0%) | 9 (60.0%) |
| Total (Overall) | 21 (60.0%) | 14 (40.0%) |
Natural Resources, Construction and Maintenance Occupations
The most common Natural Resources, Construction and Maintenance occupations in La Grange are , and Installation, Maintenance & Repair (3 | 8.6%).
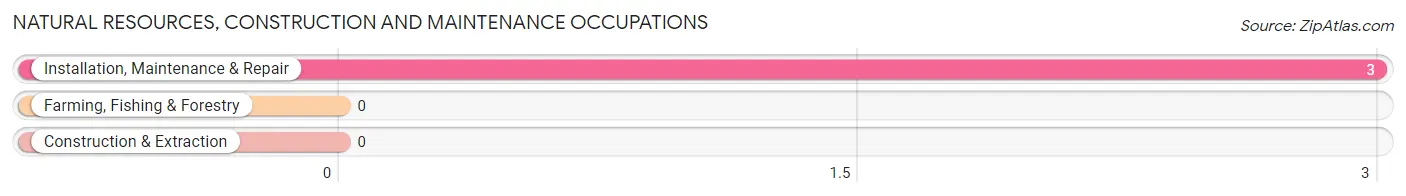
Natural Resources, Construction and Maintenance Occupations by Sex
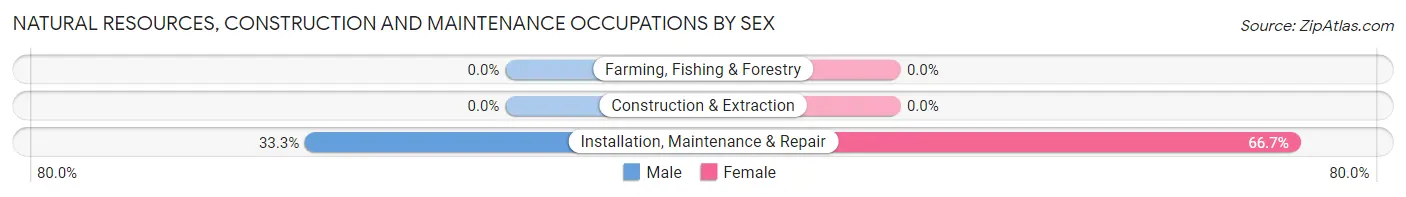
| Occupation | Male | Female |
| Farming, Fishing & Forestry | 0 (0.0%) | 0 (0.0%) |
| Construction & Extraction | 0 (0.0%) | 0 (0.0%) |
| Installation, Maintenance & Repair | 1 (33.3%) | 2 (66.7%) |
| Total (Category) | 1 (33.3%) | 2 (66.7%) |
| Total (Overall) | 21 (60.0%) | 14 (40.0%) |
Production, Transportation and Moving Occupations
The most common Production, Transportation and Moving occupations in La Grange are , and Transportation (2 | 5.7%).
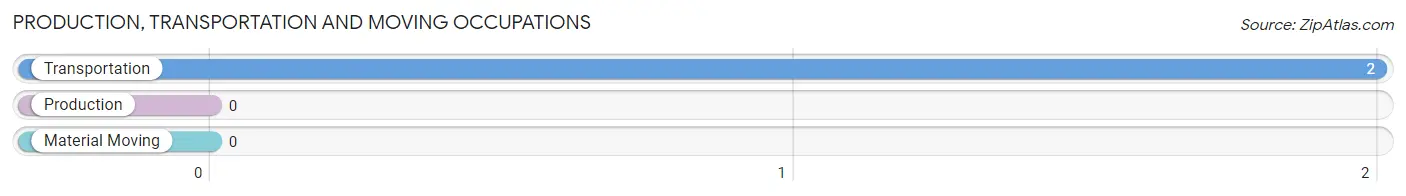
Production, Transportation and Moving Occupations by Sex
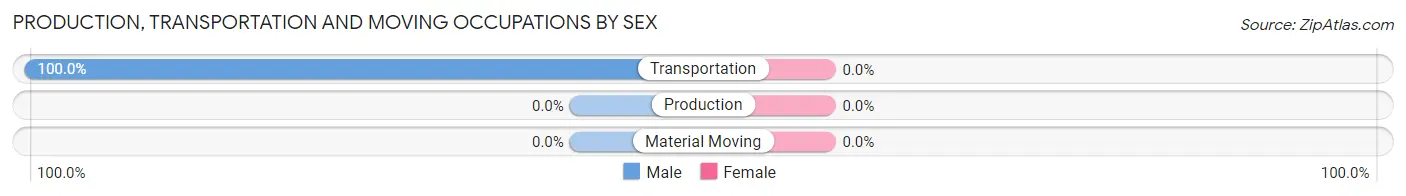
| Occupation | Male | Female |
| Production | 0 (0.0%) | 0 (0.0%) |
| Transportation | 2 (100.0%) | 0 (0.0%) |
| Material Moving | 0 (0.0%) | 0 (0.0%) |
| Total (Category) | 2 (100.0%) | 0 (0.0%) |
| Total (Overall) | 21 (60.0%) | 14 (40.0%) |
Employment Industries by Sex in La Grange
Employment Industries in La Grange
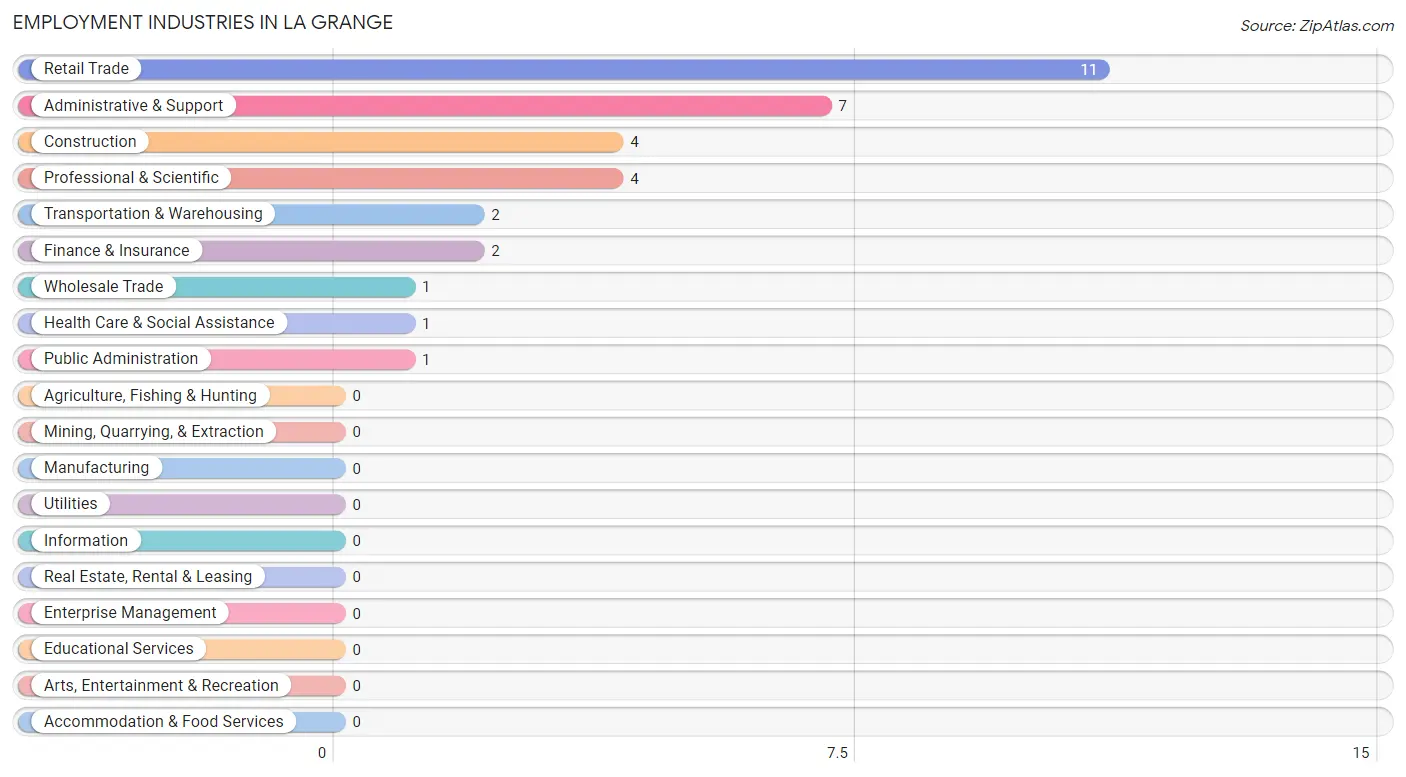
The major employment industries in La Grange include Retail Trade (11 | 31.4%), Administrative & Support (7 | 20.0%), Construction (4 | 11.4%), Professional & Scientific (4 | 11.4%), and Transportation & Warehousing (2 | 5.7%).
Employment Industries by Sex in La Grange
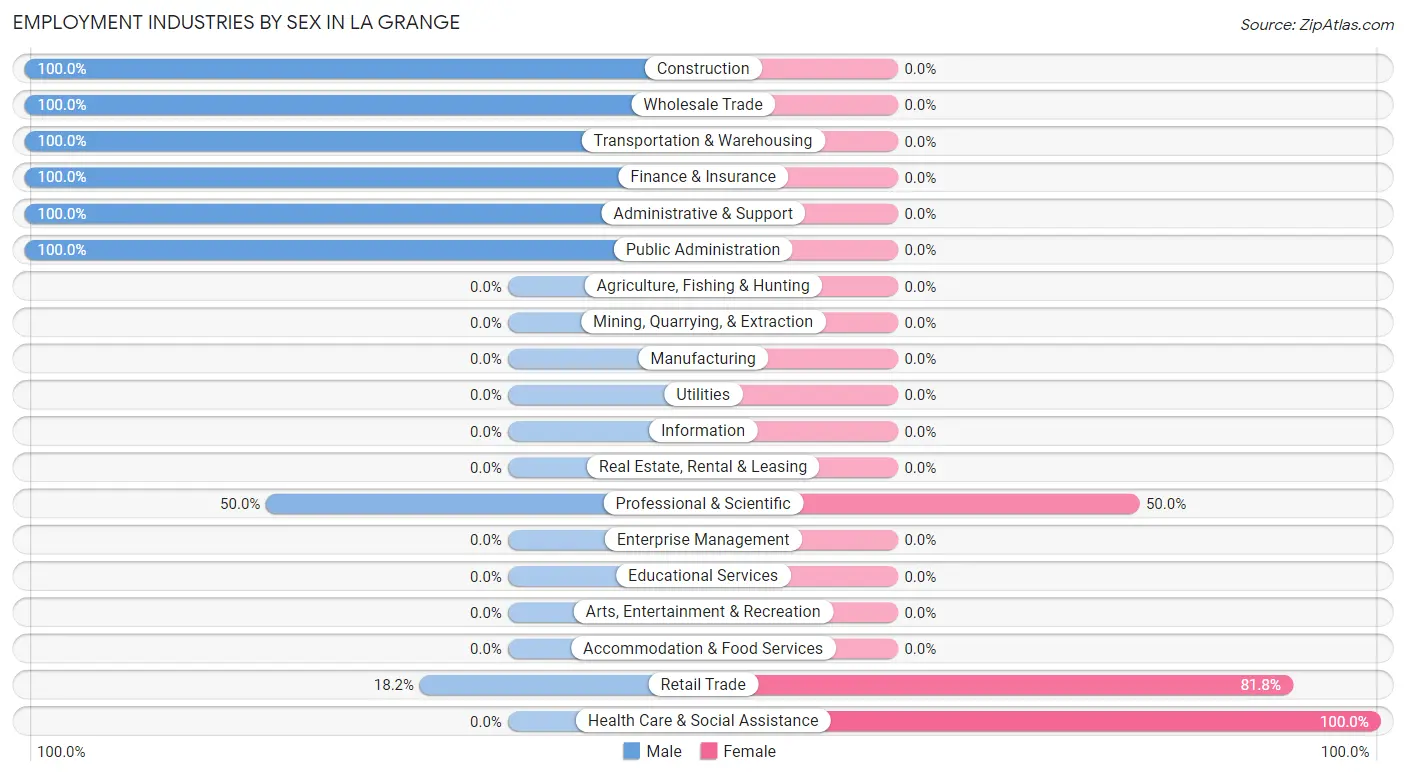
The La Grange industries that see more men than women are Construction (100.0%), Wholesale Trade (100.0%), and Transportation & Warehousing (100.0%), whereas the industries that tend to have a higher number of women are Health Care & Social Assistance (100.0%), Retail Trade (81.8%), and Professional & Scientific (50.0%).
| Industry | Male | Female |
| Agriculture, Fishing & Hunting | 0 (0.0%) | 0 (0.0%) |
| Mining, Quarrying, & Extraction | 0 (0.0%) | 0 (0.0%) |
| Construction | 4 (100.0%) | 0 (0.0%) |
| Manufacturing | 0 (0.0%) | 0 (0.0%) |
| Wholesale Trade | 1 (100.0%) | 0 (0.0%) |
| Retail Trade | 2 (18.2%) | 9 (81.8%) |
| Transportation & Warehousing | 2 (100.0%) | 0 (0.0%) |
| Utilities | 0 (0.0%) | 0 (0.0%) |
| Information | 0 (0.0%) | 0 (0.0%) |
| Finance & Insurance | 2 (100.0%) | 0 (0.0%) |
| Real Estate, Rental & Leasing | 0 (0.0%) | 0 (0.0%) |
| Professional & Scientific | 2 (50.0%) | 2 (50.0%) |
| Enterprise Management | 0 (0.0%) | 0 (0.0%) |
| Administrative & Support | 7 (100.0%) | 0 (0.0%) |
| Educational Services | 0 (0.0%) | 0 (0.0%) |
| Health Care & Social Assistance | 0 (0.0%) | 1 (100.0%) |
| Arts, Entertainment & Recreation | 0 (0.0%) | 0 (0.0%) |
| Accommodation & Food Services | 0 (0.0%) | 0 (0.0%) |
| Public Administration | 1 (100.0%) | 0 (0.0%) |
| Total | 21 (60.0%) | 14 (40.0%) |
Education in La Grange
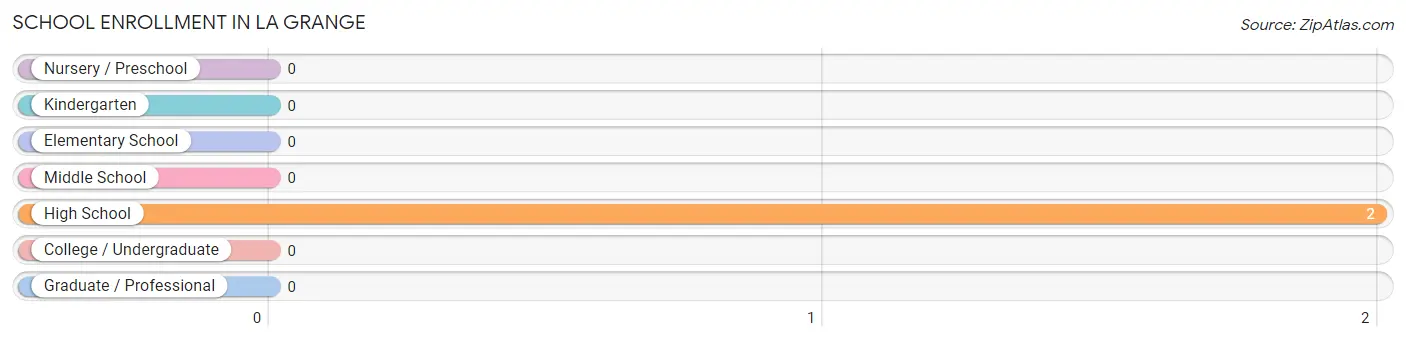
School Enrollment in La Grange
| School Level | # Students | % Students |
| Nursery / Preschool | 0 | 0.0% |
| Kindergarten | 0 | 0.0% |
| Elementary School | 0 | 0.0% |
| Middle School | 0 | 0.0% |
| High School | 2 | 100.0% |
| College / Undergraduate | 0 | 0.0% |
| Graduate / Professional | 0 | 0.0% |
| Total | 2 | 100.0% |
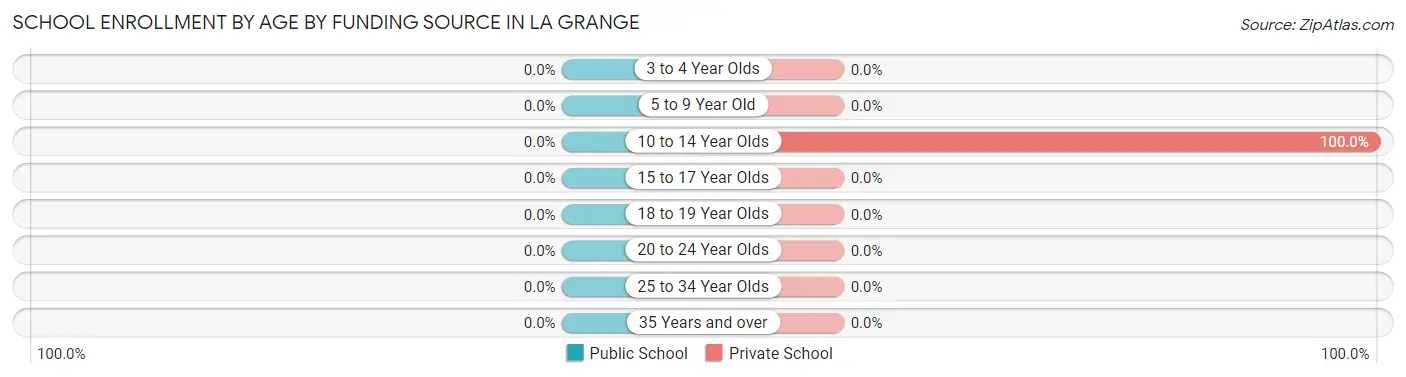
School Enrollment by Age by Funding Source in La Grange
| Age Bracket | Public School | Private School |
| 3 to 4 Year Olds | 0 (0.0%) | 0 (0.0%) |
| 5 to 9 Year Old | 0 (0.0%) | 0 (0.0%) |
| 10 to 14 Year Olds | 0 (0.0%) | 2 (100.0%) |
| 15 to 17 Year Olds | 0 (0.0%) | 0 (0.0%) |
| 18 to 19 Year Olds | 0 (0.0%) | 0 (0.0%) |
| 20 to 24 Year Olds | 0 (0.0%) | 0 (0.0%) |
| 25 to 34 Year Olds | 0 (0.0%) | 0 (0.0%) |
| 35 Years and over | 0 (0.0%) | 0 (0.0%) |
| Total | 0 (0.0%) | 2 (100.0%) |
Educational Attainment by Field of Study in La Grange
Bio, nature & agricultural (9 | 32.1%), business (6 | 21.4%), visual & performing arts (6 | 21.4%), social sciences (2 | 7.1%), and science & technology (2 | 7.1%) are the most common fields of study among 28 individuals in La Grange who have obtained a bachelor's degree or higher.
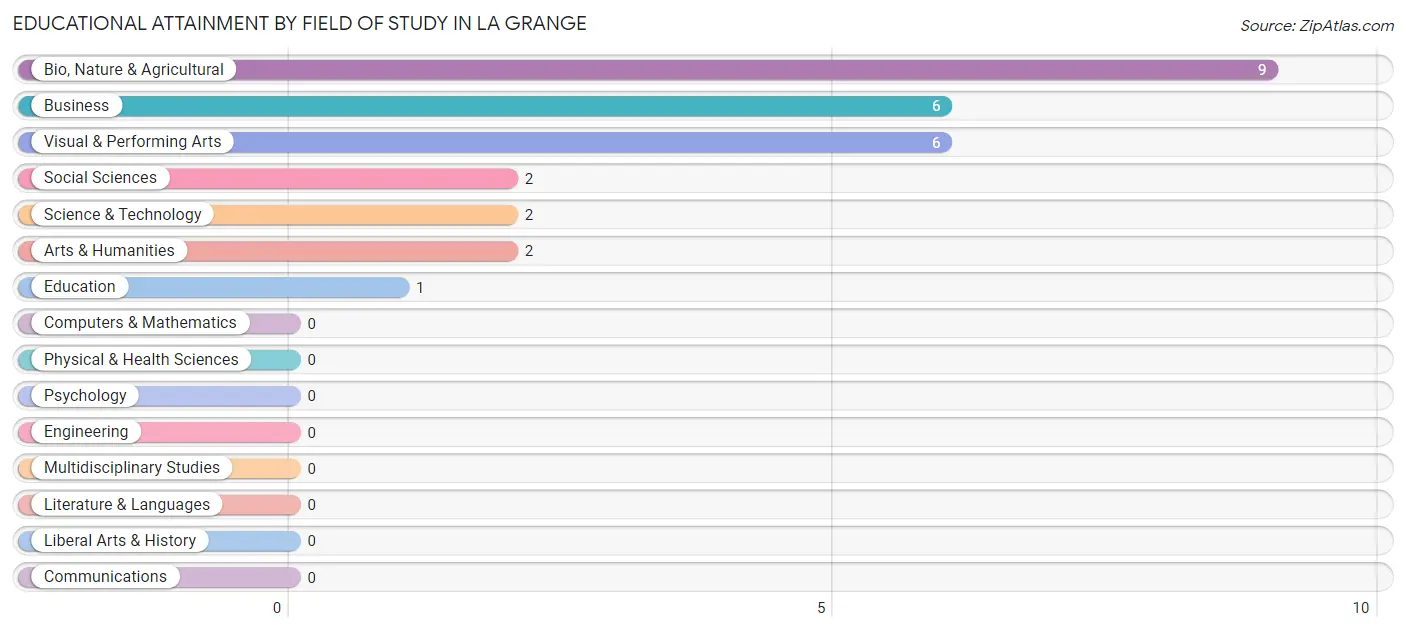
| Field of Study | # Graduates | % Graduates |
| Computers & Mathematics | 0 | 0.0% |
| Bio, Nature & Agricultural | 9 | 32.1% |
| Physical & Health Sciences | 0 | 0.0% |
| Psychology | 0 | 0.0% |
| Social Sciences | 2 | 7.1% |
| Engineering | 0 | 0.0% |
| Multidisciplinary Studies | 0 | 0.0% |
| Science & Technology | 2 | 7.1% |
| Business | 6 | 21.4% |
| Education | 1 | 3.6% |
| Literature & Languages | 0 | 0.0% |
| Liberal Arts & History | 0 | 0.0% |
| Visual & Performing Arts | 6 | 21.4% |
| Communications | 0 | 0.0% |
| Arts & Humanities | 2 | 7.1% |
| Total | 28 | 100.0% |
Transportation & Commute in La Grange
Vehicle Availability by Sex in La Grange
The most prevalent vehicle ownership categories in La Grange are males with 2 vehicles (13, accounting for 61.9%) and females with 2 vehicles (1, making up 108.3%).
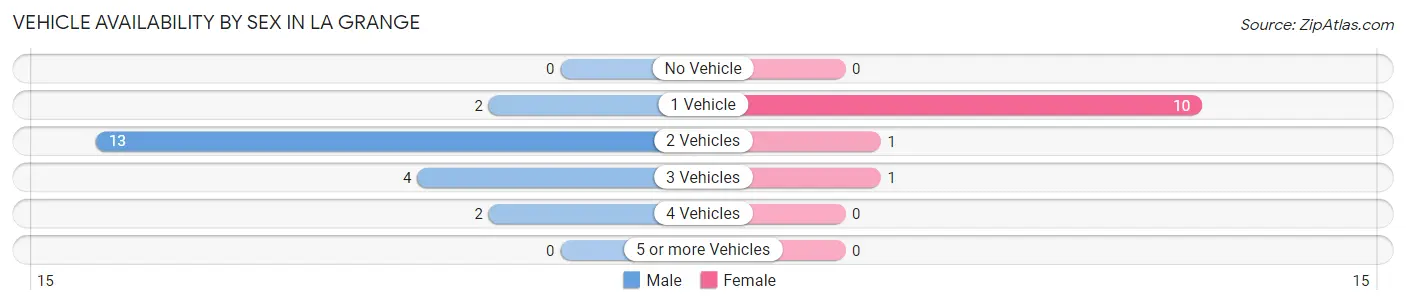
| Vehicles Available | Male | Female |
| No Vehicle | 0 (0.0%) | 0 (0.0%) |
| 1 Vehicle | 2 (9.5%) | 10 (83.3%) |
| 2 Vehicles | 13 (61.9%) | 1 (8.3%) |
| 3 Vehicles | 4 (19.1%) | 1 (8.3%) |
| 4 Vehicles | 2 (9.5%) | 0 (0.0%) |
| 5 or more Vehicles | 0 (0.0%) | 0 (0.0%) |
| Total | 21 (100.0%) | 12 (100.0%) |
Commute Time in La Grange
The most frequently occuring commute durations in La Grange are 45 to 59 minutes (21 commuters, 63.6%), 30 to 34 minutes (6 commuters, 18.2%), and 40 to 44 minutes (3 commuters, 9.1%).
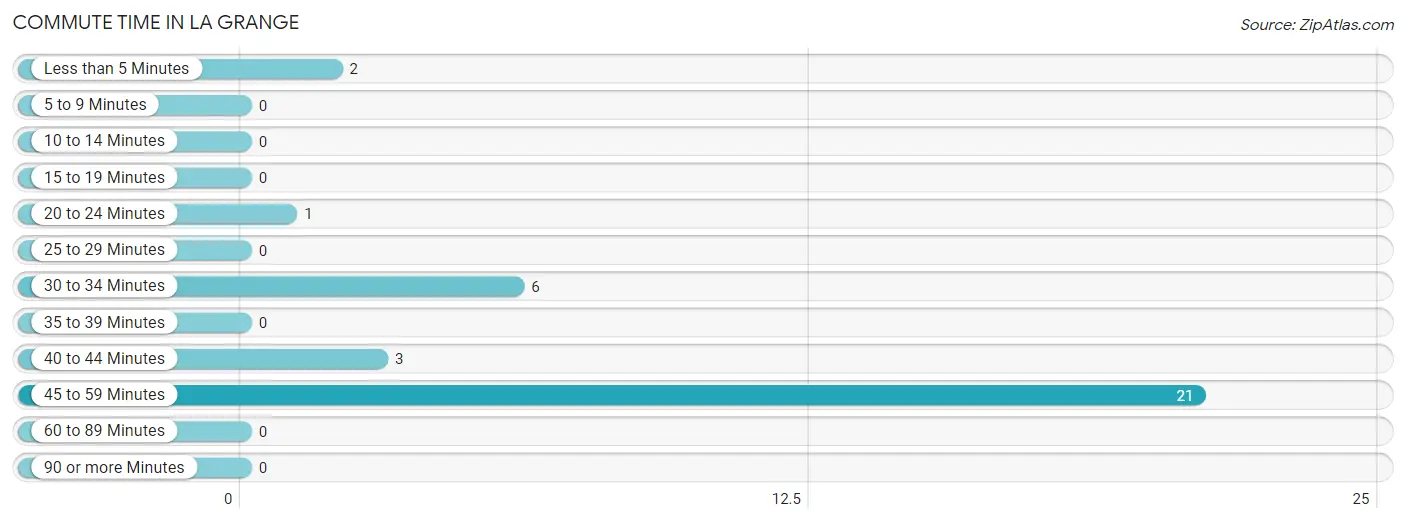
| Commute Time | # Commuters | % Commuters |
| Less than 5 Minutes | 2 | 6.1% |
| 5 to 9 Minutes | 0 | 0.0% |
| 10 to 14 Minutes | 0 | 0.0% |
| 15 to 19 Minutes | 0 | 0.0% |
| 20 to 24 Minutes | 1 | 3.0% |
| 25 to 29 Minutes | 0 | 0.0% |
| 30 to 34 Minutes | 6 | 18.2% |
| 35 to 39 Minutes | 0 | 0.0% |
| 40 to 44 Minutes | 3 | 9.1% |
| 45 to 59 Minutes | 21 | 63.6% |
| 60 to 89 Minutes | 0 | 0.0% |
| 90 or more Minutes | 0 | 0.0% |
Commute Time by Sex in La Grange
The most common commute times in La Grange are 45 to 59 minutes (18 commuters, 85.7%) for males and 30 to 34 minutes (6 commuters, 50.0%) for females.
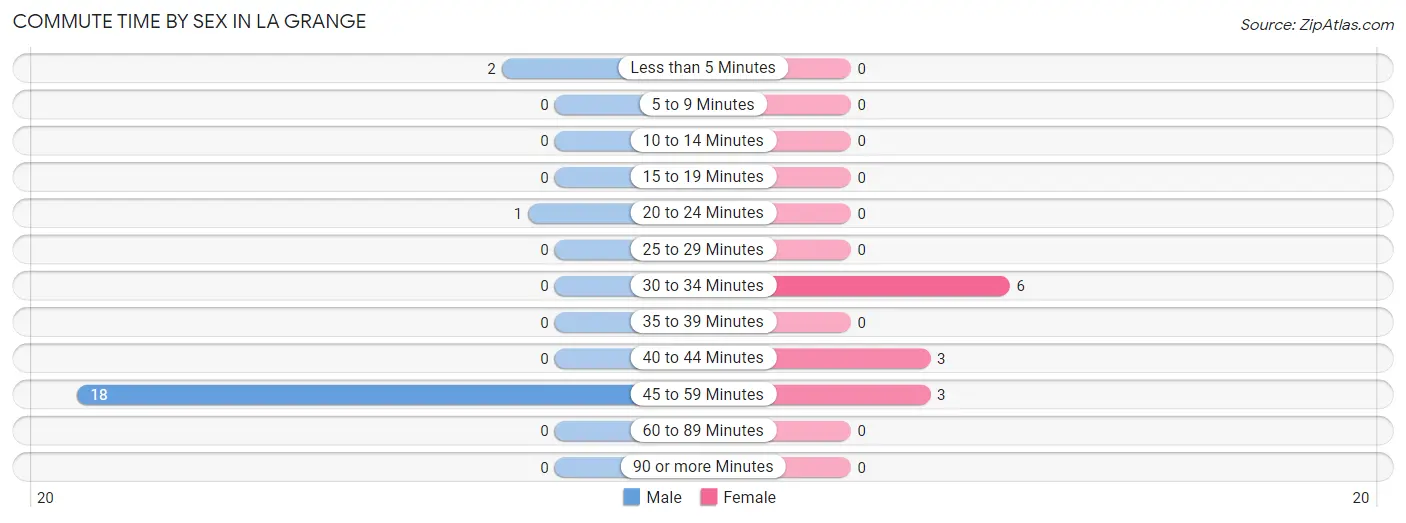
| Commute Time | Male | Female |
| Less than 5 Minutes | 2 (9.5%) | 0 (0.0%) |
| 5 to 9 Minutes | 0 (0.0%) | 0 (0.0%) |
| 10 to 14 Minutes | 0 (0.0%) | 0 (0.0%) |
| 15 to 19 Minutes | 0 (0.0%) | 0 (0.0%) |
| 20 to 24 Minutes | 1 (4.8%) | 0 (0.0%) |
| 25 to 29 Minutes | 0 (0.0%) | 0 (0.0%) |
| 30 to 34 Minutes | 0 (0.0%) | 6 (50.0%) |
| 35 to 39 Minutes | 0 (0.0%) | 0 (0.0%) |
| 40 to 44 Minutes | 0 (0.0%) | 3 (25.0%) |
| 45 to 59 Minutes | 18 (85.7%) | 3 (25.0%) |
| 60 to 89 Minutes | 0 (0.0%) | 0 (0.0%) |
| 90 or more Minutes | 0 (0.0%) | 0 (0.0%) |
Time of Departure to Work by Sex in La Grange
The most frequent times of departure to work in La Grange are 10:00 AM to 10:59 AM (7, 33.3%) for males and 9:00 AM to 9:59 AM (6, 50.0%) for females.
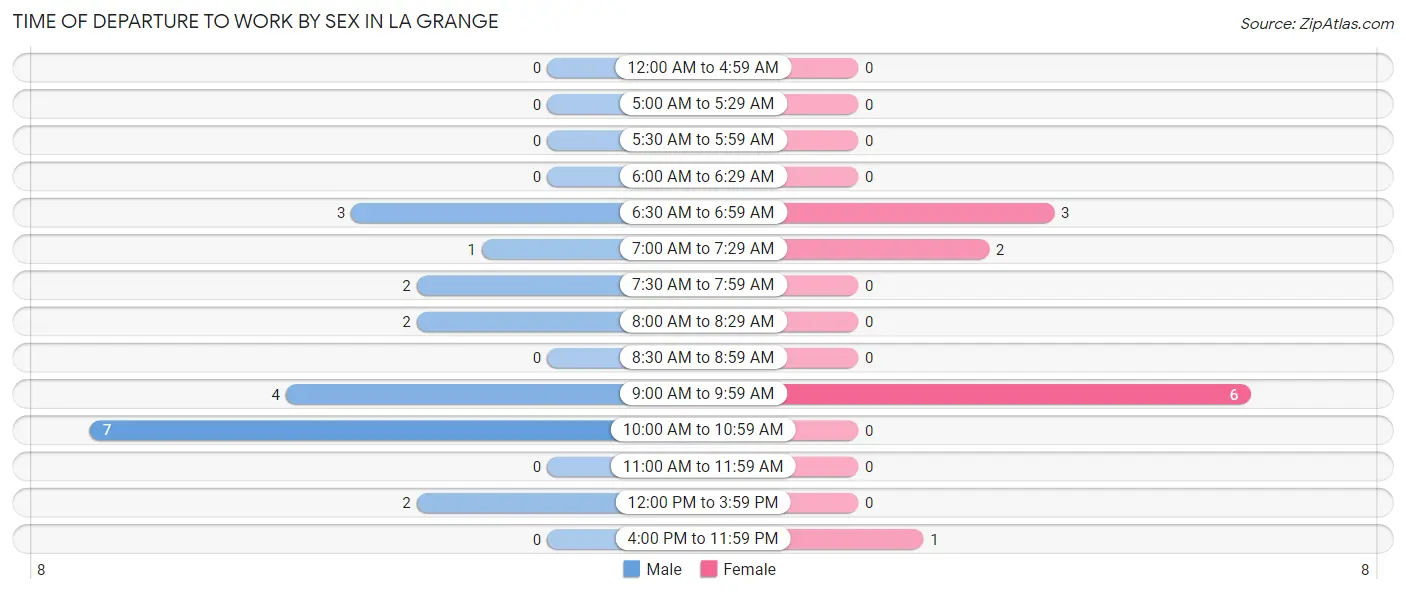
| Time of Departure | Male | Female |
| 12:00 AM to 4:59 AM | 0 (0.0%) | 0 (0.0%) |
| 5:00 AM to 5:29 AM | 0 (0.0%) | 0 (0.0%) |
| 5:30 AM to 5:59 AM | 0 (0.0%) | 0 (0.0%) |
| 6:00 AM to 6:29 AM | 0 (0.0%) | 0 (0.0%) |
| 6:30 AM to 6:59 AM | 3 (14.3%) | 3 (25.0%) |
| 7:00 AM to 7:29 AM | 1 (4.8%) | 2 (16.7%) |
| 7:30 AM to 7:59 AM | 2 (9.5%) | 0 (0.0%) |
| 8:00 AM to 8:29 AM | 2 (9.5%) | 0 (0.0%) |
| 8:30 AM to 8:59 AM | 0 (0.0%) | 0 (0.0%) |
| 9:00 AM to 9:59 AM | 4 (19.1%) | 6 (50.0%) |
| 10:00 AM to 10:59 AM | 7 (33.3%) | 0 (0.0%) |
| 11:00 AM to 11:59 AM | 0 (0.0%) | 0 (0.0%) |
| 12:00 PM to 3:59 PM | 2 (9.5%) | 0 (0.0%) |
| 4:00 PM to 11:59 PM | 0 (0.0%) | 1 (8.3%) |
| Total | 21 (100.0%) | 12 (100.0%) |
Housing Occupancy in La Grange
Occupancy by Ownership in La Grange
Of the total 43 dwellings in La Grange, owner-occupied units account for 40 (93.0%), while renter-occupied units make up 3 (7.0%).
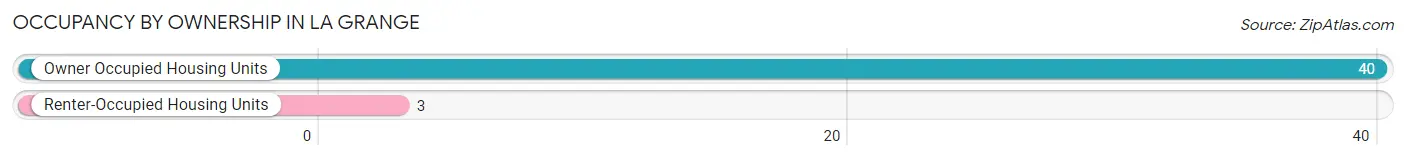
| Occupancy | # Housing Units | % Housing Units |
| Owner Occupied Housing Units | 40 | 93.0% |
| Renter-Occupied Housing Units | 3 | 7.0% |
| Total Occupied Housing Units | 43 | 100.0% |
Occupancy by Household Size in La Grange
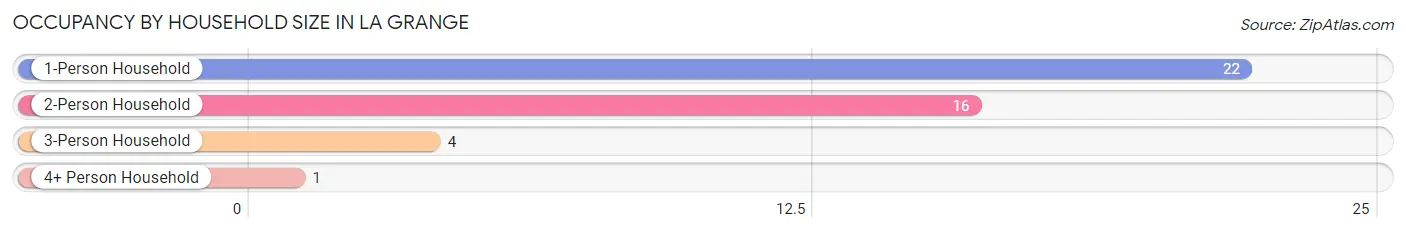
| Household Size | # Housing Units | % Housing Units |
| 1-Person Household | 22 | 51.2% |
| 2-Person Household | 16 | 37.2% |
| 3-Person Household | 4 | 9.3% |
| 4+ Person Household | 1 | 2.3% |
| Total Housing Units | 43 | 100.0% |
Occupancy by Ownership by Household Size in La Grange
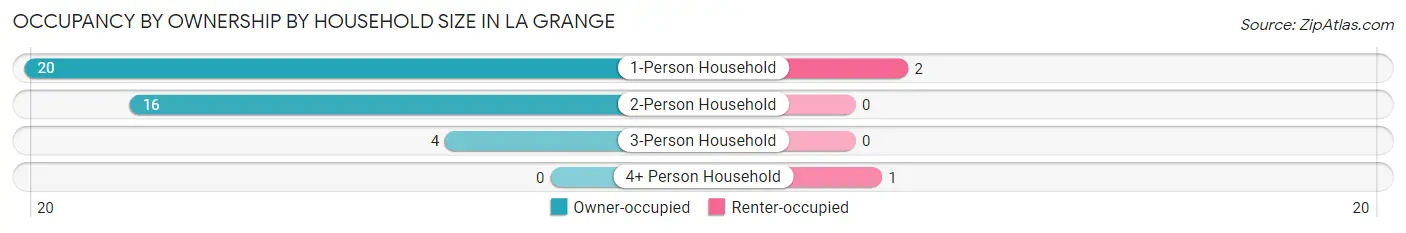
| Household Size | Owner-occupied | Renter-occupied |
| 1-Person Household | 20 (90.9%) | 2 (9.1%) |
| 2-Person Household | 16 (100.0%) | 0 (0.0%) |
| 3-Person Household | 4 (100.0%) | 0 (0.0%) |
| 4+ Person Household | 0 (0.0%) | 1 (100.0%) |
| Total Housing Units | 40 (93.0%) | 3 (7.0%) |
Occupancy by Educational Attainment in La Grange
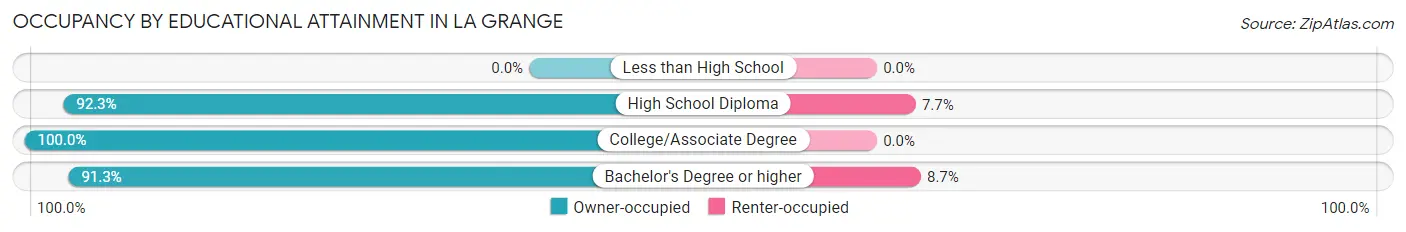
| Household Size | Owner-occupied | Renter-occupied |
| Less than High School | 0 (0.0%) | 0 (0.0%) |
| High School Diploma | 12 (92.3%) | 1 (7.7%) |
| College/Associate Degree | 7 (100.0%) | 0 (0.0%) |
| Bachelor's Degree or higher | 21 (91.3%) | 2 (8.7%) |
Occupancy by Age of Householder in La Grange
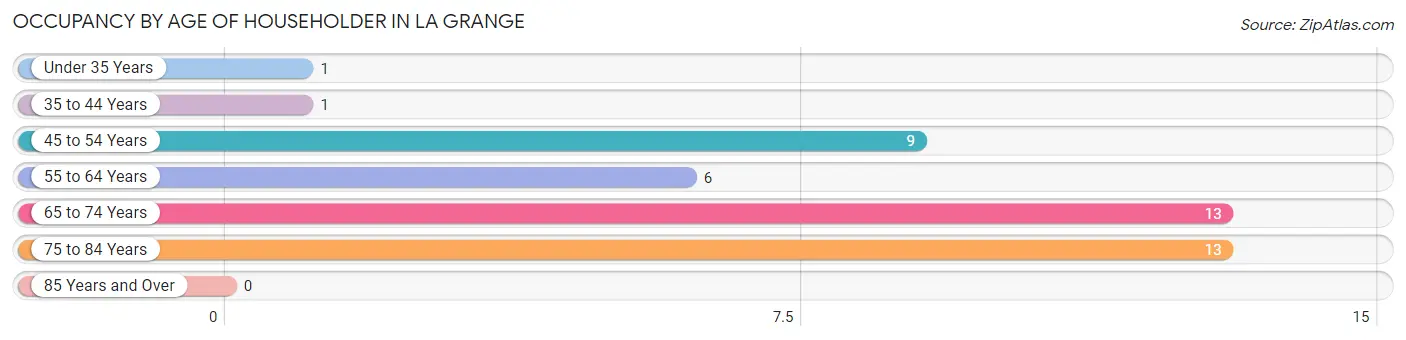
| Age Bracket | # Households | % Households |
| Under 35 Years | 1 | 2.3% |
| 35 to 44 Years | 1 | 2.3% |
| 45 to 54 Years | 9 | 20.9% |
| 55 to 64 Years | 6 | 14.0% |
| 65 to 74 Years | 13 | 30.2% |
| 75 to 84 Years | 13 | 30.2% |
| 85 Years and Over | 0 | 0.0% |
| Total | 43 | 100.0% |
Housing Finances in La Grange
Median Income by Occupancy in La Grange
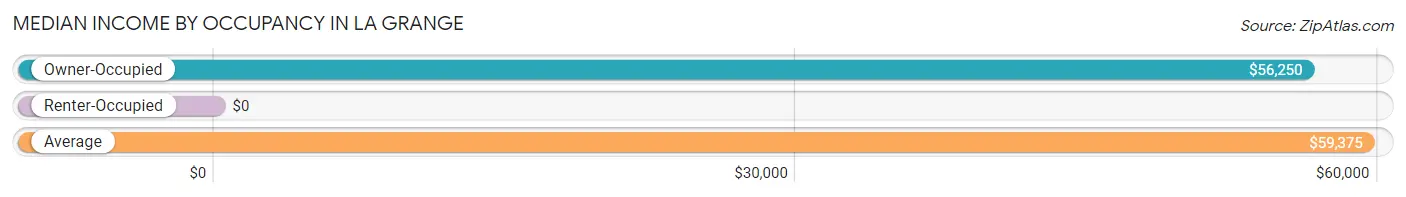
| Occupancy Type | # Households | Median Income |
| Owner-Occupied | 40 (93.0%) | $56,250 |
| Renter-Occupied | 3 (7.0%) | $0 |
| Average | 43 (100.0%) | $59,375 |
Occupancy by Householder Income Bracket in La Grange
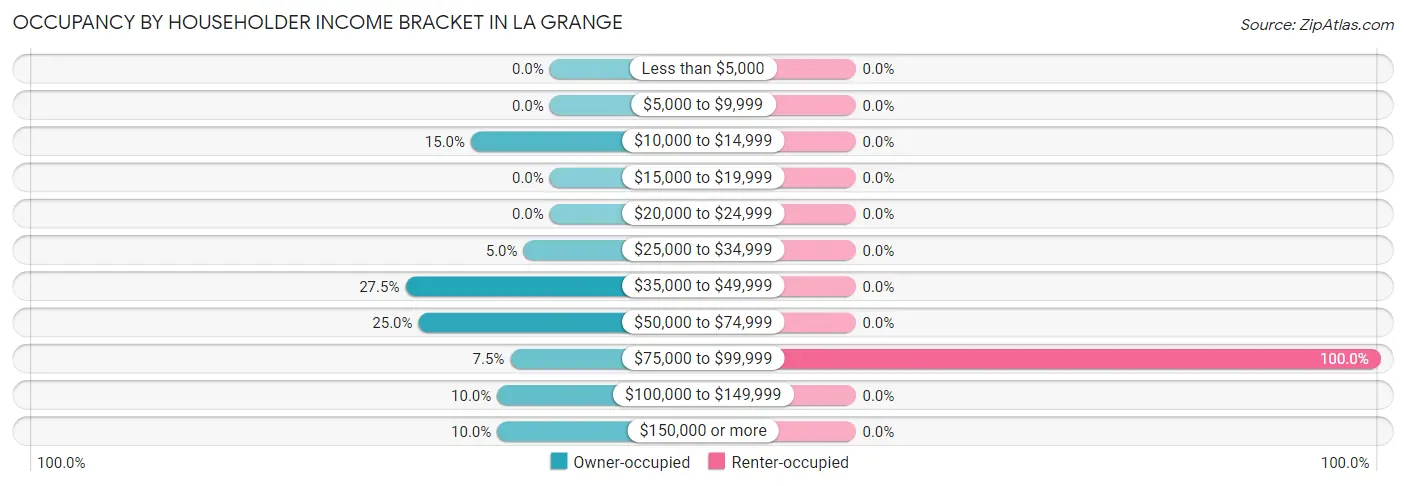
| Income Bracket | Owner-occupied | Renter-occupied |
| Less than $5,000 | 0 (0.0%) | 0 (0.0%) |
| $5,000 to $9,999 | 0 (0.0%) | 0 (0.0%) |
| $10,000 to $14,999 | 6 (15.0%) | 0 (0.0%) |
| $15,000 to $19,999 | 0 (0.0%) | 0 (0.0%) |
| $20,000 to $24,999 | 0 (0.0%) | 0 (0.0%) |
| $25,000 to $34,999 | 2 (5.0%) | 0 (0.0%) |
| $35,000 to $49,999 | 11 (27.5%) | 0 (0.0%) |
| $50,000 to $74,999 | 10 (25.0%) | 0 (0.0%) |
| $75,000 to $99,999 | 3 (7.5%) | 3 (100.0%) |
| $100,000 to $149,999 | 4 (10.0%) | 0 (0.0%) |
| $150,000 or more | 4 (10.0%) | 0 (0.0%) |
| Total | 40 (100.0%) | 3 (100.0%) |
Monthly Housing Cost Tiers in La Grange
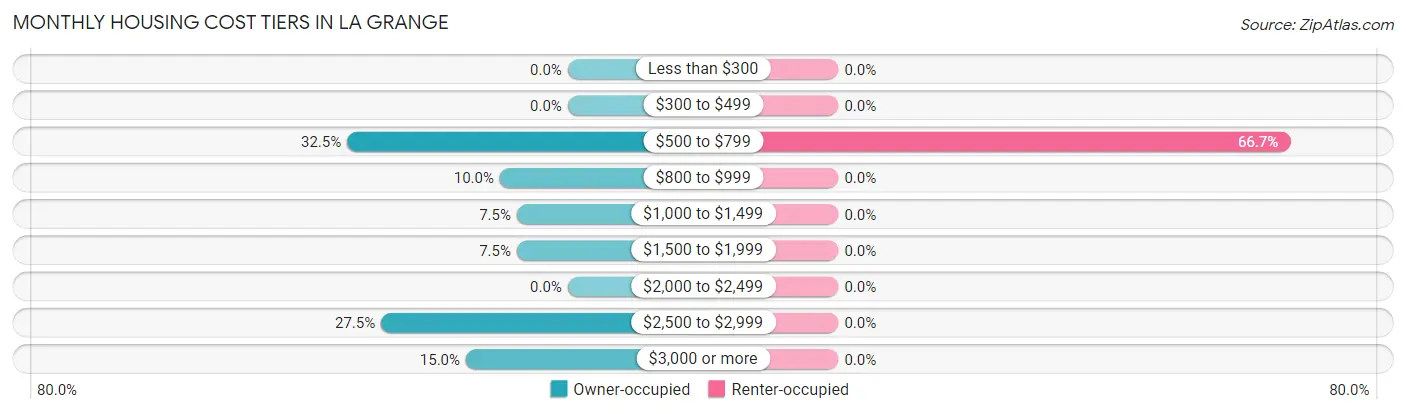
| Monthly Cost | Owner-occupied | Renter-occupied |
| Less than $300 | 0 (0.0%) | 0 (0.0%) |
| $300 to $499 | 0 (0.0%) | 0 (0.0%) |
| $500 to $799 | 13 (32.5%) | 2 (66.7%) |
| $800 to $999 | 4 (10.0%) | 0 (0.0%) |
| $1,000 to $1,499 | 3 (7.5%) | 0 (0.0%) |
| $1,500 to $1,999 | 3 (7.5%) | 0 (0.0%) |
| $2,000 to $2,499 | 0 (0.0%) | 0 (0.0%) |
| $2,500 to $2,999 | 11 (27.5%) | 0 (0.0%) |
| $3,000 or more | 6 (15.0%) | 0 (0.0%) |
| Total | 40 (100.0%) | 3 (100.0%) |
Physical Housing Characteristics in La Grange
Housing Structures in La Grange
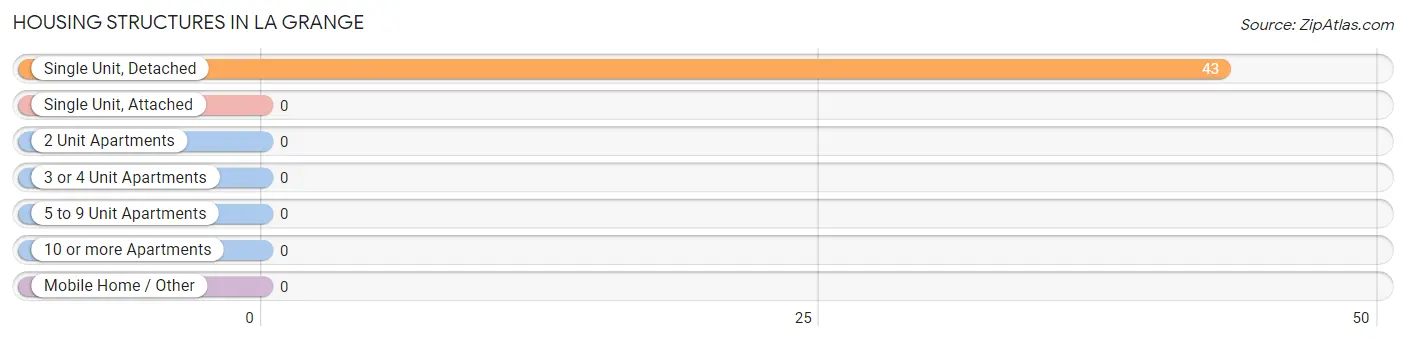
| Structure Type | # Housing Units | % Housing Units |
| Single Unit, Detached | 43 | 100.0% |
| Single Unit, Attached | 0 | 0.0% |
| 2 Unit Apartments | 0 | 0.0% |
| 3 or 4 Unit Apartments | 0 | 0.0% |
| 5 to 9 Unit Apartments | 0 | 0.0% |
| 10 or more Apartments | 0 | 0.0% |
| Mobile Home / Other | 0 | 0.0% |
| Total | 43 | 100.0% |
Housing Structures by Occupancy in La Grange
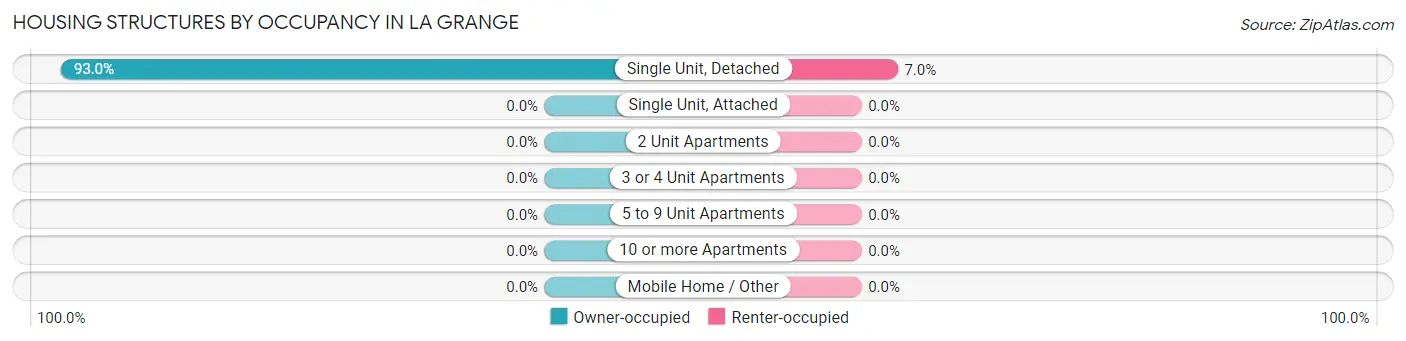
| Structure Type | Owner-occupied | Renter-occupied |
| Single Unit, Detached | 40 (93.0%) | 3 (7.0%) |
| Single Unit, Attached | 0 (0.0%) | 0 (0.0%) |
| 2 Unit Apartments | 0 (0.0%) | 0 (0.0%) |
| 3 or 4 Unit Apartments | 0 (0.0%) | 0 (0.0%) |
| 5 to 9 Unit Apartments | 0 (0.0%) | 0 (0.0%) |
| 10 or more Apartments | 0 (0.0%) | 0 (0.0%) |
| Mobile Home / Other | 0 (0.0%) | 0 (0.0%) |
| Total | 40 (93.0%) | 3 (7.0%) |
Housing Structures by Number of Rooms in La Grange
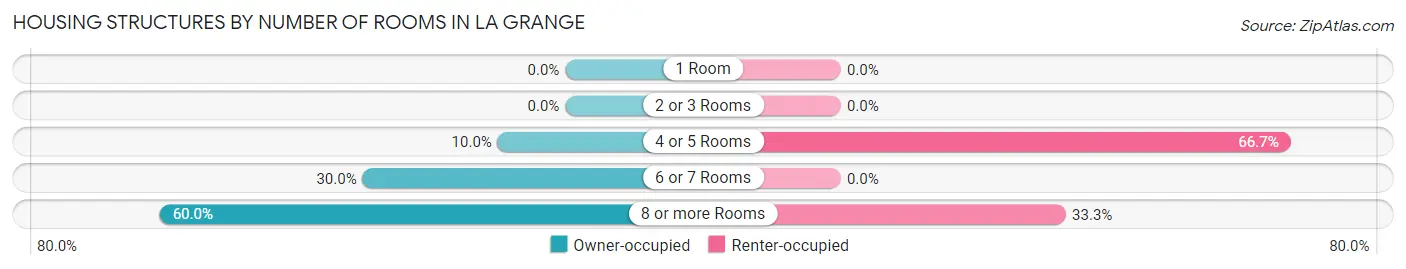
| Number of Rooms | Owner-occupied | Renter-occupied |
| 1 Room | 0 (0.0%) | 0 (0.0%) |
| 2 or 3 Rooms | 0 (0.0%) | 0 (0.0%) |
| 4 or 5 Rooms | 4 (10.0%) | 2 (66.7%) |
| 6 or 7 Rooms | 12 (30.0%) | 0 (0.0%) |
| 8 or more Rooms | 24 (60.0%) | 1 (33.3%) |
| Total | 40 (100.0%) | 3 (100.0%) |
Housing Structure by Heating Type in La Grange
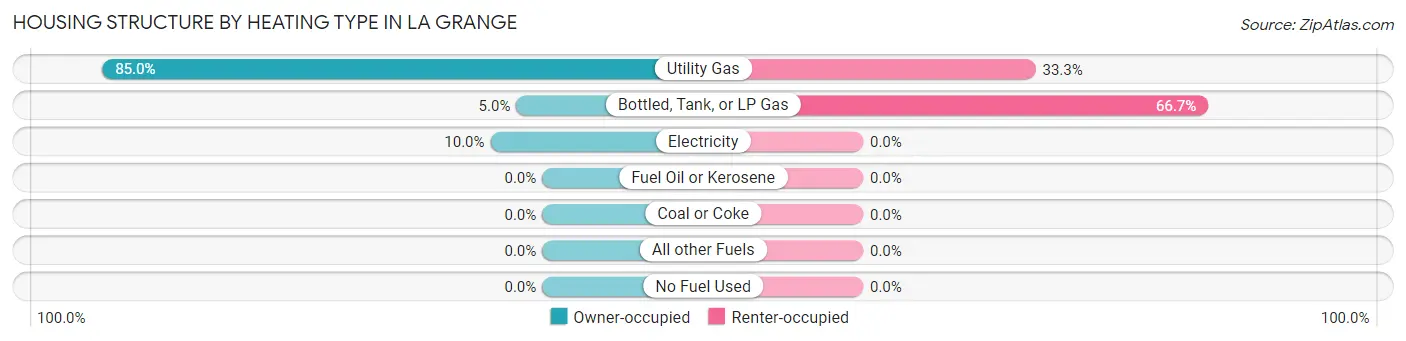
| Heating Type | Owner-occupied | Renter-occupied |
| Utility Gas | 34 (85.0%) | 1 (33.3%) |
| Bottled, Tank, or LP Gas | 2 (5.0%) | 2 (66.7%) |
| Electricity | 4 (10.0%) | 0 (0.0%) |
| Fuel Oil or Kerosene | 0 (0.0%) | 0 (0.0%) |
| Coal or Coke | 0 (0.0%) | 0 (0.0%) |
| All other Fuels | 0 (0.0%) | 0 (0.0%) |
| No Fuel Used | 0 (0.0%) | 0 (0.0%) |
| Total | 40 (100.0%) | 3 (100.0%) |
Household Vehicle Usage in La Grange
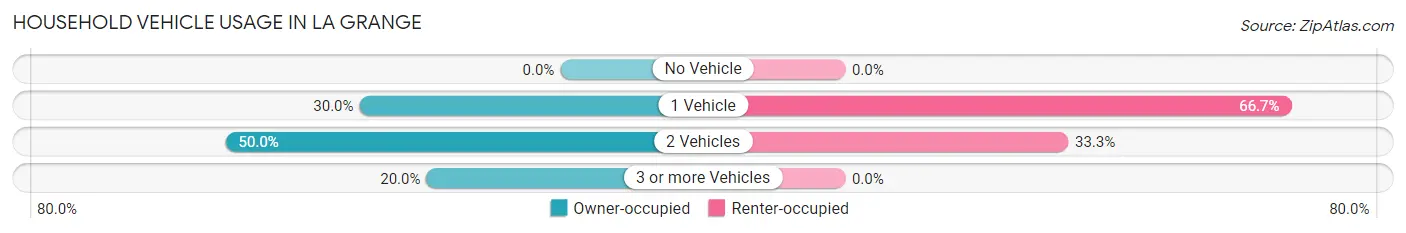
| Vehicles per Household | Owner-occupied | Renter-occupied |
| No Vehicle | 0 (0.0%) | 0 (0.0%) |
| 1 Vehicle | 12 (30.0%) | 2 (66.7%) |
| 2 Vehicles | 20 (50.0%) | 1 (33.3%) |
| 3 or more Vehicles | 8 (20.0%) | 0 (0.0%) |
| Total | 40 (100.0%) | 3 (100.0%) |
Real Estate & Mortgages in La Grange
Real Estate and Mortgage Overview in La Grange
| Characteristic | Without Mortgage | With Mortgage |
| Housing Units | 15 | 25 |
| Median Property Value | - | - |
| Median Household Income | - | - |
| Monthly Housing Costs | $613 | $6 |
| Real Estate Taxes | $1,393 | $0 |
Property Value by Mortgage Status in La Grange
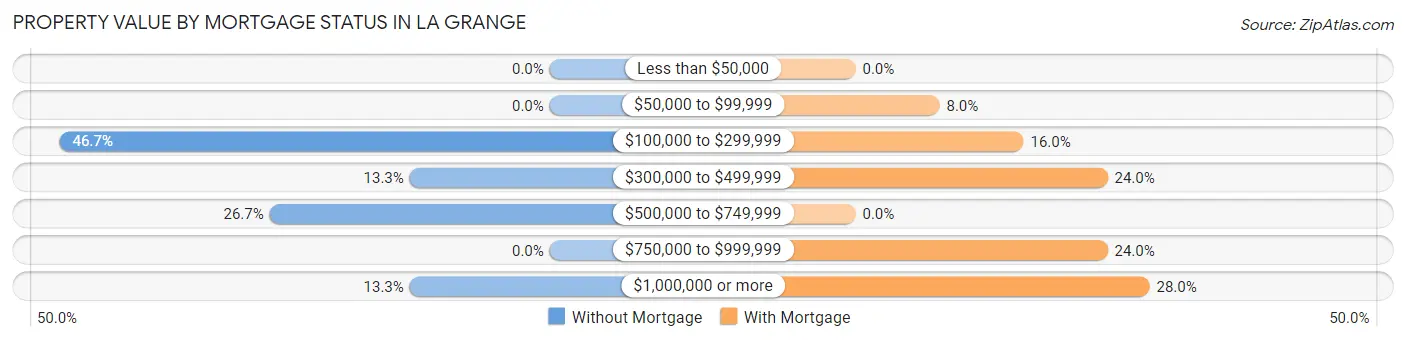
| Property Value | Without Mortgage | With Mortgage |
| Less than $50,000 | 0 (0.0%) | 0 (0.0%) |
| $50,000 to $99,999 | 0 (0.0%) | 2 (8.0%) |
| $100,000 to $299,999 | 7 (46.7%) | 4 (16.0%) |
| $300,000 to $499,999 | 2 (13.3%) | 6 (24.0%) |
| $500,000 to $749,999 | 4 (26.7%) | 0 (0.0%) |
| $750,000 to $999,999 | 0 (0.0%) | 6 (24.0%) |
| $1,000,000 or more | 2 (13.3%) | 7 (28.0%) |
| Total | 15 (100.0%) | 25 (100.0%) |
Household Income by Mortgage Status in La Grange
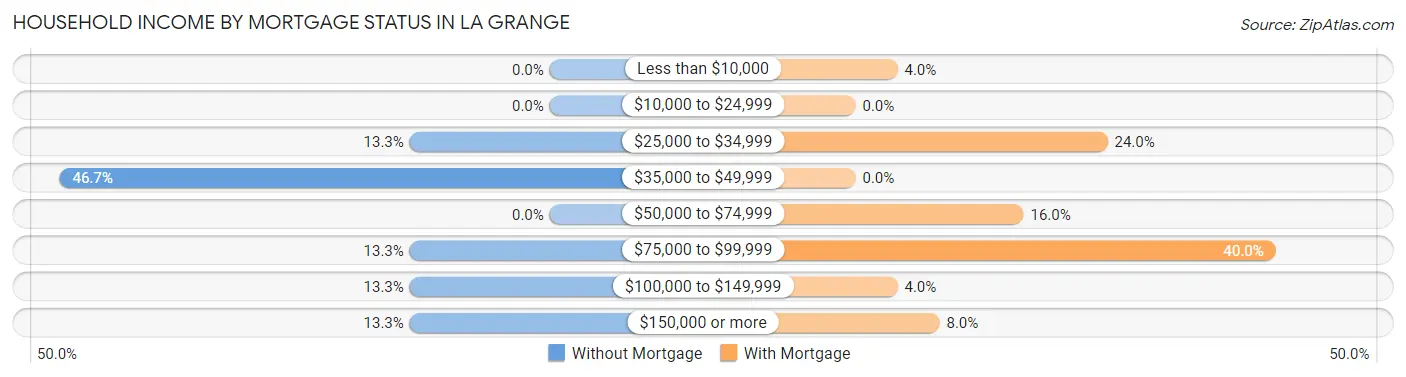
| Household Income | Without Mortgage | With Mortgage |
| Less than $10,000 | 0 (0.0%) | 1 (4.0%) |
| $10,000 to $24,999 | 0 (0.0%) | 0 (0.0%) |
| $25,000 to $34,999 | 2 (13.3%) | 6 (24.0%) |
| $35,000 to $49,999 | 7 (46.7%) | 0 (0.0%) |
| $50,000 to $74,999 | 0 (0.0%) | 4 (16.0%) |
| $75,000 to $99,999 | 2 (13.3%) | 10 (40.0%) |
| $100,000 to $149,999 | 2 (13.3%) | 1 (4.0%) |
| $150,000 or more | 2 (13.3%) | 2 (8.0%) |
| Total | 15 (100.0%) | 25 (100.0%) |
Property Value to Household Income Ratio in La Grange
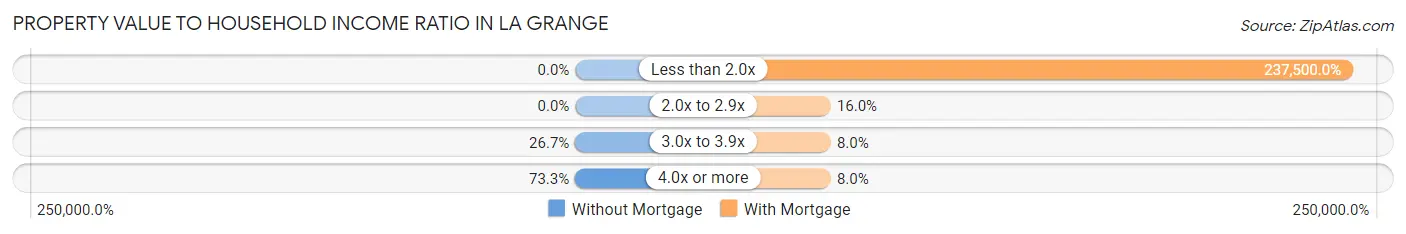
| Value-to-Income Ratio | Without Mortgage | With Mortgage |
| Less than 2.0x | 0 (0.0%) | 59,375 (237,500.0%) |
| 2.0x to 2.9x | 0 (0.0%) | 4 (16.0%) |
| 3.0x to 3.9x | 4 (26.7%) | 2 (8.0%) |
| 4.0x or more | 11 (73.3%) | 2 (8.0%) |
| Total | 15 (100.0%) | 25 (100.0%) |
Real Estate Taxes by Mortgage Status in La Grange
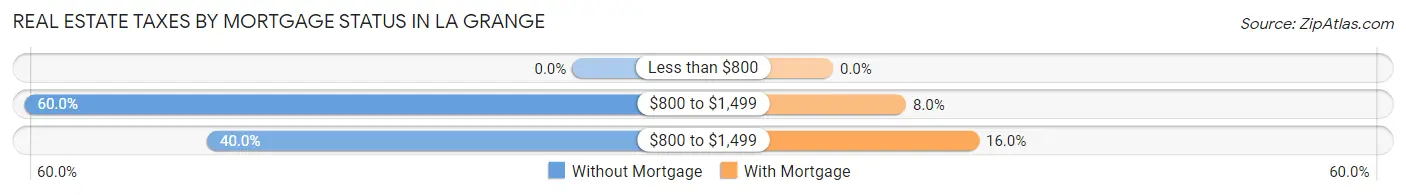
| Property Taxes | Without Mortgage | With Mortgage |
| Less than $800 | 0 (0.0%) | 0 (0.0%) |
| $800 to $1,499 | 9 (60.0%) | 2 (8.0%) |
| $800 to $1,499 | 6 (40.0%) | 4 (16.0%) |
| Total | 15 (100.0%) | 25 (100.0%) |
Health & Disability in La Grange
Health Insurance Coverage by Age in La Grange
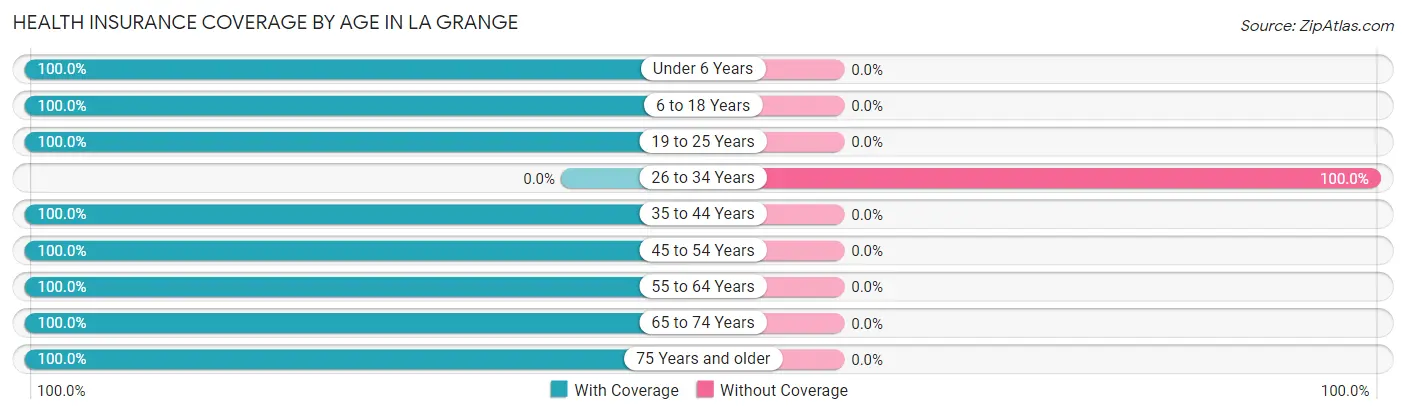
| Age Bracket | With Coverage | Without Coverage |
| Under 6 Years | 2 (100.0%) | 0 (0.0%) |
| 6 to 18 Years | 2 (100.0%) | 0 (0.0%) |
| 19 to 25 Years | 2 (100.0%) | 0 (0.0%) |
| 26 to 34 Years | 0 (0.0%) | 2 (100.0%) |
| 35 to 44 Years | 1 (100.0%) | 0 (0.0%) |
| 45 to 54 Years | 9 (100.0%) | 0 (0.0%) |
| 55 to 64 Years | 13 (100.0%) | 0 (0.0%) |
| 65 to 74 Years | 15 (100.0%) | 0 (0.0%) |
| 75 Years and older | 22 (100.0%) | 0 (0.0%) |
| Total | 66 (97.1%) | 2 (2.9%) |
Health Insurance Coverage by Citizenship Status in La Grange
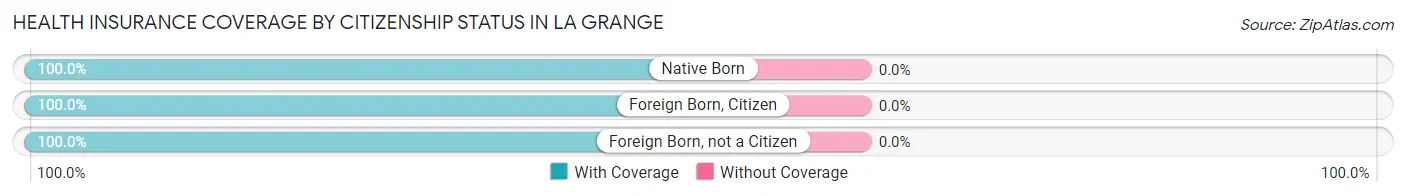
| Citizenship Status | With Coverage | Without Coverage |
| Native Born | 2 (100.0%) | 0 (0.0%) |
| Foreign Born, Citizen | 2 (100.0%) | 0 (0.0%) |
| Foreign Born, not a Citizen | 2 (100.0%) | 0 (0.0%) |
Health Insurance Coverage by Household Income in La Grange
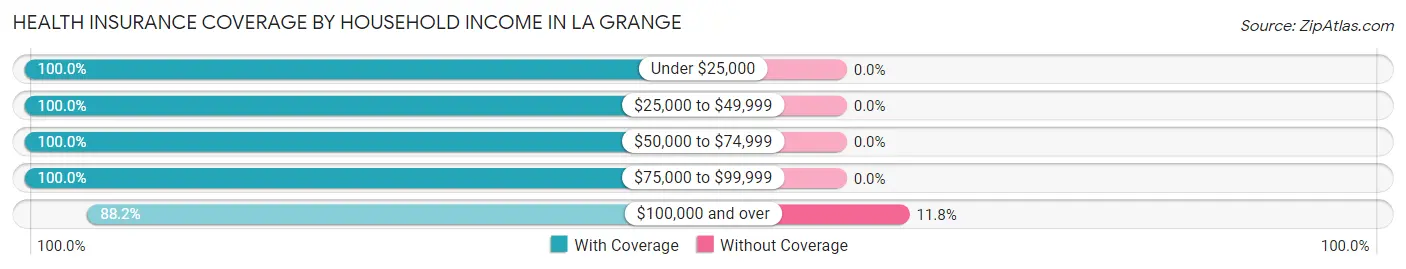
| Household Income | With Coverage | Without Coverage |
| Under $25,000 | 6 (100.0%) | 0 (0.0%) |
| $25,000 to $49,999 | 24 (100.0%) | 0 (0.0%) |
| $50,000 to $74,999 | 10 (100.0%) | 0 (0.0%) |
| $75,000 to $99,999 | 11 (100.0%) | 0 (0.0%) |
| $100,000 and over | 15 (88.2%) | 2 (11.8%) |
Public vs Private Health Insurance Coverage by Age in La Grange
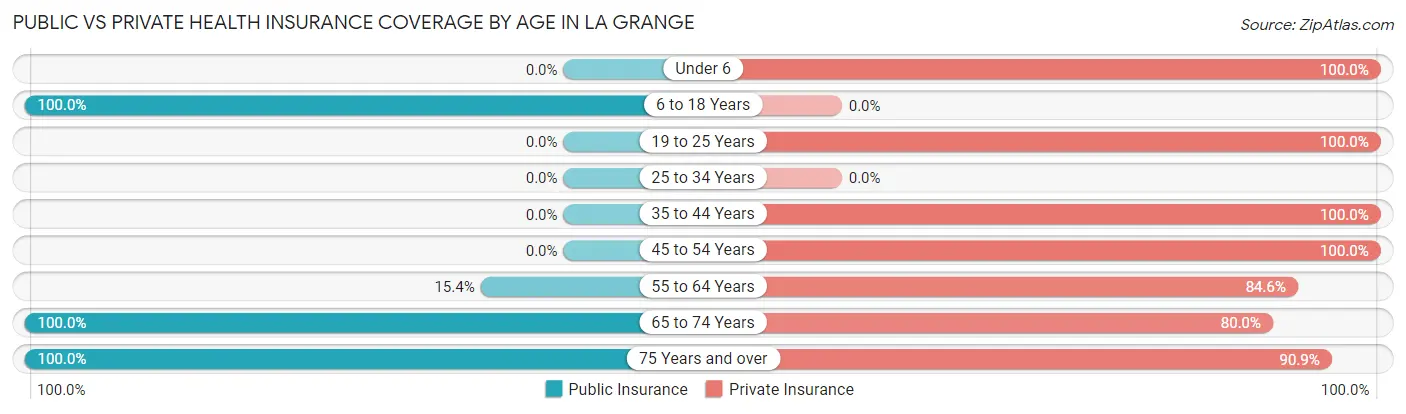
| Age Bracket | Public Insurance | Private Insurance |
| Under 6 | 0 (0.0%) | 2 (100.0%) |
| 6 to 18 Years | 2 (100.0%) | 0 (0.0%) |
| 19 to 25 Years | 0 (0.0%) | 2 (100.0%) |
| 25 to 34 Years | 0 (0.0%) | 0 (0.0%) |
| 35 to 44 Years | 0 (0.0%) | 1 (100.0%) |
| 45 to 54 Years | 0 (0.0%) | 9 (100.0%) |
| 55 to 64 Years | 2 (15.4%) | 11 (84.6%) |
| 65 to 74 Years | 15 (100.0%) | 12 (80.0%) |
| 75 Years and over | 22 (100.0%) | 20 (90.9%) |
| Total | 41 (60.3%) | 57 (83.8%) |
Disability Status by Sex by Age in La Grange
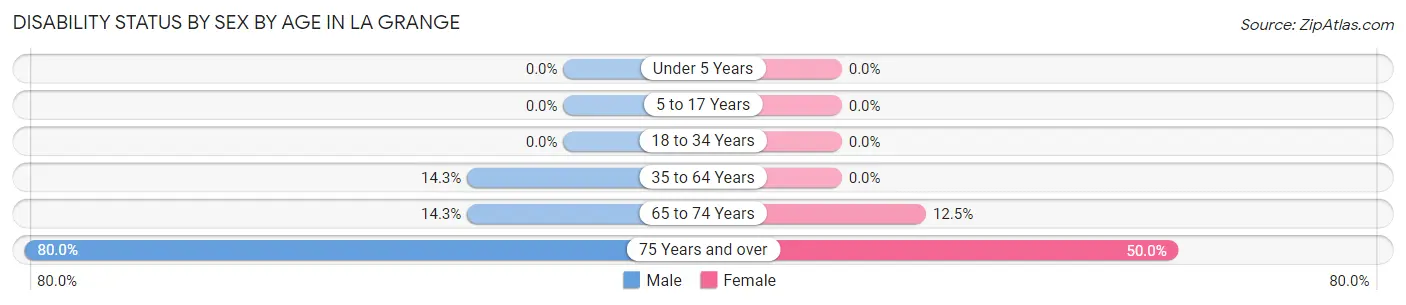
| Age Bracket | Male | Female |
| Under 5 Years | 0 (0.0%) | 0 (0.0%) |
| 5 to 17 Years | 0 (0.0%) | 0 (0.0%) |
| 18 to 34 Years | 0 (0.0%) | 0 (0.0%) |
| 35 to 64 Years | 2 (14.3%) | 0 (0.0%) |
| 65 to 74 Years | 1 (14.3%) | 1 (12.5%) |
| 75 Years and over | 8 (80.0%) | 6 (50.0%) |
Disability Class by Sex by Age in La Grange
Disability Class: Hearing Difficulty
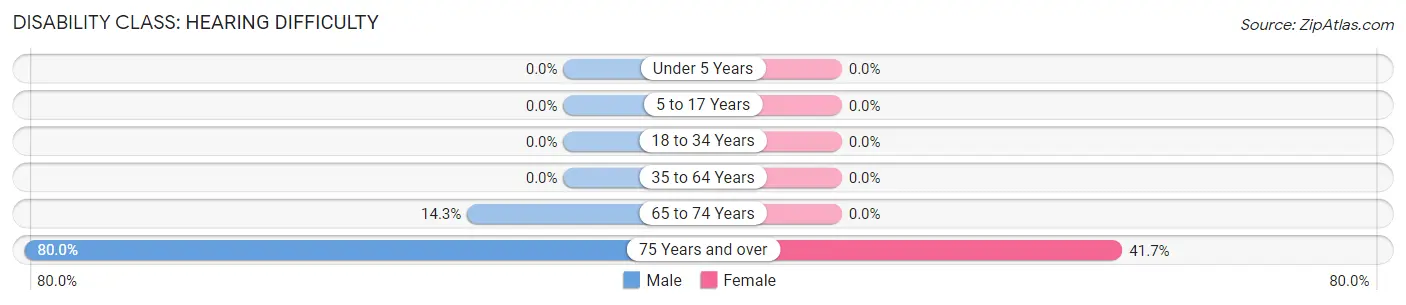
| Age Bracket | Male | Female |
| Under 5 Years | 0 (0.0%) | 0 (0.0%) |
| 5 to 17 Years | 0 (0.0%) | 0 (0.0%) |
| 18 to 34 Years | 0 (0.0%) | 0 (0.0%) |
| 35 to 64 Years | 0 (0.0%) | 0 (0.0%) |
| 65 to 74 Years | 1 (14.3%) | 0 (0.0%) |
| 75 Years and over | 8 (80.0%) | 5 (41.7%) |
Disability Class: Vision Difficulty
| Age Bracket | Male | Female |
| Under 5 Years | 0 (0.0%) | 0 (0.0%) |
| 5 to 17 Years | 0 (0.0%) | 0 (0.0%) |
| 18 to 34 Years | 0 (0.0%) | 0 (0.0%) |
| 35 to 64 Years | 0 (0.0%) | 0 (0.0%) |
| 65 to 74 Years | 0 (0.0%) | 0 (0.0%) |
| 75 Years and over | 0 (0.0%) | 0 (0.0%) |
Disability Class: Cognitive Difficulty
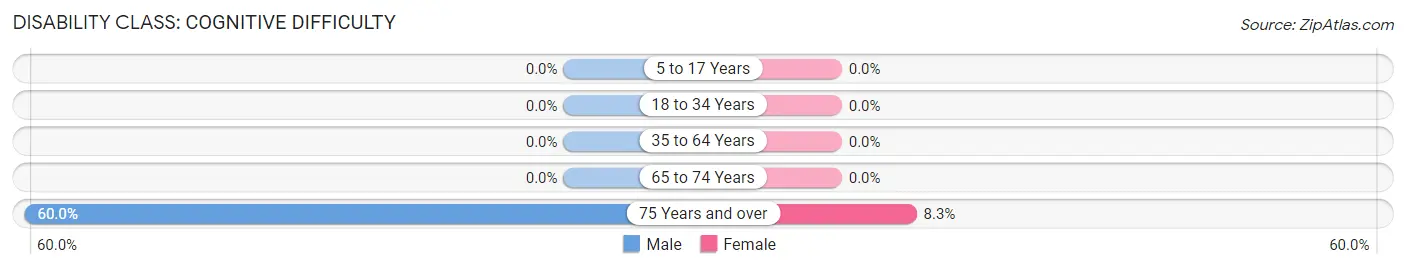
| Age Bracket | Male | Female |
| 5 to 17 Years | 0 (0.0%) | 0 (0.0%) |
| 18 to 34 Years | 0 (0.0%) | 0 (0.0%) |
| 35 to 64 Years | 0 (0.0%) | 0 (0.0%) |
| 65 to 74 Years | 0 (0.0%) | 0 (0.0%) |
| 75 Years and over | 6 (60.0%) | 1 (8.3%) |
Disability Class: Ambulatory Difficulty
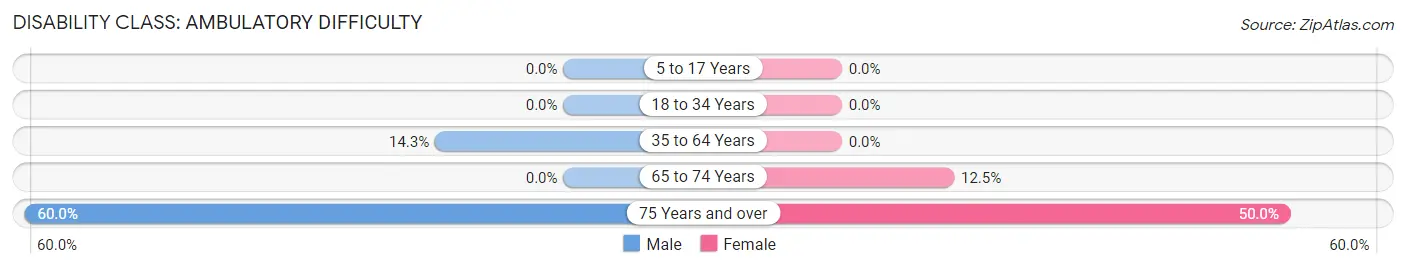
| Age Bracket | Male | Female |
| 5 to 17 Years | 0 (0.0%) | 0 (0.0%) |
| 18 to 34 Years | 0 (0.0%) | 0 (0.0%) |
| 35 to 64 Years | 2 (14.3%) | 0 (0.0%) |
| 65 to 74 Years | 0 (0.0%) | 1 (12.5%) |
| 75 Years and over | 6 (60.0%) | 6 (50.0%) |
Disability Class: Self-Care Difficulty
| Age Bracket | Male | Female |
| 5 to 17 Years | 0 (0.0%) | 0 (0.0%) |
| 18 to 34 Years | 0 (0.0%) | 0 (0.0%) |
| 35 to 64 Years | 0 (0.0%) | 0 (0.0%) |
| 65 to 74 Years | 0 (0.0%) | 0 (0.0%) |
| 75 Years and over | 0 (0.0%) | 1 (8.3%) |
Technology Access in La Grange
Computing Device Access in La Grange
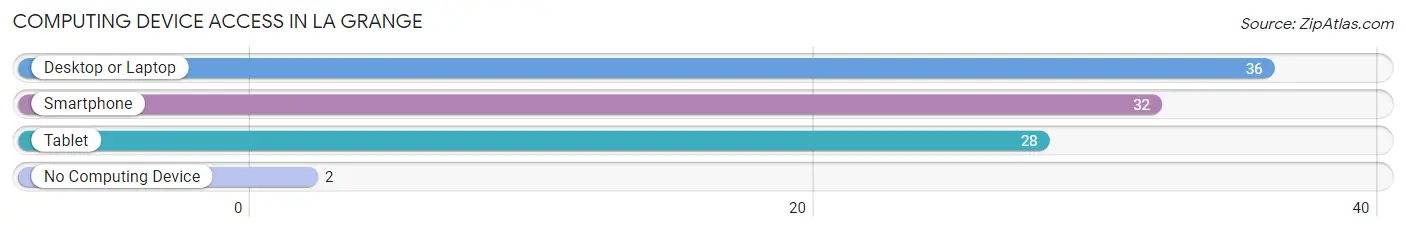
| Device Type | # Households | % Households |
| Desktop or Laptop | 36 | 83.7% |
| Smartphone | 32 | 74.4% |
| Tablet | 28 | 65.1% |
| No Computing Device | 2 | 4.6% |
| Total | 43 | 100.0% |
Internet Access in La Grange
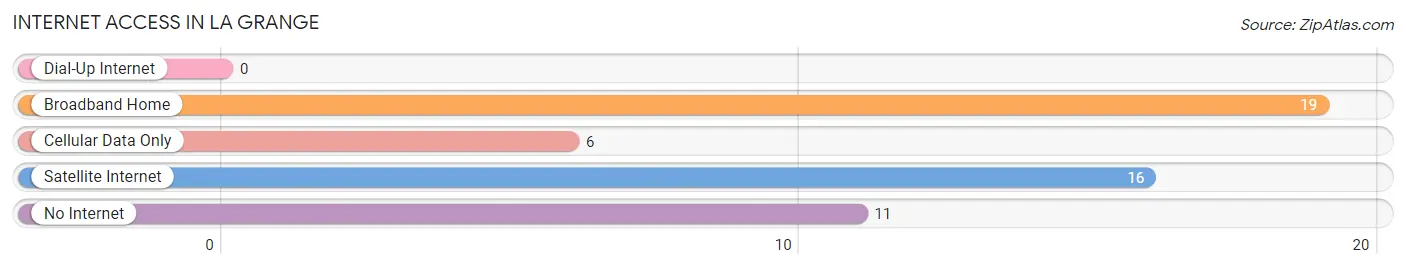
| Internet Type | # Households | % Households |
| Dial-Up Internet | 0 | 0.0% |
| Broadband Home | 19 | 44.2% |
| Cellular Data Only | 6 | 14.0% |
| Satellite Internet | 16 | 37.2% |
| No Internet | 11 | 25.6% |
| Total | 43 | 100.0% |
La Grange Summary
La Grange is a small town located in Fayette County, Tennessee. It is situated in the western part of the state, approximately 30 miles east of Memphis. The town was founded in 1820 and has a population of approximately 1,500 people.
History
La Grange was founded in 1820 by a group of settlers from North Carolina. The town was named after the French city of La Grange, which was the birthplace of one of the settlers. The town was originally a farming community, but it soon developed into a small industrial center. The town was home to several factories, including a cotton mill, a sawmill, and a gristmill.
In the late 19th century, La Grange became a popular tourist destination. The town was home to several resorts, including the La Grange Hotel, which was built in 1887. The hotel was a popular destination for wealthy tourists from Memphis and other nearby cities.
In the early 20th century, La Grange experienced a period of decline. The town's factories closed and the tourist industry declined. The town was also hit hard by the Great Depression. However, the town began to experience a resurgence in the 1950s and 1960s. The town was home to several new businesses, including a furniture factory and a clothing factory.
Geography
La Grange is located in western Tennessee, approximately 30 miles east of Memphis. The town is situated in the foothills of the Appalachian Mountains. The town is located on the banks of the Wolf River, which flows through the town. The town is surrounded by rolling hills and forests.
Economy
La Grange is a small town with a limited economy. The town is home to several small businesses, including a furniture factory, a clothing factory, and a sawmill. The town is also home to several restaurants and shops.
Demographics
As of the 2010 census, La Grange had a population of 1,500 people. The town is predominantly white, with approximately 95% of the population being white. The median household income in La Grange is $35,000. The town has a poverty rate of 17.5%.
Common Questions
What is Per Capita Income in La Grange?
Per Capita income in La Grange is $44,562.
What is the Median Family Income in La Grange?
Median Family Income in La Grange is $83,750.
What is the Median Household income in La Grange?
Median Household Income in La Grange is $59,375.
What is Inequality or Gini Index in La Grange?
Inequality or Gini Index in La Grange is 0.37.
What is the Total Population of La Grange?
Total Population of La Grange is 68.
What is the Total Male Population of La Grange?
Total Male Population of La Grange is 32.
What is the Total Female Population of La Grange?
Total Female Population of La Grange is 36.
What is the Ratio of Males per 100 Females in La Grange?
There are 88.89 Males per 100 Females in La Grange.
What is the Ratio of Females per 100 Males in La Grange?
There are 112.50 Females per 100 Males in La Grange.
What is the Median Population Age in La Grange?
Median Population Age in La Grange is 66.4 Years.
What is the Average Family Size in La Grange
Average Family Size in La Grange is 2.2 People.
What is the Average Household Size in La Grange
Average Household Size in La Grange is 1.6 People.
How Large is the Labor Force in La Grange?
There are 35 People in the Labor Forcein in La Grange.
What is the Percentage of People in the Labor Force in La Grange?
54.7% of People are in the Labor Force in La Grange.