Walland, TN Map & Demographics
Walland Map
Walland Overview
$24,499
PER CAPITA INCOME
$57,583
AVG HOUSEHOLD INCOME
0.32
INEQUALITY / GINI INDEX
422
TOTAL POPULATION
217
MALE POPULATION
205
FEMALE POPULATION
105.85
MALES / 100 FEMALES
94.47
FEMALES / 100 MALES
31.6
MEDIAN AGE
3.3
AVG FAMILY SIZE
3.0
AVG HOUSEHOLD SIZE
217
LABOR FORCE [ PEOPLE ]
74.6%
PERCENT IN LABOR FORCE
17.5%
UNEMPLOYMENT RATE
Walland Zip Codes
Walland Area Codes
Income in Walland
Income Overview in Walland
| Characteristic | Number | Measure |
| Per Capita Income | 422 | $24,499 |
| Median Family Income | 117 | $0 |
| Mean Family Income | 117 | $76,455 |
| Median Household Income | 141 | $57,583 |
| Mean Household Income | 141 | $73,727 |
| Income Deficit | 117 | $0 |
| Wage / Income Gap (%) | 422 | 0.00% |
| Wage / Income Gap ($) | 422 | 100.00¢ per $1 |
| Gini / Inequality Index | 422 | 0.32 |
Earnings by Sex in Walland
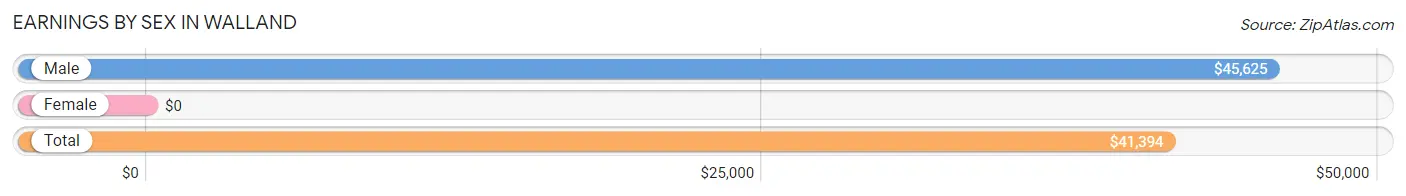
| Sex | Number | Average Earnings |
| Male | 97 (44.7%) | $45,625 |
| Female | 120 (55.3%) | $0 |
| Total | 217 (100.0%) | $41,394 |
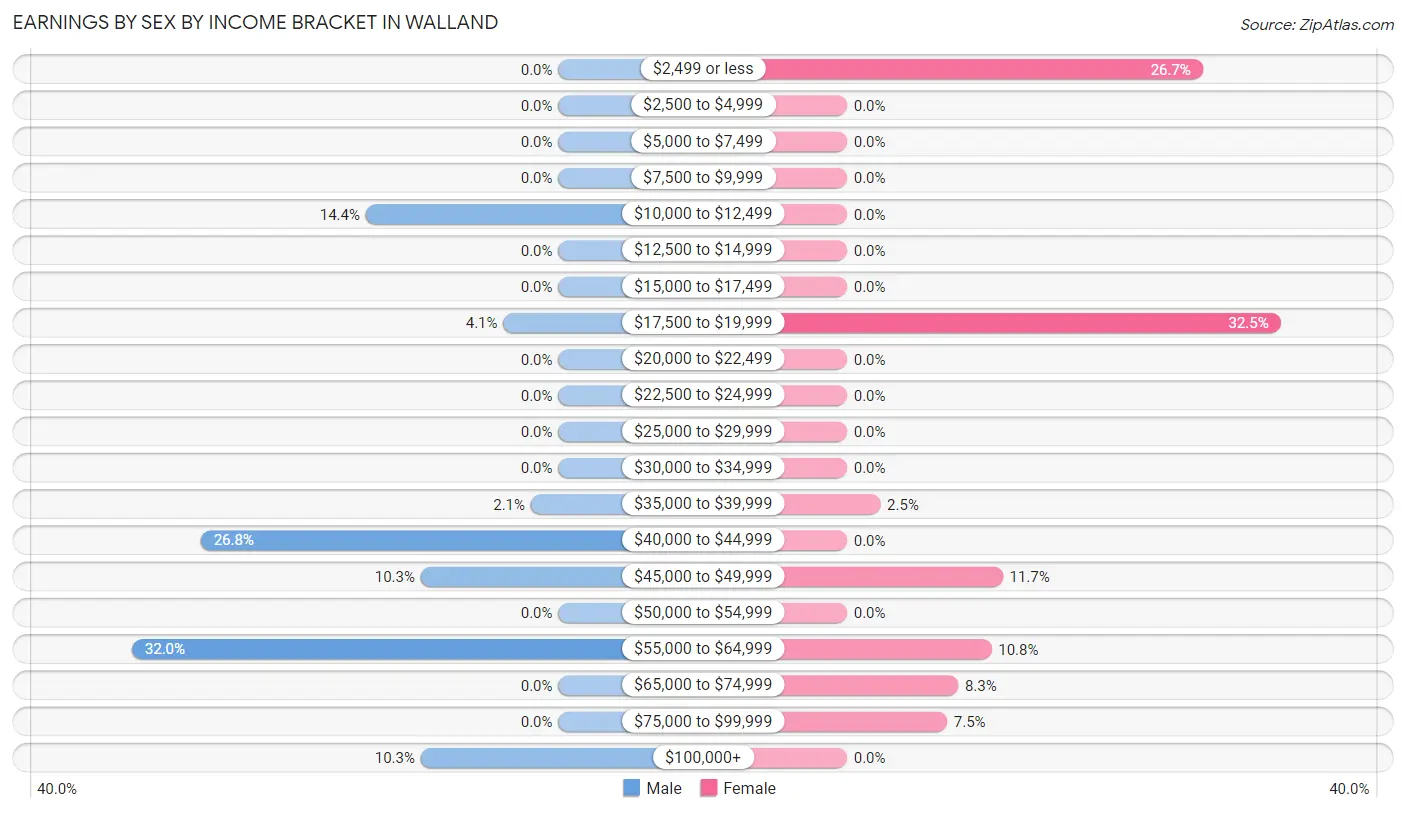
Earnings by Sex by Income Bracket in Walland
The most common earnings brackets in Walland are $55,000 to $64,999 for men (31 | 32.0%) and $17,500 to $19,999 for women (39 | 32.5%).
| Income | Male | Female |
| $2,499 or less | 0 (0.0%) | 32 (26.7%) |
| $2,500 to $4,999 | 0 (0.0%) | 0 (0.0%) |
| $5,000 to $7,499 | 0 (0.0%) | 0 (0.0%) |
| $7,500 to $9,999 | 0 (0.0%) | 0 (0.0%) |
| $10,000 to $12,499 | 14 (14.4%) | 0 (0.0%) |
| $12,500 to $14,999 | 0 (0.0%) | 0 (0.0%) |
| $15,000 to $17,499 | 0 (0.0%) | 0 (0.0%) |
| $17,500 to $19,999 | 4 (4.1%) | 39 (32.5%) |
| $20,000 to $22,499 | 0 (0.0%) | 0 (0.0%) |
| $22,500 to $24,999 | 0 (0.0%) | 0 (0.0%) |
| $25,000 to $29,999 | 0 (0.0%) | 0 (0.0%) |
| $30,000 to $34,999 | 0 (0.0%) | 0 (0.0%) |
| $35,000 to $39,999 | 2 (2.1%) | 3 (2.5%) |
| $40,000 to $44,999 | 26 (26.8%) | 0 (0.0%) |
| $45,000 to $49,999 | 10 (10.3%) | 14 (11.7%) |
| $50,000 to $54,999 | 0 (0.0%) | 0 (0.0%) |
| $55,000 to $64,999 | 31 (32.0%) | 13 (10.8%) |
| $65,000 to $74,999 | 0 (0.0%) | 10 (8.3%) |
| $75,000 to $99,999 | 0 (0.0%) | 9 (7.5%) |
| $100,000+ | 10 (10.3%) | 0 (0.0%) |
| Total | 97 (100.0%) | 120 (100.0%) |
Earnings by Sex by Educational Attainment in Walland
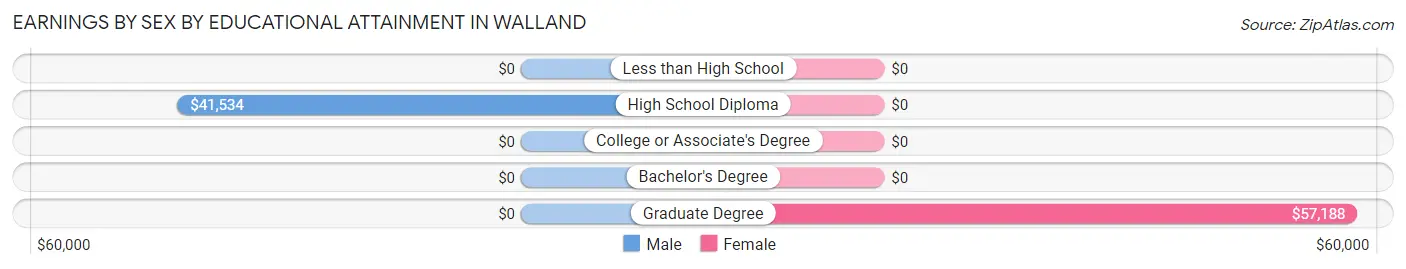
| Educational Attainment | Male Income | Female Income |
| Less than High School | - | - |
| High School Diploma | $41,534 | $0 |
| College or Associate's Degree | - | - |
| Bachelor's Degree | - | - |
| Graduate Degree | - | - |
| Total | $45,625 | $0 |
Family Income in Walland
Family Income Brackets in Walland
According to the Walland family income data, there are 52 families falling into the $35,000 to $49,999 income range, which is the most common income bracket and makes up 44.4% of all families.
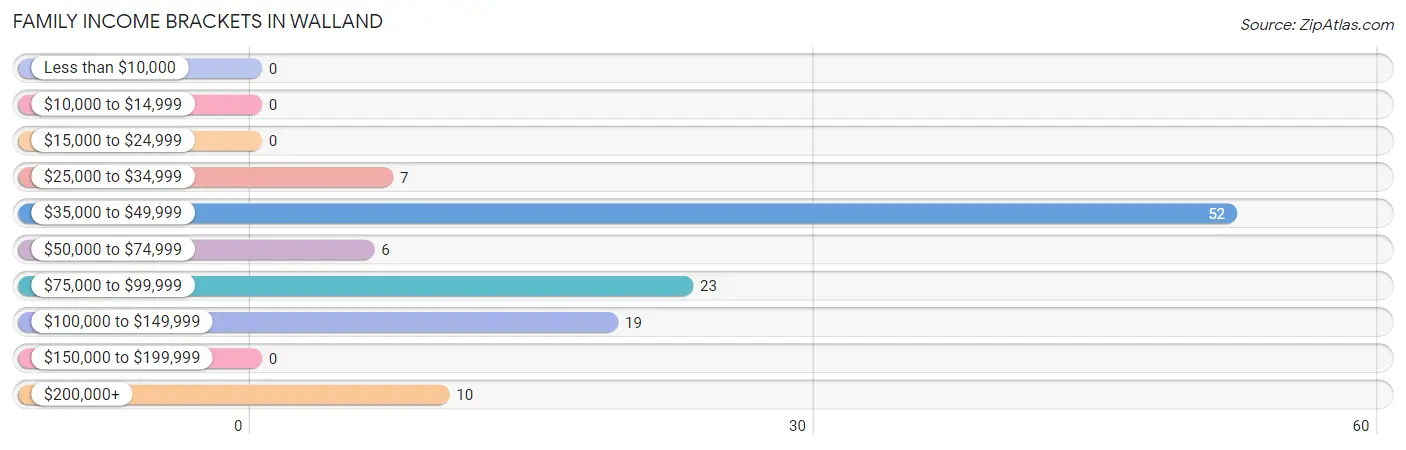
| Income Bracket | # Families | % Families |
| Less than $10,000 | 0 | 0.0% |
| $10,000 to $14,999 | 0 | 0.0% |
| $15,000 to $24,999 | 0 | 0.0% |
| $25,000 to $34,999 | 7 | 6.0% |
| $35,000 to $49,999 | 52 | 44.4% |
| $50,000 to $74,999 | 6 | 5.1% |
| $75,000 to $99,999 | 23 | 19.7% |
| $100,000 to $149,999 | 19 | 16.2% |
| $150,000 to $199,999 | 0 | 0.0% |
| $200,000+ | 10 | 8.5% |
Family Income by Famaliy Size in Walland
2-person families (59 | 50.4%) account for the highest median family income in Walland with $76,161 per family, while 2-person families (59 | 50.4%) have the highest median income of $38,080 per family member.
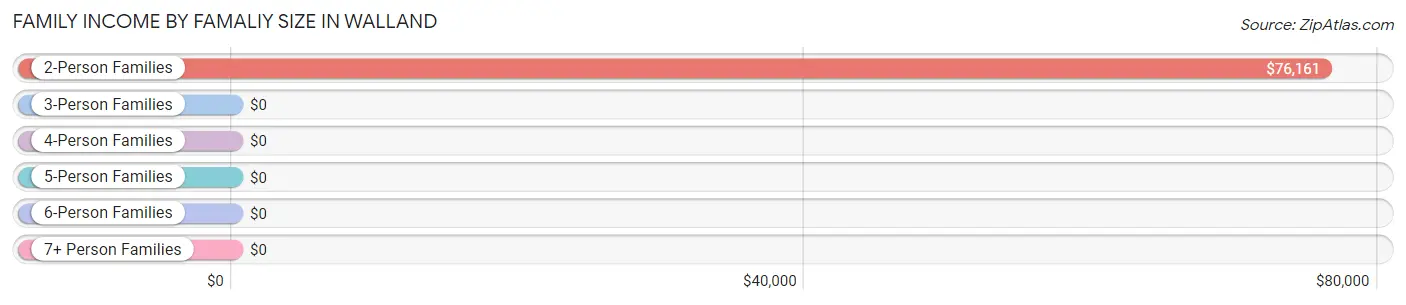
| Income Bracket | # Families | Median Income |
| 2-Person Families | 59 (50.4%) | $76,161 |
| 3-Person Families | 16 (13.7%) | $0 |
| 4-Person Families | 10 (8.6%) | $0 |
| 5-Person Families | 0 (0.0%) | $0 |
| 6-Person Families | 32 (27.4%) | $0 |
| 7+ Person Families | 0 (0.0%) | $0 |
| Total | 117 (100.0%) | $0 |
Family Income by Number of Earners in Walland
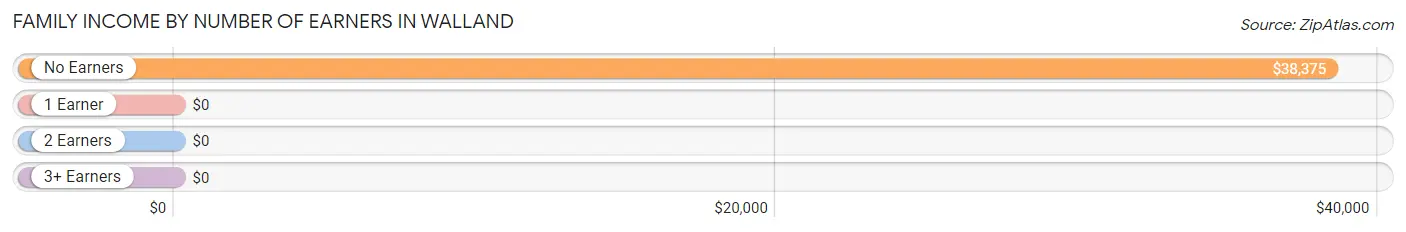
| Number of Earners | # Families | Median Income |
| No Earners | 21 (17.9%) | $38,375 |
| 1 Earner | 21 (17.9%) | $0 |
| 2 Earners | 75 (64.1%) | $0 |
| 3+ Earners | 0 (0.0%) | $0 |
| Total | 117 (100.0%) | $0 |
Household Income in Walland
Household Income Brackets in Walland
With 57 households falling in the category, the $35,000 to $49,999 income range is the most frequent in Walland, accounting for 40.4% of all households.
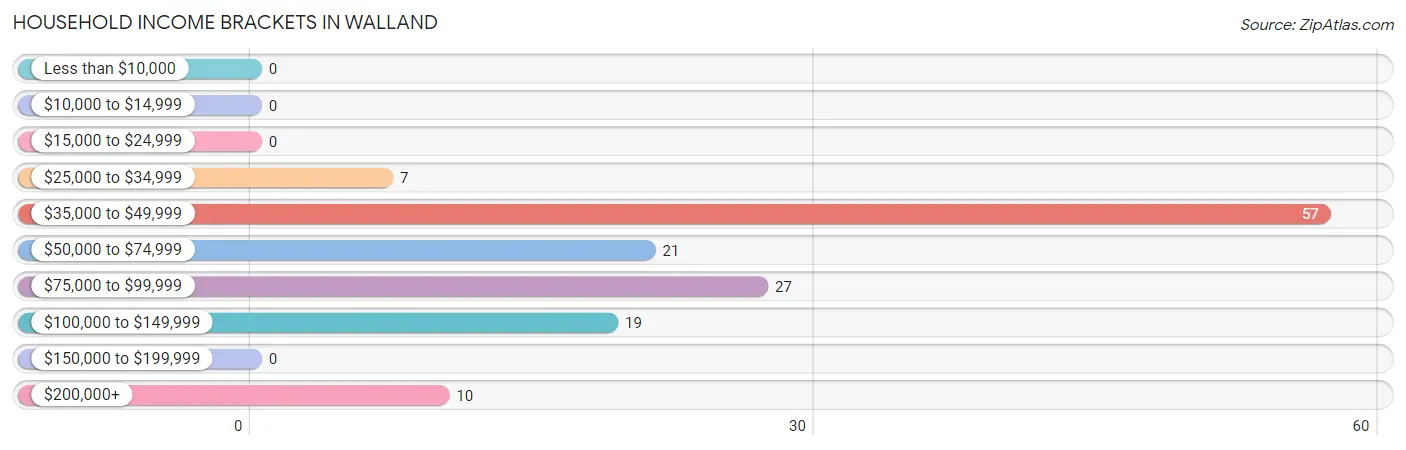
| Income Bracket | # Households | % Households |
| Less than $10,000 | 0 | 0.0% |
| $10,000 to $14,999 | 0 | 0.0% |
| $15,000 to $24,999 | 0 | 0.0% |
| $25,000 to $34,999 | 7 | 5.0% |
| $35,000 to $49,999 | 57 | 40.4% |
| $50,000 to $74,999 | 21 | 14.9% |
| $75,000 to $99,999 | 27 | 19.1% |
| $100,000 to $149,999 | 19 | 13.5% |
| $150,000 to $199,999 | 0 | 0.0% |
| $200,000+ | 10 | 7.1% |
Household Income by Householder Age in Walland
The median household income in Walland is $57,583, with the highest median household income of $75,268 found in the 65+ years age bracket for the primary householder. A total of 25 households (17.7%) fall into this category.
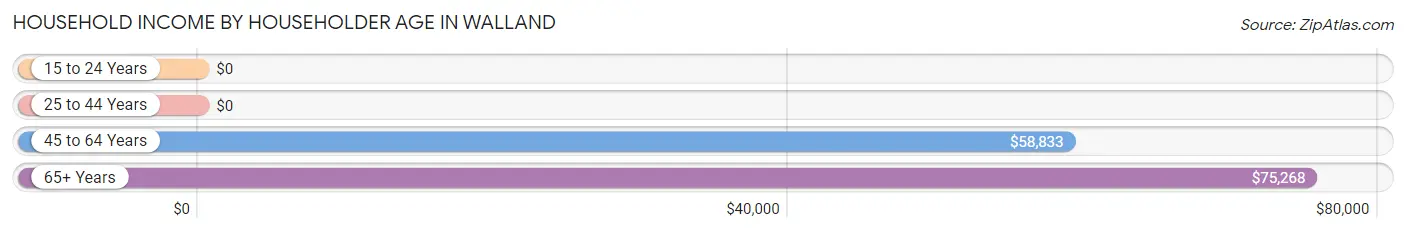
| Income Bracket | # Households | Median Income |
| 15 to 24 Years | 0 (0.0%) | $0 |
| 25 to 44 Years | 56 (39.7%) | $0 |
| 45 to 64 Years | 60 (42.5%) | $58,833 |
| 65+ Years | 25 (17.7%) | $75,268 |
| Total | 141 (100.0%) | $57,583 |
Poverty in Walland
Income Below Poverty by Sex and Age in Walland
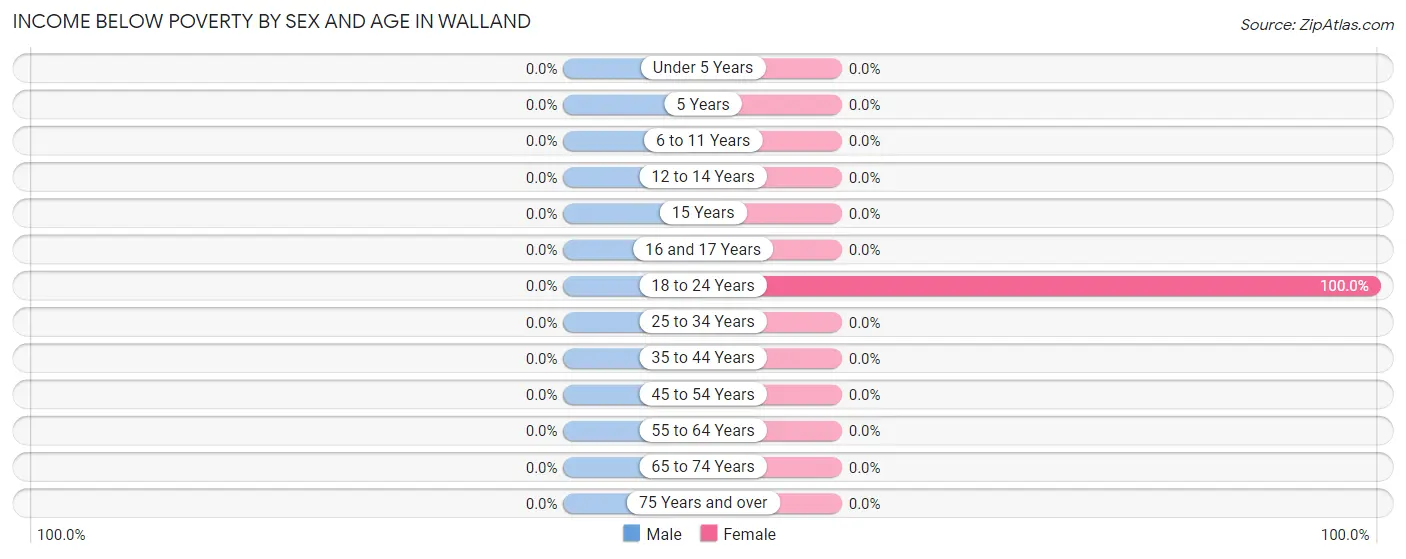
| Age Bracket | Male | Female |
| Under 5 Years | 0 (0.0%) | 0 (0.0%) |
| 5 Years | 0 (0.0%) | 0 (0.0%) |
| 6 to 11 Years | 0 (0.0%) | 0 (0.0%) |
| 12 to 14 Years | 0 (0.0%) | 0 (0.0%) |
| 15 Years | 0 (0.0%) | 0 (0.0%) |
| 16 and 17 Years | 0 (0.0%) | 0 (0.0%) |
| 18 to 24 Years | 0 (0.0%) | 6 (100.0%) |
| 25 to 34 Years | 0 (0.0%) | 0 (0.0%) |
| 35 to 44 Years | 0 (0.0%) | 0 (0.0%) |
| 45 to 54 Years | 0 (0.0%) | 0 (0.0%) |
| 55 to 64 Years | 0 (0.0%) | 0 (0.0%) |
| 65 to 74 Years | 0 (0.0%) | 0 (0.0%) |
| 75 Years and over | 0 (0.0%) | 0 (0.0%) |
| Total | 0 (0.0%) | 6 (2.9%) |
Income Above Poverty by Sex and Age in Walland
According to the poverty statistics in Walland, males aged under 5 years and females aged under 5 years are the age groups that are most secure financially, with 100.0% of males and 100.0% of females in these age groups living above the poverty line.
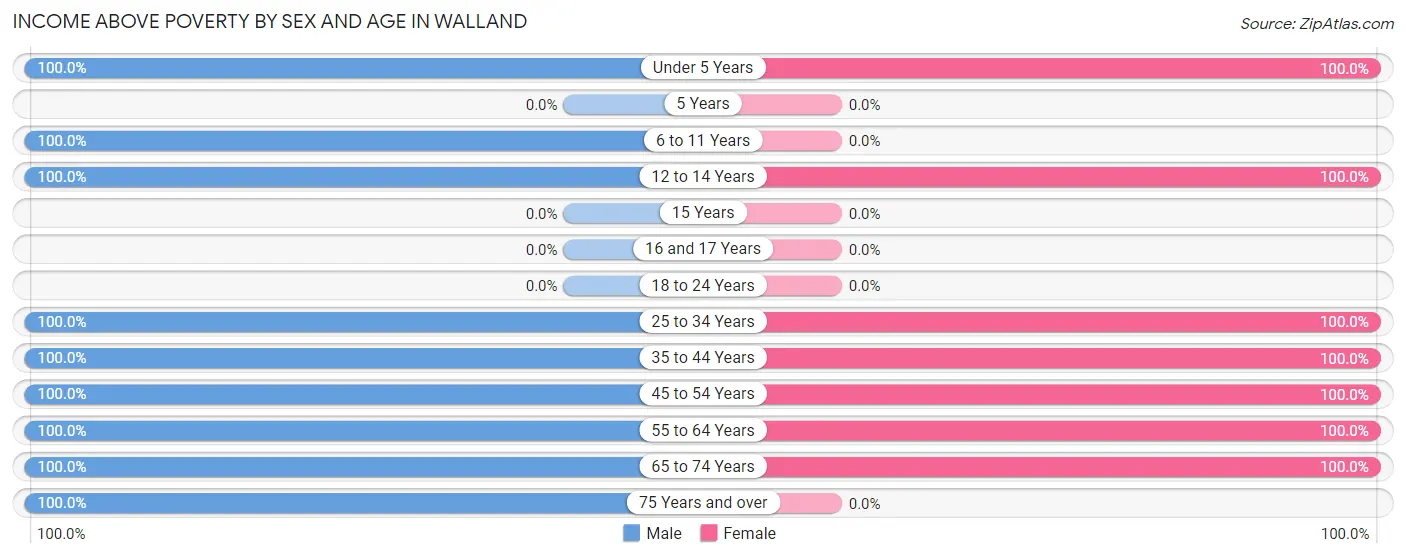
| Age Bracket | Male | Female |
| Under 5 Years | 20 (100.0%) | 9 (100.0%) |
| 5 Years | 0 (0.0%) | 0 (0.0%) |
| 6 to 11 Years | 47 (100.0%) | 0 (0.0%) |
| 12 to 14 Years | 10 (100.0%) | 45 (100.0%) |
| 15 Years | 0 (0.0%) | 0 (0.0%) |
| 16 and 17 Years | 0 (0.0%) | 0 (0.0%) |
| 18 to 24 Years | 0 (0.0%) | 0 (0.0%) |
| 25 to 34 Years | 17 (100.0%) | 74 (100.0%) |
| 35 to 44 Years | 29 (100.0%) | 28 (100.0%) |
| 45 to 54 Years | 24 (100.0%) | 5 (100.0%) |
| 55 to 64 Years | 46 (100.0%) | 15 (100.0%) |
| 65 to 74 Years | 18 (100.0%) | 23 (100.0%) |
| 75 Years and over | 6 (100.0%) | 0 (0.0%) |
| Total | 217 (100.0%) | 199 (97.1%) |
Income Below Poverty Among Married-Couple Families in Walland
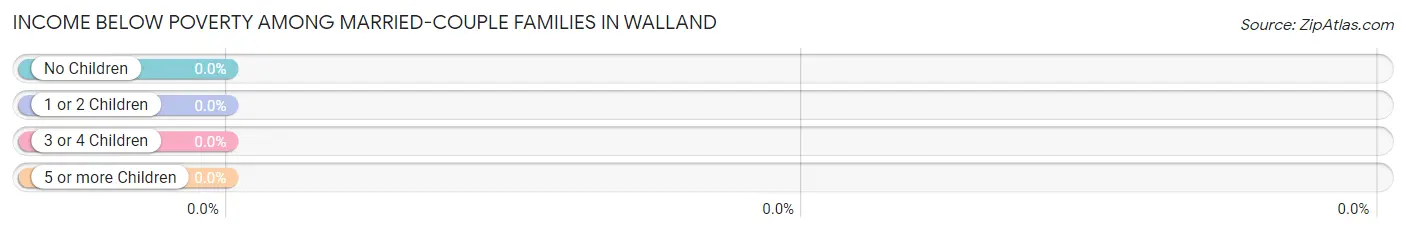
| Children | Above Poverty | Below Poverty |
| No Children | 59 (100.0%) | 0 (0.0%) |
| 1 or 2 Children | 21 (100.0%) | 0 (0.0%) |
| 3 or 4 Children | 32 (100.0%) | 0 (0.0%) |
| 5 or more Children | 0 (0.0%) | 0 (0.0%) |
| Total | 112 (100.0%) | 0 (0.0%) |
Income Below Poverty Among Single-Parent Households in Walland
| Children | Single Father | Single Mother |
| No Children | 0 (0.0%) | 0 (0.0%) |
| 1 or 2 Children | 0 (0.0%) | 0 (0.0%) |
| 3 or 4 Children | 0 (0.0%) | 0 (0.0%) |
| 5 or more Children | 0 (0.0%) | 0 (0.0%) |
| Total | 0 (0.0%) | 0 (0.0%) |
Income Below Poverty Among Married-Couple vs Single-Parent Households in Walland
| Children | Married-Couple Families | Single-Parent Households |
| No Children | 0 (0.0%) | 0 (0.0%) |
| 1 or 2 Children | 0 (0.0%) | 0 (0.0%) |
| 3 or 4 Children | 0 (0.0%) | 0 (0.0%) |
| 5 or more Children | 0 (0.0%) | 0 (0.0%) |
| Total | 0 (0.0%) | 0 (0.0%) |
Race in Walland
The most populous races in Walland are White / Caucasian (411 | 97.4%), Two or more Races (11 | 2.6%), and Hispanic or Latino (8 | 1.9%).
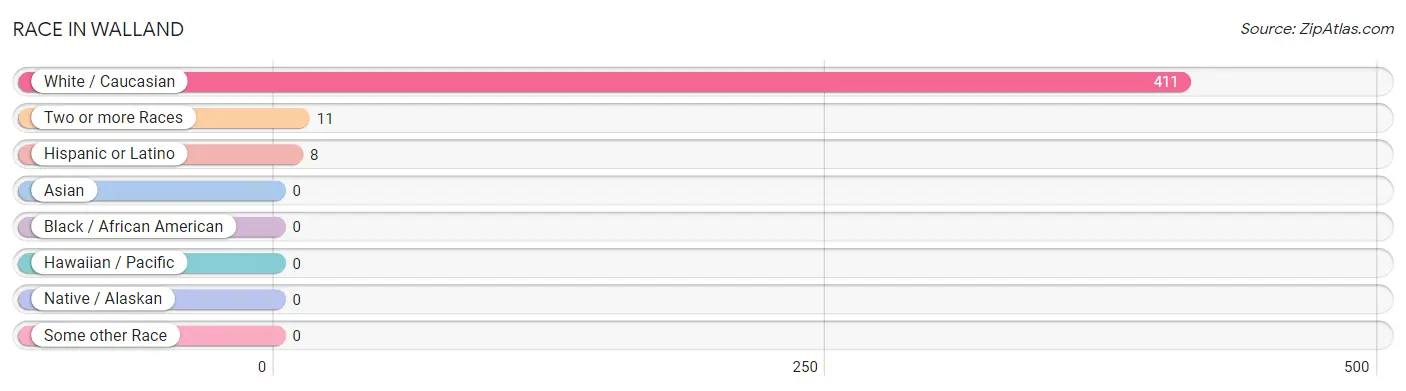
| Race | # Population | % Population |
| Asian | 0 | 0.0% |
| Black / African American | 0 | 0.0% |
| Hawaiian / Pacific | 0 | 0.0% |
| Hispanic or Latino | 8 | 1.9% |
| Native / Alaskan | 0 | 0.0% |
| White / Caucasian | 411 | 97.4% |
| Two or more Races | 11 | 2.6% |
| Some other Race | 0 | 0.0% |
| Total | 422 | 100.0% |
Ancestry in Walland
The most populous ancestries reported in Walland are German (80 | 19.0%), Irish (49 | 11.6%), European (30 | 7.1%), Scotch-Irish (28 | 6.6%), and Scottish (22 | 5.2%), together accounting for 49.5% of all Walland residents.
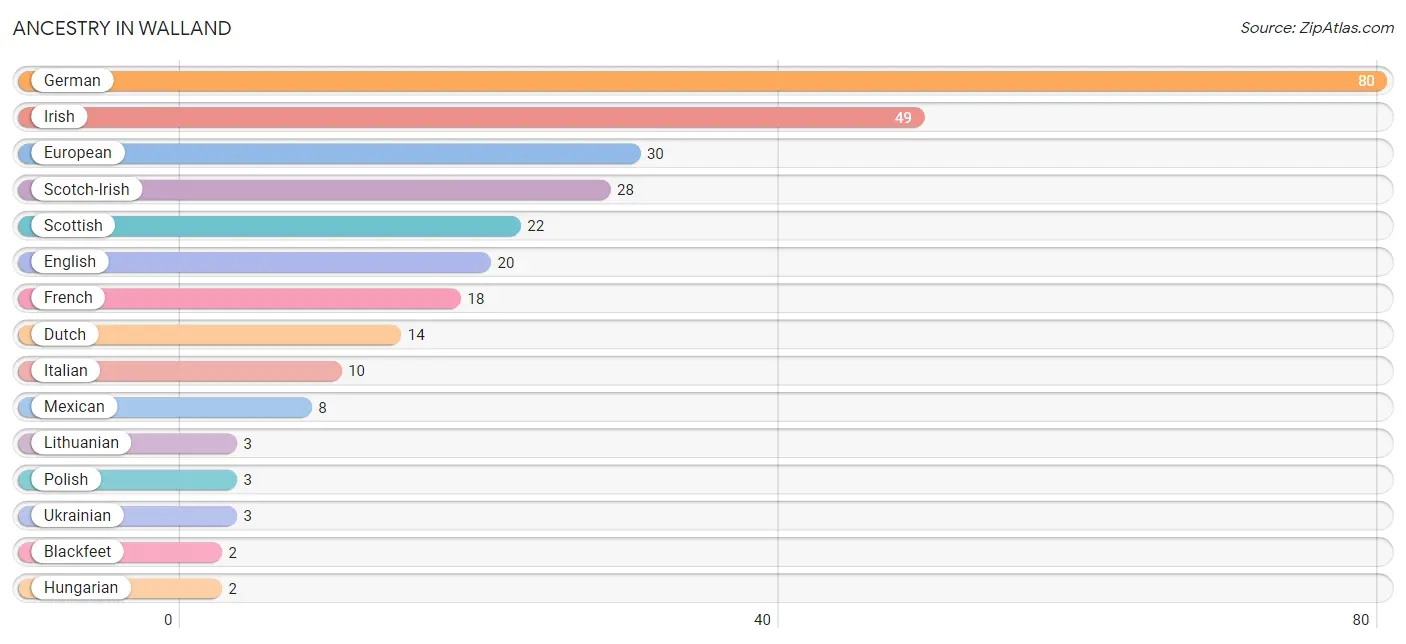
| Ancestry | # Population | % Population |
| Blackfeet | 2 | 0.5% |
| Dutch | 14 | 3.3% |
| English | 20 | 4.7% |
| European | 30 | 7.1% |
| French | 18 | 4.3% |
| German | 80 | 19.0% |
| Hungarian | 2 | 0.5% |
| Irish | 49 | 11.6% |
| Italian | 10 | 2.4% |
| Lithuanian | 3 | 0.7% |
| Maltese | 2 | 0.5% |
| Mexican | 8 | 1.9% |
| Polish | 3 | 0.7% |
| Scotch-Irish | 28 | 6.6% |
| Scottish | 22 | 5.2% |
| Ukrainian | 3 | 0.7% | View All 16 Rows |
Immigrants in Walland

| Immigration Origin | # Population | % Population | View All 0 Rows |
Sex and Age in Walland
Sex and Age in Walland
The most populous age groups in Walland are 10 to 14 Years (29 | 13.4%) for men and 10 to 14 Years (45 | 22.0%) for women.
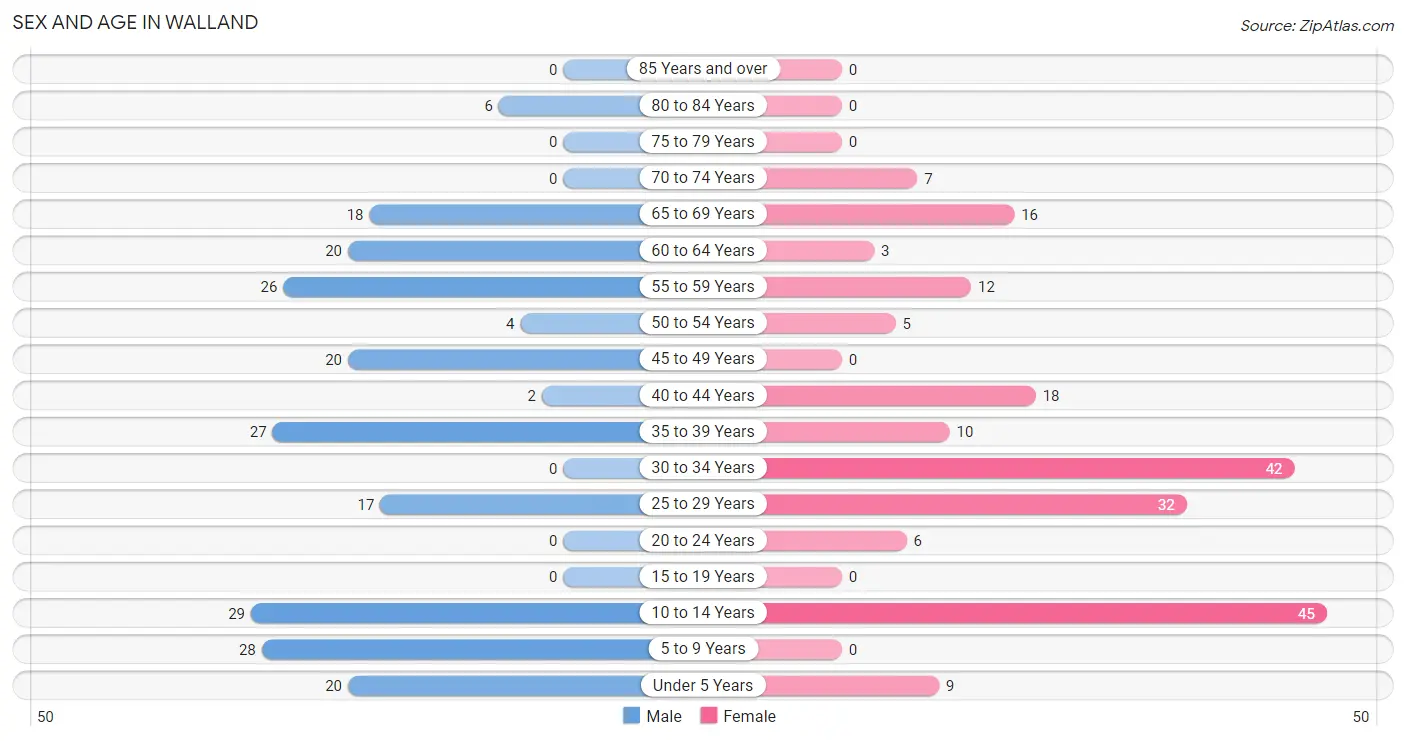
| Age Bracket | Male | Female |
| Under 5 Years | 20 (9.2%) | 9 (4.4%) |
| 5 to 9 Years | 28 (12.9%) | 0 (0.0%) |
| 10 to 14 Years | 29 (13.4%) | 45 (22.0%) |
| 15 to 19 Years | 0 (0.0%) | 0 (0.0%) |
| 20 to 24 Years | 0 (0.0%) | 6 (2.9%) |
| 25 to 29 Years | 17 (7.8%) | 32 (15.6%) |
| 30 to 34 Years | 0 (0.0%) | 42 (20.5%) |
| 35 to 39 Years | 27 (12.4%) | 10 (4.9%) |
| 40 to 44 Years | 2 (0.9%) | 18 (8.8%) |
| 45 to 49 Years | 20 (9.2%) | 0 (0.0%) |
| 50 to 54 Years | 4 (1.8%) | 5 (2.4%) |
| 55 to 59 Years | 26 (12.0%) | 12 (5.9%) |
| 60 to 64 Years | 20 (9.2%) | 3 (1.5%) |
| 65 to 69 Years | 18 (8.3%) | 16 (7.8%) |
| 70 to 74 Years | 0 (0.0%) | 7 (3.4%) |
| 75 to 79 Years | 0 (0.0%) | 0 (0.0%) |
| 80 to 84 Years | 6 (2.8%) | 0 (0.0%) |
| 85 Years and over | 0 (0.0%) | 0 (0.0%) |
| Total | 217 (100.0%) | 205 (100.0%) |
Families and Households in Walland
Median Family Size in Walland
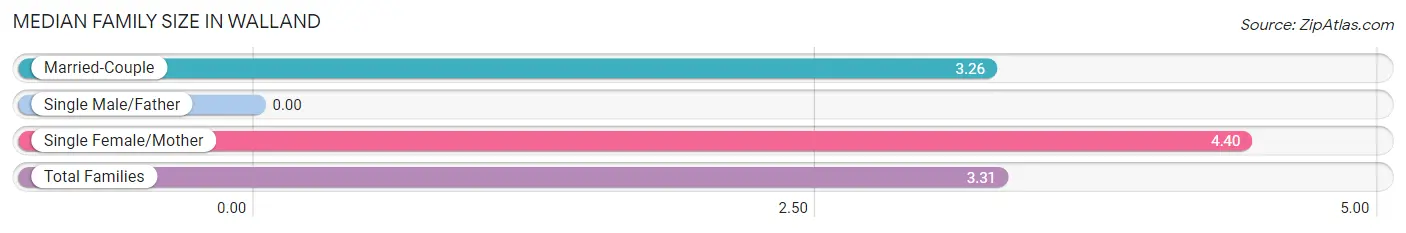
| Family Type | # Families | Family Size |
| Married-Couple | 112 (95.7%) | 3.26 |
| Single Male/Father | 0 (0.0%) | - |
| Single Female/Mother | 5 (4.3%) | 4.40 |
| Total Families | 117 (100.0%) | 3.31 |
Median Household Size in Walland
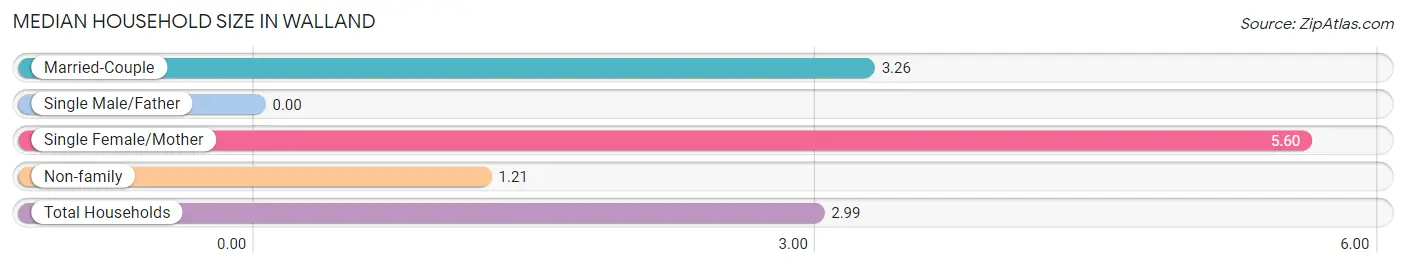
| Household Type | # Households | Household Size |
| Married-Couple | 112 (79.4%) | 3.26 |
| Single Male/Father | 0 (0.0%) | - |
| Single Female/Mother | 5 (3.5%) | 5.60 |
| Non-family | 24 (17.0%) | 1.21 |
| Total Households | 141 (100.0%) | 2.99 |
Household Size by Marriage Status in Walland
Out of a total of 141 households in Walland, 117 (83.0%) are family households, while 24 (17.0%) are nonfamily households. The most numerous type of family households are 2-person households, comprising 59, and the most common type of nonfamily households are 1-person households, comprising 20.
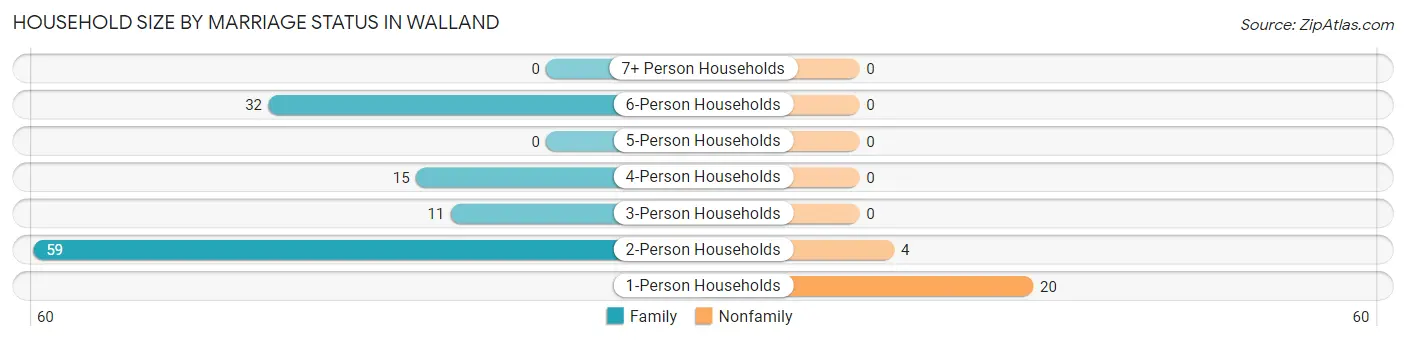
| Household Size | Family Households | Nonfamily Households |
| 1-Person Households | - | 20 (14.2%) |
| 2-Person Households | 59 (41.8%) | 4 (2.8%) |
| 3-Person Households | 11 (7.8%) | 0 (0.0%) |
| 4-Person Households | 15 (10.6%) | 0 (0.0%) |
| 5-Person Households | 0 (0.0%) | 0 (0.0%) |
| 6-Person Households | 32 (22.7%) | 0 (0.0%) |
| 7+ Person Households | 0 (0.0%) | 0 (0.0%) |
| Total | 117 (83.0%) | 24 (17.0%) |
Female Fertility in Walland
Fertility by Age in Walland
| Age Bracket | Women with Births | Births / 1,000 Women |
| 15 to 19 years | 0 (0.0%) | 0.0 |
| 20 to 34 years | 0 (0.0%) | 0.0 |
| 35 to 50 years | 0 (0.0%) | 0.0 |
| Total | 0 (0.0%) | 0.0 |
Fertility by Age by Marriage Status in Walland
| Age Bracket | Married | Unmarried |
| 15 to 19 years | 0 (0.0%) | 0 (0.0%) |
| 20 to 34 years | 0 (0.0%) | 0 (0.0%) |
| 35 to 50 years | 0 (0.0%) | 0 (0.0%) |
| Total | 0 (0.0%) | 0 (0.0%) |
Fertility by Education in Walland
| Educational Attainment | Women with Births | Births / 1,000 Women |
| Less than High School | 0 (0.0%) | 0.0 |
| High School Diploma | 0 (0.0%) | 0.0 |
| College or Associate's Degree | 0 (0.0%) | 0.0 |
| Bachelor's Degree | 0 (0.0%) | 0.0 |
| Graduate Degree | 0 (0.0%) | 0.0 |
| Total | 0 (0.0%) | 0.0 |
Fertility by Education by Marriage Status in Walland
| Educational Attainment | Married | Unmarried |
| Less than High School | 0 (0.0%) | 0 (0.0%) |
| High School Diploma | 0 (0.0%) | 0 (0.0%) |
| College or Associate's Degree | 0 (0.0%) | 0 (0.0%) |
| Bachelor's Degree | 0 (0.0%) | 0 (0.0%) |
| Graduate Degree | 0 (0.0%) | 0 (0.0%) |
| Total | 0 (0.0%) | 0 (0.0%) |
Employment Characteristics in Walland
Employment by Class of Employer in Walland
Among the 174 employed individuals in Walland, private company employees (142 | 81.6%), state government employees (18 | 10.3%), and not-for-profit organizations (14 | 8.1%) make up the most common classes of employment.
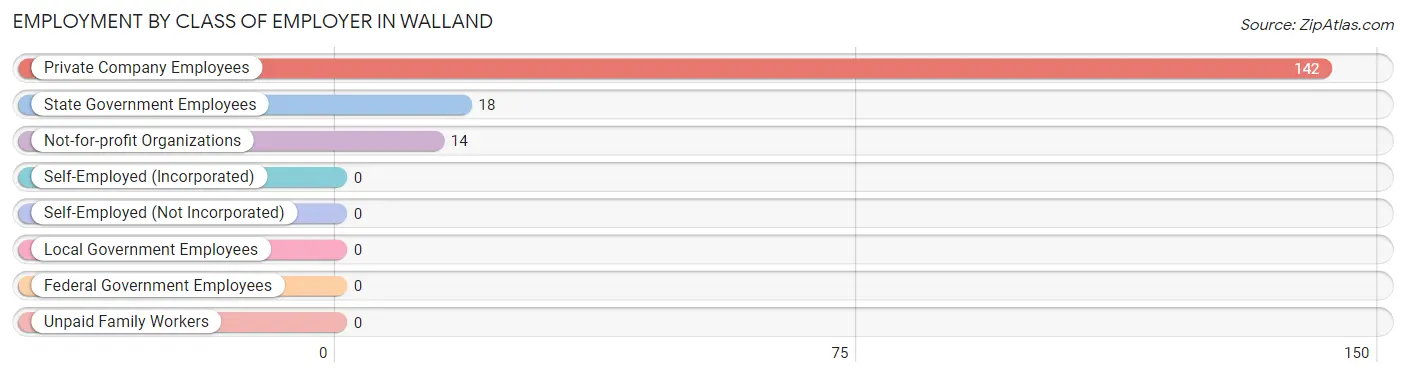
| Employer Class | # Employees | % Employees |
| Private Company Employees | 142 | 81.6% |
| Self-Employed (Incorporated) | 0 | 0.0% |
| Self-Employed (Not Incorporated) | 0 | 0.0% |
| Not-for-profit Organizations | 14 | 8.1% |
| Local Government Employees | 0 | 0.0% |
| State Government Employees | 18 | 10.3% |
| Federal Government Employees | 0 | 0.0% |
| Unpaid Family Workers | 0 | 0.0% |
| Total | 174 | 100.0% |
Employment Status by Age in Walland
According to the labor force statistics for Walland, out of the total population over 16 years of age (291), 74.6% or 217 individuals are in the labor force, with 17.5% or 38 of them unemployed. The age group with the highest labor force participation rate is 30 to 34 years, with 100.0% or 42 individuals in the labor force. Within the labor force, the 25 to 29 years age range has the highest percentage of unemployed individuals, with 100.0% or 32 of them being unemployed.
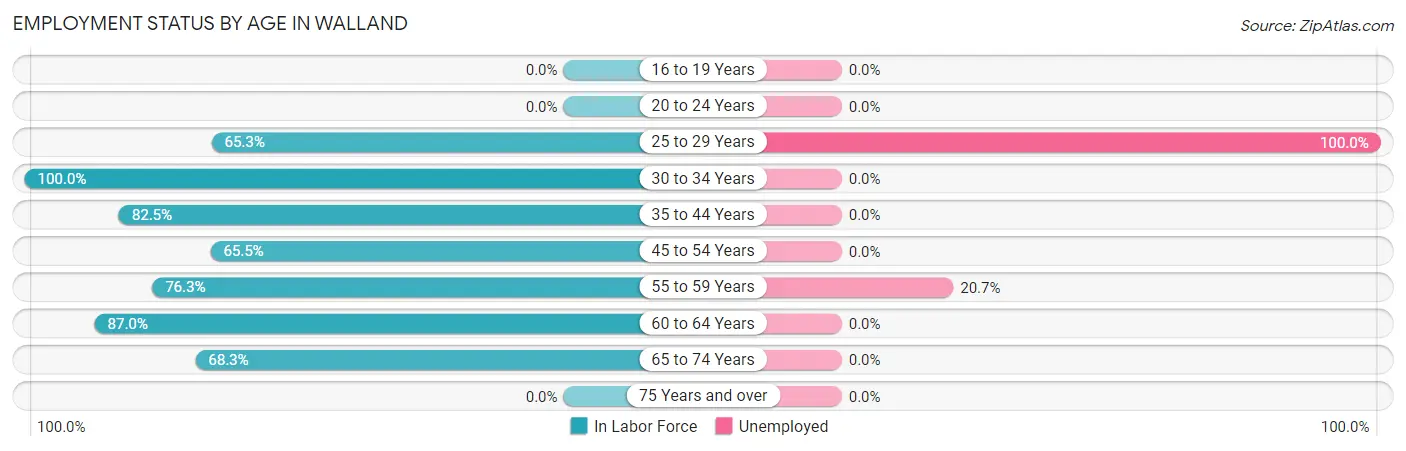
| Age Bracket | In Labor Force | Unemployed |
| 16 to 19 Years | 0 (0.0%) | 0 (0.0%) |
| 20 to 24 Years | 0 (0.0%) | 0 (0.0%) |
| 25 to 29 Years | 32 (65.3%) | 32 (100.0%) |
| 30 to 34 Years | 42 (100.0%) | 0 (0.0%) |
| 35 to 44 Years | 47 (82.5%) | 0 (0.0%) |
| 45 to 54 Years | 19 (65.5%) | 0 (0.0%) |
| 55 to 59 Years | 29 (76.3%) | 6 (20.7%) |
| 60 to 64 Years | 20 (87.0%) | 0 (0.0%) |
| 65 to 74 Years | 28 (68.3%) | 0 (0.0%) |
| 75 Years and over | 0 (0.0%) | 0 (0.0%) |
| Total | 217 (74.6%) | 38 (17.5%) |
Employment Status by Educational Attainment in Walland
According to labor force statistics for Walland, 79.4% of individuals (189) out of the total population between 25 and 64 years of age (238) are in the labor force, with 20.1% or 38 of them being unemployed. The group with the highest labor force participation rate are those with the educational attainment of bachelor's degree or higher, with 100.0% or 74 individuals in the labor force. Within the labor force, individuals with less than high school education have the highest percentage of unemployment, with 100.0% or 32 of them being unemployed.
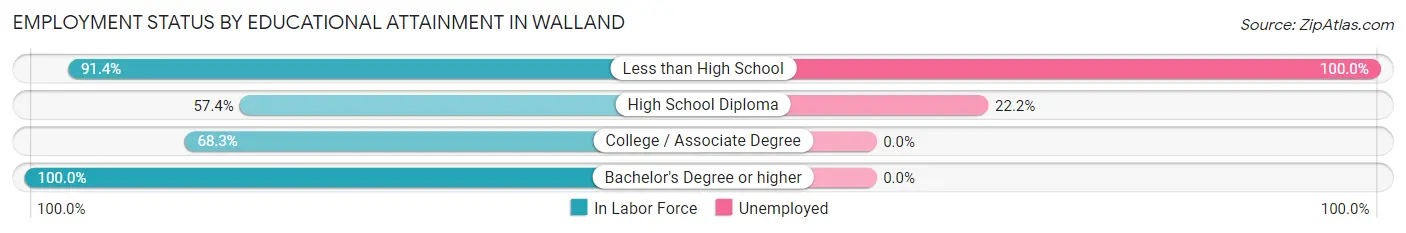
| Educational Attainment | In Labor Force | Unemployed |
| Less than High School | 32 (91.4%) | 35 (100.0%) |
| High School Diploma | 27 (57.4%) | 10 (22.2%) |
| College / Associate Degree | 56 (68.3%) | 0 (0.0%) |
| Bachelor's Degree or higher | 74 (100.0%) | 0 (0.0%) |
| Total | 189 (79.4%) | 48 (20.1%) |
Employment Occupations by Sex in Walland
Management, Business, Science and Arts Occupations
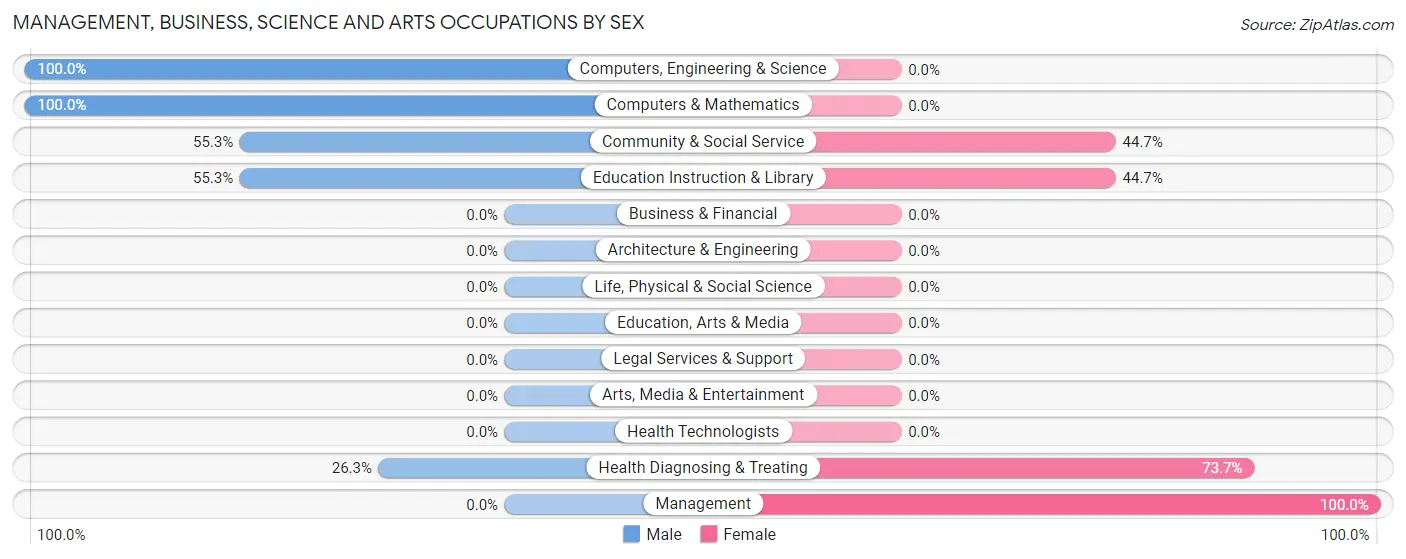
The most common Management, Business, Science and Arts occupations in Walland are Community & Social Service (38 | 21.2%), Education Instruction & Library (38 | 21.2%), Health Diagnosing & Treating (19 | 10.6%), Management (13 | 7.3%), and Computers, Engineering & Science (10 | 5.6%).
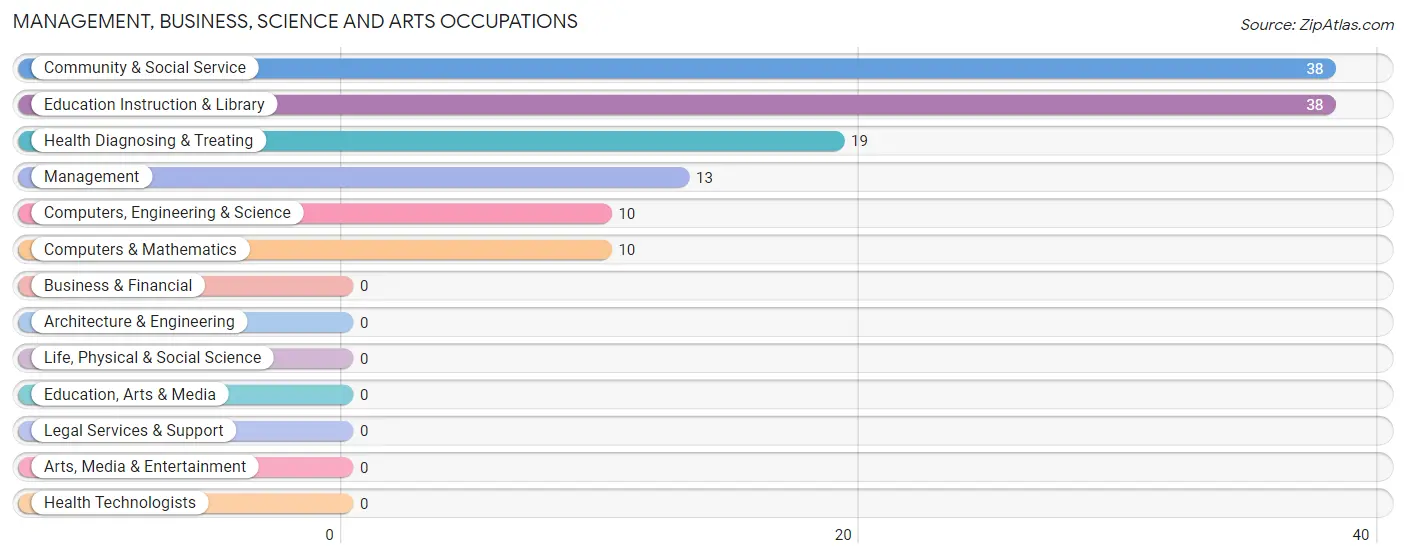
Management, Business, Science and Arts Occupations by Sex
Within the Management, Business, Science and Arts occupations in Walland, the most male-oriented occupations are Computers, Engineering & Science (100.0%), Computers & Mathematics (100.0%), and Community & Social Service (55.3%), while the most female-oriented occupations are Management (100.0%), Health Diagnosing & Treating (73.7%), and Community & Social Service (44.7%).
| Occupation | Male | Female |
| Management | 0 (0.0%) | 13 (100.0%) |
| Business & Financial | 0 (0.0%) | 0 (0.0%) |
| Computers, Engineering & Science | 10 (100.0%) | 0 (0.0%) |
| Computers & Mathematics | 10 (100.0%) | 0 (0.0%) |
| Architecture & Engineering | 0 (0.0%) | 0 (0.0%) |
| Life, Physical & Social Science | 0 (0.0%) | 0 (0.0%) |
| Community & Social Service | 21 (55.3%) | 17 (44.7%) |
| Education, Arts & Media | 0 (0.0%) | 0 (0.0%) |
| Legal Services & Support | 0 (0.0%) | 0 (0.0%) |
| Education Instruction & Library | 21 (55.3%) | 17 (44.7%) |
| Arts, Media & Entertainment | 0 (0.0%) | 0 (0.0%) |
| Health Diagnosing & Treating | 5 (26.3%) | 14 (73.7%) |
| Health Technologists | 0 (0.0%) | 0 (0.0%) |
| Total (Category) | 36 (45.0%) | 44 (55.0%) |
| Total (Overall) | 91 (50.8%) | 88 (49.2%) |
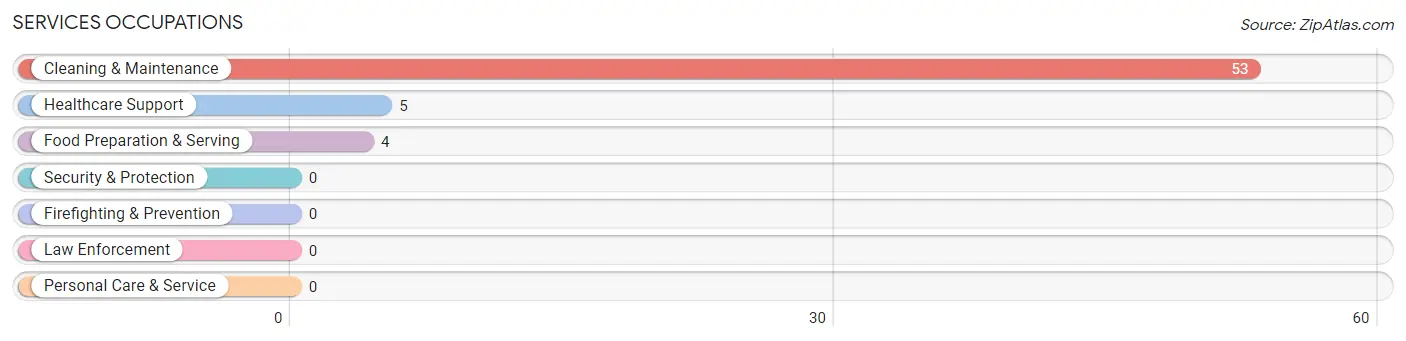
Services Occupations
The most common Services occupations in Walland are Cleaning & Maintenance (53 | 29.6%), Healthcare Support (5 | 2.8%), and Food Preparation & Serving (4 | 2.2%).
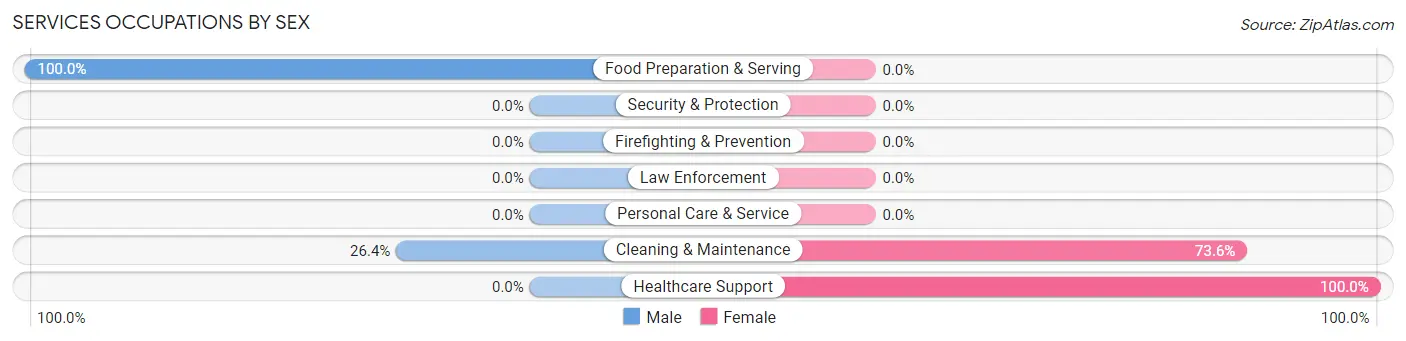
Services Occupations by Sex
Within the Services occupations in Walland, the most male-oriented occupations are Food Preparation & Serving (100.0%), and Cleaning & Maintenance (26.4%), while the most female-oriented occupations are Healthcare Support (100.0%), and Cleaning & Maintenance (73.6%).
| Occupation | Male | Female |
| Healthcare Support | 0 (0.0%) | 5 (100.0%) |
| Security & Protection | 0 (0.0%) | 0 (0.0%) |
| Firefighting & Prevention | 0 (0.0%) | 0 (0.0%) |
| Law Enforcement | 0 (0.0%) | 0 (0.0%) |
| Food Preparation & Serving | 4 (100.0%) | 0 (0.0%) |
| Cleaning & Maintenance | 14 (26.4%) | 39 (73.6%) |
| Personal Care & Service | 0 (0.0%) | 0 (0.0%) |
| Total (Category) | 18 (29.0%) | 44 (71.0%) |
| Total (Overall) | 91 (50.8%) | 88 (49.2%) |
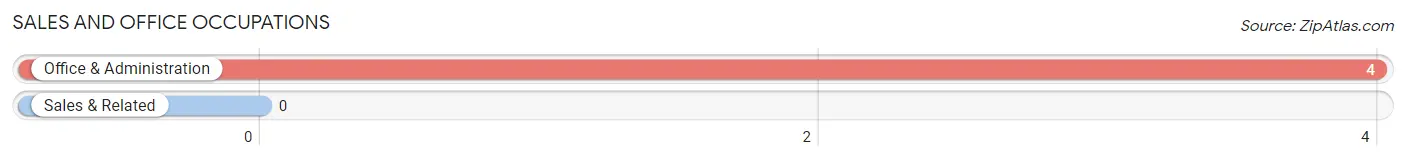
Sales and Office Occupations
The most common Sales and Office occupations in Walland are , and Office & Administration (4 | 2.2%).
Sales and Office Occupations by Sex

| Occupation | Male | Female |
| Sales & Related | 0 (0.0%) | 0 (0.0%) |
| Office & Administration | 4 (100.0%) | 0 (0.0%) |
| Total (Category) | 4 (100.0%) | 0 (0.0%) |
| Total (Overall) | 91 (50.8%) | 88 (49.2%) |
Natural Resources, Construction and Maintenance Occupations
The most common Natural Resources, Construction and Maintenance occupations in Walland are , and Construction & Extraction (18 | 10.1%).
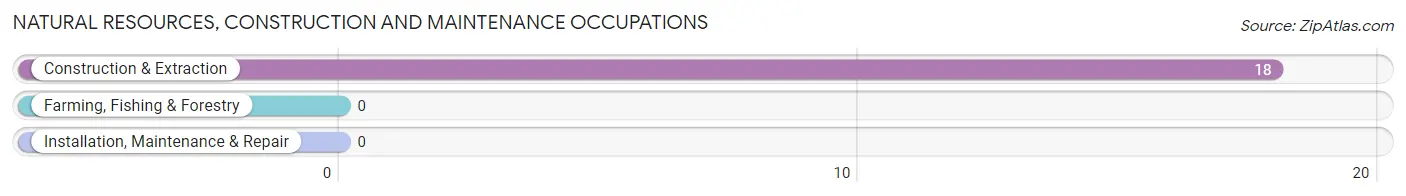
Natural Resources, Construction and Maintenance Occupations by Sex
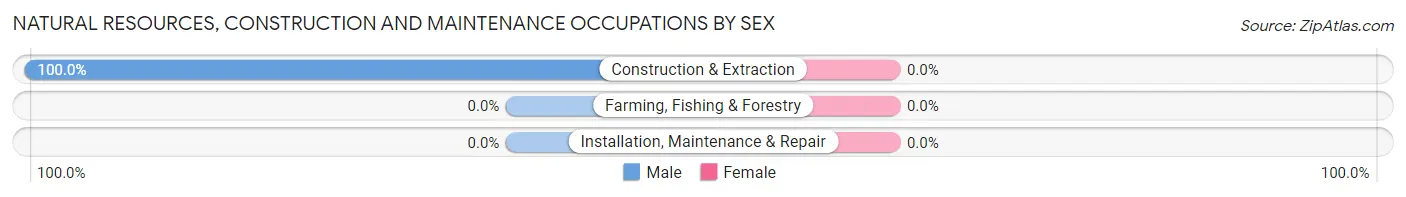
| Occupation | Male | Female |
| Farming, Fishing & Forestry | 0 (0.0%) | 0 (0.0%) |
| Construction & Extraction | 18 (100.0%) | 0 (0.0%) |
| Installation, Maintenance & Repair | 0 (0.0%) | 0 (0.0%) |
| Total (Category) | 18 (100.0%) | 0 (0.0%) |
| Total (Overall) | 91 (50.8%) | 88 (49.2%) |
Production, Transportation and Moving Occupations
The most common Production, Transportation and Moving occupations in Walland are , and Transportation (15 | 8.4%).
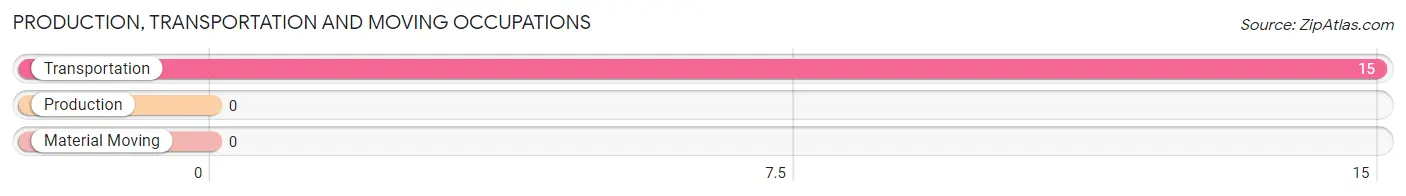
Production, Transportation and Moving Occupations by Sex
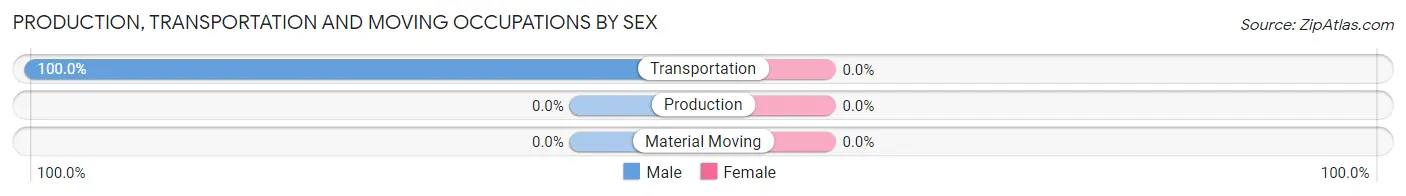
| Occupation | Male | Female |
| Production | 0 (0.0%) | 0 (0.0%) |
| Transportation | 15 (100.0%) | 0 (0.0%) |
| Material Moving | 0 (0.0%) | 0 (0.0%) |
| Total (Category) | 15 (100.0%) | 0 (0.0%) |
| Total (Overall) | 91 (50.8%) | 88 (49.2%) |
Employment Industries by Sex in Walland
Employment Industries in Walland
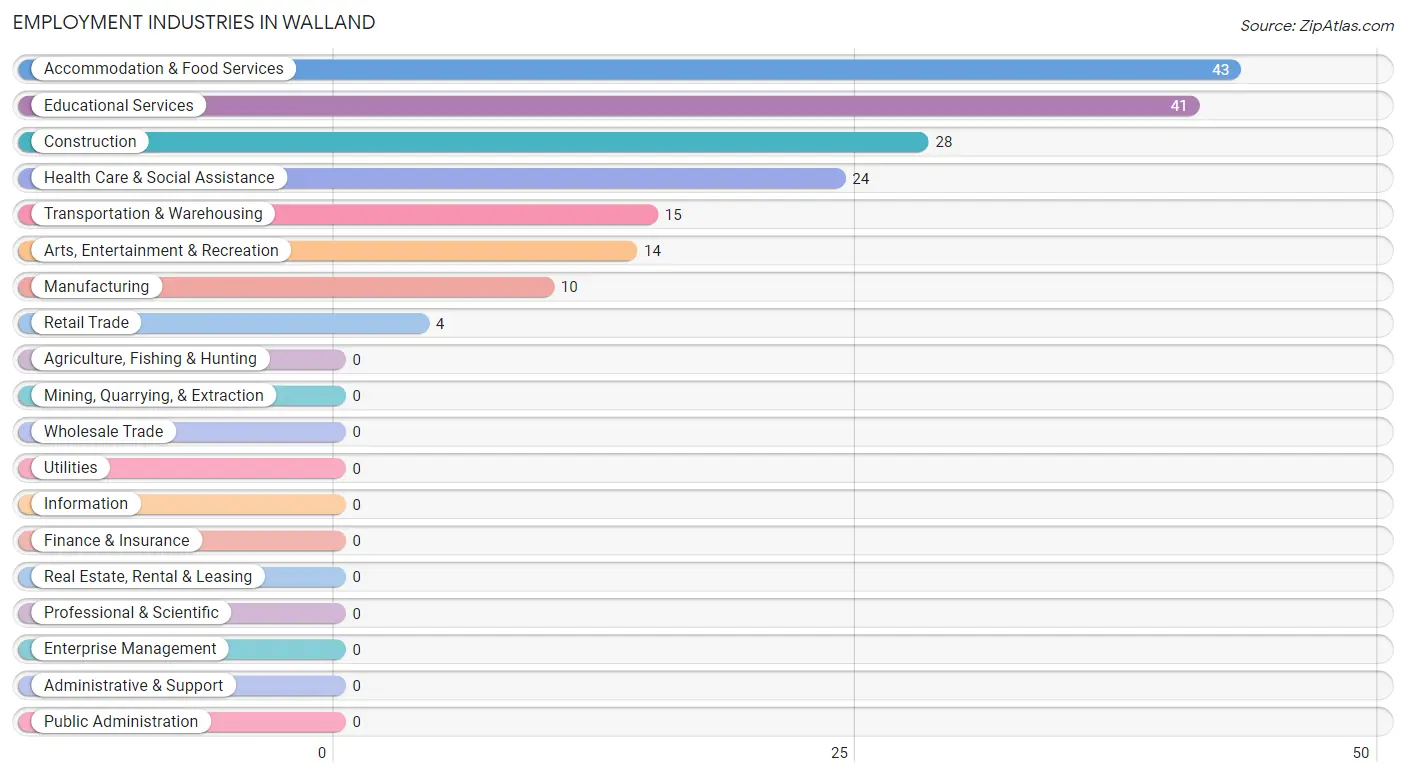
The major employment industries in Walland include Accommodation & Food Services (43 | 24.0%), Educational Services (41 | 22.9%), Construction (28 | 15.6%), Health Care & Social Assistance (24 | 13.4%), and Transportation & Warehousing (15 | 8.4%).
Employment Industries by Sex in Walland
The Walland industries that see more men than women are Manufacturing (100.0%), Retail Trade (100.0%), and Transportation & Warehousing (100.0%), whereas the industries that tend to have a higher number of women are Accommodation & Food Services (90.7%), Health Care & Social Assistance (79.2%), and Educational Services (48.8%).
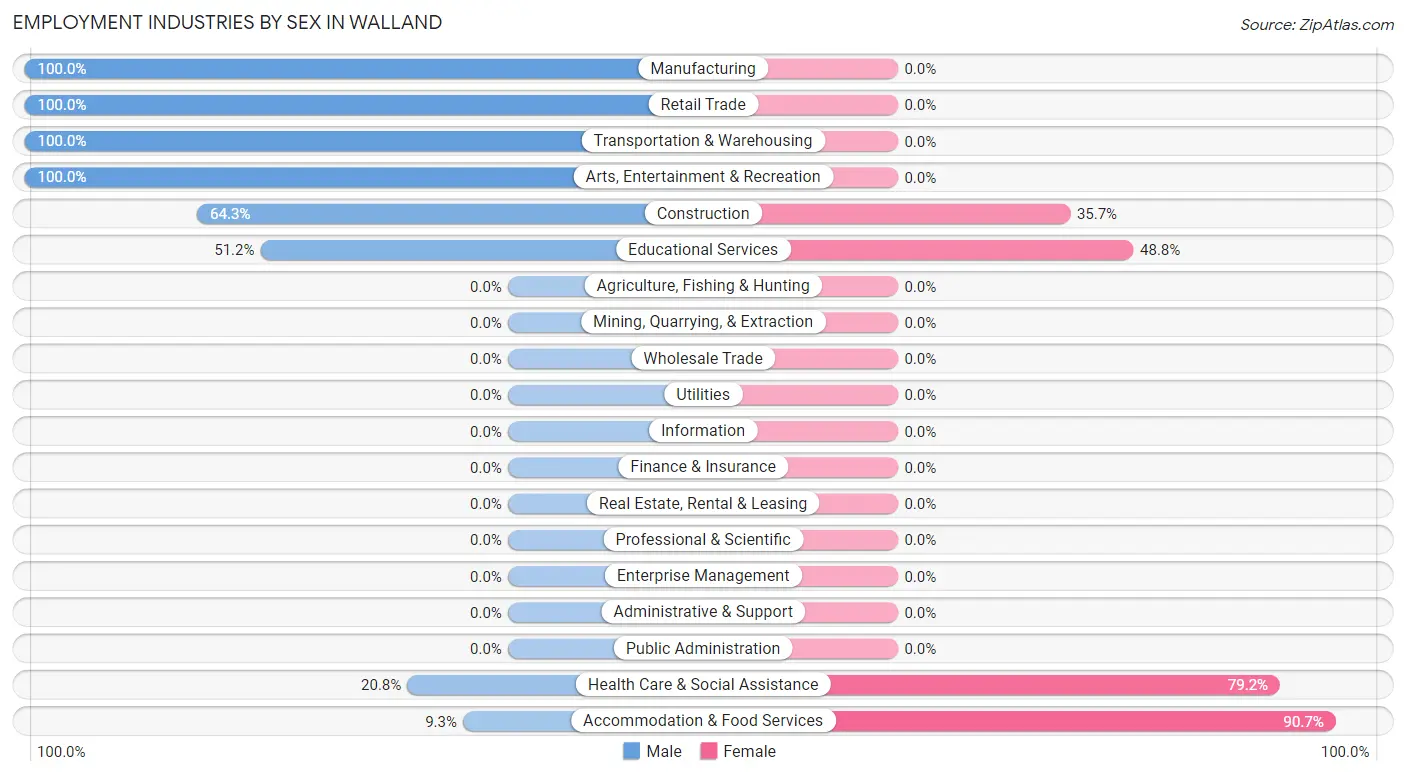
| Industry | Male | Female |
| Agriculture, Fishing & Hunting | 0 (0.0%) | 0 (0.0%) |
| Mining, Quarrying, & Extraction | 0 (0.0%) | 0 (0.0%) |
| Construction | 18 (64.3%) | 10 (35.7%) |
| Manufacturing | 10 (100.0%) | 0 (0.0%) |
| Wholesale Trade | 0 (0.0%) | 0 (0.0%) |
| Retail Trade | 4 (100.0%) | 0 (0.0%) |
| Transportation & Warehousing | 15 (100.0%) | 0 (0.0%) |
| Utilities | 0 (0.0%) | 0 (0.0%) |
| Information | 0 (0.0%) | 0 (0.0%) |
| Finance & Insurance | 0 (0.0%) | 0 (0.0%) |
| Real Estate, Rental & Leasing | 0 (0.0%) | 0 (0.0%) |
| Professional & Scientific | 0 (0.0%) | 0 (0.0%) |
| Enterprise Management | 0 (0.0%) | 0 (0.0%) |
| Administrative & Support | 0 (0.0%) | 0 (0.0%) |
| Educational Services | 21 (51.2%) | 20 (48.8%) |
| Health Care & Social Assistance | 5 (20.8%) | 19 (79.2%) |
| Arts, Entertainment & Recreation | 14 (100.0%) | 0 (0.0%) |
| Accommodation & Food Services | 4 (9.3%) | 39 (90.7%) |
| Public Administration | 0 (0.0%) | 0 (0.0%) |
| Total | 91 (50.8%) | 88 (49.2%) |
Education in Walland
School Enrollment in Walland
The most common levels of schooling among the 124 students in Walland are middle school (74 | 59.7%), kindergarten (18 | 14.5%), and elementary school (10 | 8.1%).
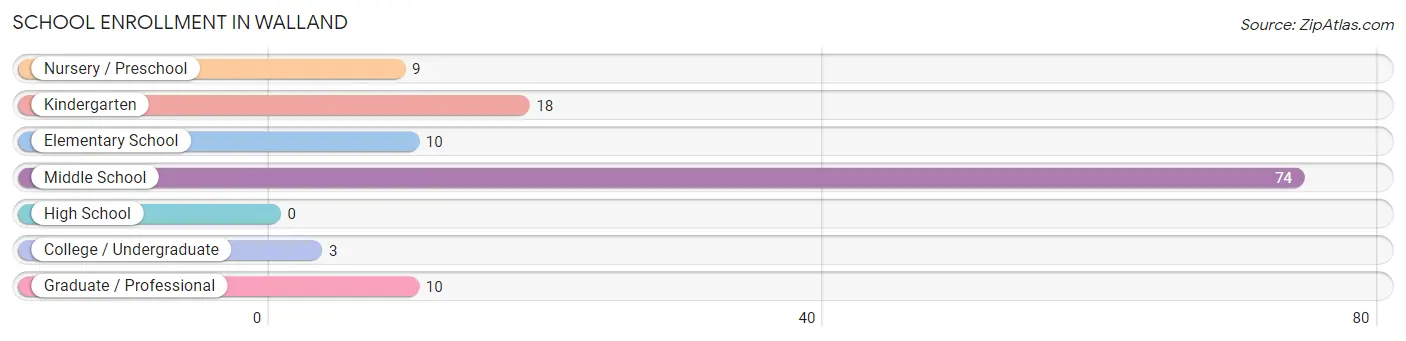
| School Level | # Students | % Students |
| Nursery / Preschool | 9 | 7.3% |
| Kindergarten | 18 | 14.5% |
| Elementary School | 10 | 8.1% |
| Middle School | 74 | 59.7% |
| High School | 0 | 0.0% |
| College / Undergraduate | 3 | 2.4% |
| Graduate / Professional | 10 | 8.1% |
| Total | 124 | 100.0% |
School Enrollment by Age by Funding Source in Walland
Out of a total of 124 students who are enrolled in schools in Walland, 9 (7.3%) attend a private institution, while the remaining 115 (92.7%) are enrolled in public schools. The age group of 3 to 4 year olds has the highest likelihood of being enrolled in private schools, with 9 (100.0% in the age bracket) enrolled. Conversely, the age group of 5 to 9 year old has the lowest likelihood of being enrolled in a private school, with 28 (100.0% in the age bracket) attending a public institution.
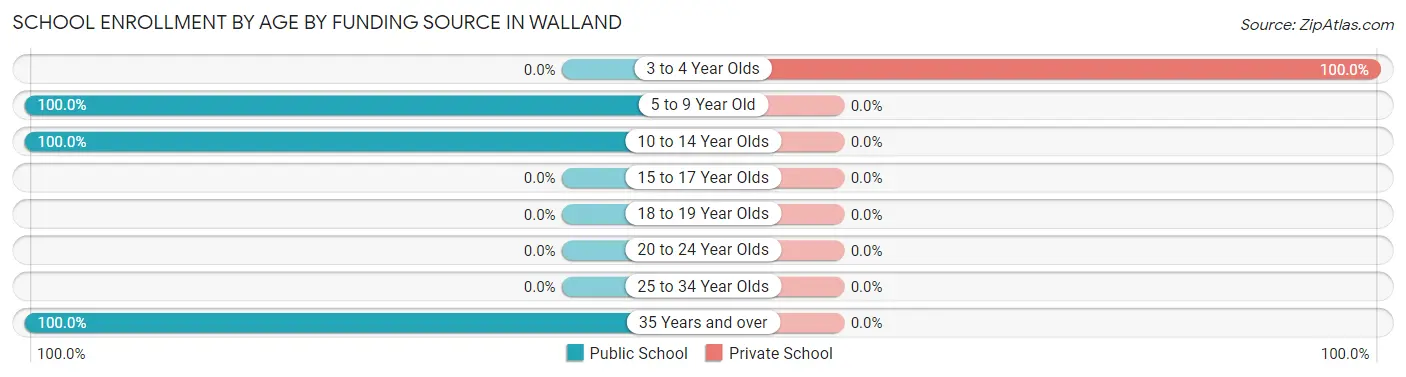
| Age Bracket | Public School | Private School |
| 3 to 4 Year Olds | 0 (0.0%) | 9 (100.0%) |
| 5 to 9 Year Old | 28 (100.0%) | 0 (0.0%) |
| 10 to 14 Year Olds | 74 (100.0%) | 0 (0.0%) |
| 15 to 17 Year Olds | 0 (0.0%) | 0 (0.0%) |
| 18 to 19 Year Olds | 0 (0.0%) | 0 (0.0%) |
| 20 to 24 Year Olds | 0 (0.0%) | 0 (0.0%) |
| 25 to 34 Year Olds | 0 (0.0%) | 0 (0.0%) |
| 35 Years and over | 13 (100.0%) | 0 (0.0%) |
| Total | 115 (92.7%) | 9 (7.3%) |
Educational Attainment by Field of Study in Walland
Business (22 | 22.9%), bio, nature & agricultural (13 | 13.5%), communications (11 | 11.5%), computers & mathematics (10 | 10.4%), and physical & health sciences (10 | 10.4%) are the most common fields of study among 96 individuals in Walland who have obtained a bachelor's degree or higher.
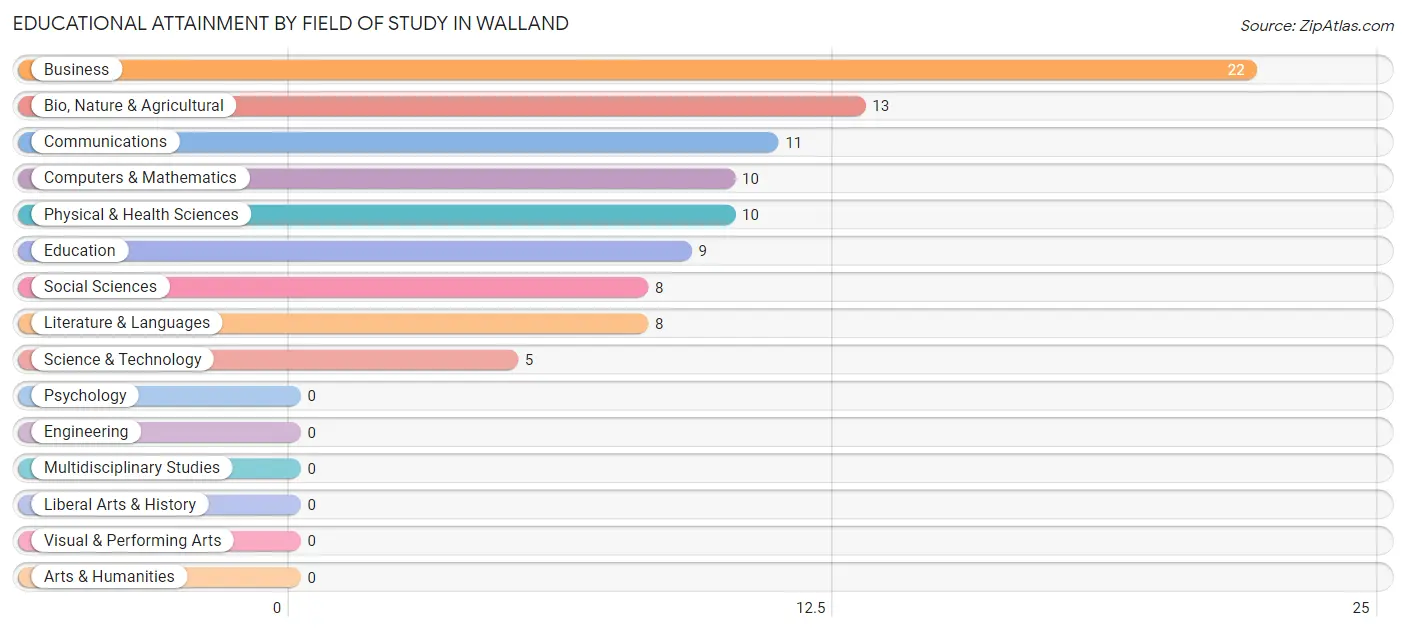
| Field of Study | # Graduates | % Graduates |
| Computers & Mathematics | 10 | 10.4% |
| Bio, Nature & Agricultural | 13 | 13.5% |
| Physical & Health Sciences | 10 | 10.4% |
| Psychology | 0 | 0.0% |
| Social Sciences | 8 | 8.3% |
| Engineering | 0 | 0.0% |
| Multidisciplinary Studies | 0 | 0.0% |
| Science & Technology | 5 | 5.2% |
| Business | 22 | 22.9% |
| Education | 9 | 9.4% |
| Literature & Languages | 8 | 8.3% |
| Liberal Arts & History | 0 | 0.0% |
| Visual & Performing Arts | 0 | 0.0% |
| Communications | 11 | 11.5% |
| Arts & Humanities | 0 | 0.0% |
| Total | 96 | 100.0% |
Transportation & Commute in Walland
Vehicle Availability by Sex in Walland
The most prevalent vehicle ownership categories in Walland are males with 2 vehicles (39, accounting for 42.9%) and females with 2 vehicles (32, making up 47.0%).
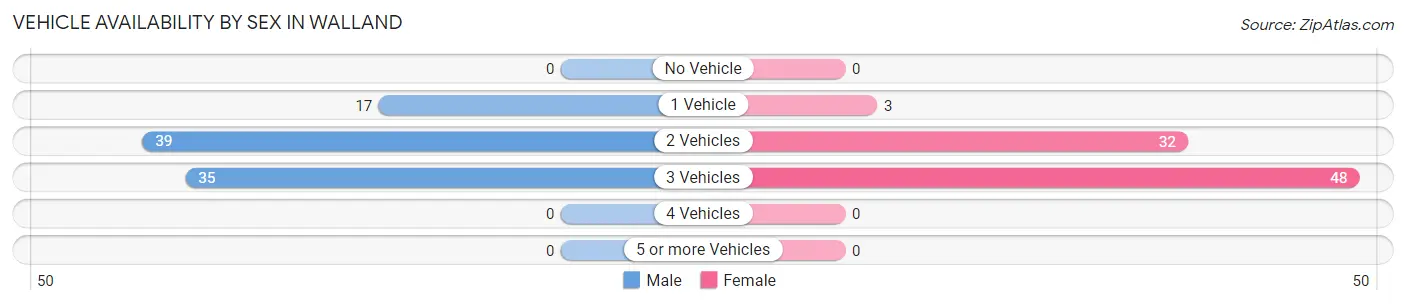
| Vehicles Available | Male | Female |
| No Vehicle | 0 (0.0%) | 0 (0.0%) |
| 1 Vehicle | 17 (18.7%) | 3 (3.6%) |
| 2 Vehicles | 39 (42.9%) | 32 (38.6%) |
| 3 Vehicles | 35 (38.5%) | 48 (57.8%) |
| 4 Vehicles | 0 (0.0%) | 0 (0.0%) |
| 5 or more Vehicles | 0 (0.0%) | 0 (0.0%) |
| Total | 91 (100.0%) | 83 (100.0%) |
Commute Time in Walland
The most frequently occuring commute durations in Walland are 10 to 14 minutes (39 commuters, 22.4%), 30 to 34 minutes (31 commuters, 17.8%), and 45 to 59 minutes (25 commuters, 14.4%).
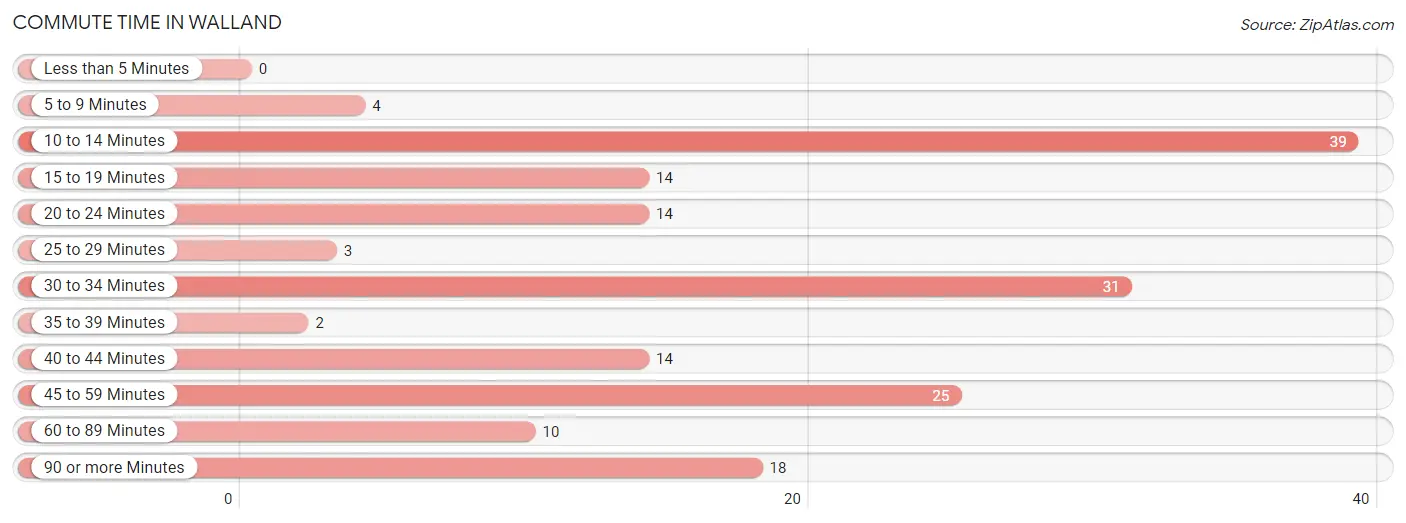
| Commute Time | # Commuters | % Commuters |
| Less than 5 Minutes | 0 | 0.0% |
| 5 to 9 Minutes | 4 | 2.3% |
| 10 to 14 Minutes | 39 | 22.4% |
| 15 to 19 Minutes | 14 | 8.1% |
| 20 to 24 Minutes | 14 | 8.1% |
| 25 to 29 Minutes | 3 | 1.7% |
| 30 to 34 Minutes | 31 | 17.8% |
| 35 to 39 Minutes | 2 | 1.1% |
| 40 to 44 Minutes | 14 | 8.1% |
| 45 to 59 Minutes | 25 | 14.4% |
| 60 to 89 Minutes | 10 | 5.8% |
| 90 or more Minutes | 18 | 10.3% |
Commute Time by Sex in Walland
The most common commute times in Walland are 30 to 34 minutes (31 commuters, 34.1%) for males and 10 to 14 minutes (39 commuters, 47.0%) for females.
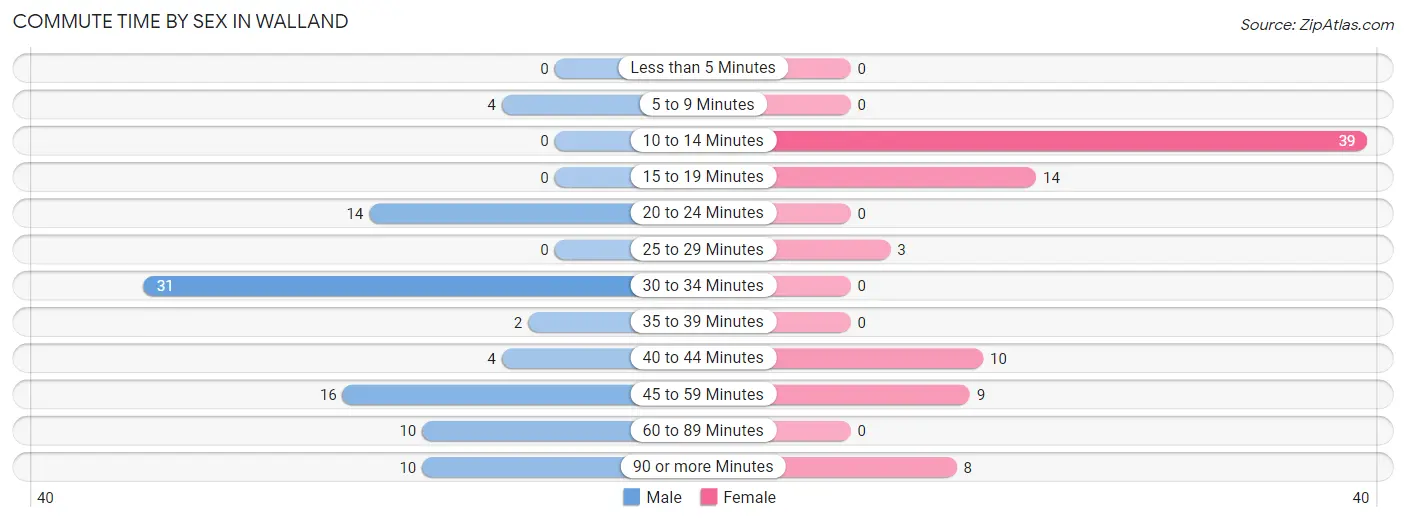
| Commute Time | Male | Female |
| Less than 5 Minutes | 0 (0.0%) | 0 (0.0%) |
| 5 to 9 Minutes | 4 (4.4%) | 0 (0.0%) |
| 10 to 14 Minutes | 0 (0.0%) | 39 (47.0%) |
| 15 to 19 Minutes | 0 (0.0%) | 14 (16.9%) |
| 20 to 24 Minutes | 14 (15.4%) | 0 (0.0%) |
| 25 to 29 Minutes | 0 (0.0%) | 3 (3.6%) |
| 30 to 34 Minutes | 31 (34.1%) | 0 (0.0%) |
| 35 to 39 Minutes | 2 (2.2%) | 0 (0.0%) |
| 40 to 44 Minutes | 4 (4.4%) | 10 (12.0%) |
| 45 to 59 Minutes | 16 (17.6%) | 9 (10.8%) |
| 60 to 89 Minutes | 10 (11.0%) | 0 (0.0%) |
| 90 or more Minutes | 10 (11.0%) | 8 (9.6%) |
Time of Departure to Work by Sex in Walland
The most frequent times of departure to work in Walland are 5:30 AM to 5:59 AM (34, 37.4%) for males and 7:00 AM to 7:29 AM (63, 75.9%) for females.
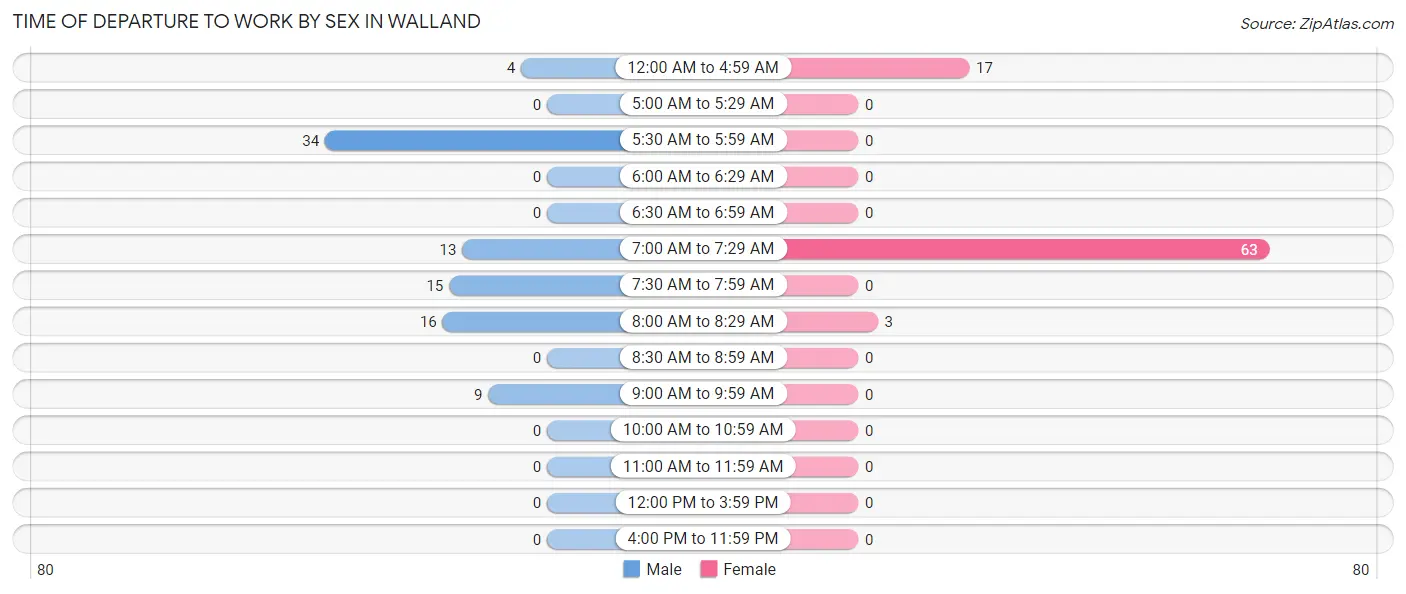
| Time of Departure | Male | Female |
| 12:00 AM to 4:59 AM | 4 (4.4%) | 17 (20.5%) |
| 5:00 AM to 5:29 AM | 0 (0.0%) | 0 (0.0%) |
| 5:30 AM to 5:59 AM | 34 (37.4%) | 0 (0.0%) |
| 6:00 AM to 6:29 AM | 0 (0.0%) | 0 (0.0%) |
| 6:30 AM to 6:59 AM | 0 (0.0%) | 0 (0.0%) |
| 7:00 AM to 7:29 AM | 13 (14.3%) | 63 (75.9%) |
| 7:30 AM to 7:59 AM | 15 (16.5%) | 0 (0.0%) |
| 8:00 AM to 8:29 AM | 16 (17.6%) | 3 (3.6%) |
| 8:30 AM to 8:59 AM | 0 (0.0%) | 0 (0.0%) |
| 9:00 AM to 9:59 AM | 9 (9.9%) | 0 (0.0%) |
| 10:00 AM to 10:59 AM | 0 (0.0%) | 0 (0.0%) |
| 11:00 AM to 11:59 AM | 0 (0.0%) | 0 (0.0%) |
| 12:00 PM to 3:59 PM | 0 (0.0%) | 0 (0.0%) |
| 4:00 PM to 11:59 PM | 0 (0.0%) | 0 (0.0%) |
| Total | 91 (100.0%) | 83 (100.0%) |
Housing Occupancy in Walland
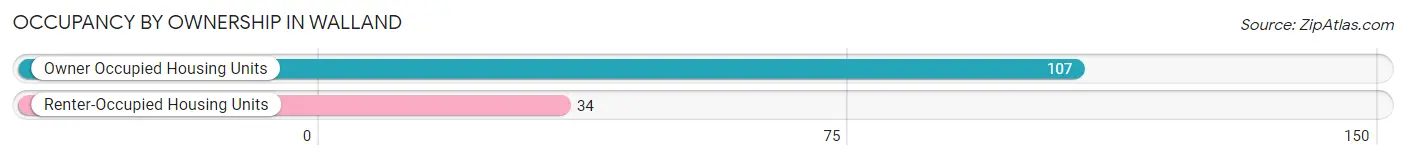
Occupancy by Ownership in Walland
Of the total 141 dwellings in Walland, owner-occupied units account for 107 (75.9%), while renter-occupied units make up 34 (24.1%).
| Occupancy | # Housing Units | % Housing Units |
| Owner Occupied Housing Units | 107 | 75.9% |
| Renter-Occupied Housing Units | 34 | 24.1% |
| Total Occupied Housing Units | 141 | 100.0% |
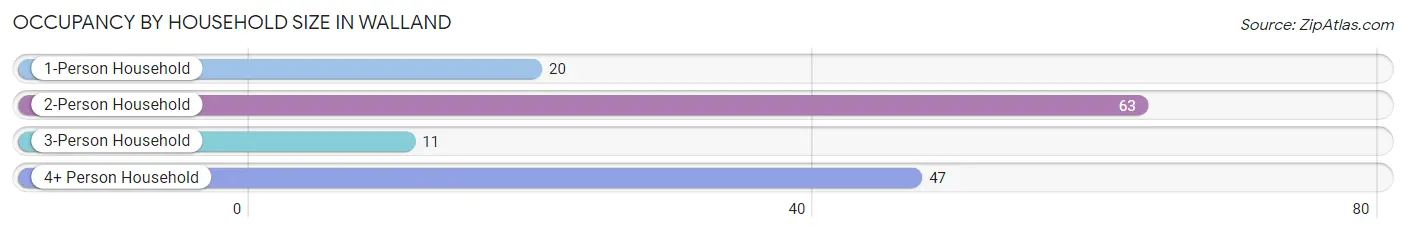
Occupancy by Household Size in Walland
| Household Size | # Housing Units | % Housing Units |
| 1-Person Household | 20 | 14.2% |
| 2-Person Household | 63 | 44.7% |
| 3-Person Household | 11 | 7.8% |
| 4+ Person Household | 47 | 33.3% |
| Total Housing Units | 141 | 100.0% |
Occupancy by Ownership by Household Size in Walland
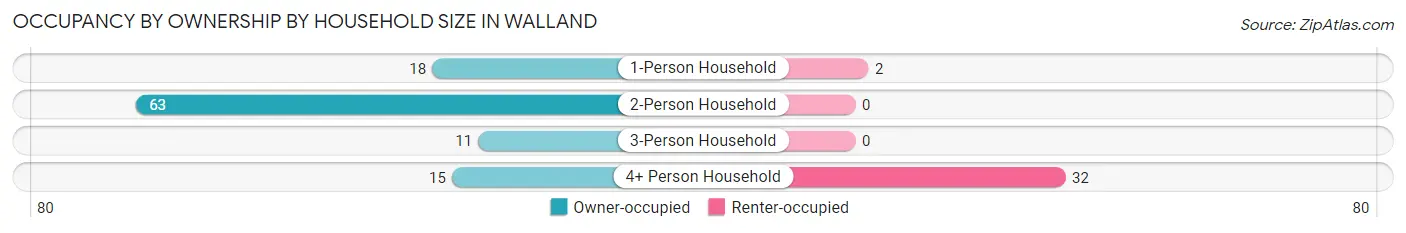
| Household Size | Owner-occupied | Renter-occupied |
| 1-Person Household | 18 (90.0%) | 2 (10.0%) |
| 2-Person Household | 63 (100.0%) | 0 (0.0%) |
| 3-Person Household | 11 (100.0%) | 0 (0.0%) |
| 4+ Person Household | 15 (31.9%) | 32 (68.1%) |
| Total Housing Units | 107 (75.9%) | 34 (24.1%) |
Occupancy by Educational Attainment in Walland
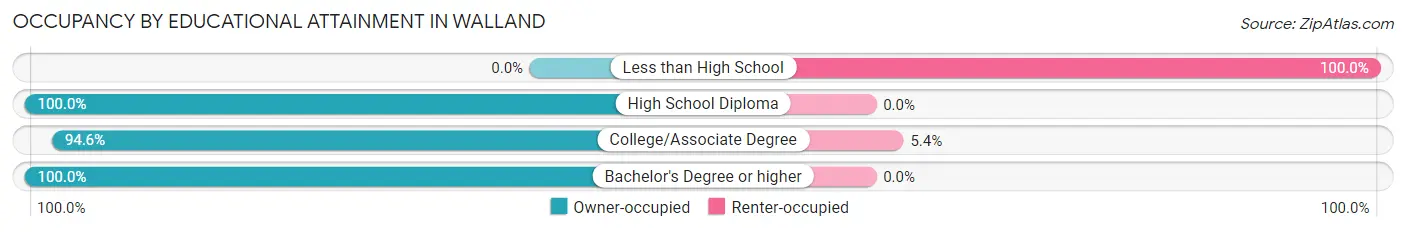
| Household Size | Owner-occupied | Renter-occupied |
| Less than High School | 0 (0.0%) | 32 (100.0%) |
| High School Diploma | 27 (100.0%) | 0 (0.0%) |
| College/Associate Degree | 35 (94.6%) | 2 (5.4%) |
| Bachelor's Degree or higher | 45 (100.0%) | 0 (0.0%) |
Occupancy by Age of Householder in Walland
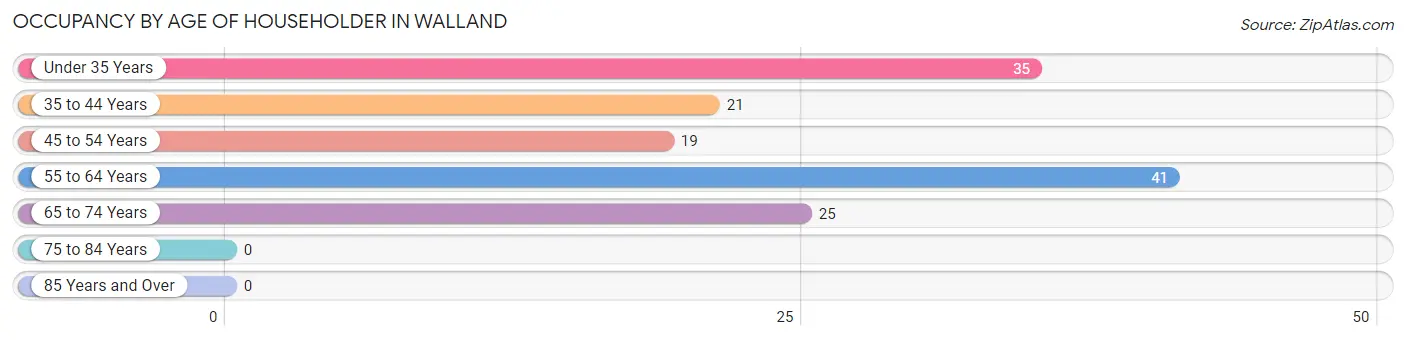
| Age Bracket | # Households | % Households |
| Under 35 Years | 35 | 24.8% |
| 35 to 44 Years | 21 | 14.9% |
| 45 to 54 Years | 19 | 13.5% |
| 55 to 64 Years | 41 | 29.1% |
| 65 to 74 Years | 25 | 17.7% |
| 75 to 84 Years | 0 | 0.0% |
| 85 Years and Over | 0 | 0.0% |
| Total | 141 | 100.0% |
Housing Finances in Walland
Median Income by Occupancy in Walland
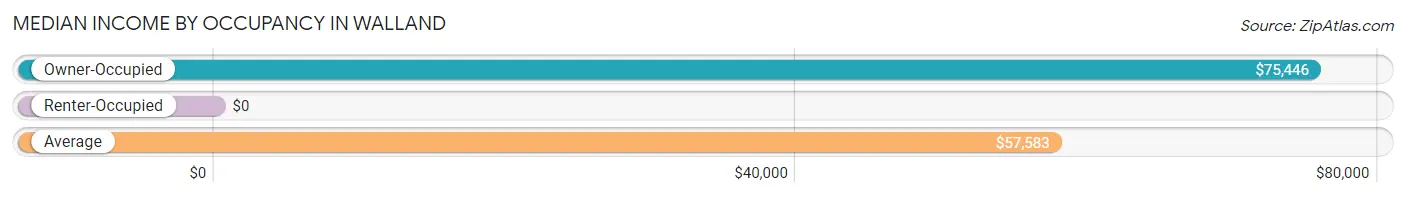
| Occupancy Type | # Households | Median Income |
| Owner-Occupied | 107 (75.9%) | $75,446 |
| Renter-Occupied | 34 (24.1%) | $0 |
| Average | 141 (100.0%) | $57,583 |
Occupancy by Householder Income Bracket in Walland
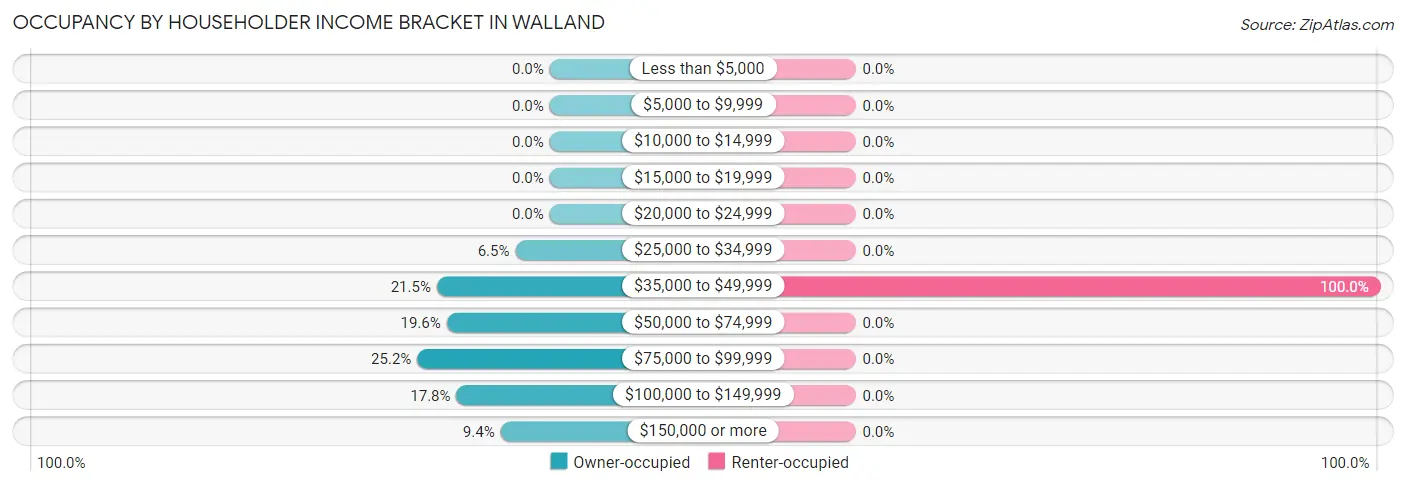
| Income Bracket | Owner-occupied | Renter-occupied |
| Less than $5,000 | 0 (0.0%) | 0 (0.0%) |
| $5,000 to $9,999 | 0 (0.0%) | 0 (0.0%) |
| $10,000 to $14,999 | 0 (0.0%) | 0 (0.0%) |
| $15,000 to $19,999 | 0 (0.0%) | 0 (0.0%) |
| $20,000 to $24,999 | 0 (0.0%) | 0 (0.0%) |
| $25,000 to $34,999 | 7 (6.5%) | 0 (0.0%) |
| $35,000 to $49,999 | 23 (21.5%) | 34 (100.0%) |
| $50,000 to $74,999 | 21 (19.6%) | 0 (0.0%) |
| $75,000 to $99,999 | 27 (25.2%) | 0 (0.0%) |
| $100,000 to $149,999 | 19 (17.8%) | 0 (0.0%) |
| $150,000 or more | 10 (9.3%) | 0 (0.0%) |
| Total | 107 (100.0%) | 34 (100.0%) |
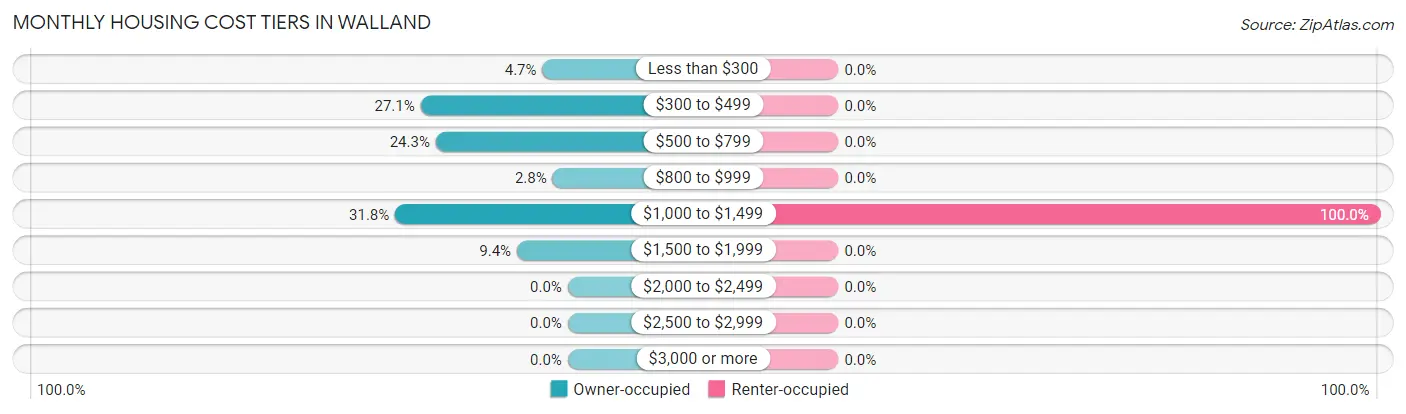
Monthly Housing Cost Tiers in Walland
| Monthly Cost | Owner-occupied | Renter-occupied |
| Less than $300 | 5 (4.7%) | 0 (0.0%) |
| $300 to $499 | 29 (27.1%) | 0 (0.0%) |
| $500 to $799 | 26 (24.3%) | 0 (0.0%) |
| $800 to $999 | 3 (2.8%) | 0 (0.0%) |
| $1,000 to $1,499 | 34 (31.8%) | 34 (100.0%) |
| $1,500 to $1,999 | 10 (9.3%) | 0 (0.0%) |
| $2,000 to $2,499 | 0 (0.0%) | 0 (0.0%) |
| $2,500 to $2,999 | 0 (0.0%) | 0 (0.0%) |
| $3,000 or more | 0 (0.0%) | 0 (0.0%) |
| Total | 107 (100.0%) | 34 (100.0%) |
Physical Housing Characteristics in Walland
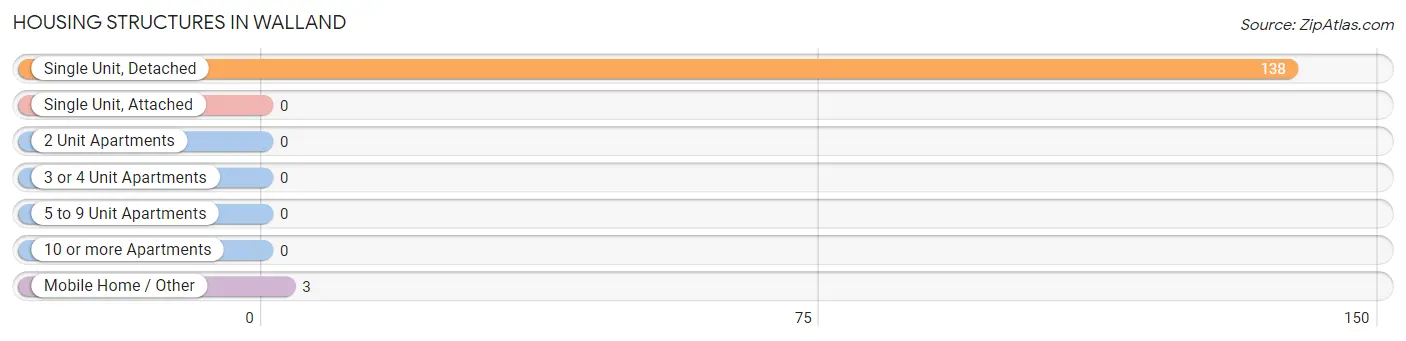
Housing Structures in Walland
| Structure Type | # Housing Units | % Housing Units |
| Single Unit, Detached | 138 | 97.9% |
| Single Unit, Attached | 0 | 0.0% |
| 2 Unit Apartments | 0 | 0.0% |
| 3 or 4 Unit Apartments | 0 | 0.0% |
| 5 to 9 Unit Apartments | 0 | 0.0% |
| 10 or more Apartments | 0 | 0.0% |
| Mobile Home / Other | 3 | 2.1% |
| Total | 141 | 100.0% |
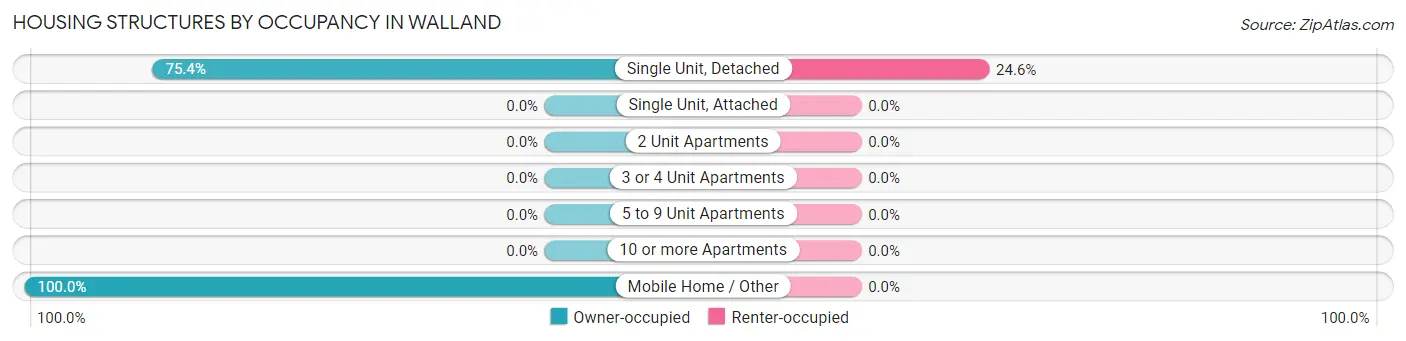
Housing Structures by Occupancy in Walland
| Structure Type | Owner-occupied | Renter-occupied |
| Single Unit, Detached | 104 (75.4%) | 34 (24.6%) |
| Single Unit, Attached | 0 (0.0%) | 0 (0.0%) |
| 2 Unit Apartments | 0 (0.0%) | 0 (0.0%) |
| 3 or 4 Unit Apartments | 0 (0.0%) | 0 (0.0%) |
| 5 to 9 Unit Apartments | 0 (0.0%) | 0 (0.0%) |
| 10 or more Apartments | 0 (0.0%) | 0 (0.0%) |
| Mobile Home / Other | 3 (100.0%) | 0 (0.0%) |
| Total | 107 (75.9%) | 34 (24.1%) |
Housing Structures by Number of Rooms in Walland
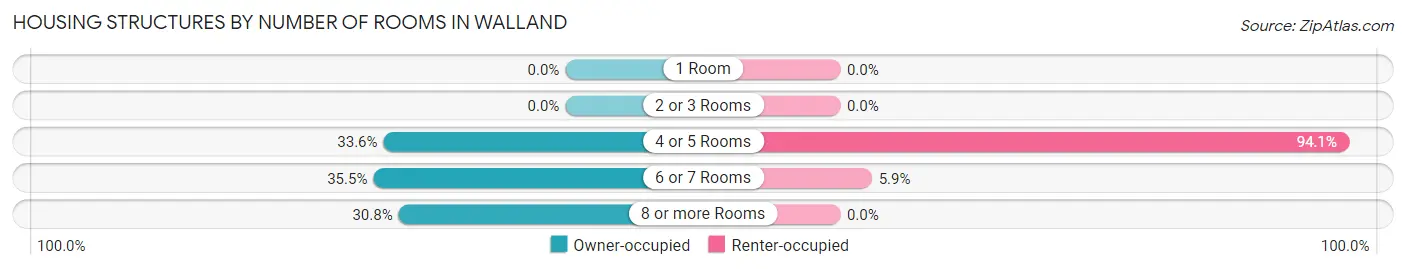
| Number of Rooms | Owner-occupied | Renter-occupied |
| 1 Room | 0 (0.0%) | 0 (0.0%) |
| 2 or 3 Rooms | 0 (0.0%) | 0 (0.0%) |
| 4 or 5 Rooms | 36 (33.6%) | 32 (94.1%) |
| 6 or 7 Rooms | 38 (35.5%) | 2 (5.9%) |
| 8 or more Rooms | 33 (30.8%) | 0 (0.0%) |
| Total | 107 (100.0%) | 34 (100.0%) |
Housing Structure by Heating Type in Walland
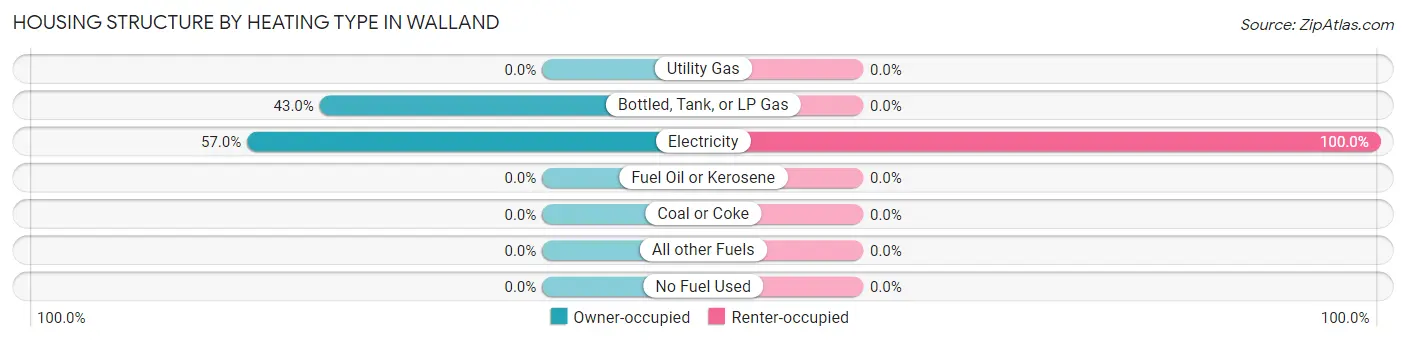
| Heating Type | Owner-occupied | Renter-occupied |
| Utility Gas | 0 (0.0%) | 0 (0.0%) |
| Bottled, Tank, or LP Gas | 46 (43.0%) | 0 (0.0%) |
| Electricity | 61 (57.0%) | 34 (100.0%) |
| Fuel Oil or Kerosene | 0 (0.0%) | 0 (0.0%) |
| Coal or Coke | 0 (0.0%) | 0 (0.0%) |
| All other Fuels | 0 (0.0%) | 0 (0.0%) |
| No Fuel Used | 0 (0.0%) | 0 (0.0%) |
| Total | 107 (100.0%) | 34 (100.0%) |
Household Vehicle Usage in Walland

| Vehicles per Household | Owner-occupied | Renter-occupied |
| No Vehicle | 6 (5.6%) | 0 (0.0%) |
| 1 Vehicle | 18 (16.8%) | 2 (5.9%) |
| 2 Vehicles | 56 (52.3%) | 0 (0.0%) |
| 3 or more Vehicles | 27 (25.2%) | 32 (94.1%) |
| Total | 107 (100.0%) | 34 (100.0%) |
Real Estate & Mortgages in Walland
Real Estate and Mortgage Overview in Walland
| Characteristic | Without Mortgage | With Mortgage |
| Housing Units | 50 | 57 |
| Median Property Value | $217,900 | $265,500 |
| Median Household Income | $76,429 | $0 |
| Monthly Housing Costs | $418 | $0 |
| Real Estate Taxes | $1,125 | $11 |
Property Value by Mortgage Status in Walland
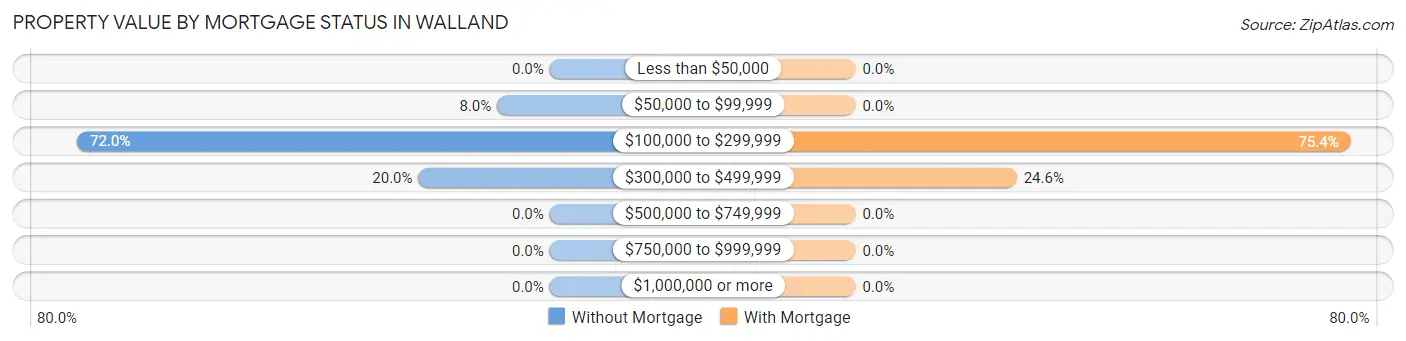
| Property Value | Without Mortgage | With Mortgage |
| Less than $50,000 | 0 (0.0%) | 0 (0.0%) |
| $50,000 to $99,999 | 4 (8.0%) | 0 (0.0%) |
| $100,000 to $299,999 | 36 (72.0%) | 43 (75.4%) |
| $300,000 to $499,999 | 10 (20.0%) | 14 (24.6%) |
| $500,000 to $749,999 | 0 (0.0%) | 0 (0.0%) |
| $750,000 to $999,999 | 0 (0.0%) | 0 (0.0%) |
| $1,000,000 or more | 0 (0.0%) | 0 (0.0%) |
| Total | 50 (100.0%) | 57 (100.0%) |
Household Income by Mortgage Status in Walland
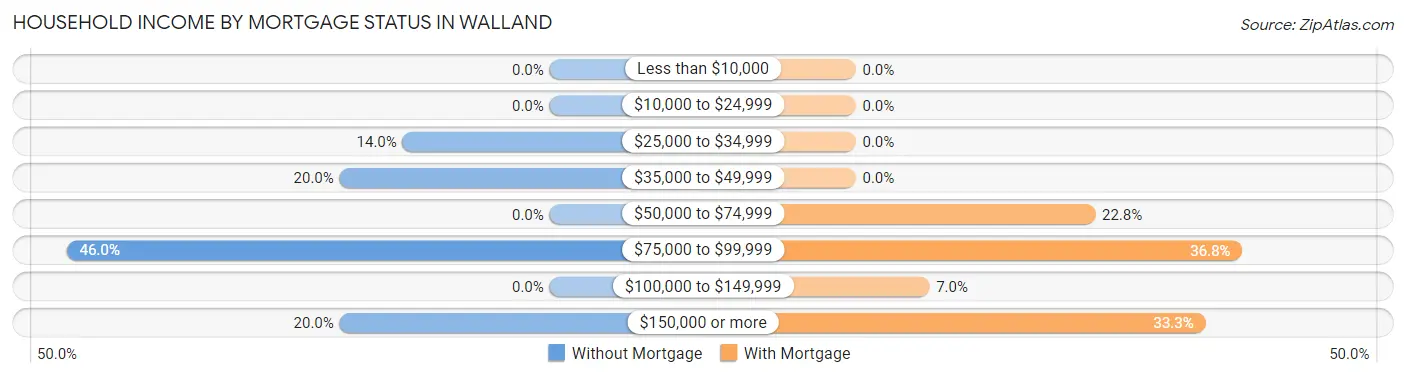
| Household Income | Without Mortgage | With Mortgage |
| Less than $10,000 | 0 (0.0%) | 0 (0.0%) |
| $10,000 to $24,999 | 0 (0.0%) | 0 (0.0%) |
| $25,000 to $34,999 | 7 (14.0%) | 0 (0.0%) |
| $35,000 to $49,999 | 10 (20.0%) | 0 (0.0%) |
| $50,000 to $74,999 | 0 (0.0%) | 13 (22.8%) |
| $75,000 to $99,999 | 23 (46.0%) | 21 (36.8%) |
| $100,000 to $149,999 | 0 (0.0%) | 4 (7.0%) |
| $150,000 or more | 10 (20.0%) | 19 (33.3%) |
| Total | 50 (100.0%) | 57 (100.0%) |
Property Value to Household Income Ratio in Walland
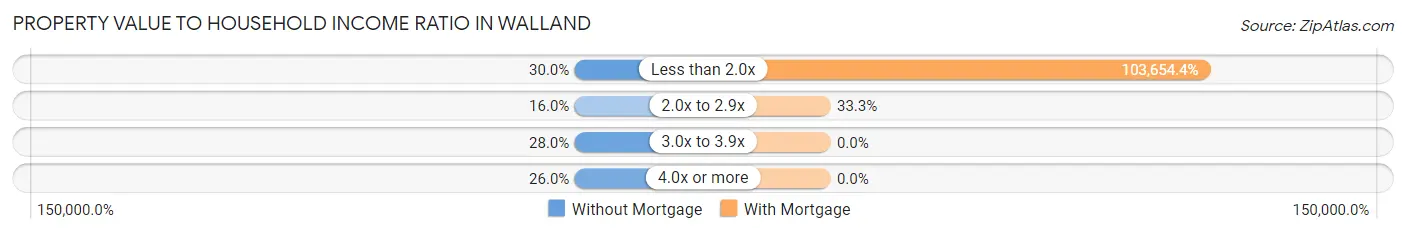
| Value-to-Income Ratio | Without Mortgage | With Mortgage |
| Less than 2.0x | 15 (30.0%) | 59,083 (103,654.4%) |
| 2.0x to 2.9x | 8 (16.0%) | 19 (33.3%) |
| 3.0x to 3.9x | 14 (28.0%) | 0 (0.0%) |
| 4.0x or more | 13 (26.0%) | 0 (0.0%) |
| Total | 50 (100.0%) | 57 (100.0%) |
Real Estate Taxes by Mortgage Status in Walland
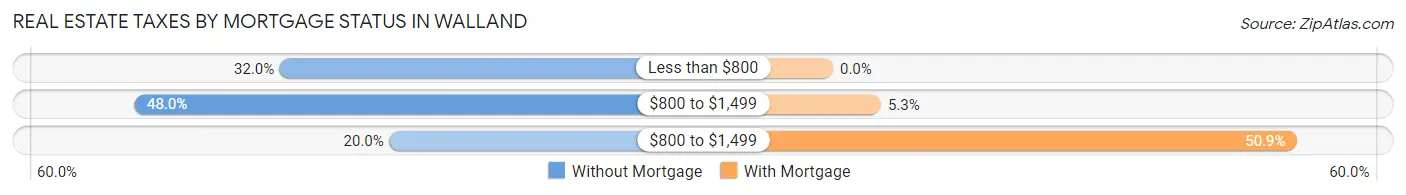
| Property Taxes | Without Mortgage | With Mortgage |
| Less than $800 | 16 (32.0%) | 0 (0.0%) |
| $800 to $1,499 | 24 (48.0%) | 3 (5.3%) |
| $800 to $1,499 | 10 (20.0%) | 29 (50.9%) |
| Total | 50 (100.0%) | 57 (100.0%) |
Health & Disability in Walland
Health Insurance Coverage by Age in Walland
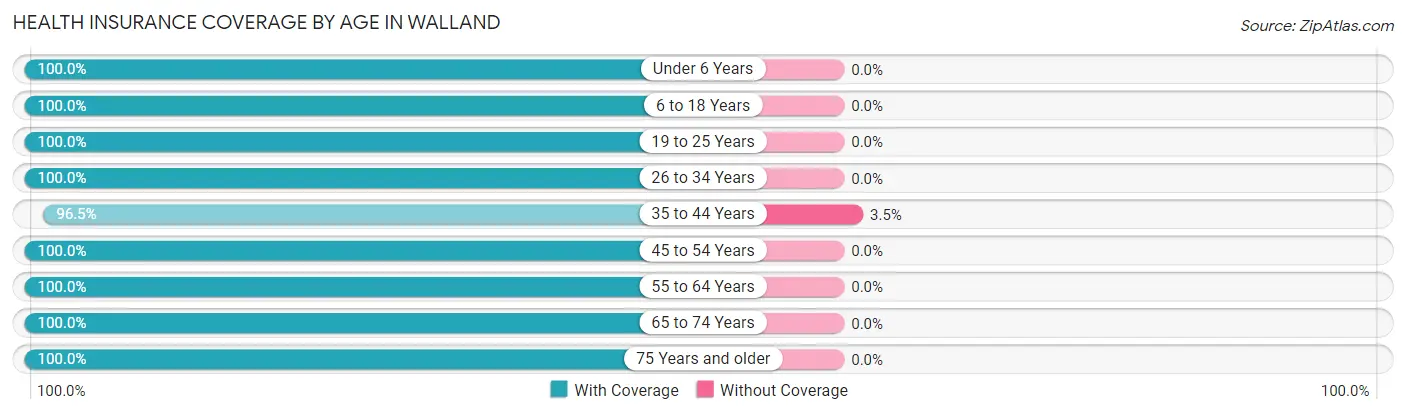
| Age Bracket | With Coverage | Without Coverage |
| Under 6 Years | 29 (100.0%) | 0 (0.0%) |
| 6 to 18 Years | 102 (100.0%) | 0 (0.0%) |
| 19 to 25 Years | 38 (100.0%) | 0 (0.0%) |
| 26 to 34 Years | 59 (100.0%) | 0 (0.0%) |
| 35 to 44 Years | 55 (96.5%) | 2 (3.5%) |
| 45 to 54 Years | 29 (100.0%) | 0 (0.0%) |
| 55 to 64 Years | 61 (100.0%) | 0 (0.0%) |
| 65 to 74 Years | 41 (100.0%) | 0 (0.0%) |
| 75 Years and older | 6 (100.0%) | 0 (0.0%) |
| Total | 420 (99.5%) | 2 (0.5%) |
Health Insurance Coverage by Citizenship Status in Walland
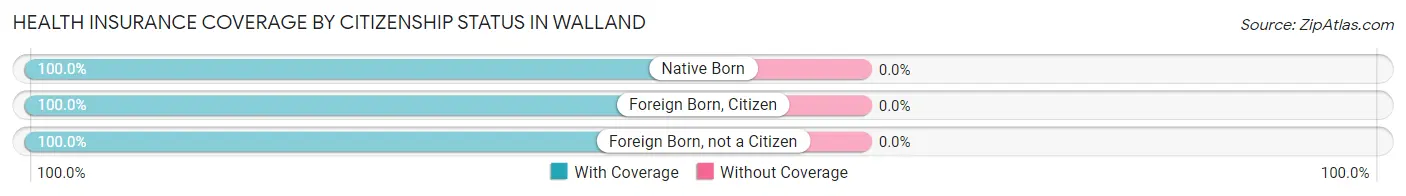
| Citizenship Status | With Coverage | Without Coverage |
| Native Born | 29 (100.0%) | 0 (0.0%) |
| Foreign Born, Citizen | 102 (100.0%) | 0 (0.0%) |
| Foreign Born, not a Citizen | 38 (100.0%) | 0 (0.0%) |
Health Insurance Coverage by Household Income in Walland
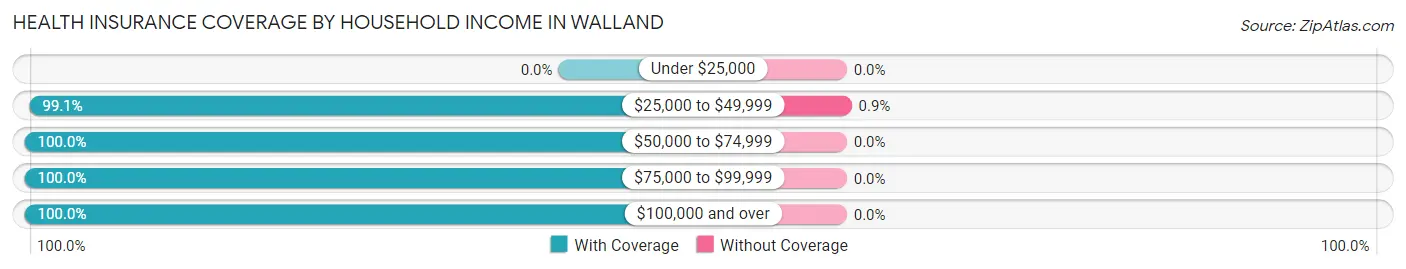
| Household Income | With Coverage | Without Coverage |
| Under $25,000 | 0 (0.0%) | 0 (0.0%) |
| $25,000 to $49,999 | 221 (99.1%) | 2 (0.9%) |
| $50,000 to $74,999 | 60 (100.0%) | 0 (0.0%) |
| $75,000 to $99,999 | 72 (100.0%) | 0 (0.0%) |
| $100,000 and over | 67 (100.0%) | 0 (0.0%) |
Public vs Private Health Insurance Coverage by Age in Walland
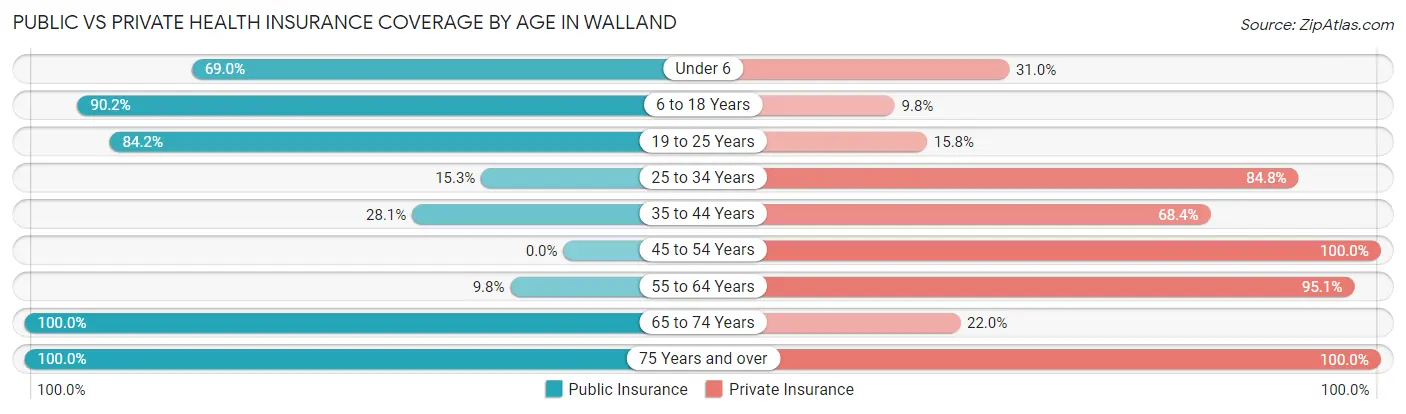
| Age Bracket | Public Insurance | Private Insurance |
| Under 6 | 20 (69.0%) | 9 (31.0%) |
| 6 to 18 Years | 92 (90.2%) | 10 (9.8%) |
| 19 to 25 Years | 32 (84.2%) | 6 (15.8%) |
| 25 to 34 Years | 9 (15.2%) | 50 (84.8%) |
| 35 to 44 Years | 16 (28.1%) | 39 (68.4%) |
| 45 to 54 Years | 0 (0.0%) | 29 (100.0%) |
| 55 to 64 Years | 6 (9.8%) | 58 (95.1%) |
| 65 to 74 Years | 41 (100.0%) | 9 (22.0%) |
| 75 Years and over | 6 (100.0%) | 6 (100.0%) |
| Total | 222 (52.6%) | 216 (51.2%) |
Disability Status by Sex by Age in Walland
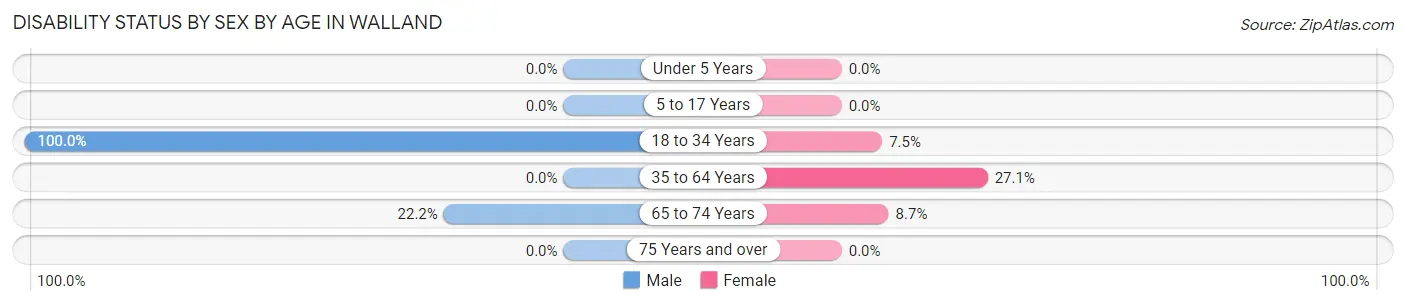
| Age Bracket | Male | Female |
| Under 5 Years | 0 (0.0%) | 0 (0.0%) |
| 5 to 17 Years | 0 (0.0%) | 0 (0.0%) |
| 18 to 34 Years | 17 (100.0%) | 6 (7.5%) |
| 35 to 64 Years | 0 (0.0%) | 13 (27.1%) |
| 65 to 74 Years | 4 (22.2%) | 2 (8.7%) |
| 75 Years and over | 0 (0.0%) | 0 (0.0%) |
Disability Class by Sex by Age in Walland
Disability Class: Hearing Difficulty
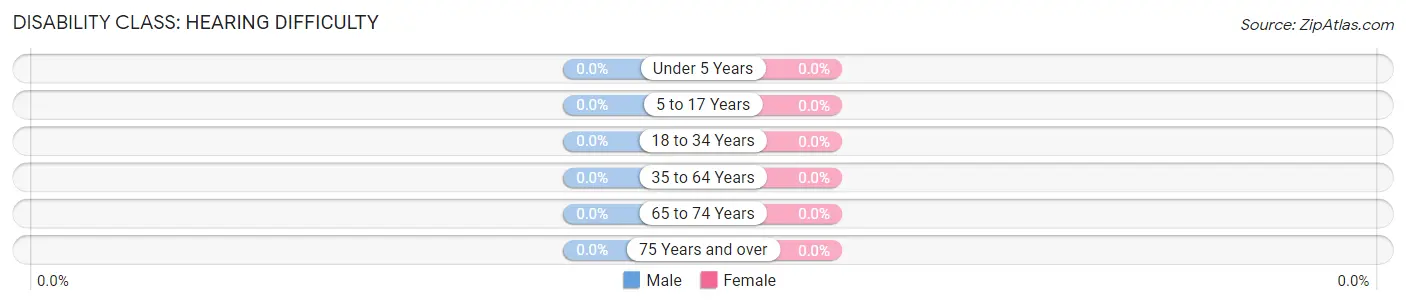
| Age Bracket | Male | Female |
| Under 5 Years | 0 (0.0%) | 0 (0.0%) |
| 5 to 17 Years | 0 (0.0%) | 0 (0.0%) |
| 18 to 34 Years | 0 (0.0%) | 0 (0.0%) |
| 35 to 64 Years | 0 (0.0%) | 0 (0.0%) |
| 65 to 74 Years | 0 (0.0%) | 0 (0.0%) |
| 75 Years and over | 0 (0.0%) | 0 (0.0%) |
Disability Class: Vision Difficulty
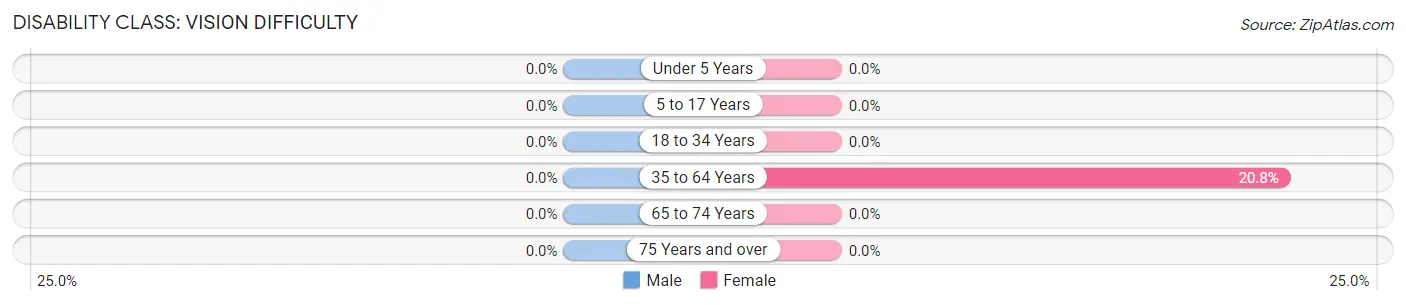
| Age Bracket | Male | Female |
| Under 5 Years | 0 (0.0%) | 0 (0.0%) |
| 5 to 17 Years | 0 (0.0%) | 0 (0.0%) |
| 18 to 34 Years | 0 (0.0%) | 0 (0.0%) |
| 35 to 64 Years | 0 (0.0%) | 10 (20.8%) |
| 65 to 74 Years | 0 (0.0%) | 0 (0.0%) |
| 75 Years and over | 0 (0.0%) | 0 (0.0%) |
Disability Class: Cognitive Difficulty
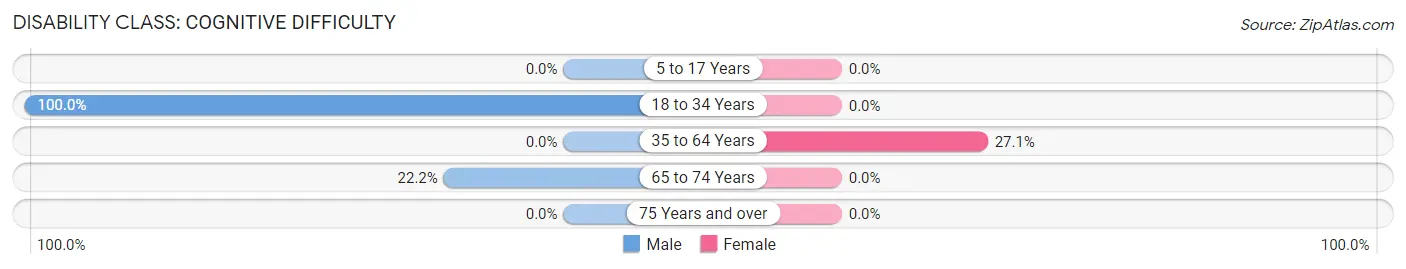
| Age Bracket | Male | Female |
| 5 to 17 Years | 0 (0.0%) | 0 (0.0%) |
| 18 to 34 Years | 17 (100.0%) | 0 (0.0%) |
| 35 to 64 Years | 0 (0.0%) | 13 (27.1%) |
| 65 to 74 Years | 4 (22.2%) | 0 (0.0%) |
| 75 Years and over | 0 (0.0%) | 0 (0.0%) |
Disability Class: Ambulatory Difficulty
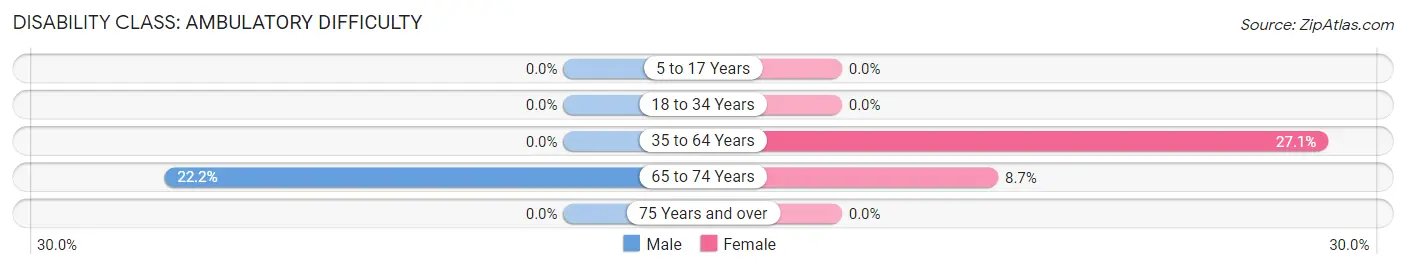
| Age Bracket | Male | Female |
| 5 to 17 Years | 0 (0.0%) | 0 (0.0%) |
| 18 to 34 Years | 0 (0.0%) | 0 (0.0%) |
| 35 to 64 Years | 0 (0.0%) | 13 (27.1%) |
| 65 to 74 Years | 4 (22.2%) | 2 (8.7%) |
| 75 Years and over | 0 (0.0%) | 0 (0.0%) |
Disability Class: Self-Care Difficulty
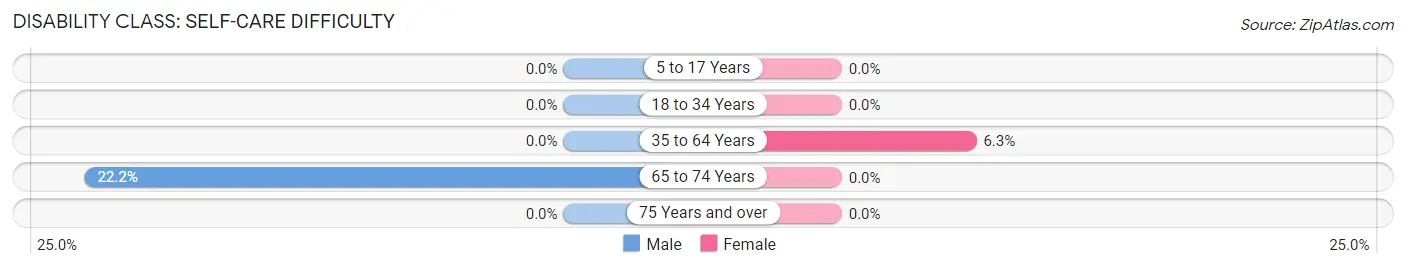
| Age Bracket | Male | Female |
| 5 to 17 Years | 0 (0.0%) | 0 (0.0%) |
| 18 to 34 Years | 0 (0.0%) | 0 (0.0%) |
| 35 to 64 Years | 0 (0.0%) | 3 (6.2%) |
| 65 to 74 Years | 4 (22.2%) | 0 (0.0%) |
| 75 Years and over | 0 (0.0%) | 0 (0.0%) |
Technology Access in Walland
Computing Device Access in Walland
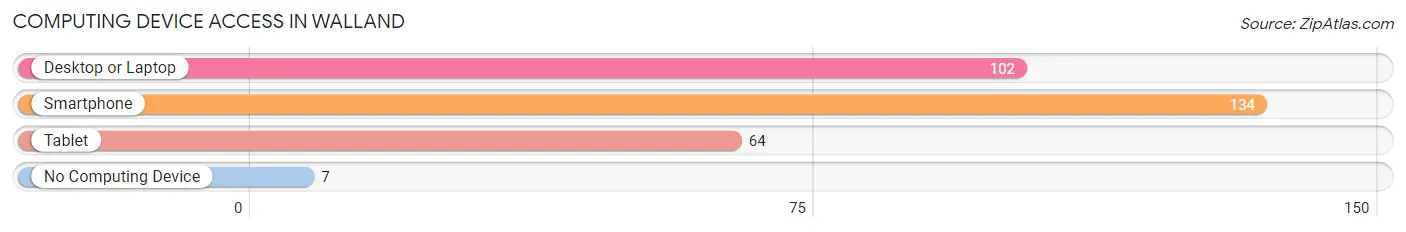
| Device Type | # Households | % Households |
| Desktop or Laptop | 102 | 72.3% |
| Smartphone | 134 | 95.0% |
| Tablet | 64 | 45.4% |
| No Computing Device | 7 | 5.0% |
| Total | 141 | 100.0% |
Internet Access in Walland
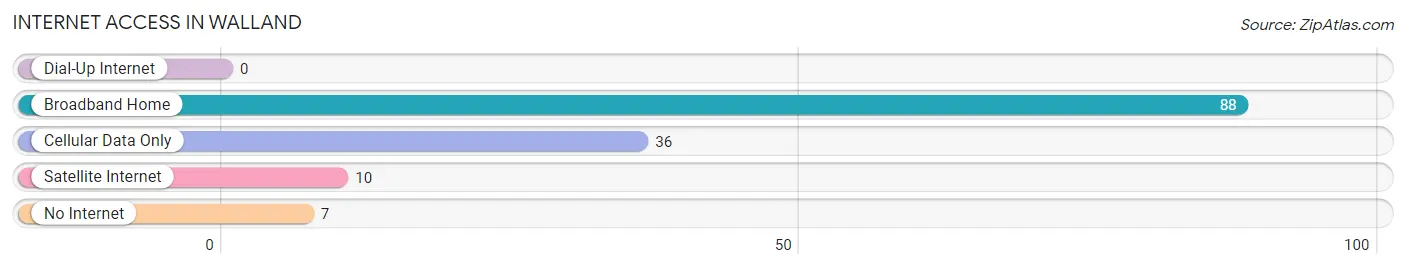
| Internet Type | # Households | % Households |
| Dial-Up Internet | 0 | 0.0% |
| Broadband Home | 88 | 62.4% |
| Cellular Data Only | 36 | 25.5% |
| Satellite Internet | 10 | 7.1% |
| No Internet | 7 | 5.0% |
| Total | 141 | 100.0% |
Walland Summary
Walland, Tennessee is a small unincorporated community located in Blount County, Tennessee. It is situated in the foothills of the Great Smoky Mountains, approximately 20 miles south of Knoxville. The population of Walland was estimated to be 1,845 in 2019.
History
Walland was first settled in the late 1700s by a group of settlers from North Carolina. The town was originally known as Walland’s Crossroads, named after the crossroads of two major roads in the area. The town was officially incorporated in 1883 and was named after the Walland family, who were prominent landowners in the area.
In the late 1800s, Walland was a thriving agricultural community, with many of the residents working in the local tobacco and cotton industries. The town also had a number of small businesses, including a general store, a blacksmith shop, and a grist mill.
In the early 1900s, Walland began to experience a decline in population as many of the residents moved away to larger cities in search of better job opportunities. The town’s population continued to decline until the 1950s, when the Great Smoky Mountains National Park was established nearby. This brought an influx of tourists to the area, which helped to revive the local economy.
Geography
Walland is located in the foothills of the Great Smoky Mountains, approximately 20 miles south of Knoxville. The town is situated at an elevation of 1,000 feet above sea level. The town is surrounded by rolling hills and lush forests, making it a popular destination for outdoor enthusiasts.
The town is located near the Little River, which is a popular spot for fishing and canoeing. The town is also located near the Great Smoky Mountains National Park, which is the most visited national park in the United States.
Economy
Walland’s economy is largely based on tourism, as the town is located near the Great Smoky Mountains National Park. The town also has a number of small businesses, including restaurants, shops, and lodging.
The town is also home to a number of small farms, which produce a variety of crops, including corn, soybeans, and tobacco. The town also has a number of small manufacturing businesses, which produce a variety of products, including furniture and clothing.
Demographics
As of 2019, the population of Walland was estimated to be 1,845. The town has a median age of 44.7 years, with the majority of the population being between the ages of 25 and 44. The town has a population that is predominantly white (94.3%), with a small percentage of African Americans (3.2%) and Hispanics (2.5%).
The median household income in Walland is $45,845, which is slightly lower than the national average. The town has a poverty rate of 15.3%, which is slightly higher than the national average. The town also has a high rate of homeownership, with 73.3% of the population owning their own homes.
Conclusion
Walland, Tennessee is a small unincorporated community located in Blount County, Tennessee. It is situated in the foothills of the Great Smoky Mountains, approximately 20 miles south of Knoxville. The population of Walland was estimated to be 1,845 in 2019. The town’s economy is largely based on tourism, as the town is located near the Great Smoky Mountains National Park. The town also has a number of small businesses, including restaurants, shops, and lodging. The town has a population that is predominantly white (94.3%), with a small percentage of African Americans (3.2%) and Hispanics (2.5%). The median household income in Walland is $45,845, which is slightly lower than the national average. The town also has a high rate of homeownership, with 73.3% of the population owning their own homes.
Common Questions
What is Per Capita Income in Walland?
Per Capita income in Walland is $24,499.
What is the Median Household income in Walland?
Median Household Income in Walland is $57,583.
What is Inequality or Gini Index in Walland?
Inequality or Gini Index in Walland is 0.32.
What is the Total Population of Walland?
Total Population of Walland is 422.
What is the Total Male Population of Walland?
Total Male Population of Walland is 217.
What is the Total Female Population of Walland?
Total Female Population of Walland is 205.
What is the Ratio of Males per 100 Females in Walland?
There are 105.85 Males per 100 Females in Walland.
What is the Ratio of Females per 100 Males in Walland?
There are 94.47 Females per 100 Males in Walland.
What is the Median Population Age in Walland?
Median Population Age in Walland is 31.6 Years.
What is the Average Family Size in Walland
Average Family Size in Walland is 3.3 People.
What is the Average Household Size in Walland
Average Household Size in Walland is 3.0 People.
How Large is the Labor Force in Walland?
There are 217 People in the Labor Forcein in Walland.
What is the Percentage of People in the Labor Force in Walland?
74.6% of People are in the Labor Force in Walland.
What is the Unemployment Rate in Walland?
Unemployment Rate in Walland is 17.5%.