Clarksburg, TN Map & Demographics
Clarksburg Map
Clarksburg Overview
$24,810
PER CAPITA INCOME
$74,188
AVG FAMILY INCOME
$68,750
AVG HOUSEHOLD INCOME
49.9%
WAGE / INCOME GAP [ % ]
50.1¢/ $1
WAGE / INCOME GAP [ $ ]
0.40
INEQUALITY / GINI INDEX
975
TOTAL POPULATION
508
MALE POPULATION
467
FEMALE POPULATION
108.78
MALES / 100 FEMALES
91.93
FEMALES / 100 MALES
32.9
MEDIAN AGE
3.8
AVG FAMILY SIZE
4.0
AVG HOUSEHOLD SIZE
510
LABOR FORCE [ PEOPLE ]
62.8%
PERCENT IN LABOR FORCE
17.6%
UNEMPLOYMENT RATE
Clarksburg Area Codes
Income in Clarksburg
Income Overview in Clarksburg
Per Capita Income in Clarksburg is $24,810, while median incomes of families and households are $74,188 and $68,750 respectively.
| Characteristic | Number | Measure |
| Per Capita Income | 975 | $24,810 |
| Median Family Income | 203 | $74,188 |
| Mean Family Income | 203 | $79,026 |
| Median Household Income | 247 | $68,750 |
| Mean Household Income | 247 | $72,803 |
| Income Deficit | 203 | $0 |
| Wage / Income Gap (%) | 975 | 49.93% |
| Wage / Income Gap ($) | 975 | 50.07¢ per $1 |
| Gini / Inequality Index | 975 | 0.40 |
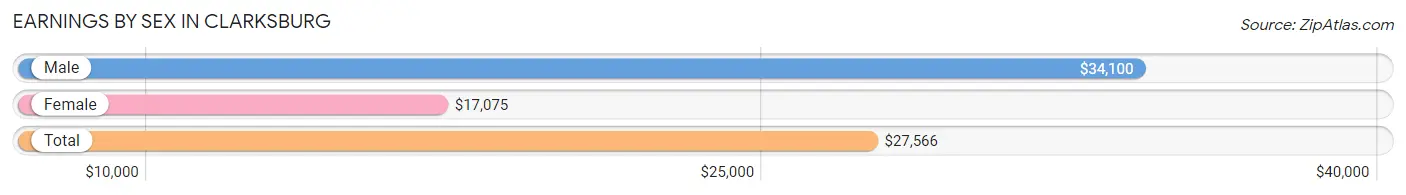
Earnings by Sex in Clarksburg
Average Earnings in Clarksburg are $27,566, $34,100 for men and $17,075 for women, a difference of 49.9%.
| Sex | Number | Average Earnings |
| Male | 304 (55.4%) | $34,100 |
| Female | 245 (44.6%) | $17,075 |
| Total | 549 (100.0%) | $27,566 |
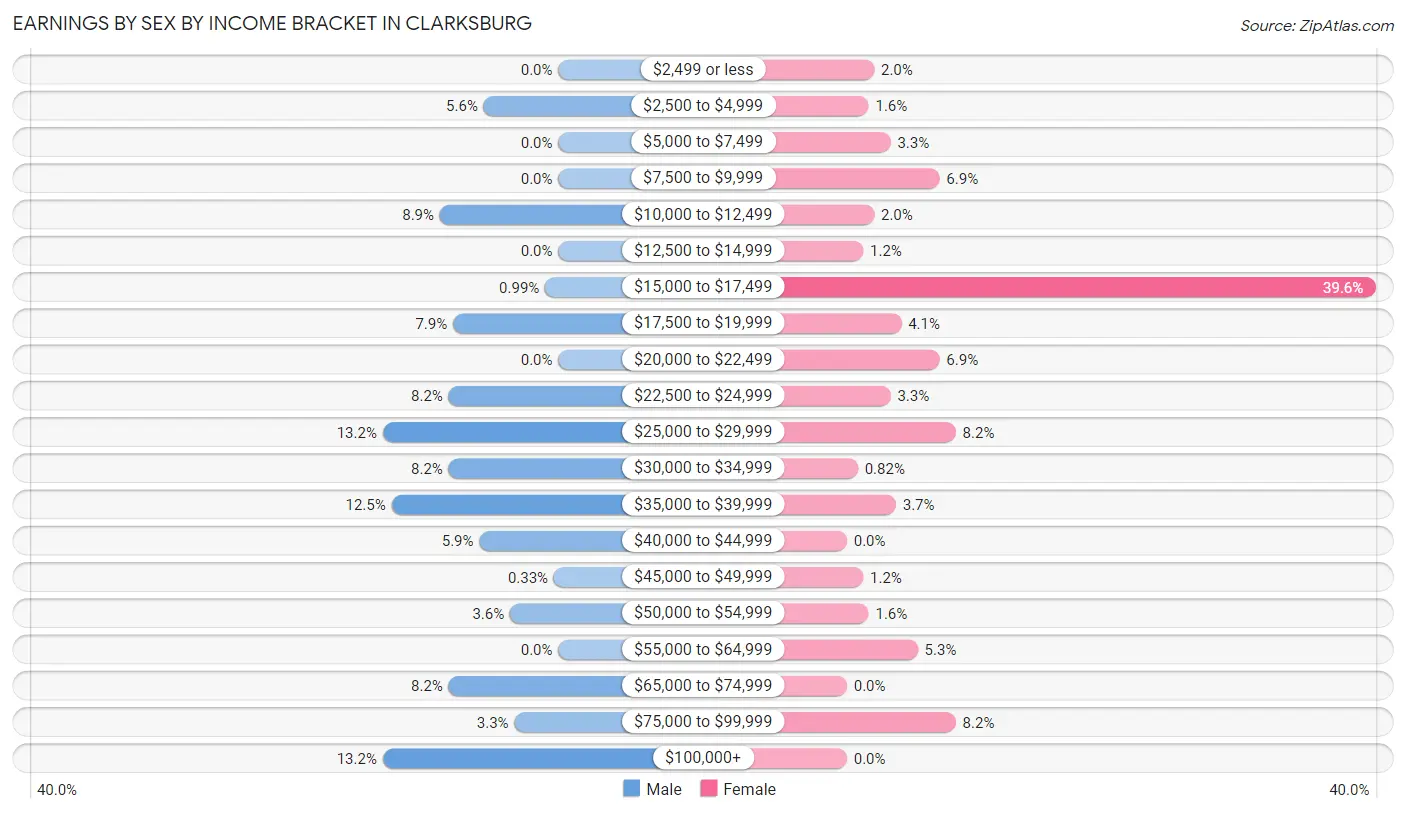
Earnings by Sex by Income Bracket in Clarksburg
The most common earnings brackets in Clarksburg are $25,000 to $29,999 for men (40 | 13.2%) and $15,000 to $17,499 for women (97 | 39.6%).
| Income | Male | Female |
| $2,499 or less | 0 (0.0%) | 5 (2.0%) |
| $2,500 to $4,999 | 17 (5.6%) | 4 (1.6%) |
| $5,000 to $7,499 | 0 (0.0%) | 8 (3.3%) |
| $7,500 to $9,999 | 0 (0.0%) | 17 (6.9%) |
| $10,000 to $12,499 | 27 (8.9%) | 5 (2.0%) |
| $12,500 to $14,999 | 0 (0.0%) | 3 (1.2%) |
| $15,000 to $17,499 | 3 (1.0%) | 97 (39.6%) |
| $17,500 to $19,999 | 24 (7.9%) | 10 (4.1%) |
| $20,000 to $22,499 | 0 (0.0%) | 17 (6.9%) |
| $22,500 to $24,999 | 25 (8.2%) | 8 (3.3%) |
| $25,000 to $29,999 | 40 (13.2%) | 20 (8.2%) |
| $30,000 to $34,999 | 25 (8.2%) | 2 (0.8%) |
| $35,000 to $39,999 | 38 (12.5%) | 9 (3.7%) |
| $40,000 to $44,999 | 18 (5.9%) | 0 (0.0%) |
| $45,000 to $49,999 | 1 (0.3%) | 3 (1.2%) |
| $50,000 to $54,999 | 11 (3.6%) | 4 (1.6%) |
| $55,000 to $64,999 | 0 (0.0%) | 13 (5.3%) |
| $65,000 to $74,999 | 25 (8.2%) | 0 (0.0%) |
| $75,000 to $99,999 | 10 (3.3%) | 20 (8.2%) |
| $100,000+ | 40 (13.2%) | 0 (0.0%) |
| Total | 304 (100.0%) | 245 (100.0%) |
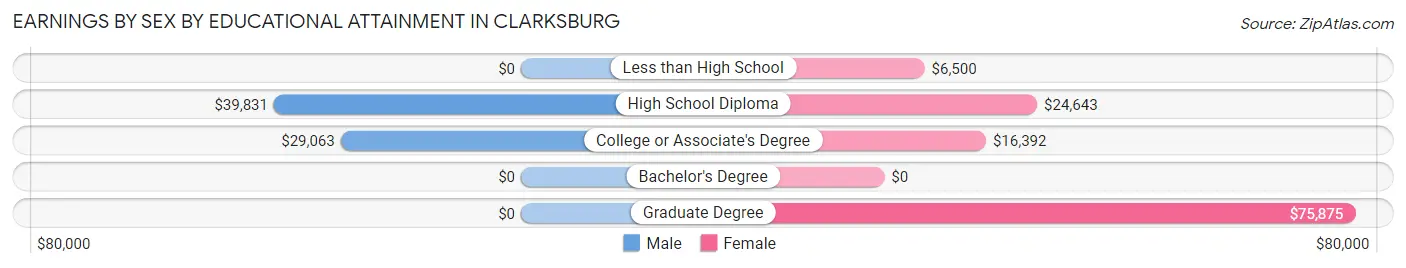
Earnings by Sex by Educational Attainment in Clarksburg
Average earnings in Clarksburg are $38,750 for men and $16,933 for women, a difference of 56.3%. Men with an educational attainment of high school diploma enjoy the highest average annual earnings of $39,831, while those with college or associate's degree education earn the least with $29,063. Women with an educational attainment of graduate degree earn the most with the average annual earnings of $75,875, while those with less than high school education have the smallest earnings of $6,500.
| Educational Attainment | Male Income | Female Income |
| Less than High School | - | - |
| High School Diploma | $39,831 | $24,643 |
| College or Associate's Degree | $29,063 | $16,392 |
| Bachelor's Degree | - | - |
| Graduate Degree | - | - |
| Total | $38,750 | $16,933 |
Family Income in Clarksburg
Family Income Brackets in Clarksburg
According to the Clarksburg family income data, there are 47 families falling into the $75,000 to $99,999 income range, which is the most common income bracket and makes up 23.2% of all families.
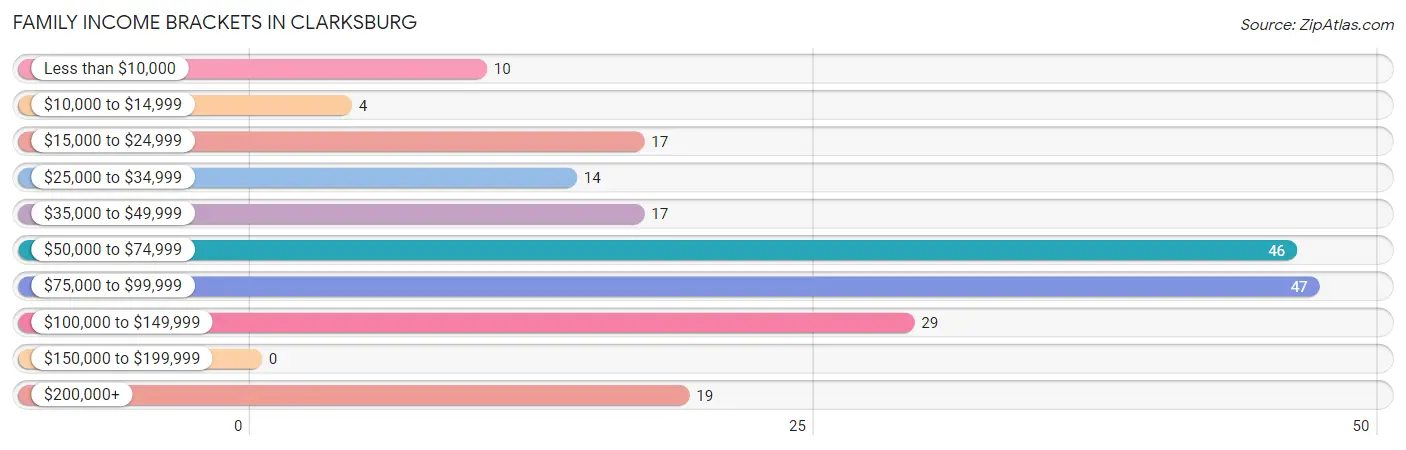
| Income Bracket | # Families | % Families |
| Less than $10,000 | 10 | 4.9% |
| $10,000 to $14,999 | 4 | 2.0% |
| $15,000 to $24,999 | 17 | 8.4% |
| $25,000 to $34,999 | 14 | 6.9% |
| $35,000 to $49,999 | 17 | 8.4% |
| $50,000 to $74,999 | 46 | 22.7% |
| $75,000 to $99,999 | 47 | 23.2% |
| $100,000 to $149,999 | 29 | 14.3% |
| $150,000 to $199,999 | 0 | 0.0% |
| $200,000+ | 19 | 9.4% |
Family Income by Famaliy Size in Clarksburg
5-person families (5 | 2.5%) account for the highest median family income in Clarksburg with $99,375 per family, while 3-person families (66 | 32.5%) have the highest median income of $24,750 per family member.
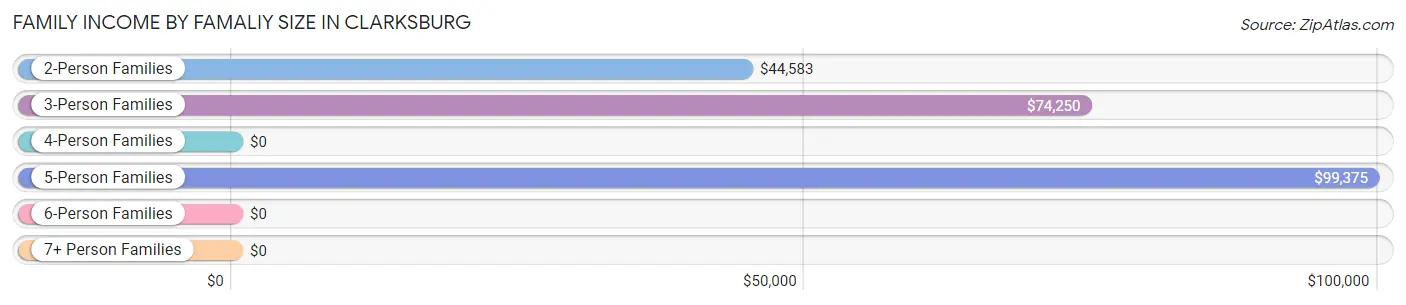
| Income Bracket | # Families | Median Income |
| 2-Person Families | 67 (33.0%) | $44,583 |
| 3-Person Families | 66 (32.5%) | $74,250 |
| 4-Person Families | 57 (28.1%) | $0 |
| 5-Person Families | 5 (2.5%) | $99,375 |
| 6-Person Families | 8 (3.9%) | $0 |
| 7+ Person Families | 0 (0.0%) | $0 |
| Total | 203 (100.0%) | $74,188 |
Family Income by Number of Earners in Clarksburg
The median family income in Clarksburg is $74,188, with families comprising 3+ earners (33) having the highest median family income of $210,074, while families with no earners (33) have the lowest median family income of $34,750, accounting for 16.3% and 16.3% of families, respectively.
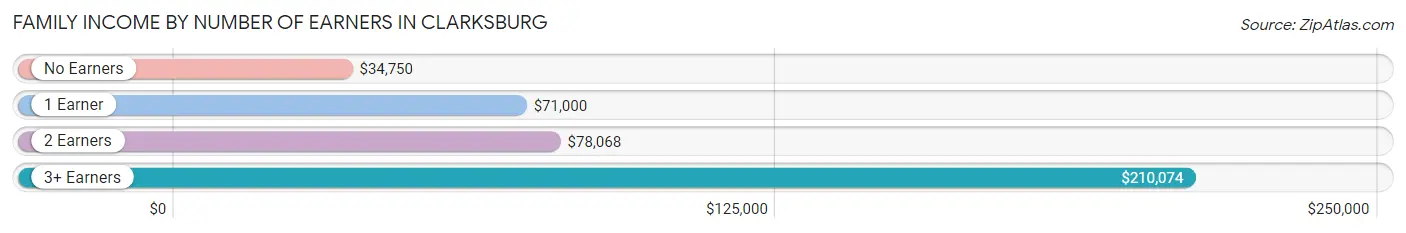
| Number of Earners | # Families | Median Income |
| No Earners | 33 (16.3%) | $34,750 |
| 1 Earner | 86 (42.4%) | $71,000 |
| 2 Earners | 51 (25.1%) | $78,068 |
| 3+ Earners | 33 (16.3%) | $210,074 |
| Total | 203 (100.0%) | $74,188 |
Household Income in Clarksburg
Household Income Brackets in Clarksburg
With 53 households falling in the category, the $50,000 to $74,999 income range is the most frequent in Clarksburg, accounting for 21.5% of all households. In contrast, only 7 households (2.8%) fall into the $150,000 to $199,999 income bracket, making it the least populous group.
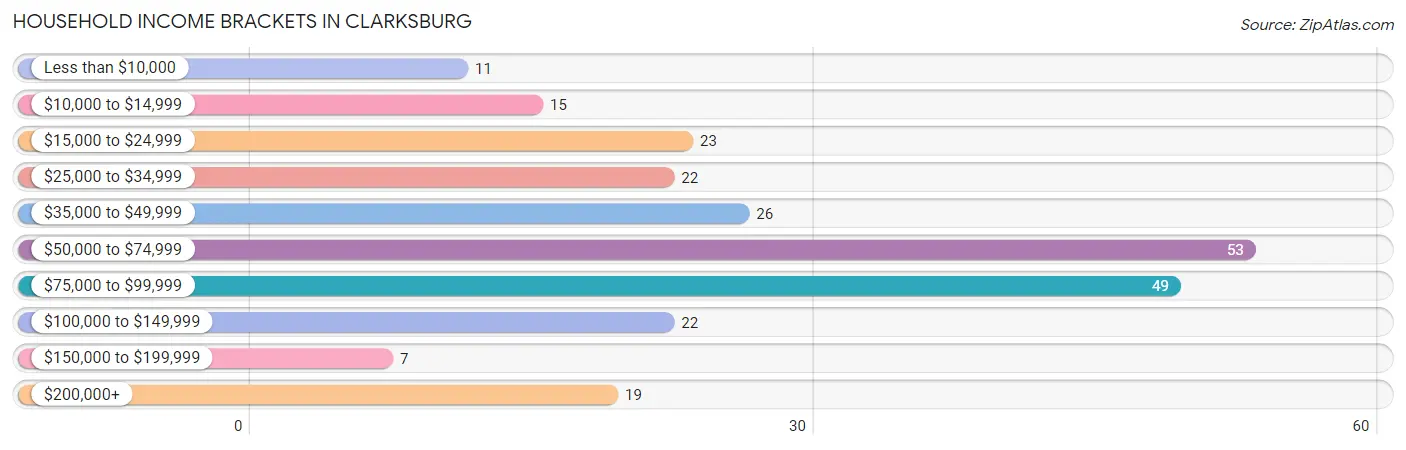
| Income Bracket | # Households | % Households |
| Less than $10,000 | 11 | 4.5% |
| $10,000 to $14,999 | 15 | 6.1% |
| $15,000 to $24,999 | 23 | 9.3% |
| $25,000 to $34,999 | 22 | 8.9% |
| $35,000 to $49,999 | 26 | 10.5% |
| $50,000 to $74,999 | 53 | 21.5% |
| $75,000 to $99,999 | 49 | 19.8% |
| $100,000 to $149,999 | 22 | 8.9% |
| $150,000 to $199,999 | 7 | 2.8% |
| $200,000+ | 19 | 7.7% |
Household Income by Householder Age in Clarksburg
The median household income in Clarksburg is $68,750, with the highest median household income of $75,284 found in the 45 to 64 years age bracket for the primary householder. A total of 111 households (44.9%) fall into this category. Meanwhile, the 15 to 24 years age bracket for the primary householder has the lowest median household income of $0, with 23 households (9.3%) in this group.
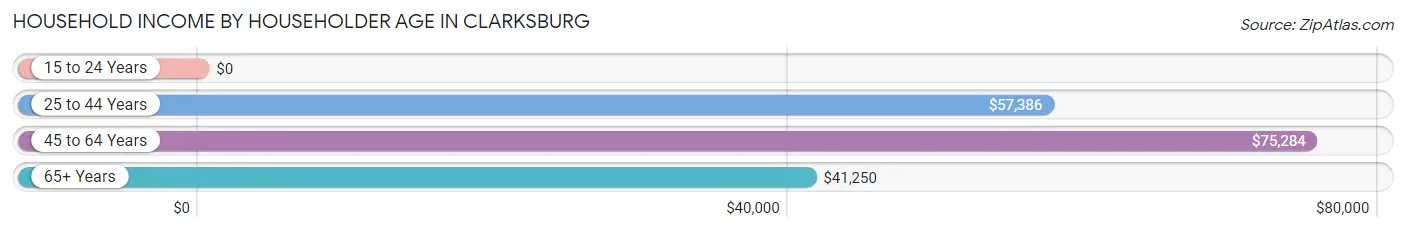
| Income Bracket | # Households | Median Income |
| 15 to 24 Years | 23 (9.3%) | $0 |
| 25 to 44 Years | 57 (23.1%) | $57,386 |
| 45 to 64 Years | 111 (44.9%) | $75,284 |
| 65+ Years | 56 (22.7%) | $41,250 |
| Total | 247 (100.0%) | $68,750 |
Poverty in Clarksburg
Income Below Poverty by Sex and Age in Clarksburg
With 9.8% poverty level for males and 31.3% for females among the residents of Clarksburg, 35 to 44 year old males and 25 to 34 year old females are the most vulnerable to poverty, with 25 males (50.0%) and 95 females (77.9%) in their respective age groups living below the poverty level.
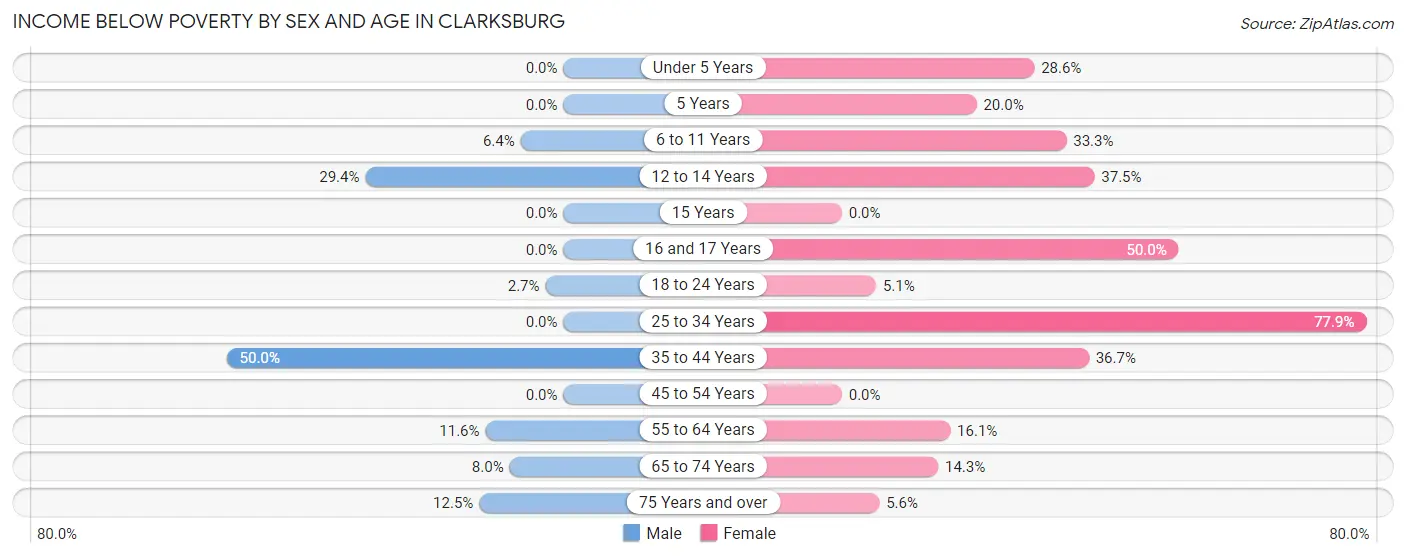
| Age Bracket | Male | Female |
| Under 5 Years | 0 (0.0%) | 2 (28.6%) |
| 5 Years | 0 (0.0%) | 3 (20.0%) |
| 6 to 11 Years | 4 (6.4%) | 7 (33.3%) |
| 12 to 14 Years | 5 (29.4%) | 3 (37.5%) |
| 15 Years | 0 (0.0%) | 0 (0.0%) |
| 16 and 17 Years | 0 (0.0%) | 2 (50.0%) |
| 18 to 24 Years | 2 (2.7%) | 3 (5.1%) |
| 25 to 34 Years | 0 (0.0%) | 95 (77.9%) |
| 35 to 44 Years | 25 (50.0%) | 11 (36.7%) |
| 45 to 54 Years | 0 (0.0%) | 0 (0.0%) |
| 55 to 64 Years | 11 (11.6%) | 14 (16.1%) |
| 65 to 74 Years | 2 (8.0%) | 4 (14.3%) |
| 75 Years and over | 1 (12.5%) | 2 (5.6%) |
| Total | 50 (9.8%) | 146 (31.3%) |
Income Above Poverty by Sex and Age in Clarksburg
According to the poverty statistics in Clarksburg, males aged under 5 years and females aged 15 years are the age groups that are most secure financially, with 100.0% of males and 100.0% of females in these age groups living above the poverty line.
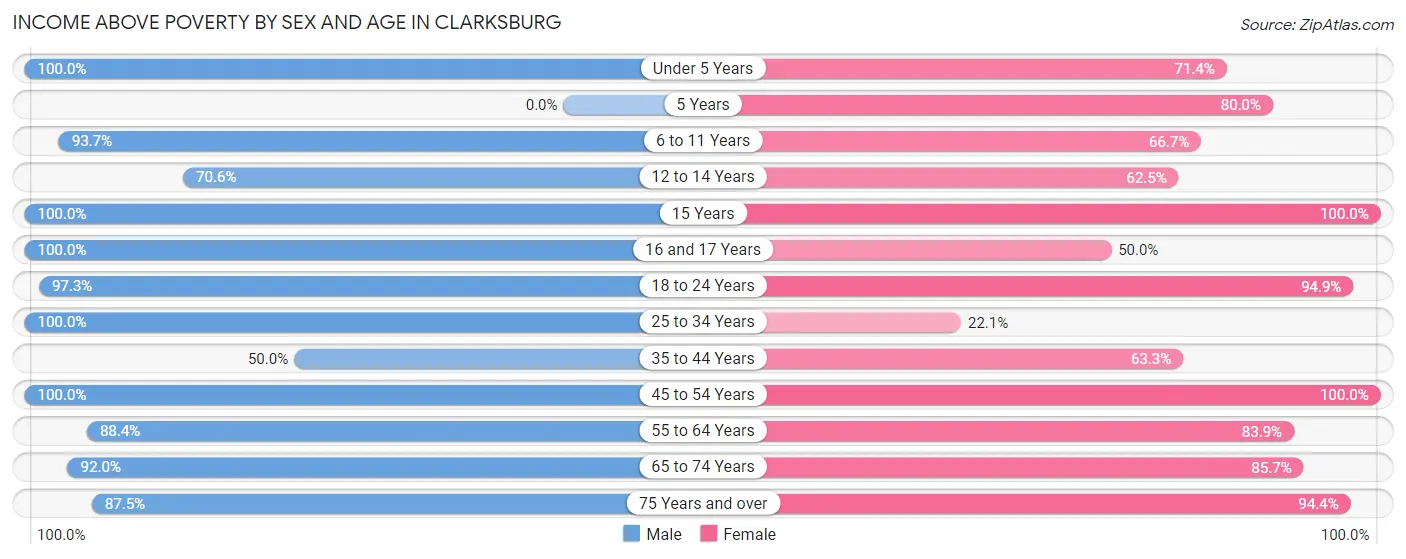
| Age Bracket | Male | Female |
| Under 5 Years | 16 (100.0%) | 5 (71.4%) |
| 5 Years | 0 (0.0%) | 12 (80.0%) |
| 6 to 11 Years | 59 (93.6%) | 14 (66.7%) |
| 12 to 14 Years | 12 (70.6%) | 5 (62.5%) |
| 15 Years | 13 (100.0%) | 3 (100.0%) |
| 16 and 17 Years | 1 (100.0%) | 2 (50.0%) |
| 18 to 24 Years | 73 (97.3%) | 56 (94.9%) |
| 25 to 34 Years | 106 (100.0%) | 27 (22.1%) |
| 35 to 44 Years | 25 (50.0%) | 19 (63.3%) |
| 45 to 54 Years | 39 (100.0%) | 47 (100.0%) |
| 55 to 64 Years | 84 (88.4%) | 73 (83.9%) |
| 65 to 74 Years | 23 (92.0%) | 24 (85.7%) |
| 75 Years and over | 7 (87.5%) | 34 (94.4%) |
| Total | 458 (90.2%) | 321 (68.7%) |
Income Below Poverty Among Married-Couple Families in Clarksburg
The poverty statistics for married-couple families in Clarksburg show that 4.6% or 8 of the total 172 families live below the poverty line. Families with no children have the highest poverty rate of 8.1%, comprising of 8 families. On the other hand, families with 1 or 2 children have the lowest poverty rate of 0.0%, which includes 0 families.
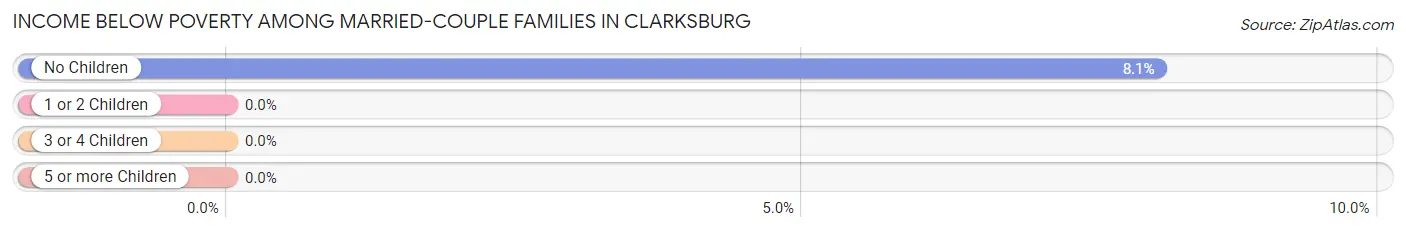
| Children | Above Poverty | Below Poverty |
| No Children | 91 (91.9%) | 8 (8.1%) |
| 1 or 2 Children | 71 (100.0%) | 0 (0.0%) |
| 3 or 4 Children | 2 (100.0%) | 0 (0.0%) |
| 5 or more Children | 0 (0.0%) | 0 (0.0%) |
| Total | 164 (95.4%) | 8 (4.6%) |
Income Below Poverty Among Single-Parent Households in Clarksburg
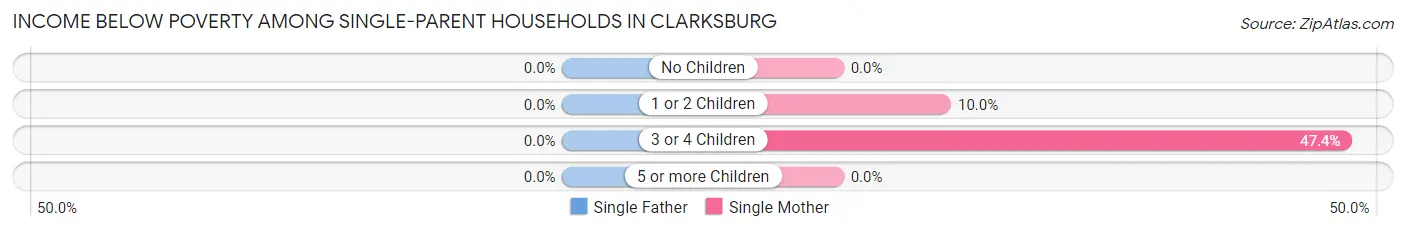
| Children | Single Father | Single Mother |
| No Children | 0 (0.0%) | 0 (0.0%) |
| 1 or 2 Children | 0 (0.0%) | 1 (10.0%) |
| 3 or 4 Children | 0 (0.0%) | 9 (47.4%) |
| 5 or more Children | 0 (0.0%) | 0 (0.0%) |
| Total | 0 (0.0%) | 10 (32.3%) |
Income Below Poverty Among Married-Couple vs Single-Parent Households in Clarksburg
The poverty data for Clarksburg shows that 8 of the married-couple family households (4.6%) and 10 of the single-parent households (32.3%) are living below the poverty level. Within the married-couple family households, those with no children have the highest poverty rate, with 8 households (8.1%) falling below the poverty line. Among the single-parent households, those with 3 or 4 children have the highest poverty rate, with 9 household (47.4%) living below poverty.
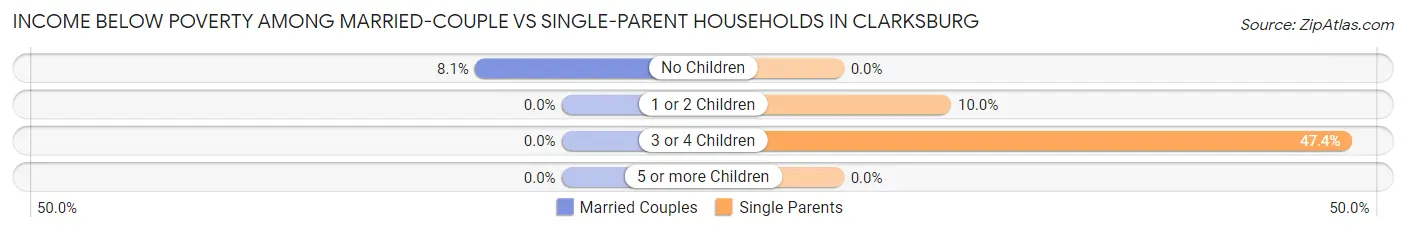
| Children | Married-Couple Families | Single-Parent Households |
| No Children | 8 (8.1%) | 0 (0.0%) |
| 1 or 2 Children | 0 (0.0%) | 1 (10.0%) |
| 3 or 4 Children | 0 (0.0%) | 9 (47.4%) |
| 5 or more Children | 0 (0.0%) | 0 (0.0%) |
| Total | 8 (4.6%) | 10 (32.3%) |
Race in Clarksburg
The most populous races in Clarksburg are White / Caucasian (926 | 95.0%), Black / African American (32 | 3.3%), and Two or more Races (10 | 1.0%).
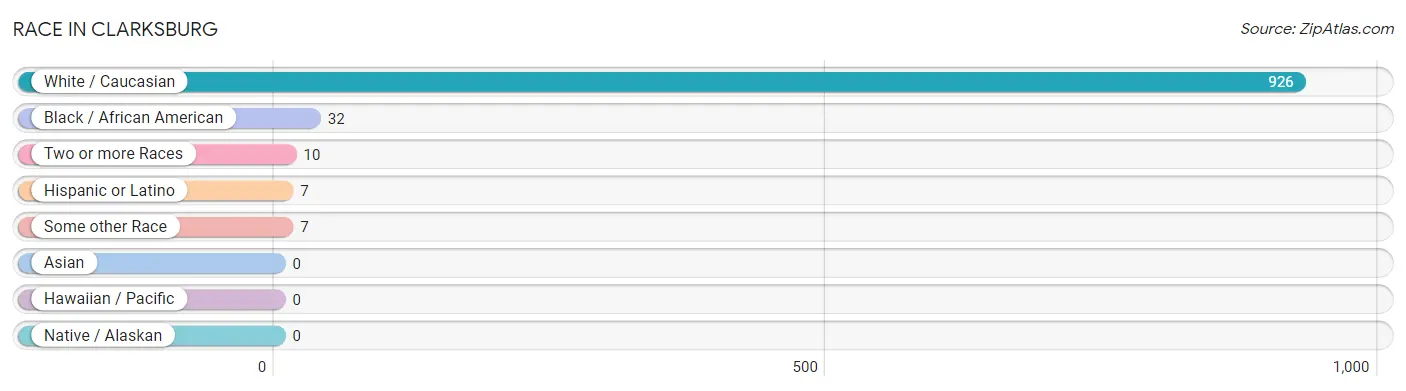
| Race | # Population | % Population |
| Asian | 0 | 0.0% |
| Black / African American | 32 | 3.3% |
| Hawaiian / Pacific | 0 | 0.0% |
| Hispanic or Latino | 7 | 0.7% |
| Native / Alaskan | 0 | 0.0% |
| White / Caucasian | 926 | 95.0% |
| Two or more Races | 10 | 1.0% |
| Some other Race | 7 | 0.7% |
| Total | 975 | 100.0% |
Ancestry in Clarksburg
The most populous ancestries reported in Clarksburg are American (428 | 43.9%), English (360 | 36.9%), Irish (130 | 13.3%), German (14 | 1.4%), and Scotch-Irish (10 | 1.0%), together accounting for 96.6% of all Clarksburg residents.
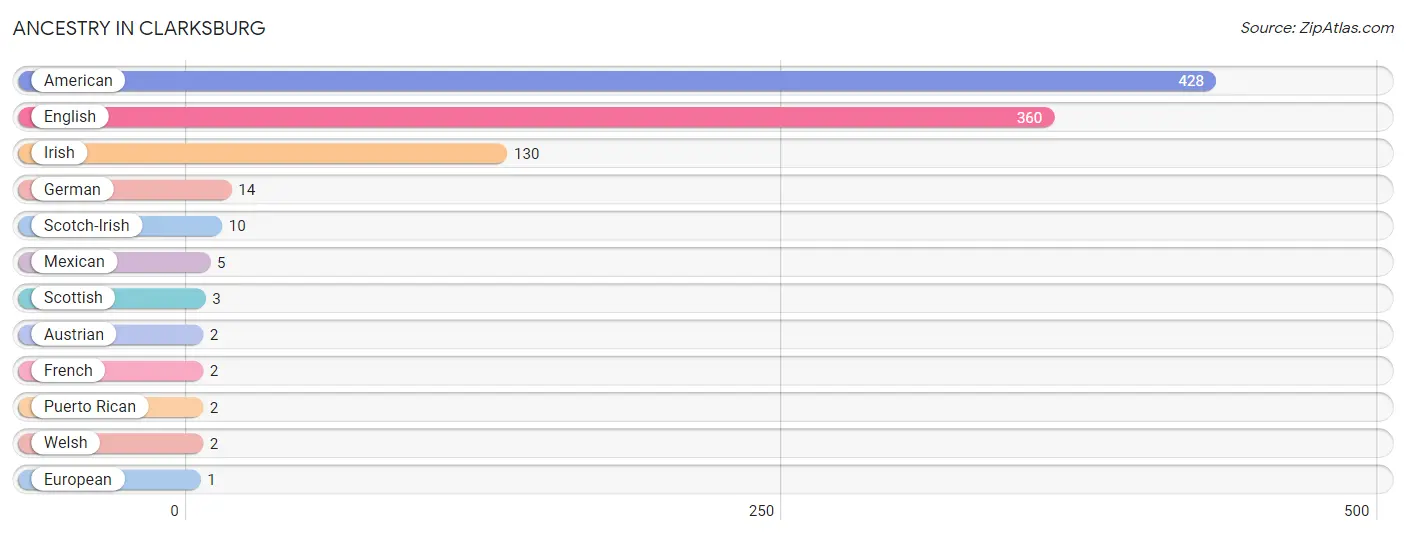
| Ancestry | # Population | % Population |
| American | 428 | 43.9% |
| Austrian | 2 | 0.2% |
| English | 360 | 36.9% |
| European | 1 | 0.1% |
| French | 2 | 0.2% |
| German | 14 | 1.4% |
| Irish | 130 | 13.3% |
| Mexican | 5 | 0.5% |
| Puerto Rican | 2 | 0.2% |
| Scotch-Irish | 10 | 1.0% |
| Scottish | 3 | 0.3% |
| Welsh | 2 | 0.2% | View All 12 Rows |
Immigrants in Clarksburg
The most numerous immigrant groups reported in Clarksburg came from Eastern Europe (10 | 1.0%), Europe (10 | 1.0%), Russia (10 | 1.0%), Central America (2 | 0.2%), and Latin America (2 | 0.2%), together accounting for 3.5% of all Clarksburg residents.
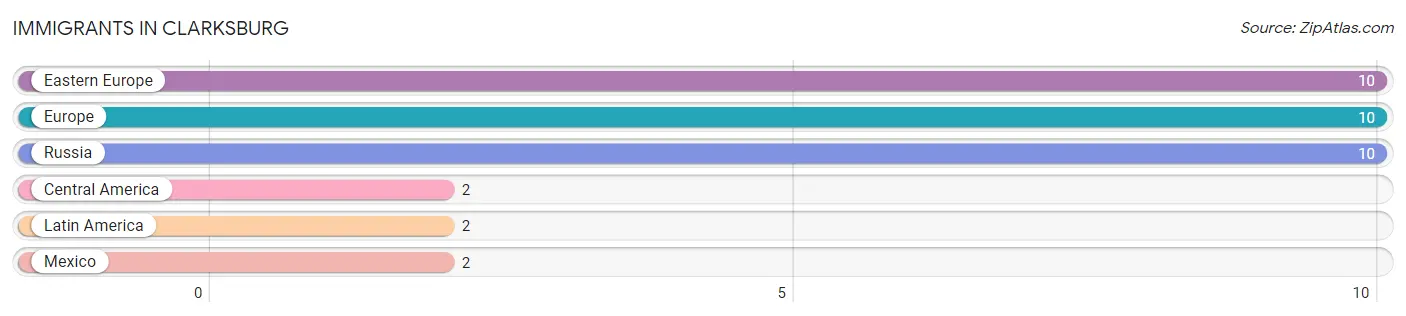
| Immigration Origin | # Population | % Population |
| Central America | 2 | 0.2% |
| Eastern Europe | 10 | 1.0% |
| Europe | 10 | 1.0% |
| Latin America | 2 | 0.2% |
| Mexico | 2 | 0.2% |
| Russia | 10 | 1.0% | View All 6 Rows |
Sex and Age in Clarksburg
Sex and Age in Clarksburg
The most populous age groups in Clarksburg are 25 to 29 Years (76 | 15.0%) for men and 30 to 34 Years (121 | 25.9%) for women.
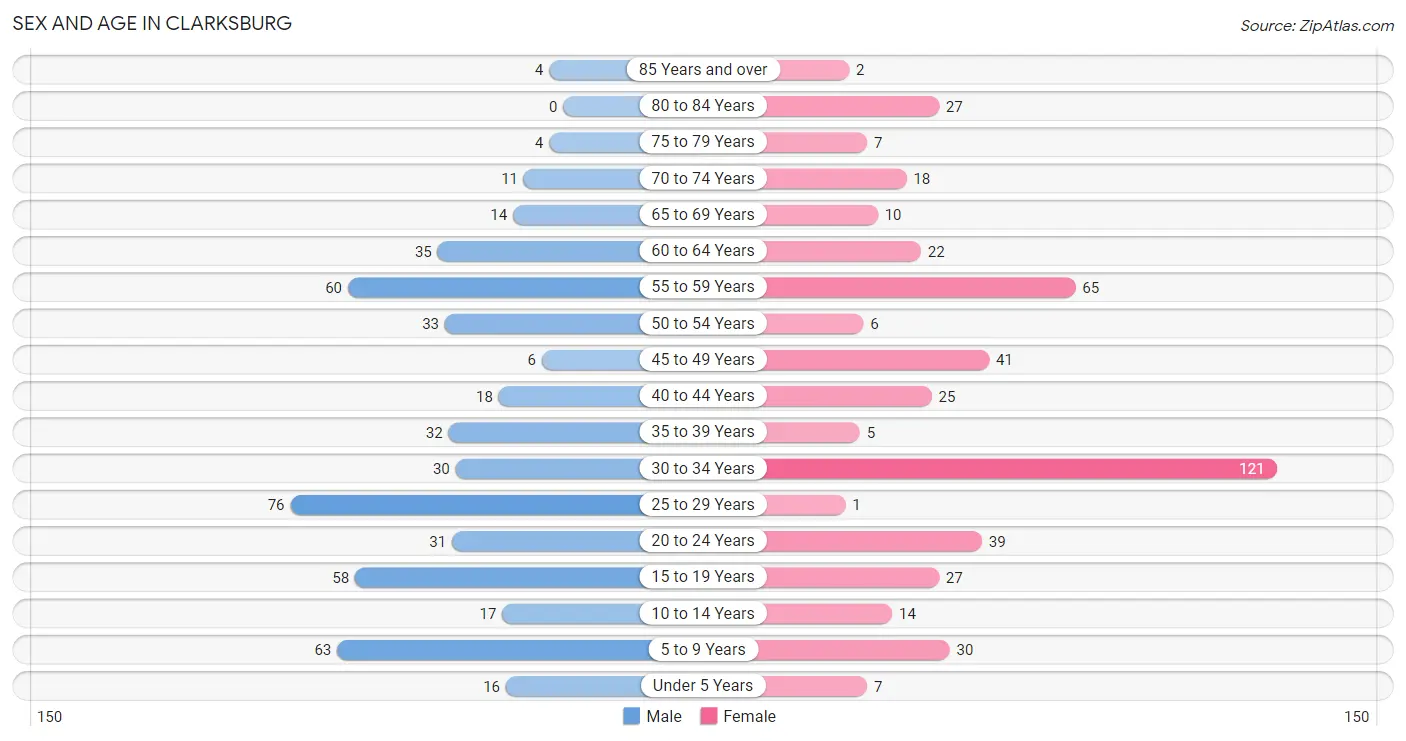
| Age Bracket | Male | Female |
| Under 5 Years | 16 (3.2%) | 7 (1.5%) |
| 5 to 9 Years | 63 (12.4%) | 30 (6.4%) |
| 10 to 14 Years | 17 (3.4%) | 14 (3.0%) |
| 15 to 19 Years | 58 (11.4%) | 27 (5.8%) |
| 20 to 24 Years | 31 (6.1%) | 39 (8.4%) |
| 25 to 29 Years | 76 (15.0%) | 1 (0.2%) |
| 30 to 34 Years | 30 (5.9%) | 121 (25.9%) |
| 35 to 39 Years | 32 (6.3%) | 5 (1.1%) |
| 40 to 44 Years | 18 (3.5%) | 25 (5.3%) |
| 45 to 49 Years | 6 (1.2%) | 41 (8.8%) |
| 50 to 54 Years | 33 (6.5%) | 6 (1.3%) |
| 55 to 59 Years | 60 (11.8%) | 65 (13.9%) |
| 60 to 64 Years | 35 (6.9%) | 22 (4.7%) |
| 65 to 69 Years | 14 (2.8%) | 10 (2.1%) |
| 70 to 74 Years | 11 (2.2%) | 18 (3.8%) |
| 75 to 79 Years | 4 (0.8%) | 7 (1.5%) |
| 80 to 84 Years | 0 (0.0%) | 27 (5.8%) |
| 85 Years and over | 4 (0.8%) | 2 (0.4%) |
| Total | 508 (100.0%) | 467 (100.0%) |
Families and Households in Clarksburg
Median Family Size in Clarksburg
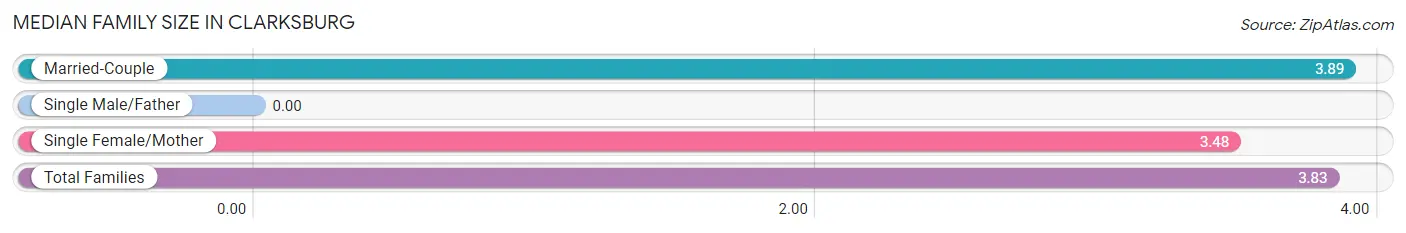
| Family Type | # Families | Family Size |
| Married-Couple | 172 (84.7%) | 3.89 |
| Single Male/Father | 0 (0.0%) | - |
| Single Female/Mother | 31 (15.3%) | 3.48 |
| Total Families | 203 (100.0%) | 3.83 |
Median Household Size in Clarksburg
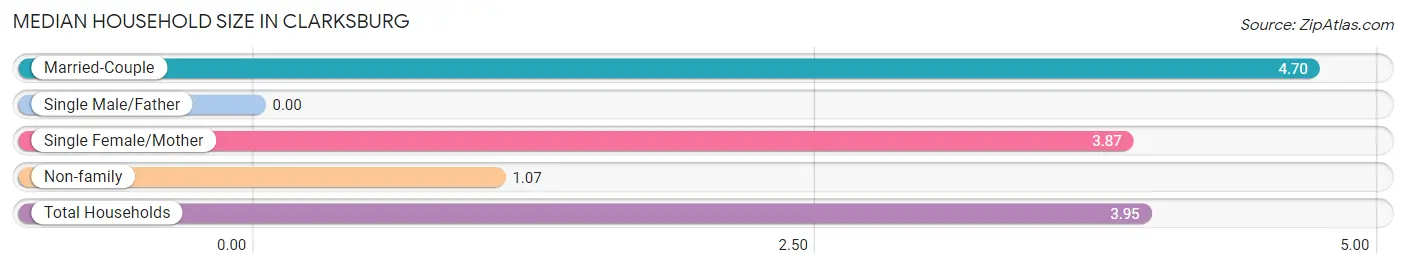
| Household Type | # Households | Household Size |
| Married-Couple | 172 (69.6%) | 4.70 |
| Single Male/Father | 0 (0.0%) | - |
| Single Female/Mother | 31 (12.6%) | 3.87 |
| Non-family | 44 (17.8%) | 1.07 |
| Total Households | 247 (100.0%) | 3.95 |
Household Size by Marriage Status in Clarksburg
Out of a total of 247 households in Clarksburg, 203 (82.2%) are family households, while 44 (17.8%) are nonfamily households. The most numerous type of family households are 3-person households, comprising 65, and the most common type of nonfamily households are 1-person households, comprising 42.
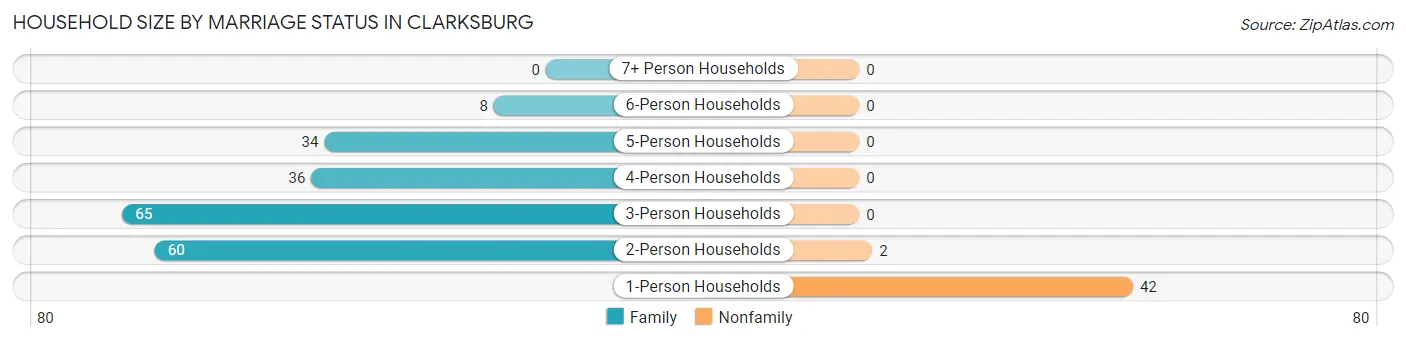
| Household Size | Family Households | Nonfamily Households |
| 1-Person Households | - | 42 (17.0%) |
| 2-Person Households | 60 (24.3%) | 2 (0.8%) |
| 3-Person Households | 65 (26.3%) | 0 (0.0%) |
| 4-Person Households | 36 (14.6%) | 0 (0.0%) |
| 5-Person Households | 34 (13.8%) | 0 (0.0%) |
| 6-Person Households | 8 (3.2%) | 0 (0.0%) |
| 7+ Person Households | 0 (0.0%) | 0 (0.0%) |
| Total | 203 (82.2%) | 44 (17.8%) |
Female Fertility in Clarksburg
Fertility by Age in Clarksburg
Average fertility rate in Clarksburg is 80.0 births per 1,000 women. Women in the age bracket of 15 to 19 years have the highest fertility rate with 667.0 births per 1,000 women. Women in the age bracket of 15 to 19 years acount for 85.7% of all women with births.
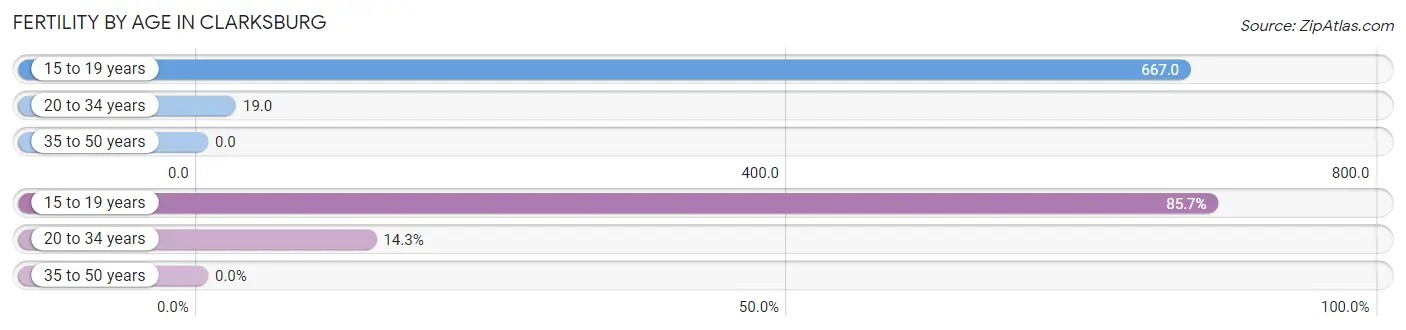
| Age Bracket | Women with Births | Births / 1,000 Women |
| 15 to 19 years | 18 (85.7%) | 667.0 |
| 20 to 34 years | 3 (14.3%) | 19.0 |
| 35 to 50 years | 0 (0.0%) | 0.0 |
| Total | 21 (100.0%) | 80.0 |
Fertility by Age by Marriage Status in Clarksburg
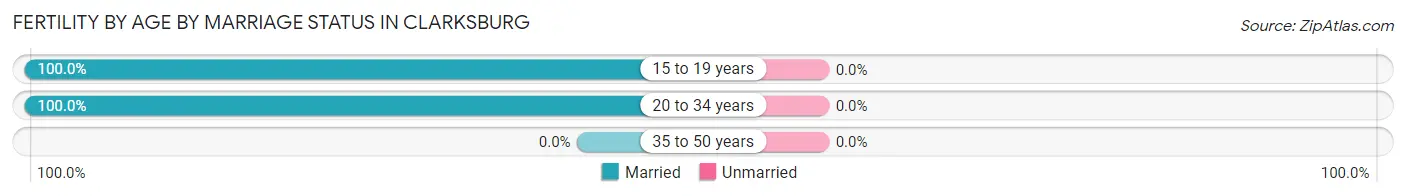
| Age Bracket | Married | Unmarried |
| 15 to 19 years | 18 (100.0%) | 0 (0.0%) |
| 20 to 34 years | 3 (100.0%) | 0 (0.0%) |
| 35 to 50 years | 0 (0.0%) | 0 (0.0%) |
| Total | 21 (100.0%) | 0 (0.0%) |
Fertility by Education in Clarksburg
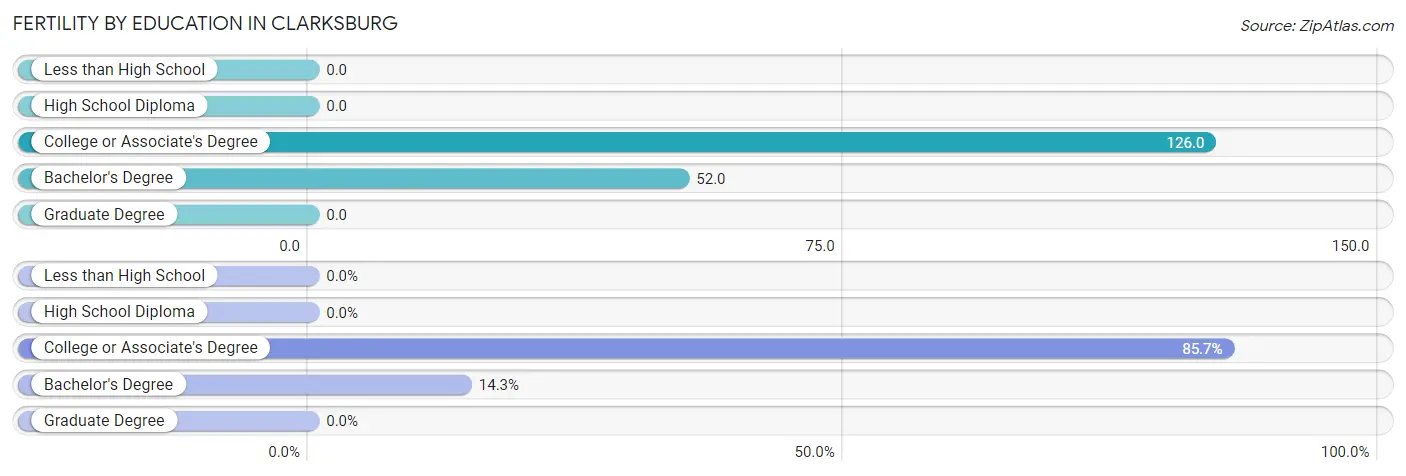
| Educational Attainment | Women with Births | Births / 1,000 Women |
| Less than High School | 0 (0.0%) | 0.0 |
| High School Diploma | 0 (0.0%) | 0.0 |
| College or Associate's Degree | 18 (85.7%) | 126.0 |
| Bachelor's Degree | 3 (14.3%) | 52.0 |
| Graduate Degree | 0 (0.0%) | 0.0 |
| Total | 21 (100.0%) | 80.0 |
Fertility by Education by Marriage Status in Clarksburg
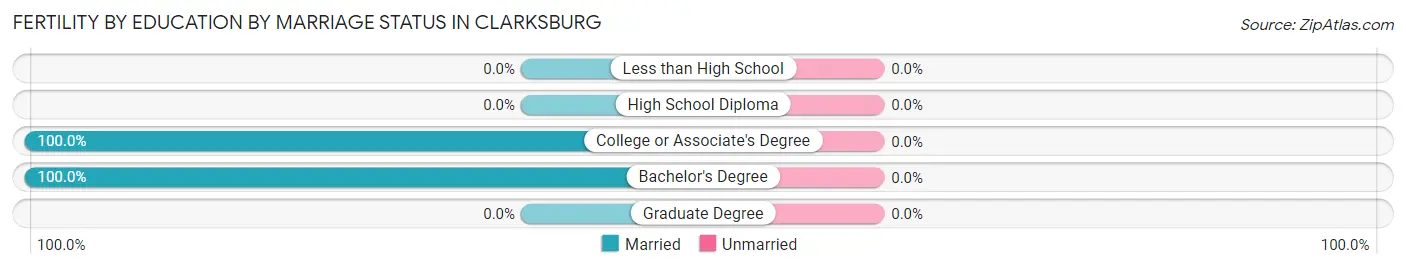
| Educational Attainment | Married | Unmarried |
| Less than High School | 0 (0.0%) | 0 (0.0%) |
| High School Diploma | 0 (0.0%) | 0 (0.0%) |
| College or Associate's Degree | 18 (100.0%) | 0 (0.0%) |
| Bachelor's Degree | 3 (100.0%) | 0 (0.0%) |
| Graduate Degree | 0 (0.0%) | 0 (0.0%) |
| Total | 21 (100.0%) | 0 (0.0%) |
Employment Characteristics in Clarksburg
Employment by Class of Employer in Clarksburg
Among the 395 employed individuals in Clarksburg, private company employees (281 | 71.1%), self-employed (not incorporated) (38 | 9.6%), and local government employees (28 | 7.1%) make up the most common classes of employment.
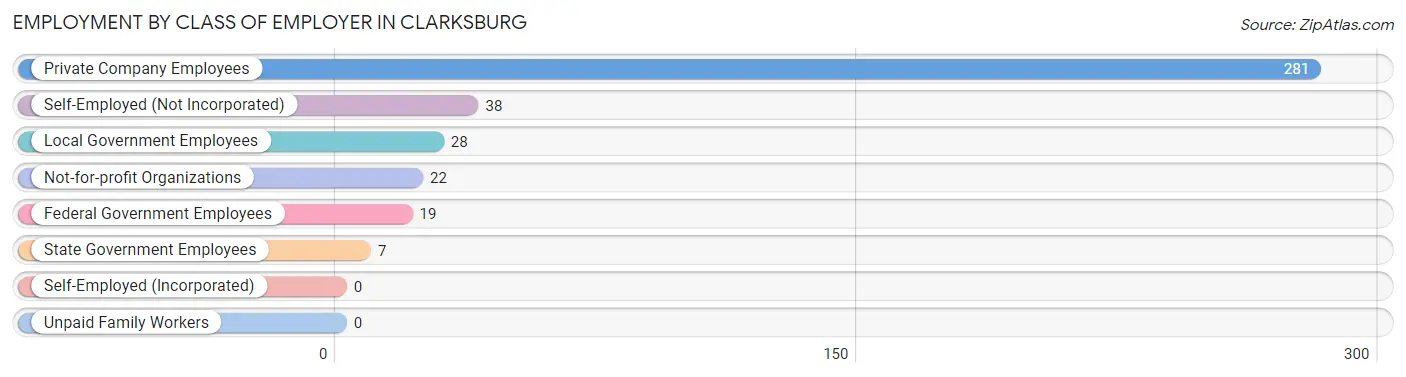
| Employer Class | # Employees | % Employees |
| Private Company Employees | 281 | 71.1% |
| Self-Employed (Incorporated) | 0 | 0.0% |
| Self-Employed (Not Incorporated) | 38 | 9.6% |
| Not-for-profit Organizations | 22 | 5.6% |
| Local Government Employees | 28 | 7.1% |
| State Government Employees | 7 | 1.8% |
| Federal Government Employees | 19 | 4.8% |
| Unpaid Family Workers | 0 | 0.0% |
| Total | 395 | 100.0% |
Employment Status by Age in Clarksburg
According to the labor force statistics for Clarksburg, out of the total population over 16 years of age (812), 62.8% or 510 individuals are in the labor force, with 17.6% or 90 of them unemployed. The age group with the highest labor force participation rate is 25 to 29 years, with 100.0% or 77 individuals in the labor force. Within the labor force, the 30 to 34 years age range has the highest percentage of unemployed individuals, with 67.4% or 89 of them being unemployed.
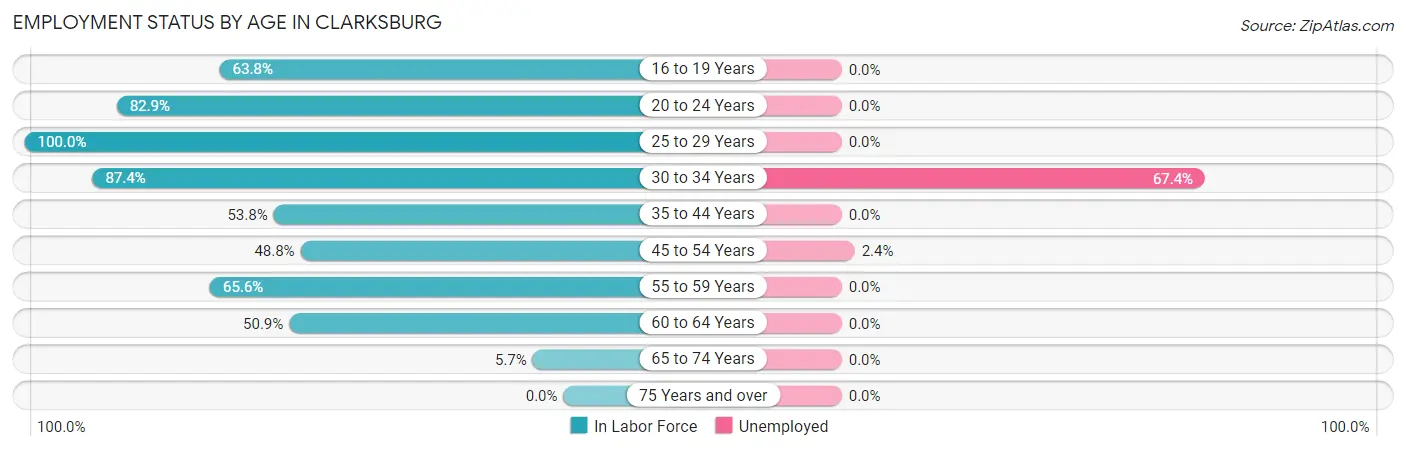
| Age Bracket | In Labor Force | Unemployed |
| 16 to 19 Years | 44 (63.8%) | 0 (0.0%) |
| 20 to 24 Years | 58 (82.9%) | 0 (0.0%) |
| 25 to 29 Years | 77 (100.0%) | 0 (0.0%) |
| 30 to 34 Years | 132 (87.4%) | 89 (67.4%) |
| 35 to 44 Years | 43 (53.8%) | 0 (0.0%) |
| 45 to 54 Years | 42 (48.8%) | 1 (2.4%) |
| 55 to 59 Years | 82 (65.6%) | 0 (0.0%) |
| 60 to 64 Years | 29 (50.9%) | 0 (0.0%) |
| 65 to 74 Years | 3 (5.7%) | 0 (0.0%) |
| 75 Years and over | 0 (0.0%) | 0 (0.0%) |
| Total | 510 (62.8%) | 90 (17.6%) |
Employment Status by Educational Attainment in Clarksburg
According to labor force statistics for Clarksburg, 70.3% of individuals (405) out of the total population between 25 and 64 years of age (576) are in the labor force, with 22.2% or 90 of them being unemployed. The group with the highest labor force participation rate are those with the educational attainment of college / associate degree, with 94.3% or 164 individuals in the labor force. Within the labor force, individuals with college / associate degree education have the highest percentage of unemployment, with 53.0% or 87 of them being unemployed.
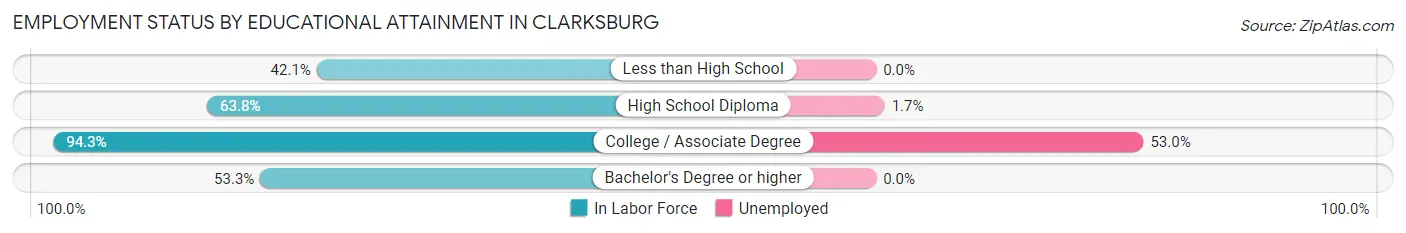
| Educational Attainment | In Labor Force | Unemployed |
| Less than High School | 8 (42.1%) | 0 (0.0%) |
| High School Diploma | 176 (63.8%) | 5 (1.7%) |
| College / Associate Degree | 164 (94.3%) | 92 (53.0%) |
| Bachelor's Degree or higher | 57 (53.3%) | 0 (0.0%) |
| Total | 405 (70.3%) | 128 (22.2%) |
Employment Occupations by Sex in Clarksburg
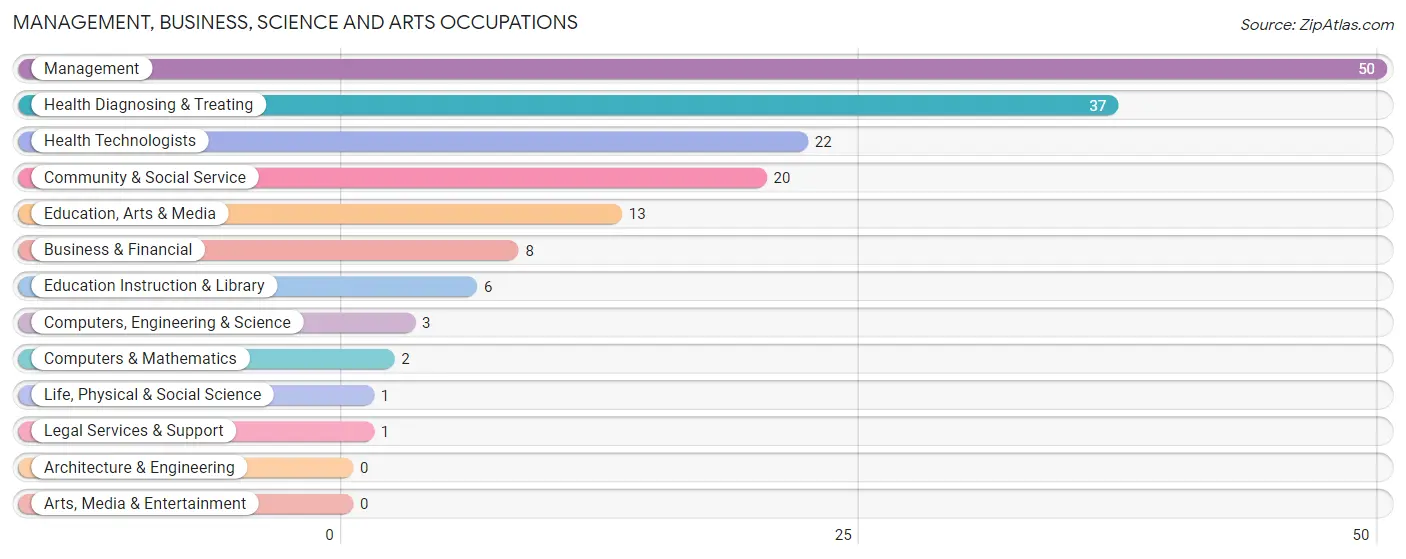
Management, Business, Science and Arts Occupations
The most common Management, Business, Science and Arts occupations in Clarksburg are Management (50 | 11.9%), Health Diagnosing & Treating (37 | 8.8%), Health Technologists (22 | 5.2%), Community & Social Service (20 | 4.8%), and Education, Arts & Media (13 | 3.1%).
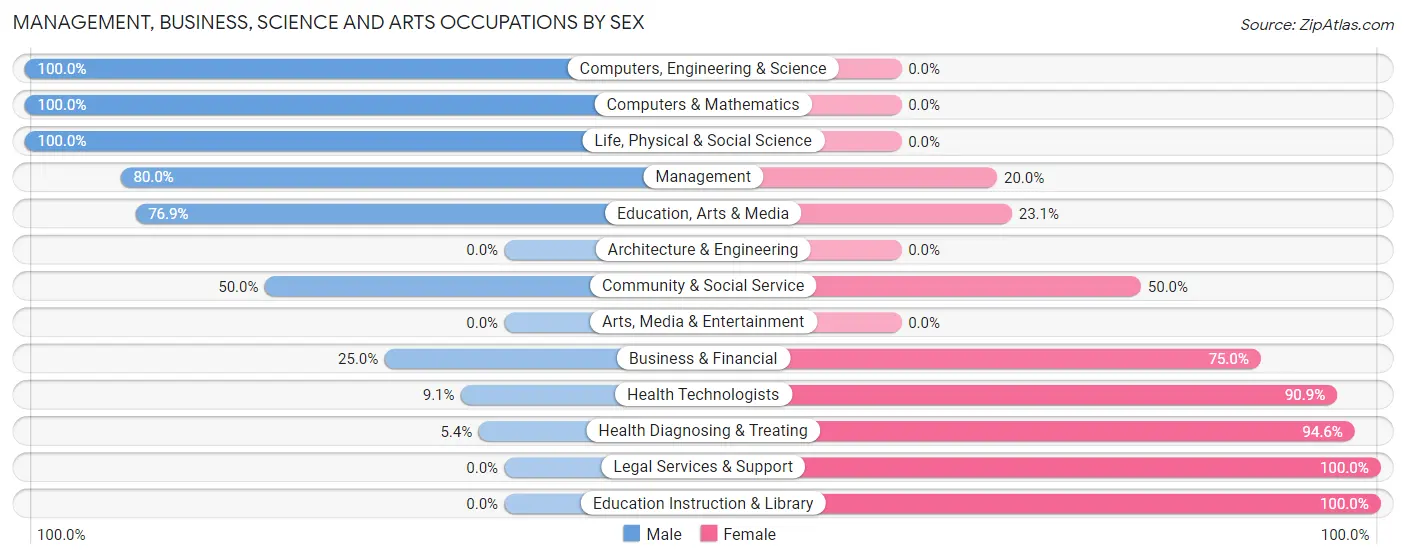
Management, Business, Science and Arts Occupations by Sex
Within the Management, Business, Science and Arts occupations in Clarksburg, the most male-oriented occupations are Computers, Engineering & Science (100.0%), Computers & Mathematics (100.0%), and Life, Physical & Social Science (100.0%), while the most female-oriented occupations are Legal Services & Support (100.0%), Education Instruction & Library (100.0%), and Health Diagnosing & Treating (94.6%).
| Occupation | Male | Female |
| Management | 40 (80.0%) | 10 (20.0%) |
| Business & Financial | 2 (25.0%) | 6 (75.0%) |
| Computers, Engineering & Science | 3 (100.0%) | 0 (0.0%) |
| Computers & Mathematics | 2 (100.0%) | 0 (0.0%) |
| Architecture & Engineering | 0 (0.0%) | 0 (0.0%) |
| Life, Physical & Social Science | 1 (100.0%) | 0 (0.0%) |
| Community & Social Service | 10 (50.0%) | 10 (50.0%) |
| Education, Arts & Media | 10 (76.9%) | 3 (23.1%) |
| Legal Services & Support | 0 (0.0%) | 1 (100.0%) |
| Education Instruction & Library | 0 (0.0%) | 6 (100.0%) |
| Arts, Media & Entertainment | 0 (0.0%) | 0 (0.0%) |
| Health Diagnosing & Treating | 2 (5.4%) | 35 (94.6%) |
| Health Technologists | 2 (9.1%) | 20 (90.9%) |
| Total (Category) | 57 (48.3%) | 61 (51.7%) |
| Total (Overall) | 269 (64.0%) | 151 (35.9%) |
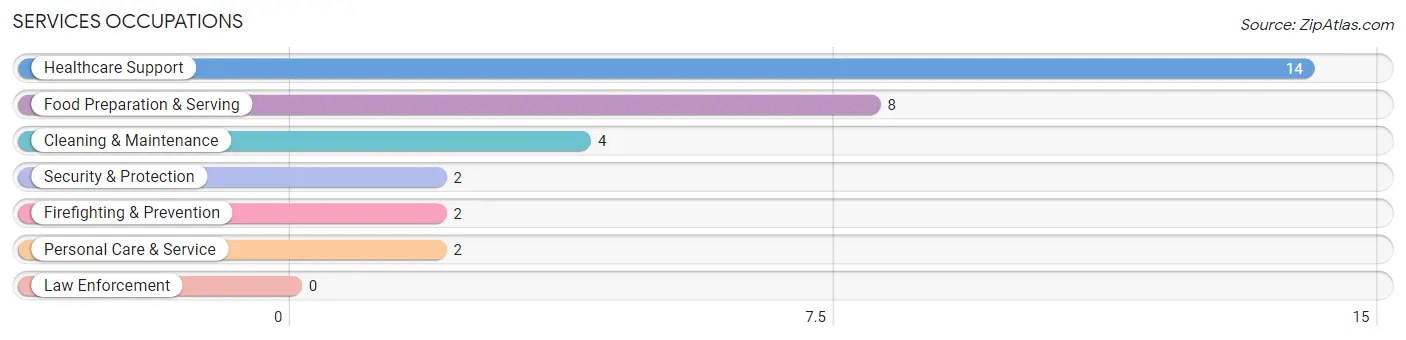
Services Occupations
The most common Services occupations in Clarksburg are Healthcare Support (14 | 3.3%), Food Preparation & Serving (8 | 1.9%), Cleaning & Maintenance (4 | 0.9%), Security & Protection (2 | 0.5%), and Firefighting & Prevention (2 | 0.5%).
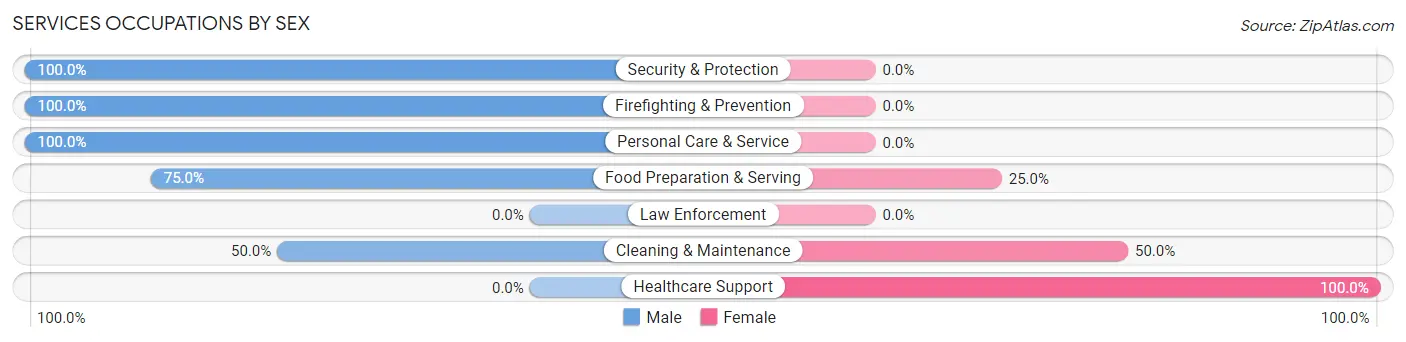
Services Occupations by Sex
Within the Services occupations in Clarksburg, the most male-oriented occupations are Security & Protection (100.0%), Firefighting & Prevention (100.0%), and Personal Care & Service (100.0%), while the most female-oriented occupations are Healthcare Support (100.0%), Cleaning & Maintenance (50.0%), and Food Preparation & Serving (25.0%).
| Occupation | Male | Female |
| Healthcare Support | 0 (0.0%) | 14 (100.0%) |
| Security & Protection | 2 (100.0%) | 0 (0.0%) |
| Firefighting & Prevention | 2 (100.0%) | 0 (0.0%) |
| Law Enforcement | 0 (0.0%) | 0 (0.0%) |
| Food Preparation & Serving | 6 (75.0%) | 2 (25.0%) |
| Cleaning & Maintenance | 2 (50.0%) | 2 (50.0%) |
| Personal Care & Service | 2 (100.0%) | 0 (0.0%) |
| Total (Category) | 12 (40.0%) | 18 (60.0%) |
| Total (Overall) | 269 (64.0%) | 151 (35.9%) |
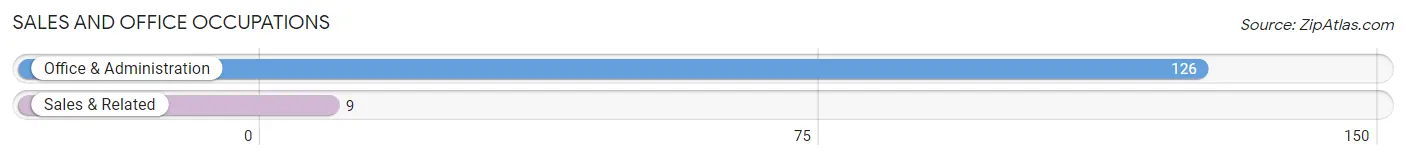
Sales and Office Occupations
The most common Sales and Office occupations in Clarksburg are Office & Administration (126 | 30.0%), and Sales & Related (9 | 2.1%).
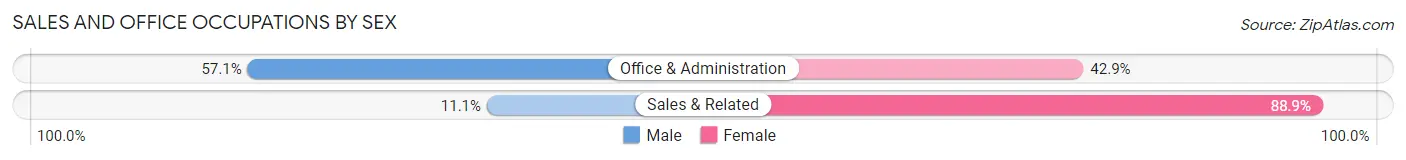
Sales and Office Occupations by Sex
| Occupation | Male | Female |
| Sales & Related | 1 (11.1%) | 8 (88.9%) |
| Office & Administration | 72 (57.1%) | 54 (42.9%) |
| Total (Category) | 73 (54.1%) | 62 (45.9%) |
| Total (Overall) | 269 (64.0%) | 151 (35.9%) |
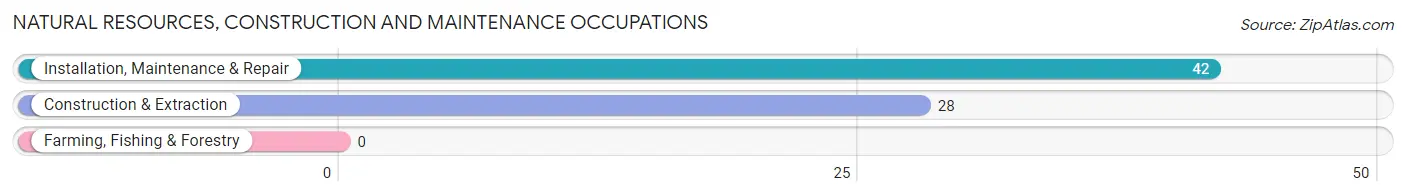
Natural Resources, Construction and Maintenance Occupations
The most common Natural Resources, Construction and Maintenance occupations in Clarksburg are Installation, Maintenance & Repair (42 | 10.0%), and Construction & Extraction (28 | 6.7%).
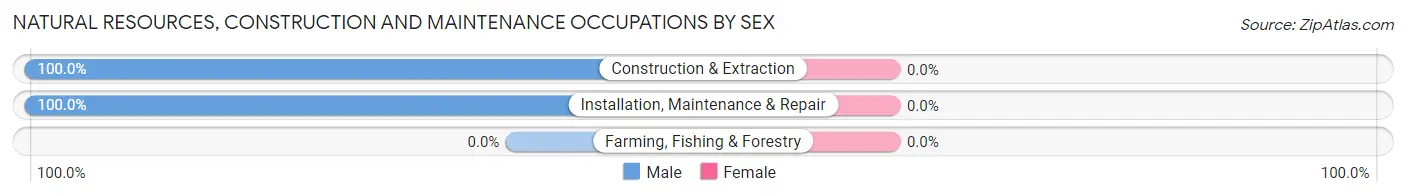
Natural Resources, Construction and Maintenance Occupations by Sex
| Occupation | Male | Female |
| Farming, Fishing & Forestry | 0 (0.0%) | 0 (0.0%) |
| Construction & Extraction | 28 (100.0%) | 0 (0.0%) |
| Installation, Maintenance & Repair | 42 (100.0%) | 0 (0.0%) |
| Total (Category) | 70 (100.0%) | 0 (0.0%) |
| Total (Overall) | 269 (64.0%) | 151 (35.9%) |
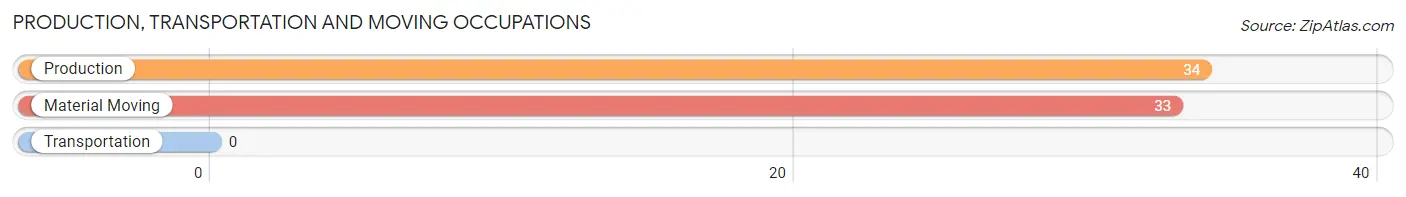
Production, Transportation and Moving Occupations
The most common Production, Transportation and Moving occupations in Clarksburg are Production (34 | 8.1%), and Material Moving (33 | 7.9%).
Production, Transportation and Moving Occupations by Sex
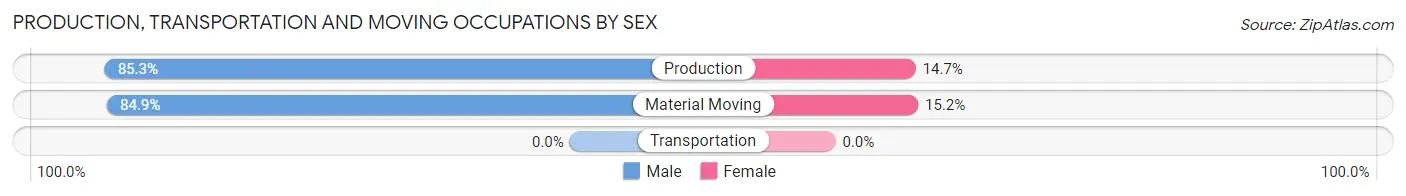
| Occupation | Male | Female |
| Production | 29 (85.3%) | 5 (14.7%) |
| Transportation | 0 (0.0%) | 0 (0.0%) |
| Material Moving | 28 (84.9%) | 5 (15.1%) |
| Total (Category) | 57 (85.1%) | 10 (14.9%) |
| Total (Overall) | 269 (64.0%) | 151 (35.9%) |
Employment Industries by Sex in Clarksburg
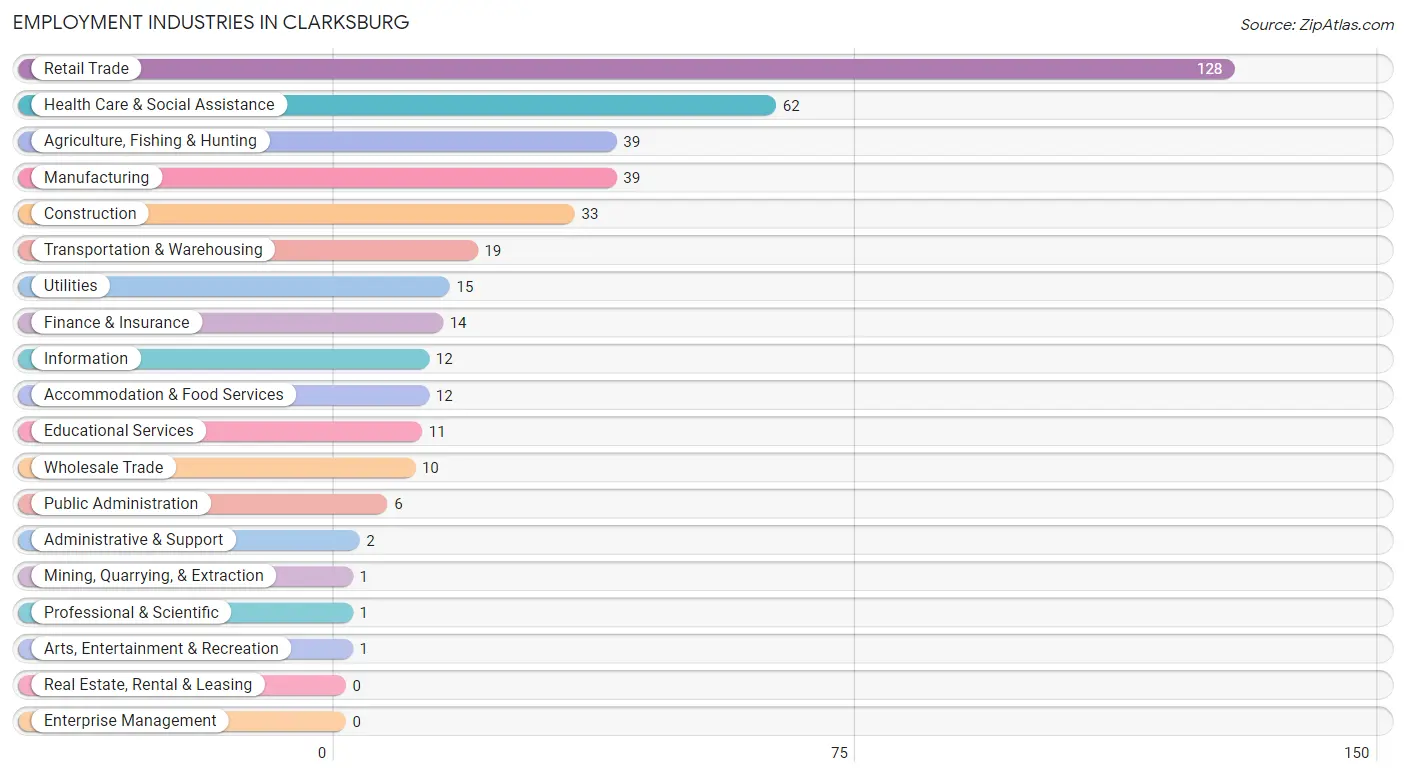
Employment Industries in Clarksburg
The major employment industries in Clarksburg include Retail Trade (128 | 30.5%), Health Care & Social Assistance (62 | 14.8%), Agriculture, Fishing & Hunting (39 | 9.3%), Manufacturing (39 | 9.3%), and Construction (33 | 7.9%).
Employment Industries by Sex in Clarksburg
The Clarksburg industries that see more men than women are Mining, Quarrying, & Extraction (100.0%), Construction (100.0%), and Information (100.0%), whereas the industries that tend to have a higher number of women are Transportation & Warehousing (100.0%), Professional & Scientific (100.0%), and Public Administration (100.0%).
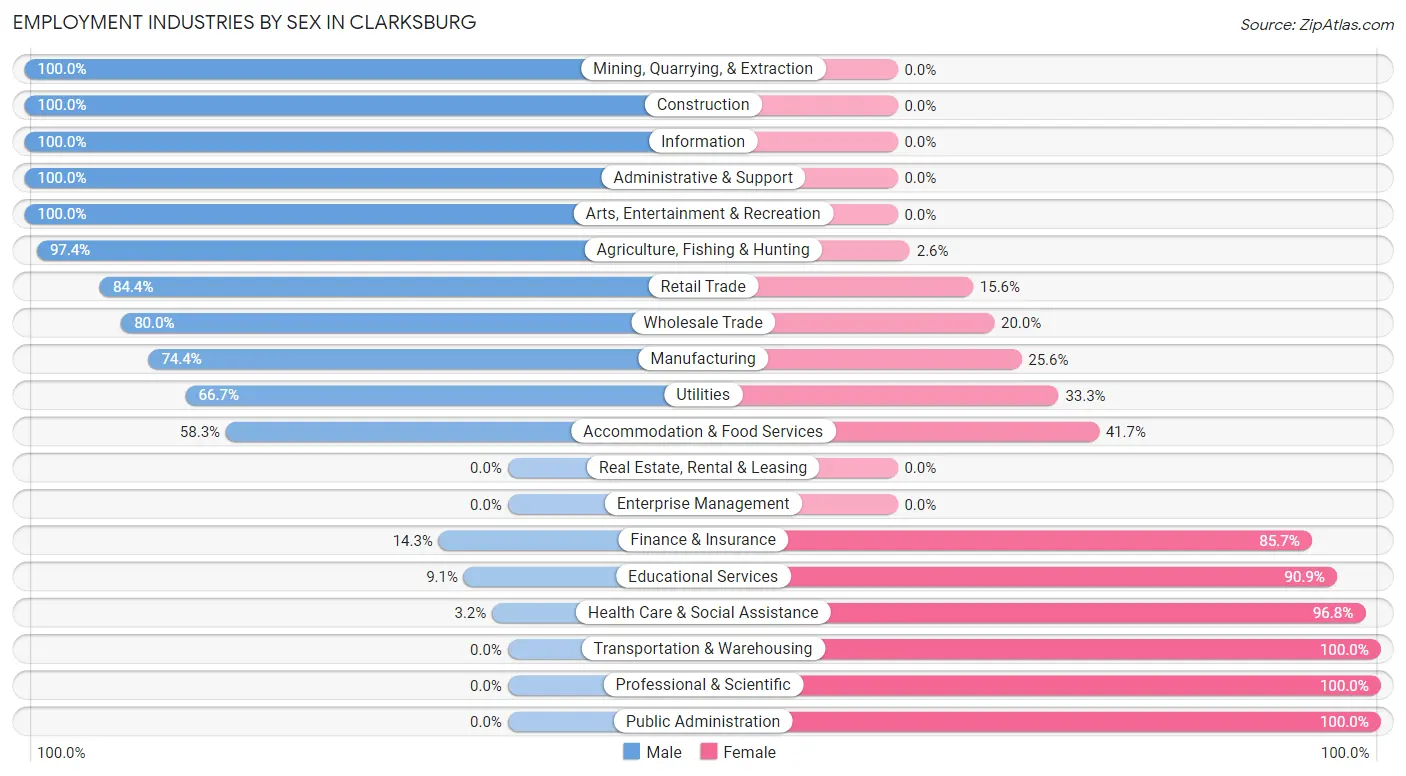
| Industry | Male | Female |
| Agriculture, Fishing & Hunting | 38 (97.4%) | 1 (2.6%) |
| Mining, Quarrying, & Extraction | 1 (100.0%) | 0 (0.0%) |
| Construction | 33 (100.0%) | 0 (0.0%) |
| Manufacturing | 29 (74.4%) | 10 (25.6%) |
| Wholesale Trade | 8 (80.0%) | 2 (20.0%) |
| Retail Trade | 108 (84.4%) | 20 (15.6%) |
| Transportation & Warehousing | 0 (0.0%) | 19 (100.0%) |
| Utilities | 10 (66.7%) | 5 (33.3%) |
| Information | 12 (100.0%) | 0 (0.0%) |
| Finance & Insurance | 2 (14.3%) | 12 (85.7%) |
| Real Estate, Rental & Leasing | 0 (0.0%) | 0 (0.0%) |
| Professional & Scientific | 0 (0.0%) | 1 (100.0%) |
| Enterprise Management | 0 (0.0%) | 0 (0.0%) |
| Administrative & Support | 2 (100.0%) | 0 (0.0%) |
| Educational Services | 1 (9.1%) | 10 (90.9%) |
| Health Care & Social Assistance | 2 (3.2%) | 60 (96.8%) |
| Arts, Entertainment & Recreation | 1 (100.0%) | 0 (0.0%) |
| Accommodation & Food Services | 7 (58.3%) | 5 (41.7%) |
| Public Administration | 0 (0.0%) | 6 (100.0%) |
| Total | 269 (64.0%) | 151 (35.9%) |
Education in Clarksburg
School Enrollment in Clarksburg
The most common levels of schooling among the 225 students in Clarksburg are elementary school (79 | 35.1%), college / undergraduate (46 | 20.4%), and high school (29 | 12.9%).
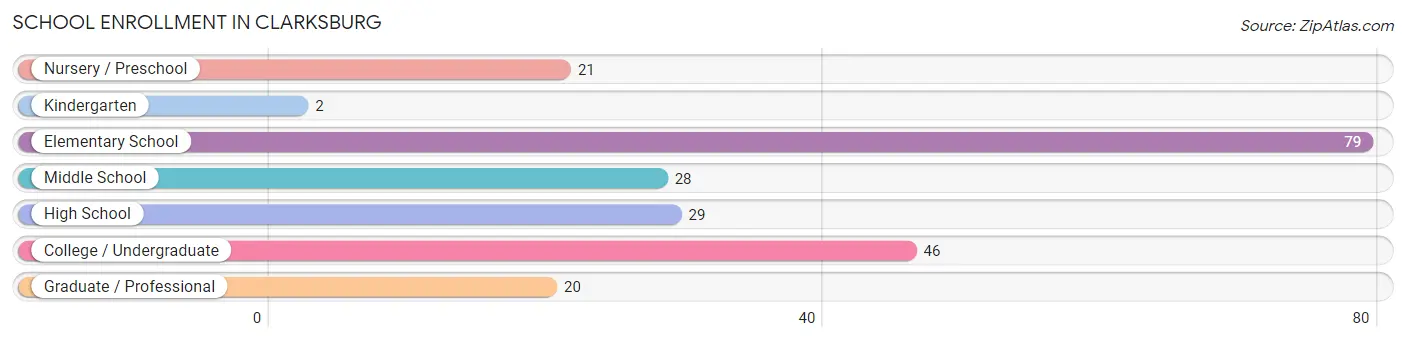
| School Level | # Students | % Students |
| Nursery / Preschool | 21 | 9.3% |
| Kindergarten | 2 | 0.9% |
| Elementary School | 79 | 35.1% |
| Middle School | 28 | 12.4% |
| High School | 29 | 12.9% |
| College / Undergraduate | 46 | 20.4% |
| Graduate / Professional | 20 | 8.9% |
| Total | 225 | 100.0% |
School Enrollment by Age by Funding Source in Clarksburg
Out of a total of 225 students who are enrolled in schools in Clarksburg, 52 (23.1%) attend a private institution, while the remaining 173 (76.9%) are enrolled in public schools. The age group of 20 to 24 year olds has the highest likelihood of being enrolled in private schools, with 20 (80.0% in the age bracket) enrolled. Conversely, the age group of 5 to 9 year old has the lowest likelihood of being enrolled in a private school, with 93 (100.0% in the age bracket) attending a public institution.
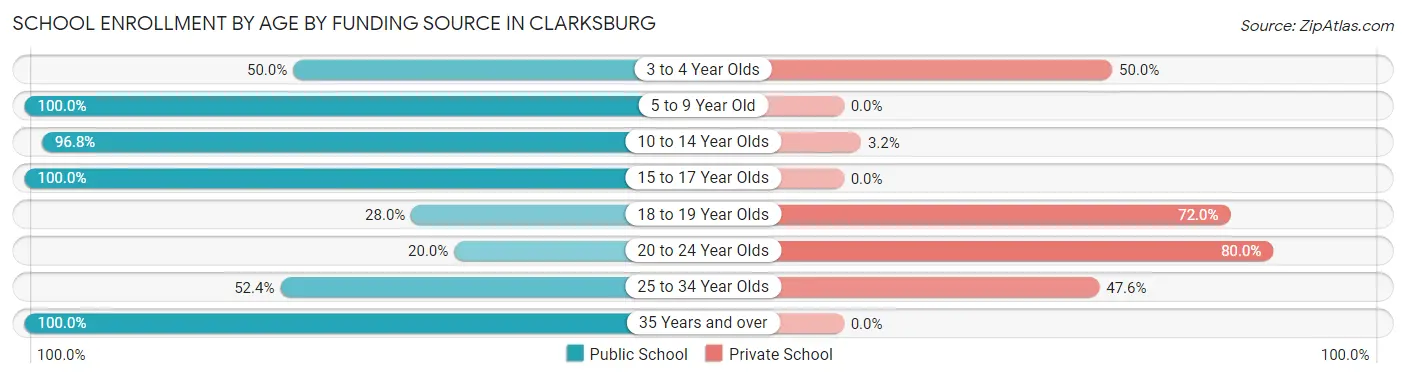
| Age Bracket | Public School | Private School |
| 3 to 4 Year Olds | 3 (50.0%) | 3 (50.0%) |
| 5 to 9 Year Old | 93 (100.0%) | 0 (0.0%) |
| 10 to 14 Year Olds | 30 (96.8%) | 1 (3.2%) |
| 15 to 17 Year Olds | 21 (100.0%) | 0 (0.0%) |
| 18 to 19 Year Olds | 7 (28.0%) | 18 (72.0%) |
| 20 to 24 Year Olds | 5 (20.0%) | 20 (80.0%) |
| 25 to 34 Year Olds | 11 (52.4%) | 10 (47.6%) |
| 35 Years and over | 3 (100.0%) | 0 (0.0%) |
| Total | 173 (76.9%) | 52 (23.1%) |
Educational Attainment by Field of Study in Clarksburg
Business (42 | 36.5%), education (30 | 26.1%), science & technology (25 | 21.7%), liberal arts & history (7 | 6.1%), and bio, nature & agricultural (3 | 2.6%) are the most common fields of study among 115 individuals in Clarksburg who have obtained a bachelor's degree or higher.
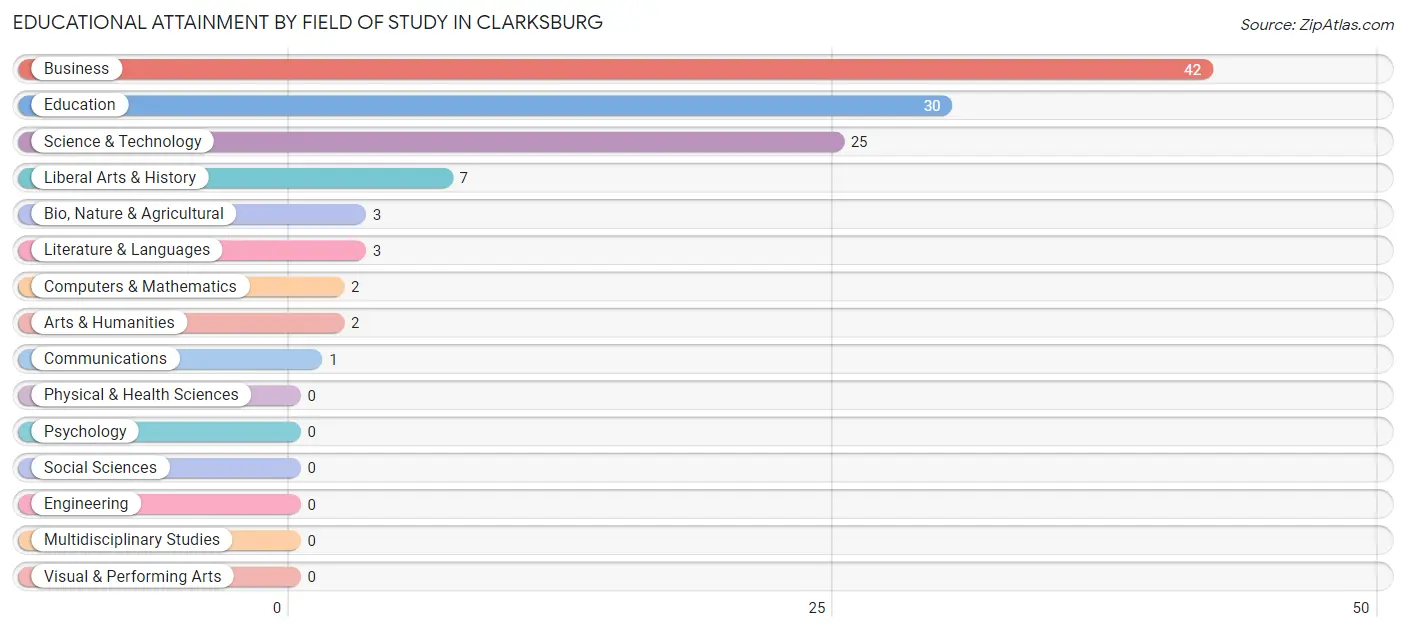
| Field of Study | # Graduates | % Graduates |
| Computers & Mathematics | 2 | 1.7% |
| Bio, Nature & Agricultural | 3 | 2.6% |
| Physical & Health Sciences | 0 | 0.0% |
| Psychology | 0 | 0.0% |
| Social Sciences | 0 | 0.0% |
| Engineering | 0 | 0.0% |
| Multidisciplinary Studies | 0 | 0.0% |
| Science & Technology | 25 | 21.7% |
| Business | 42 | 36.5% |
| Education | 30 | 26.1% |
| Literature & Languages | 3 | 2.6% |
| Liberal Arts & History | 7 | 6.1% |
| Visual & Performing Arts | 0 | 0.0% |
| Communications | 1 | 0.9% |
| Arts & Humanities | 2 | 1.7% |
| Total | 115 | 100.0% |
Transportation & Commute in Clarksburg
Vehicle Availability by Sex in Clarksburg
The most prevalent vehicle ownership categories in Clarksburg are males with 4 vehicles (105, accounting for 42.7%) and females with 4 vehicles (19, making up 70.5%).
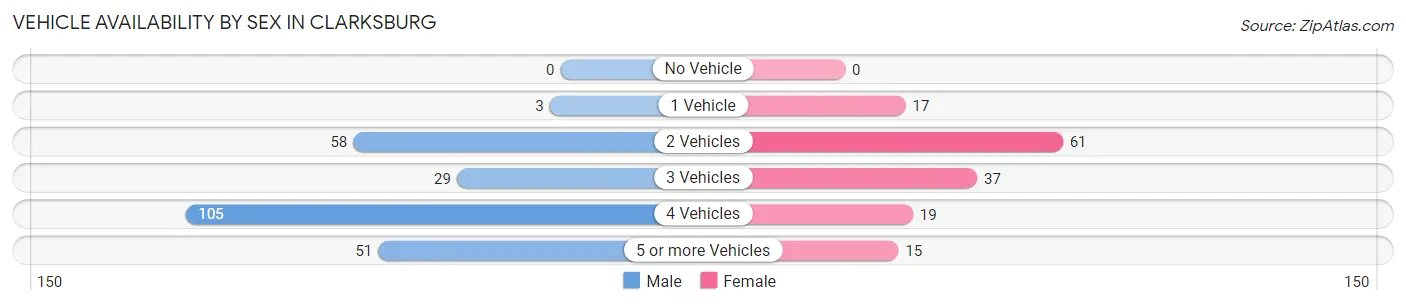
| Vehicles Available | Male | Female |
| No Vehicle | 0 (0.0%) | 0 (0.0%) |
| 1 Vehicle | 3 (1.2%) | 17 (11.4%) |
| 2 Vehicles | 58 (23.6%) | 61 (40.9%) |
| 3 Vehicles | 29 (11.8%) | 37 (24.8%) |
| 4 Vehicles | 105 (42.7%) | 19 (12.8%) |
| 5 or more Vehicles | 51 (20.7%) | 15 (10.1%) |
| Total | 246 (100.0%) | 149 (100.0%) |
Commute Time in Clarksburg
The most frequently occuring commute durations in Clarksburg are 15 to 19 minutes (128 commuters, 33.4%), 30 to 34 minutes (74 commuters, 19.3%), and 20 to 24 minutes (49 commuters, 12.8%).
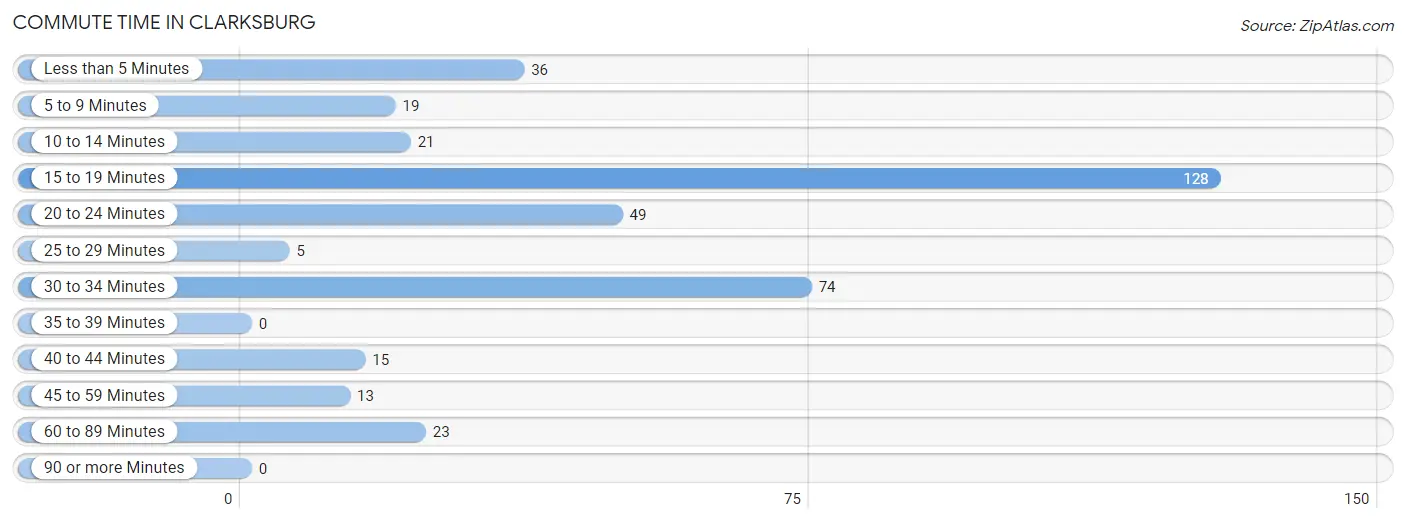
| Commute Time | # Commuters | % Commuters |
| Less than 5 Minutes | 36 | 9.4% |
| 5 to 9 Minutes | 19 | 5.0% |
| 10 to 14 Minutes | 21 | 5.5% |
| 15 to 19 Minutes | 128 | 33.4% |
| 20 to 24 Minutes | 49 | 12.8% |
| 25 to 29 Minutes | 5 | 1.3% |
| 30 to 34 Minutes | 74 | 19.3% |
| 35 to 39 Minutes | 0 | 0.0% |
| 40 to 44 Minutes | 15 | 3.9% |
| 45 to 59 Minutes | 13 | 3.4% |
| 60 to 89 Minutes | 23 | 6.0% |
| 90 or more Minutes | 0 | 0.0% |
Commute Time by Sex in Clarksburg
The most common commute times in Clarksburg are 15 to 19 minutes (106 commuters, 43.4%) for males and less than 5 minutes (24 commuters, 17.3%) for females.
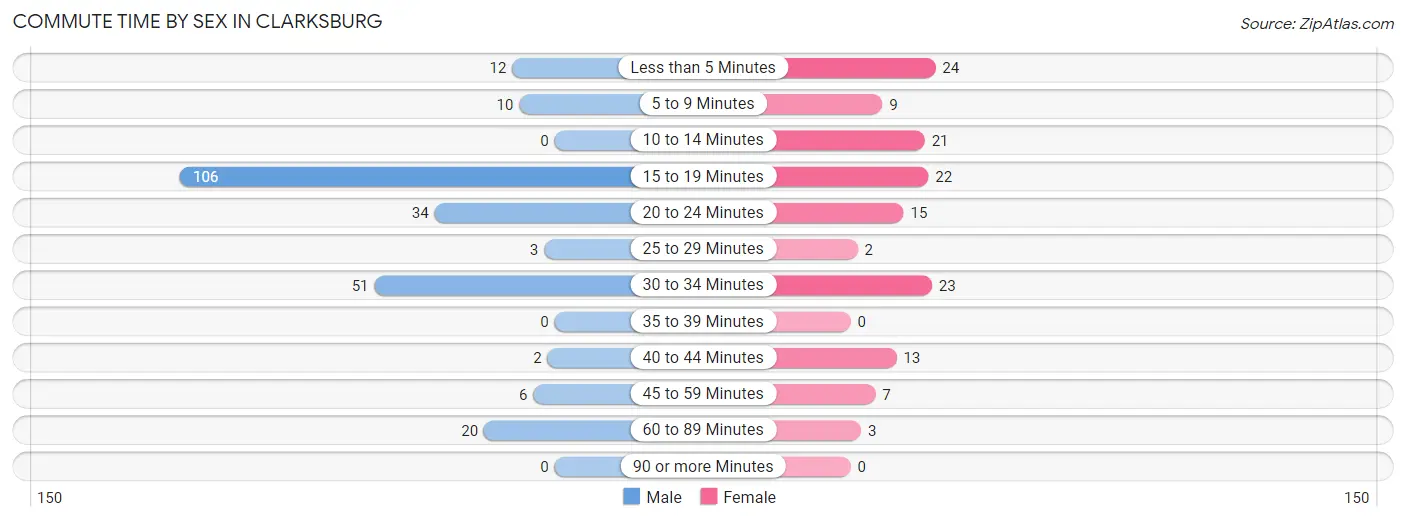
| Commute Time | Male | Female |
| Less than 5 Minutes | 12 (4.9%) | 24 (17.3%) |
| 5 to 9 Minutes | 10 (4.1%) | 9 (6.5%) |
| 10 to 14 Minutes | 0 (0.0%) | 21 (15.1%) |
| 15 to 19 Minutes | 106 (43.4%) | 22 (15.8%) |
| 20 to 24 Minutes | 34 (13.9%) | 15 (10.8%) |
| 25 to 29 Minutes | 3 (1.2%) | 2 (1.4%) |
| 30 to 34 Minutes | 51 (20.9%) | 23 (16.6%) |
| 35 to 39 Minutes | 0 (0.0%) | 0 (0.0%) |
| 40 to 44 Minutes | 2 (0.8%) | 13 (9.3%) |
| 45 to 59 Minutes | 6 (2.5%) | 7 (5.0%) |
| 60 to 89 Minutes | 20 (8.2%) | 3 (2.2%) |
| 90 or more Minutes | 0 (0.0%) | 0 (0.0%) |
Time of Departure to Work by Sex in Clarksburg
The most frequent times of departure to work in Clarksburg are 5:30 AM to 5:59 AM (55, 22.5%) for males and 6:00 AM to 6:29 AM (31, 22.3%) for females.
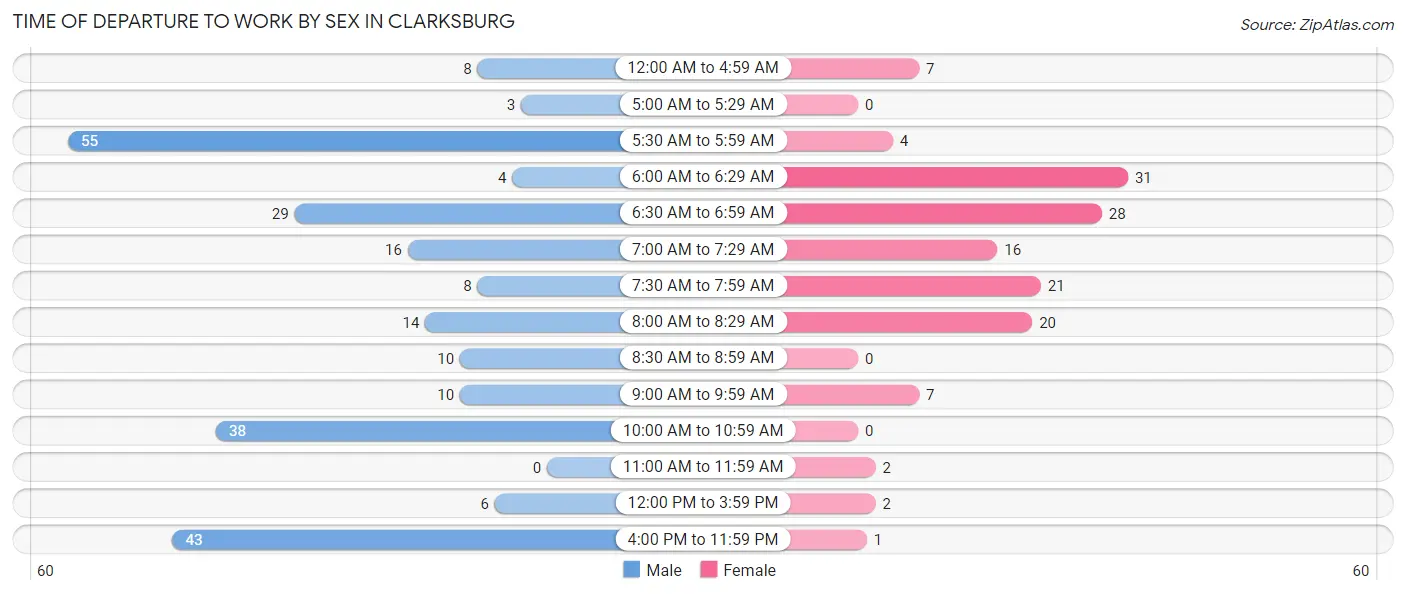
| Time of Departure | Male | Female |
| 12:00 AM to 4:59 AM | 8 (3.3%) | 7 (5.0%) |
| 5:00 AM to 5:29 AM | 3 (1.2%) | 0 (0.0%) |
| 5:30 AM to 5:59 AM | 55 (22.5%) | 4 (2.9%) |
| 6:00 AM to 6:29 AM | 4 (1.6%) | 31 (22.3%) |
| 6:30 AM to 6:59 AM | 29 (11.9%) | 28 (20.1%) |
| 7:00 AM to 7:29 AM | 16 (6.6%) | 16 (11.5%) |
| 7:30 AM to 7:59 AM | 8 (3.3%) | 21 (15.1%) |
| 8:00 AM to 8:29 AM | 14 (5.7%) | 20 (14.4%) |
| 8:30 AM to 8:59 AM | 10 (4.1%) | 0 (0.0%) |
| 9:00 AM to 9:59 AM | 10 (4.1%) | 7 (5.0%) |
| 10:00 AM to 10:59 AM | 38 (15.6%) | 0 (0.0%) |
| 11:00 AM to 11:59 AM | 0 (0.0%) | 2 (1.4%) |
| 12:00 PM to 3:59 PM | 6 (2.5%) | 2 (1.4%) |
| 4:00 PM to 11:59 PM | 43 (17.6%) | 1 (0.7%) |
| Total | 244 (100.0%) | 139 (100.0%) |
Housing Occupancy in Clarksburg
Occupancy by Ownership in Clarksburg
Of the total 247 dwellings in Clarksburg, owner-occupied units account for 201 (81.4%), while renter-occupied units make up 46 (18.6%).
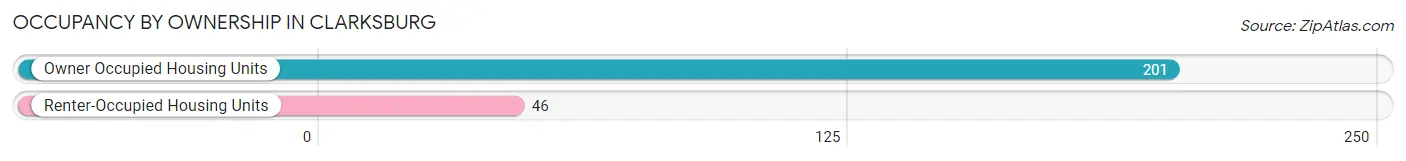
| Occupancy | # Housing Units | % Housing Units |
| Owner Occupied Housing Units | 201 | 81.4% |
| Renter-Occupied Housing Units | 46 | 18.6% |
| Total Occupied Housing Units | 247 | 100.0% |
Occupancy by Household Size in Clarksburg
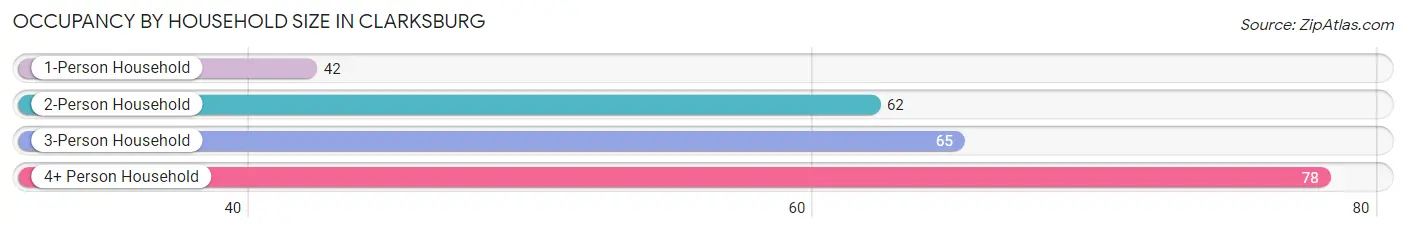
| Household Size | # Housing Units | % Housing Units |
| 1-Person Household | 42 | 17.0% |
| 2-Person Household | 62 | 25.1% |
| 3-Person Household | 65 | 26.3% |
| 4+ Person Household | 78 | 31.6% |
| Total Housing Units | 247 | 100.0% |
Occupancy by Ownership by Household Size in Clarksburg
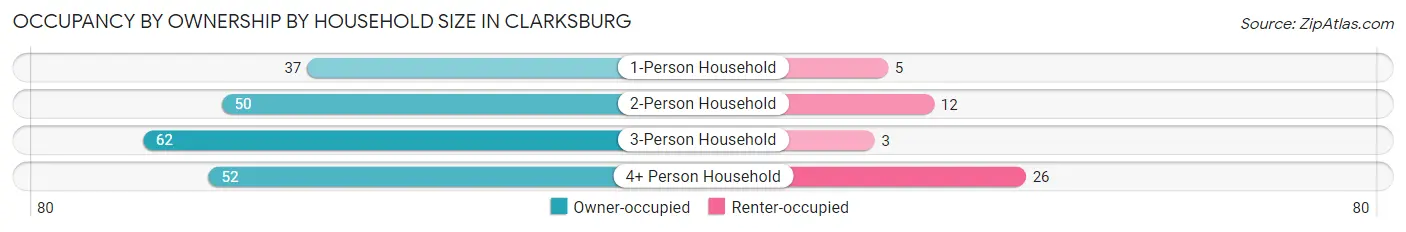
| Household Size | Owner-occupied | Renter-occupied |
| 1-Person Household | 37 (88.1%) | 5 (11.9%) |
| 2-Person Household | 50 (80.6%) | 12 (19.4%) |
| 3-Person Household | 62 (95.4%) | 3 (4.6%) |
| 4+ Person Household | 52 (66.7%) | 26 (33.3%) |
| Total Housing Units | 201 (81.4%) | 46 (18.6%) |
Occupancy by Educational Attainment in Clarksburg
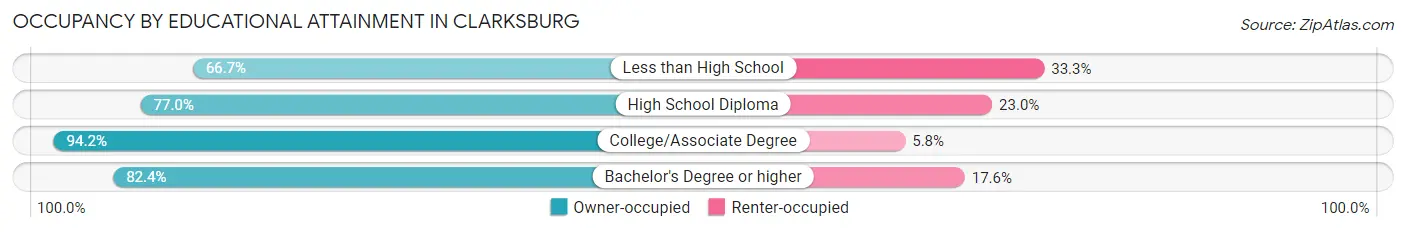
| Household Size | Owner-occupied | Renter-occupied |
| Less than High School | 14 (66.7%) | 7 (33.3%) |
| High School Diploma | 77 (77.0%) | 23 (23.0%) |
| College/Associate Degree | 49 (94.2%) | 3 (5.8%) |
| Bachelor's Degree or higher | 61 (82.4%) | 13 (17.6%) |
Occupancy by Age of Householder in Clarksburg
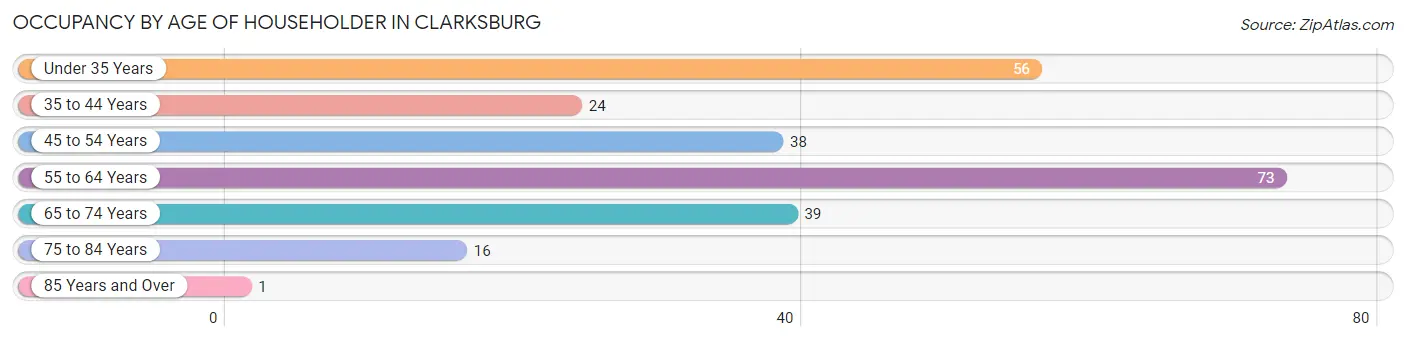
| Age Bracket | # Households | % Households |
| Under 35 Years | 56 | 22.7% |
| 35 to 44 Years | 24 | 9.7% |
| 45 to 54 Years | 38 | 15.4% |
| 55 to 64 Years | 73 | 29.5% |
| 65 to 74 Years | 39 | 15.8% |
| 75 to 84 Years | 16 | 6.5% |
| 85 Years and Over | 1 | 0.4% |
| Total | 247 | 100.0% |
Housing Finances in Clarksburg
Median Income by Occupancy in Clarksburg
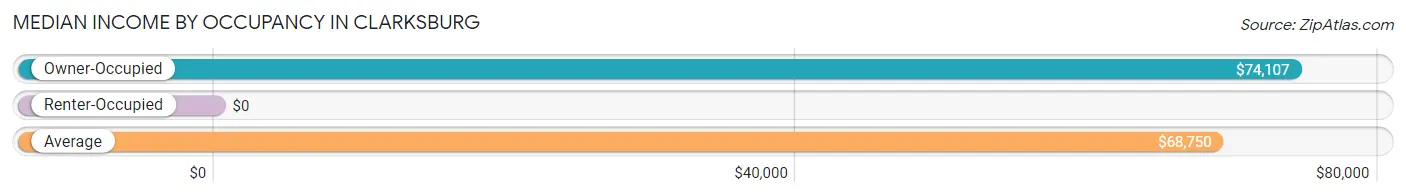
| Occupancy Type | # Households | Median Income |
| Owner-Occupied | 201 (81.4%) | $74,107 |
| Renter-Occupied | 46 (18.6%) | $0 |
| Average | 247 (100.0%) | $68,750 |
Occupancy by Householder Income Bracket in Clarksburg
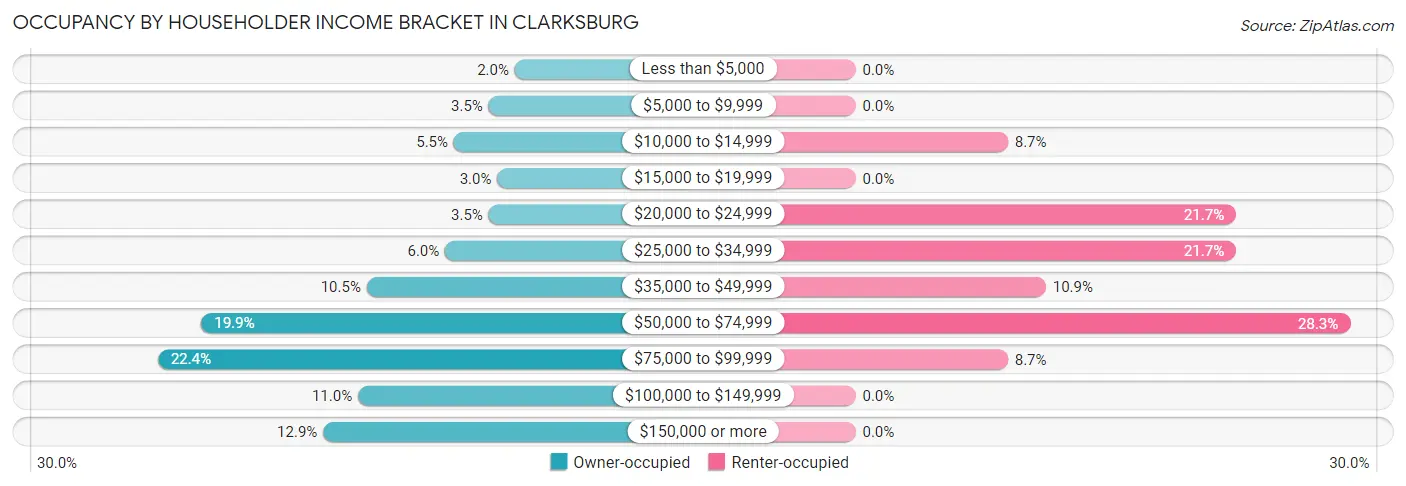
| Income Bracket | Owner-occupied | Renter-occupied |
| Less than $5,000 | 4 (2.0%) | 0 (0.0%) |
| $5,000 to $9,999 | 7 (3.5%) | 0 (0.0%) |
| $10,000 to $14,999 | 11 (5.5%) | 4 (8.7%) |
| $15,000 to $19,999 | 6 (3.0%) | 0 (0.0%) |
| $20,000 to $24,999 | 7 (3.5%) | 10 (21.7%) |
| $25,000 to $34,999 | 12 (6.0%) | 10 (21.7%) |
| $35,000 to $49,999 | 21 (10.4%) | 5 (10.9%) |
| $50,000 to $74,999 | 40 (19.9%) | 13 (28.3%) |
| $75,000 to $99,999 | 45 (22.4%) | 4 (8.7%) |
| $100,000 to $149,999 | 22 (11.0%) | 0 (0.0%) |
| $150,000 or more | 26 (12.9%) | 0 (0.0%) |
| Total | 201 (100.0%) | 46 (100.0%) |
Monthly Housing Cost Tiers in Clarksburg
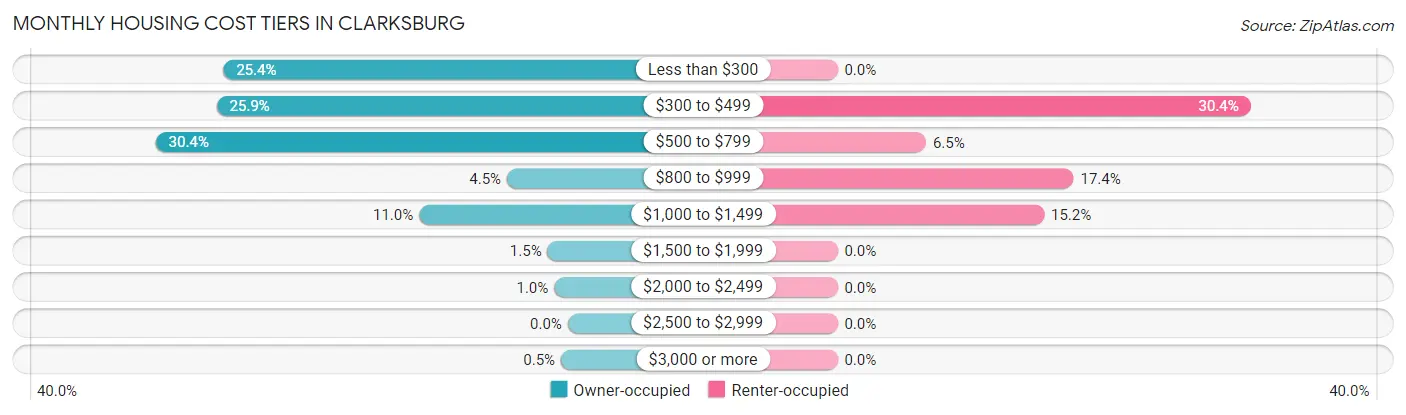
| Monthly Cost | Owner-occupied | Renter-occupied |
| Less than $300 | 51 (25.4%) | 0 (0.0%) |
| $300 to $499 | 52 (25.9%) | 14 (30.4%) |
| $500 to $799 | 61 (30.3%) | 3 (6.5%) |
| $800 to $999 | 9 (4.5%) | 8 (17.4%) |
| $1,000 to $1,499 | 22 (11.0%) | 7 (15.2%) |
| $1,500 to $1,999 | 3 (1.5%) | 0 (0.0%) |
| $2,000 to $2,499 | 2 (1.0%) | 0 (0.0%) |
| $2,500 to $2,999 | 0 (0.0%) | 0 (0.0%) |
| $3,000 or more | 1 (0.5%) | 0 (0.0%) |
| Total | 201 (100.0%) | 46 (100.0%) |
Physical Housing Characteristics in Clarksburg
Housing Structures in Clarksburg
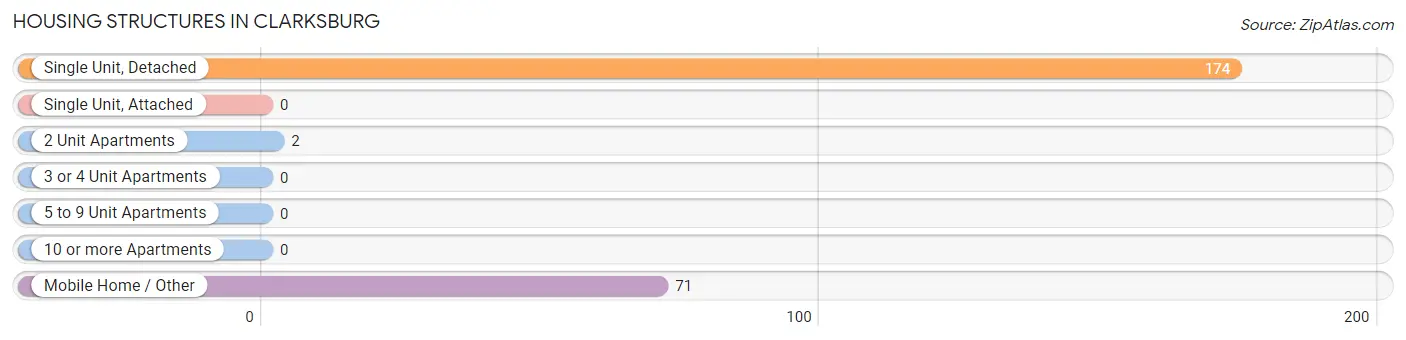
| Structure Type | # Housing Units | % Housing Units |
| Single Unit, Detached | 174 | 70.5% |
| Single Unit, Attached | 0 | 0.0% |
| 2 Unit Apartments | 2 | 0.8% |
| 3 or 4 Unit Apartments | 0 | 0.0% |
| 5 to 9 Unit Apartments | 0 | 0.0% |
| 10 or more Apartments | 0 | 0.0% |
| Mobile Home / Other | 71 | 28.7% |
| Total | 247 | 100.0% |
Housing Structures by Occupancy in Clarksburg
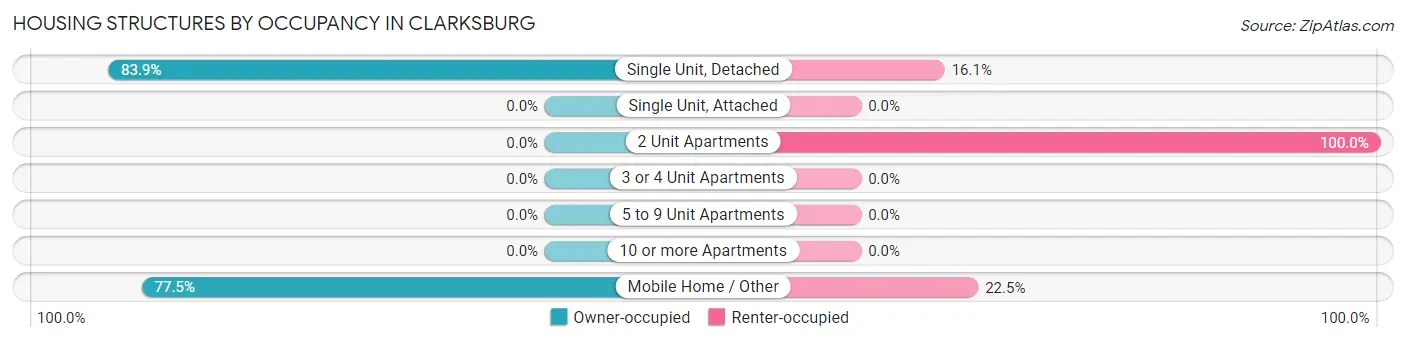
| Structure Type | Owner-occupied | Renter-occupied |
| Single Unit, Detached | 146 (83.9%) | 28 (16.1%) |
| Single Unit, Attached | 0 (0.0%) | 0 (0.0%) |
| 2 Unit Apartments | 0 (0.0%) | 2 (100.0%) |
| 3 or 4 Unit Apartments | 0 (0.0%) | 0 (0.0%) |
| 5 to 9 Unit Apartments | 0 (0.0%) | 0 (0.0%) |
| 10 or more Apartments | 0 (0.0%) | 0 (0.0%) |
| Mobile Home / Other | 55 (77.5%) | 16 (22.5%) |
| Total | 201 (81.4%) | 46 (18.6%) |
Housing Structures by Number of Rooms in Clarksburg
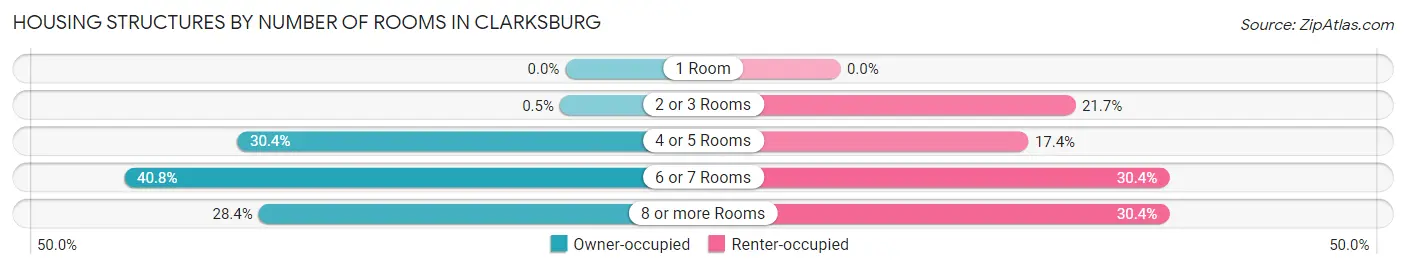
| Number of Rooms | Owner-occupied | Renter-occupied |
| 1 Room | 0 (0.0%) | 0 (0.0%) |
| 2 or 3 Rooms | 1 (0.5%) | 10 (21.7%) |
| 4 or 5 Rooms | 61 (30.3%) | 8 (17.4%) |
| 6 or 7 Rooms | 82 (40.8%) | 14 (30.4%) |
| 8 or more Rooms | 57 (28.4%) | 14 (30.4%) |
| Total | 201 (100.0%) | 46 (100.0%) |
Housing Structure by Heating Type in Clarksburg
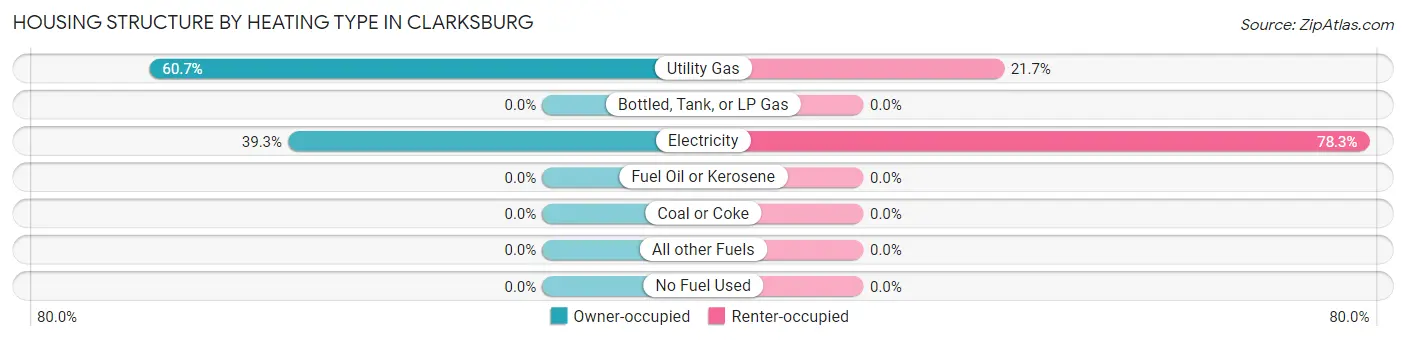
| Heating Type | Owner-occupied | Renter-occupied |
| Utility Gas | 122 (60.7%) | 10 (21.7%) |
| Bottled, Tank, or LP Gas | 0 (0.0%) | 0 (0.0%) |
| Electricity | 79 (39.3%) | 36 (78.3%) |
| Fuel Oil or Kerosene | 0 (0.0%) | 0 (0.0%) |
| Coal or Coke | 0 (0.0%) | 0 (0.0%) |
| All other Fuels | 0 (0.0%) | 0 (0.0%) |
| No Fuel Used | 0 (0.0%) | 0 (0.0%) |
| Total | 201 (100.0%) | 46 (100.0%) |
Household Vehicle Usage in Clarksburg
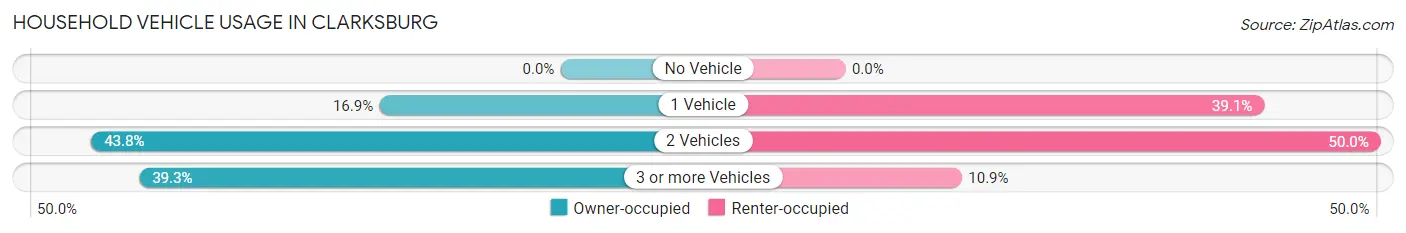
| Vehicles per Household | Owner-occupied | Renter-occupied |
| No Vehicle | 0 (0.0%) | 0 (0.0%) |
| 1 Vehicle | 34 (16.9%) | 18 (39.1%) |
| 2 Vehicles | 88 (43.8%) | 23 (50.0%) |
| 3 or more Vehicles | 79 (39.3%) | 5 (10.9%) |
| Total | 201 (100.0%) | 46 (100.0%) |
Real Estate & Mortgages in Clarksburg
Real Estate and Mortgage Overview in Clarksburg
| Characteristic | Without Mortgage | With Mortgage |
| Housing Units | 131 | 70 |
| Median Property Value | - | - |
| Median Household Income | $73,988 | $5 |
| Monthly Housing Costs | $368 | $1 |
| Real Estate Taxes | $767 | $11 |
Property Value by Mortgage Status in Clarksburg
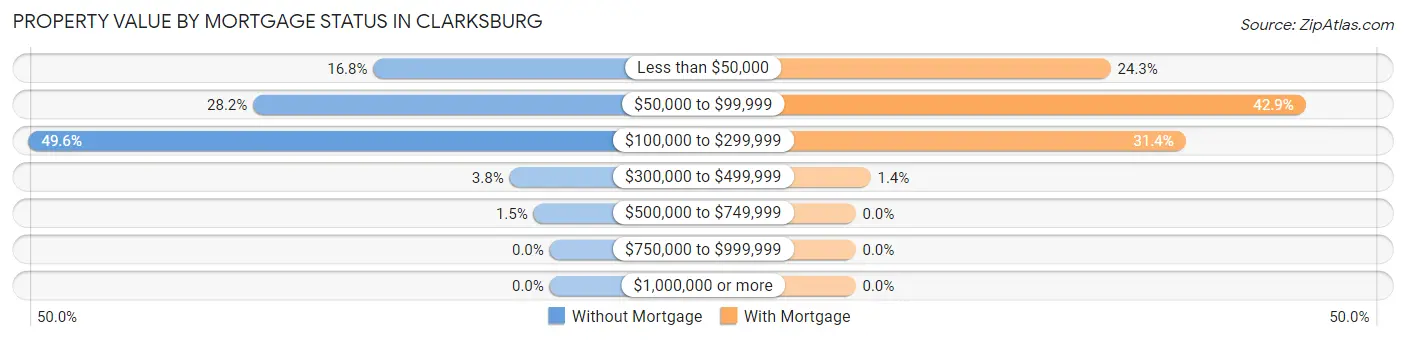
| Property Value | Without Mortgage | With Mortgage |
| Less than $50,000 | 22 (16.8%) | 17 (24.3%) |
| $50,000 to $99,999 | 37 (28.2%) | 30 (42.9%) |
| $100,000 to $299,999 | 65 (49.6%) | 22 (31.4%) |
| $300,000 to $499,999 | 5 (3.8%) | 1 (1.4%) |
| $500,000 to $749,999 | 2 (1.5%) | 0 (0.0%) |
| $750,000 to $999,999 | 0 (0.0%) | 0 (0.0%) |
| $1,000,000 or more | 0 (0.0%) | 0 (0.0%) |
| Total | 131 (100.0%) | 70 (100.0%) |
Household Income by Mortgage Status in Clarksburg
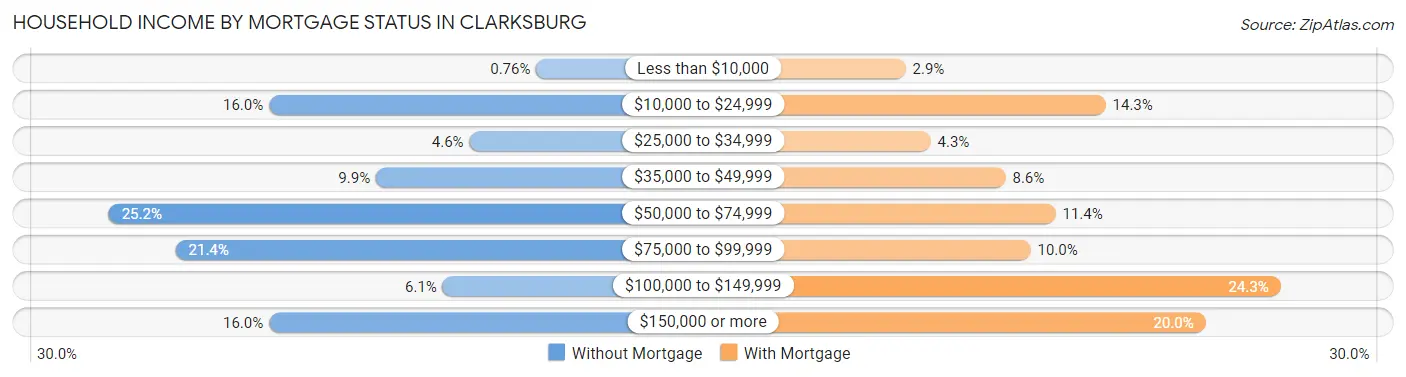
| Household Income | Without Mortgage | With Mortgage |
| Less than $10,000 | 1 (0.8%) | 2 (2.9%) |
| $10,000 to $24,999 | 21 (16.0%) | 10 (14.3%) |
| $25,000 to $34,999 | 6 (4.6%) | 3 (4.3%) |
| $35,000 to $49,999 | 13 (9.9%) | 6 (8.6%) |
| $50,000 to $74,999 | 33 (25.2%) | 8 (11.4%) |
| $75,000 to $99,999 | 28 (21.4%) | 7 (10.0%) |
| $100,000 to $149,999 | 8 (6.1%) | 17 (24.3%) |
| $150,000 or more | 21 (16.0%) | 14 (20.0%) |
| Total | 131 (100.0%) | 70 (100.0%) |
Property Value to Household Income Ratio in Clarksburg
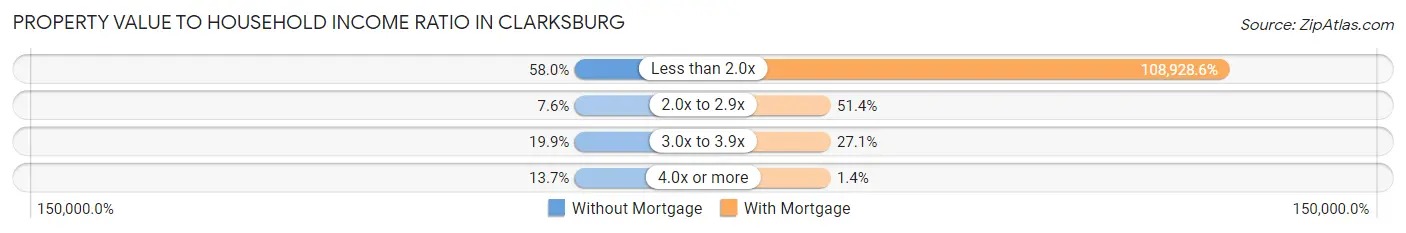
| Value-to-Income Ratio | Without Mortgage | With Mortgage |
| Less than 2.0x | 76 (58.0%) | 76,250 (108,928.6%) |
| 2.0x to 2.9x | 10 (7.6%) | 36 (51.4%) |
| 3.0x to 3.9x | 26 (19.9%) | 19 (27.1%) |
| 4.0x or more | 18 (13.7%) | 1 (1.4%) |
| Total | 131 (100.0%) | 70 (100.0%) |
Real Estate Taxes by Mortgage Status in Clarksburg
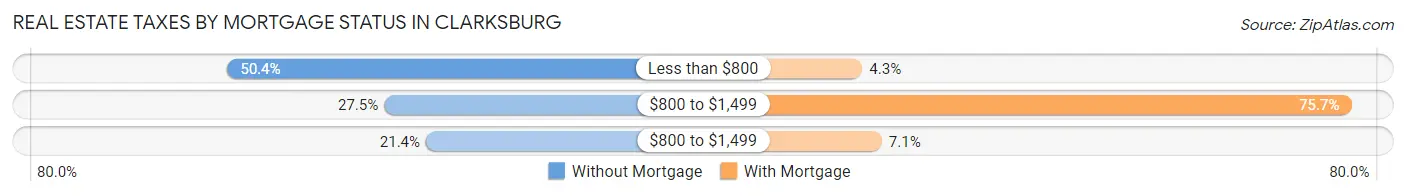
| Property Taxes | Without Mortgage | With Mortgage |
| Less than $800 | 66 (50.4%) | 3 (4.3%) |
| $800 to $1,499 | 36 (27.5%) | 53 (75.7%) |
| $800 to $1,499 | 28 (21.4%) | 5 (7.1%) |
| Total | 131 (100.0%) | 70 (100.0%) |
Health & Disability in Clarksburg
Health Insurance Coverage by Age in Clarksburg
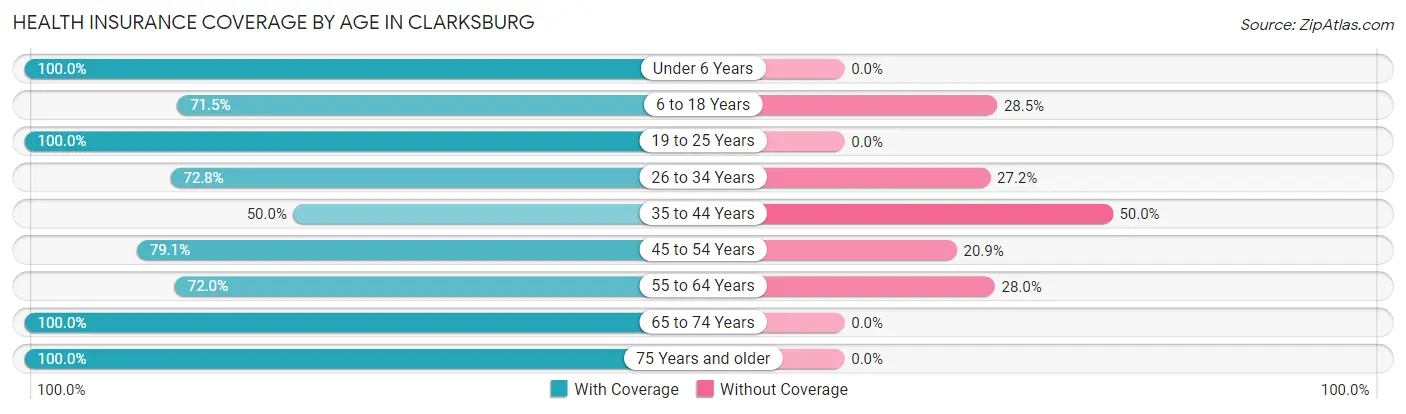
| Age Bracket | With Coverage | Without Coverage |
| Under 6 Years | 38 (100.0%) | 0 (0.0%) |
| 6 to 18 Years | 98 (71.5%) | 39 (28.5%) |
| 19 to 25 Years | 127 (100.0%) | 0 (0.0%) |
| 26 to 34 Years | 166 (72.8%) | 62 (27.2%) |
| 35 to 44 Years | 40 (50.0%) | 40 (50.0%) |
| 45 to 54 Years | 68 (79.1%) | 18 (20.9%) |
| 55 to 64 Years | 131 (72.0%) | 51 (28.0%) |
| 65 to 74 Years | 53 (100.0%) | 0 (0.0%) |
| 75 Years and older | 44 (100.0%) | 0 (0.0%) |
| Total | 765 (78.5%) | 210 (21.5%) |
Health Insurance Coverage by Citizenship Status in Clarksburg
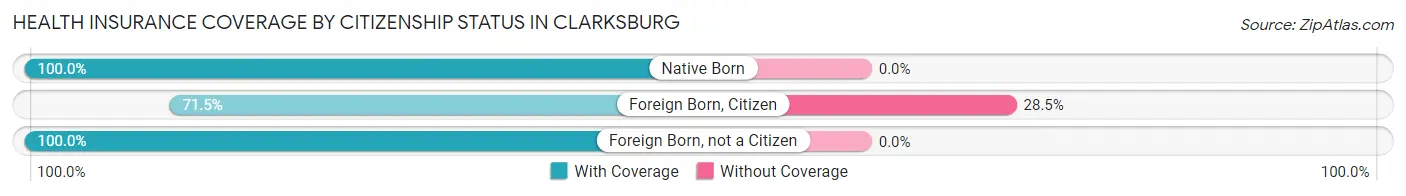
| Citizenship Status | With Coverage | Without Coverage |
| Native Born | 38 (100.0%) | 0 (0.0%) |
| Foreign Born, Citizen | 98 (71.5%) | 39 (28.5%) |
| Foreign Born, not a Citizen | 127 (100.0%) | 0 (0.0%) |
Health Insurance Coverage by Household Income in Clarksburg
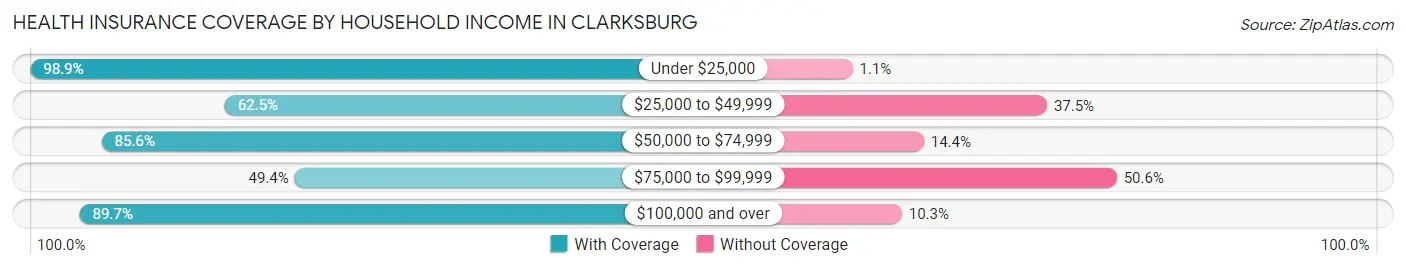
| Household Income | With Coverage | Without Coverage |
| Under $25,000 | 91 (98.9%) | 1 (1.1%) |
| $25,000 to $49,999 | 90 (62.5%) | 54 (37.5%) |
| $50,000 to $74,999 | 166 (85.6%) | 28 (14.4%) |
| $75,000 to $99,999 | 87 (49.4%) | 89 (50.6%) |
| $100,000 and over | 331 (89.7%) | 38 (10.3%) |
Public vs Private Health Insurance Coverage by Age in Clarksburg
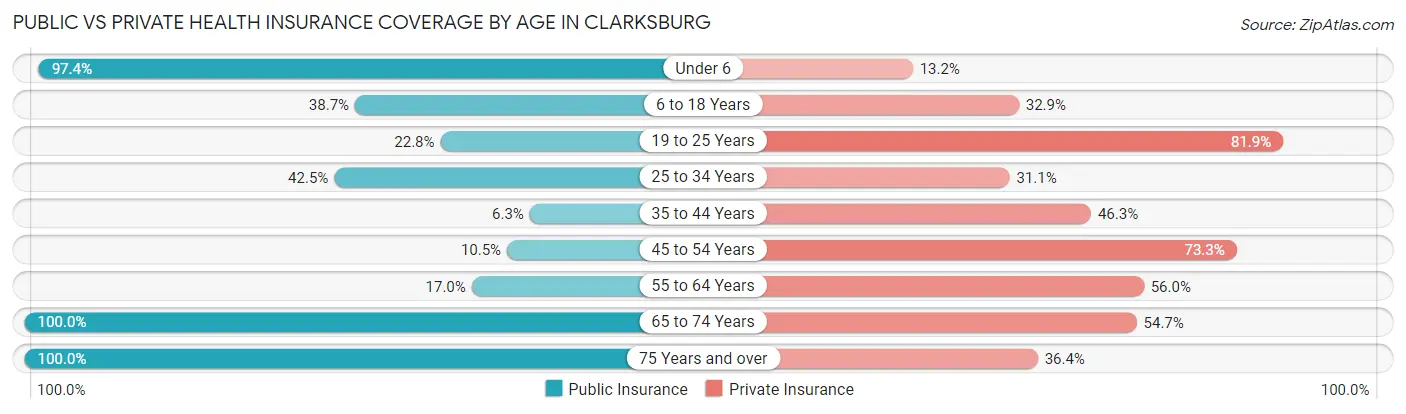
| Age Bracket | Public Insurance | Private Insurance |
| Under 6 | 37 (97.4%) | 5 (13.2%) |
| 6 to 18 Years | 53 (38.7%) | 45 (32.9%) |
| 19 to 25 Years | 29 (22.8%) | 104 (81.9%) |
| 25 to 34 Years | 97 (42.5%) | 71 (31.1%) |
| 35 to 44 Years | 5 (6.2%) | 37 (46.3%) |
| 45 to 54 Years | 9 (10.5%) | 63 (73.3%) |
| 55 to 64 Years | 31 (17.0%) | 102 (56.0%) |
| 65 to 74 Years | 53 (100.0%) | 29 (54.7%) |
| 75 Years and over | 44 (100.0%) | 16 (36.4%) |
| Total | 358 (36.7%) | 472 (48.4%) |
Disability Status by Sex by Age in Clarksburg
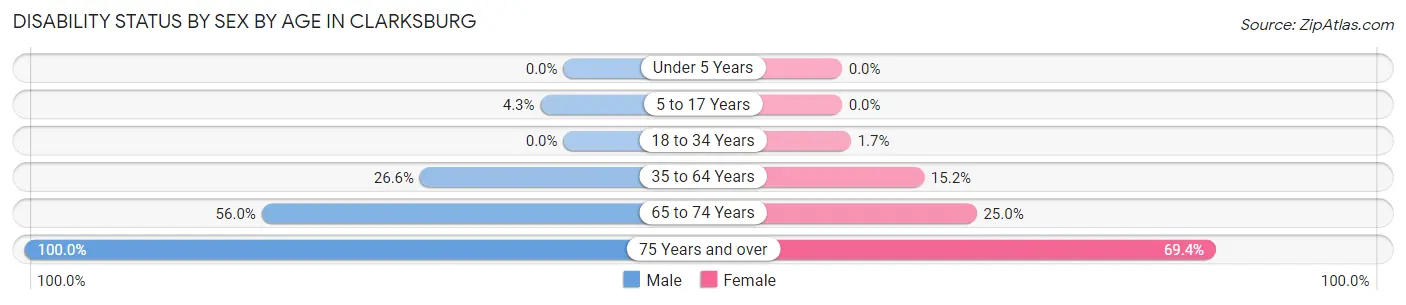
| Age Bracket | Male | Female |
| Under 5 Years | 0 (0.0%) | 0 (0.0%) |
| 5 to 17 Years | 4 (4.3%) | 0 (0.0%) |
| 18 to 34 Years | 0 (0.0%) | 3 (1.7%) |
| 35 to 64 Years | 49 (26.6%) | 25 (15.2%) |
| 65 to 74 Years | 14 (56.0%) | 7 (25.0%) |
| 75 Years and over | 8 (100.0%) | 25 (69.4%) |
Disability Class by Sex by Age in Clarksburg
Disability Class: Hearing Difficulty
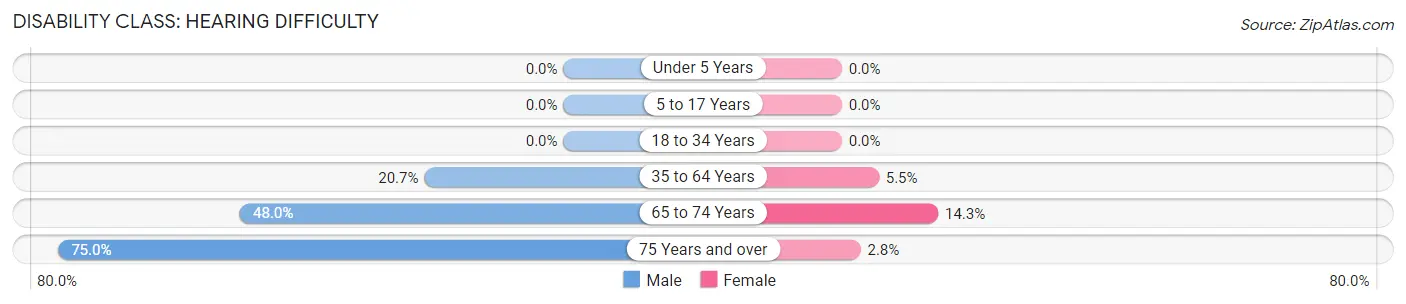
| Age Bracket | Male | Female |
| Under 5 Years | 0 (0.0%) | 0 (0.0%) |
| 5 to 17 Years | 0 (0.0%) | 0 (0.0%) |
| 18 to 34 Years | 0 (0.0%) | 0 (0.0%) |
| 35 to 64 Years | 38 (20.6%) | 9 (5.5%) |
| 65 to 74 Years | 12 (48.0%) | 4 (14.3%) |
| 75 Years and over | 6 (75.0%) | 1 (2.8%) |
Disability Class: Vision Difficulty
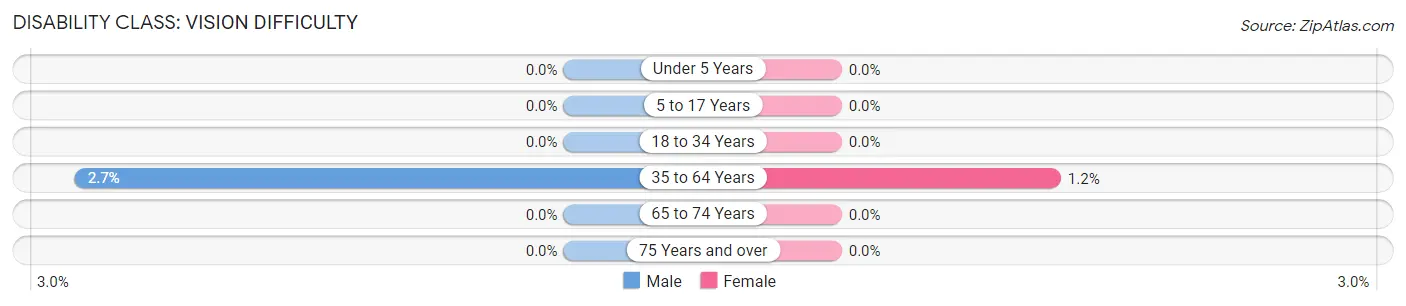
| Age Bracket | Male | Female |
| Under 5 Years | 0 (0.0%) | 0 (0.0%) |
| 5 to 17 Years | 0 (0.0%) | 0 (0.0%) |
| 18 to 34 Years | 0 (0.0%) | 0 (0.0%) |
| 35 to 64 Years | 5 (2.7%) | 2 (1.2%) |
| 65 to 74 Years | 0 (0.0%) | 0 (0.0%) |
| 75 Years and over | 0 (0.0%) | 0 (0.0%) |
Disability Class: Cognitive Difficulty
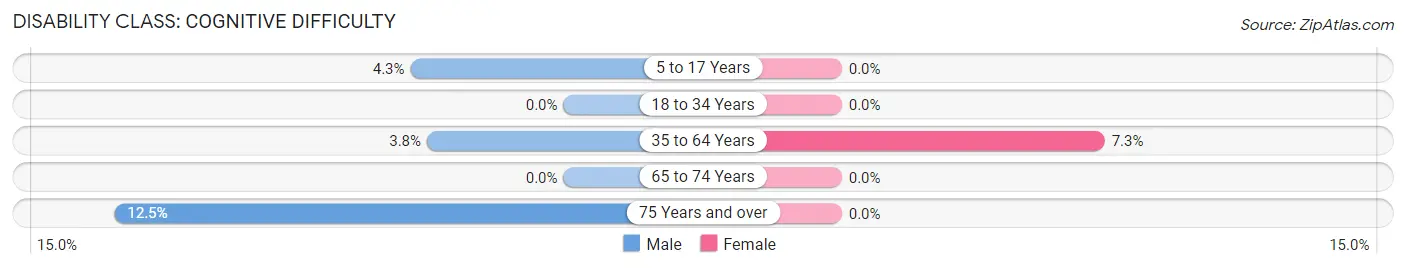
| Age Bracket | Male | Female |
| 5 to 17 Years | 4 (4.3%) | 0 (0.0%) |
| 18 to 34 Years | 0 (0.0%) | 0 (0.0%) |
| 35 to 64 Years | 7 (3.8%) | 12 (7.3%) |
| 65 to 74 Years | 0 (0.0%) | 0 (0.0%) |
| 75 Years and over | 1 (12.5%) | 0 (0.0%) |
Disability Class: Ambulatory Difficulty
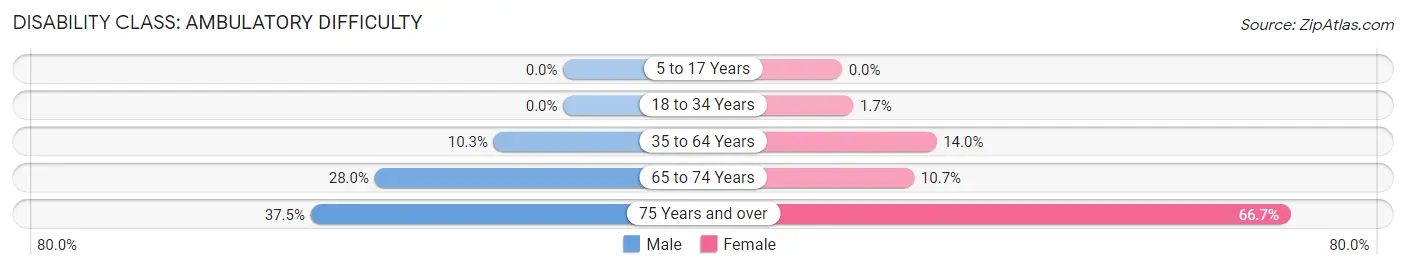
| Age Bracket | Male | Female |
| 5 to 17 Years | 0 (0.0%) | 0 (0.0%) |
| 18 to 34 Years | 0 (0.0%) | 3 (1.7%) |
| 35 to 64 Years | 19 (10.3%) | 23 (14.0%) |
| 65 to 74 Years | 7 (28.0%) | 3 (10.7%) |
| 75 Years and over | 3 (37.5%) | 24 (66.7%) |
Disability Class: Self-Care Difficulty
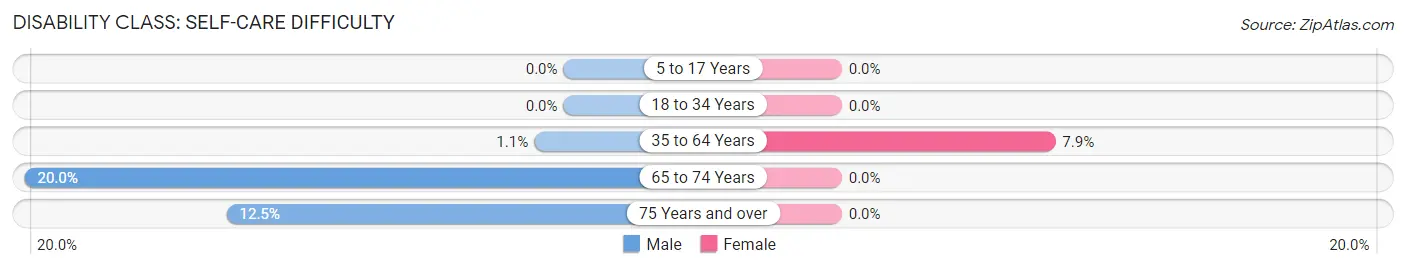
| Age Bracket | Male | Female |
| 5 to 17 Years | 0 (0.0%) | 0 (0.0%) |
| 18 to 34 Years | 0 (0.0%) | 0 (0.0%) |
| 35 to 64 Years | 2 (1.1%) | 13 (7.9%) |
| 65 to 74 Years | 5 (20.0%) | 0 (0.0%) |
| 75 Years and over | 1 (12.5%) | 0 (0.0%) |
Technology Access in Clarksburg
Computing Device Access in Clarksburg
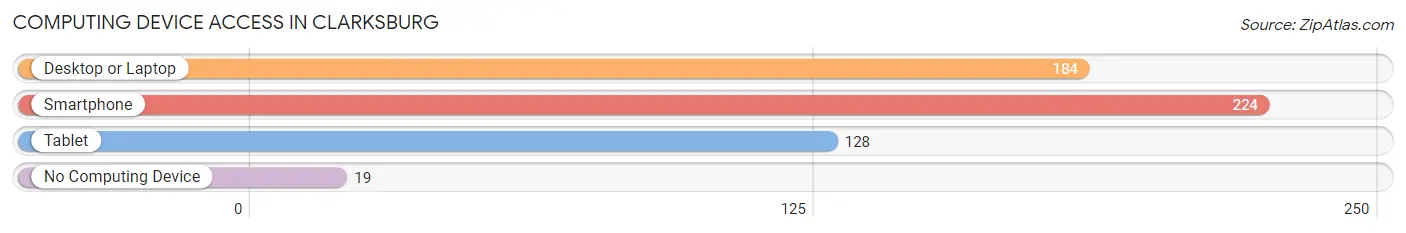
| Device Type | # Households | % Households |
| Desktop or Laptop | 184 | 74.5% |
| Smartphone | 224 | 90.7% |
| Tablet | 128 | 51.8% |
| No Computing Device | 19 | 7.7% |
| Total | 247 | 100.0% |
Internet Access in Clarksburg
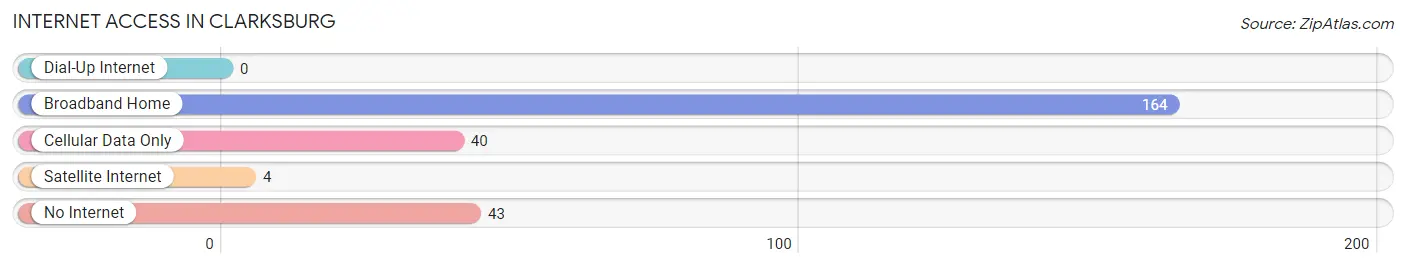
| Internet Type | # Households | % Households |
| Dial-Up Internet | 0 | 0.0% |
| Broadband Home | 164 | 66.4% |
| Cellular Data Only | 40 | 16.2% |
| Satellite Internet | 4 | 1.6% |
| No Internet | 43 | 17.4% |
| Total | 247 | 100.0% |
Clarksburg Summary
Clarksburg is a small town located in the state of Tennessee, in the United States. It is situated in the northwest corner of the state, in the foothills of the Appalachian Mountains. The town is located in the county of Montgomery, and is part of the Clarksville-Montgomery County Metropolitan Statistical Area. The population of Clarksburg was estimated to be 1,845 in the year 2020.
History
Clarksburg was founded in 1817 by William Clark, a Revolutionary War veteran. The town was named after him, and was originally known as Clarksville. The town was incorporated in 1819, and was the first town in Montgomery County. The town was a major stop on the stagecoach route between Nashville and Memphis.
In the early 1900s, Clarksburg was a thriving agricultural community. The town was home to several cotton gins, a sawmill, and a grist mill. The town also had a number of stores, including a general store, a drug store, and a hardware store.
In the 1950s, Clarksburg began to experience a decline in population. This was due to the decline of the agricultural industry in the area, as well as the increasing popularity of the nearby city of Clarksville. The town was also affected by the construction of Interstate 24, which bypassed the town.
Geography
Clarksburg is located in the northwest corner of Tennessee, in the foothills of the Appalachian Mountains. The town is situated in the county of Montgomery, and is part of the Clarksville-Montgomery County Metropolitan Statistical Area. The town is located at an elevation of 590 feet above sea level.
The town is located in a hilly area, with the highest point being the summit of the nearby Cumberland Plateau. The town is located near the confluence of the Red River and the Cumberland River. The town is also located near the Tennessee-Kentucky border.
Economy
The economy of Clarksburg is largely based on agriculture. The town is home to several farms, which produce a variety of crops, including corn, soybeans, and wheat. The town is also home to several small businesses, including restaurants, retail stores, and service providers.
The town is also home to a number of manufacturing companies, including a furniture factory and a plastics factory. The town is also home to a number of government offices, including the Montgomery County Courthouse and the Clarksburg Post Office.
Demographics
The population of Clarksburg was estimated to be 1,845 in the year 2020. The town has a population that is predominantly white, with a small percentage of African Americans and Hispanics. The median household income in the town is $41,945, and the median home value is $128,400. The town has a poverty rate of 16.3%, which is higher than the national average.
Conclusion
Clarksburg is a small town located in the state of Tennessee, in the United States. The town was founded in 1817 by William Clark, and was originally known as Clarksville. The town has a population of 1,845, and is predominantly white. The economy of the town is largely based on agriculture, and the town is home to several small businesses. The town also has a number of government offices, and the median household income is $41,945.
Common Questions
What is Per Capita Income in Clarksburg?
Per Capita income in Clarksburg is $24,810.
What is the Median Family Income in Clarksburg?
Median Family Income in Clarksburg is $74,188.
What is the Median Household income in Clarksburg?
Median Household Income in Clarksburg is $68,750.
What is Income or Wage Gap in Clarksburg?
Income or Wage Gap in Clarksburg is 49.9%.
Women in Clarksburg earn 50.1 cents for every dollar earned by a man.
What is Inequality or Gini Index in Clarksburg?
Inequality or Gini Index in Clarksburg is 0.40.
What is the Total Population of Clarksburg?
Total Population of Clarksburg is 975.
What is the Total Male Population of Clarksburg?
Total Male Population of Clarksburg is 508.
What is the Total Female Population of Clarksburg?
Total Female Population of Clarksburg is 467.
What is the Ratio of Males per 100 Females in Clarksburg?
There are 108.78 Males per 100 Females in Clarksburg.
What is the Ratio of Females per 100 Males in Clarksburg?
There are 91.93 Females per 100 Males in Clarksburg.
What is the Median Population Age in Clarksburg?
Median Population Age in Clarksburg is 32.9 Years.
What is the Average Family Size in Clarksburg
Average Family Size in Clarksburg is 3.8 People.
What is the Average Household Size in Clarksburg
Average Household Size in Clarksburg is 4.0 People.
How Large is the Labor Force in Clarksburg?
There are 510 People in the Labor Forcein in Clarksburg.
What is the Percentage of People in the Labor Force in Clarksburg?
62.8% of People are in the Labor Force in Clarksburg.
What is the Unemployment Rate in Clarksburg?
Unemployment Rate in Clarksburg is 17.6%.