Collegedale, TN Map & Demographics
Collegedale Map
Collegedale Overview
$35,881
PER CAPITA INCOME
$81,938
AVG FAMILY INCOME
$69,942
AVG HOUSEHOLD INCOME
40.7%
WAGE / INCOME GAP [ % ]
59.3¢/ $1
WAGE / INCOME GAP [ $ ]
0.42
INEQUALITY / GINI INDEX
11,001
TOTAL POPULATION
5,371
MALE POPULATION
5,630
FEMALE POPULATION
95.40
MALES / 100 FEMALES
104.82
FEMALES / 100 MALES
32.8
MEDIAN AGE
2.8
AVG FAMILY SIZE
2.2
AVG HOUSEHOLD SIZE
6,554
LABOR FORCE [ PEOPLE ]
67.5%
PERCENT IN LABOR FORCE
2.7%
UNEMPLOYMENT RATE
Collegedale Zip Codes
Collegedale Area Codes
Income in Collegedale
Income Overview in Collegedale
Per Capita Income in Collegedale is $35,881, while median incomes of families and households are $81,938 and $69,942 respectively.
| Characteristic | Number | Measure |
| Per Capita Income | 11,001 | $35,881 |
| Median Family Income | 2,529 | $81,938 |
| Mean Family Income | 2,529 | $104,541 |
| Median Household Income | 4,155 | $69,942 |
| Mean Household Income | 4,155 | $89,629 |
| Income Deficit | 2,529 | $0 |
| Wage / Income Gap (%) | 11,001 | 40.69% |
| Wage / Income Gap ($) | 11,001 | 59.31¢ per $1 |
| Gini / Inequality Index | 11,001 | 0.42 |
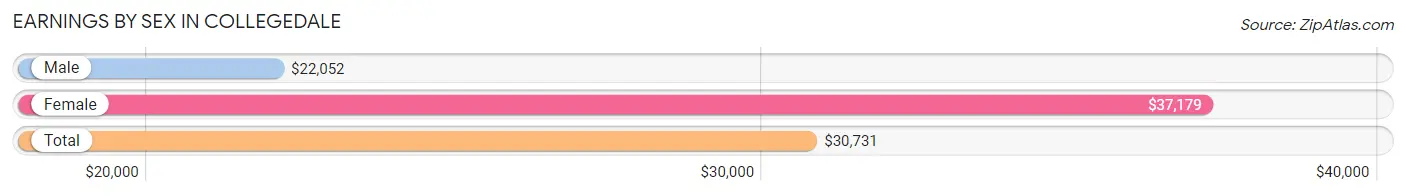
Earnings by Sex in Collegedale
Average Earnings in Collegedale are $30,731, $22,052 for men and $37,179 for women, a difference of 40.7%.
| Sex | Number | Average Earnings |
| Male | 3,607 (51.1%) | $22,052 |
| Female | 3,451 (48.9%) | $37,179 |
| Total | 7,058 (100.0%) | $30,731 |
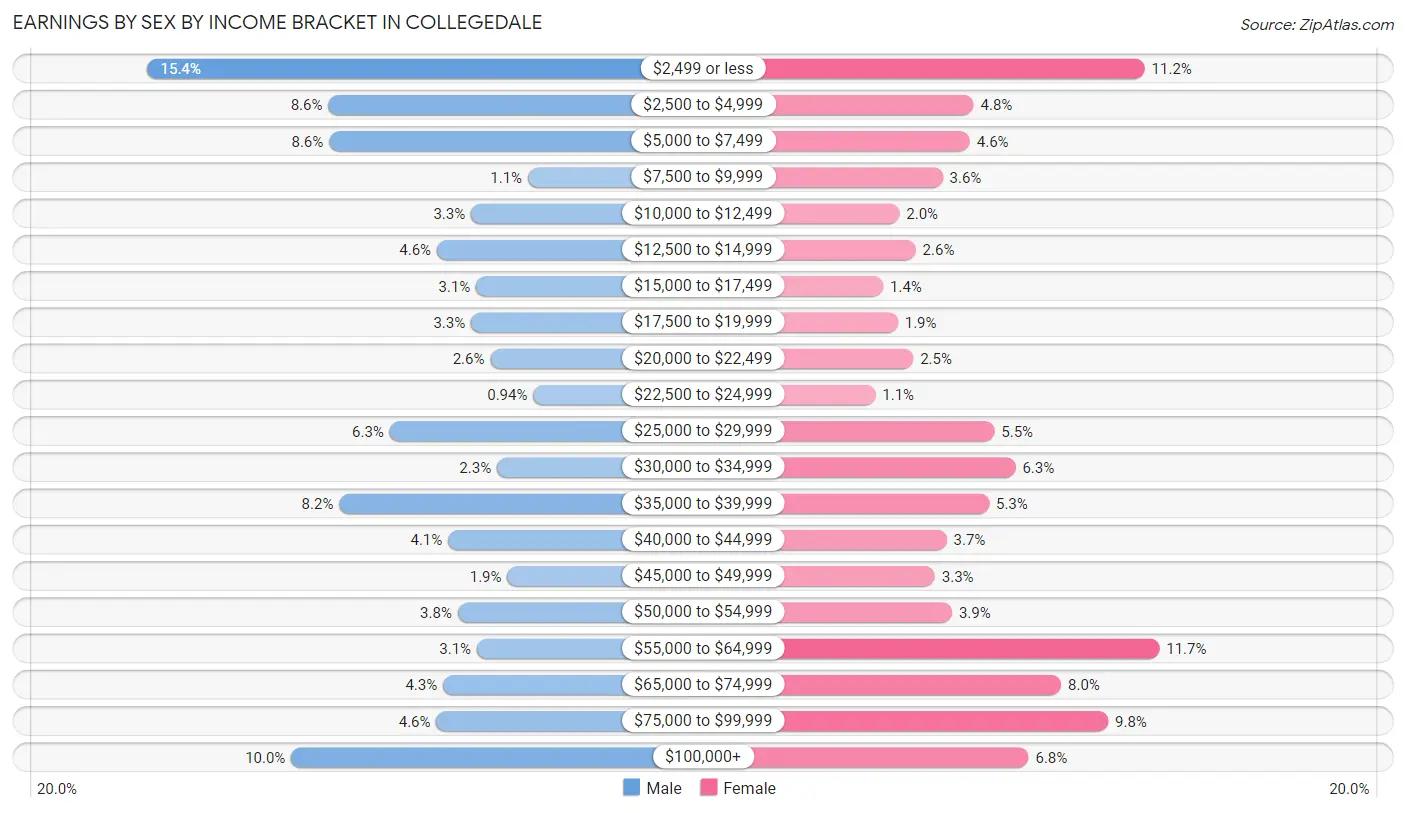
Earnings by Sex by Income Bracket in Collegedale
The most common earnings brackets in Collegedale are $2,499 or less for men (555 | 15.4%) and $55,000 to $64,999 for women (404 | 11.7%).
| Income | Male | Female |
| $2,499 or less | 555 (15.4%) | 385 (11.2%) |
| $2,500 to $4,999 | 311 (8.6%) | 164 (4.8%) |
| $5,000 to $7,499 | 310 (8.6%) | 159 (4.6%) |
| $7,500 to $9,999 | 41 (1.1%) | 124 (3.6%) |
| $10,000 to $12,499 | 118 (3.3%) | 68 (2.0%) |
| $12,500 to $14,999 | 164 (4.5%) | 89 (2.6%) |
| $15,000 to $17,499 | 111 (3.1%) | 47 (1.4%) |
| $17,500 to $19,999 | 118 (3.3%) | 66 (1.9%) |
| $20,000 to $22,499 | 92 (2.5%) | 86 (2.5%) |
| $22,500 to $24,999 | 34 (0.9%) | 37 (1.1%) |
| $25,000 to $29,999 | 228 (6.3%) | 191 (5.5%) |
| $30,000 to $34,999 | 83 (2.3%) | 218 (6.3%) |
| $35,000 to $39,999 | 296 (8.2%) | 184 (5.3%) |
| $40,000 to $44,999 | 149 (4.1%) | 129 (3.7%) |
| $45,000 to $49,999 | 69 (1.9%) | 114 (3.3%) |
| $50,000 to $54,999 | 136 (3.8%) | 136 (3.9%) |
| $55,000 to $64,999 | 110 (3.0%) | 404 (11.7%) |
| $65,000 to $74,999 | 156 (4.3%) | 277 (8.0%) |
| $75,000 to $99,999 | 165 (4.6%) | 338 (9.8%) |
| $100,000+ | 361 (10.0%) | 235 (6.8%) |
| Total | 3,607 (100.0%) | 3,451 (100.0%) |
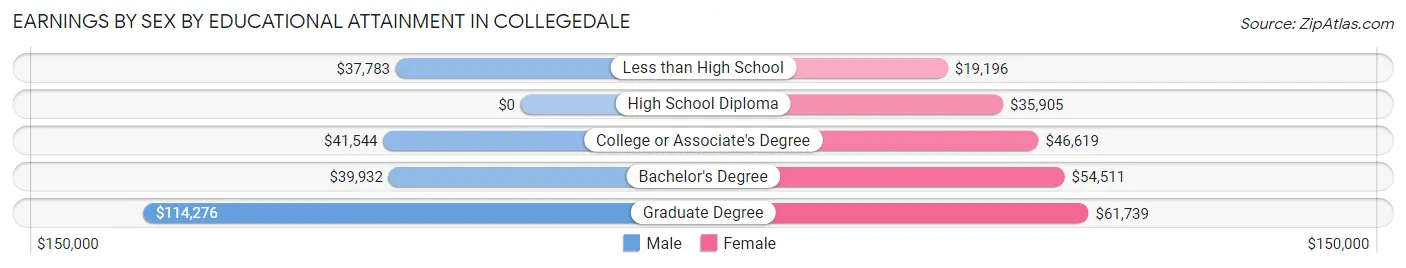
Earnings by Sex by Educational Attainment in Collegedale
Average earnings in Collegedale are $39,728 for men and $54,107 for women, a difference of 26.6%. Men with an educational attainment of graduate degree enjoy the highest average annual earnings of $114,276, while those with less than high school education earn the least with $37,783. Women with an educational attainment of graduate degree earn the most with the average annual earnings of $61,739, while those with less than high school education have the smallest earnings of $19,196.
| Educational Attainment | Male Income | Female Income |
| Less than High School | $37,783 | $19,196 |
| High School Diploma | - | - |
| College or Associate's Degree | $41,544 | $46,619 |
| Bachelor's Degree | $39,932 | $54,511 |
| Graduate Degree | $114,276 | $61,739 |
| Total | $39,728 | $54,107 |
Family Income in Collegedale
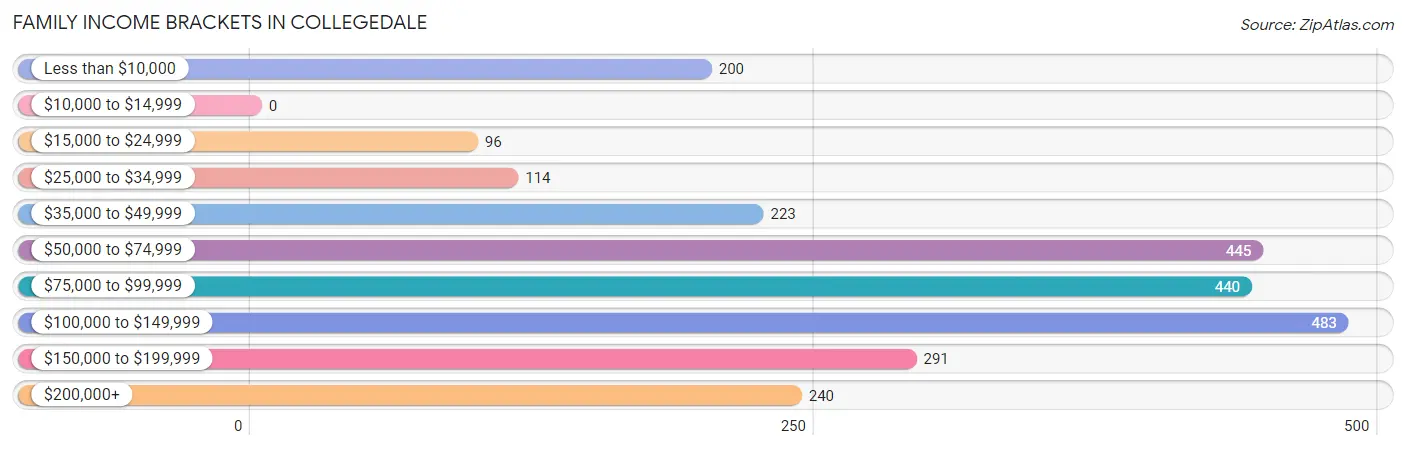
Family Income Brackets in Collegedale
According to the Collegedale family income data, there are 483 families falling into the $100,000 to $149,999 income range, which is the most common income bracket and makes up 19.1% of all families.
| Income Bracket | # Families | % Families |
| Less than $10,000 | 200 | 7.9% |
| $10,000 to $14,999 | 0 | 0.0% |
| $15,000 to $24,999 | 96 | 3.8% |
| $25,000 to $34,999 | 114 | 4.5% |
| $35,000 to $49,999 | 223 | 8.8% |
| $50,000 to $74,999 | 445 | 17.6% |
| $75,000 to $99,999 | 440 | 17.4% |
| $100,000 to $149,999 | 483 | 19.1% |
| $150,000 to $199,999 | 291 | 11.5% |
| $200,000+ | 240 | 9.5% |
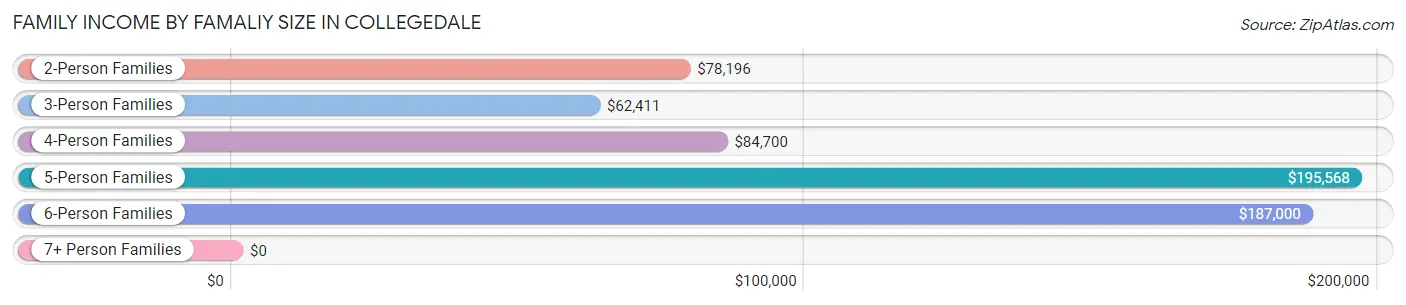
Family Income by Famaliy Size in Collegedale
5-person families (113 | 4.5%) account for the highest median family income in Collegedale with $195,568 per family, while 5-person families (113 | 4.5%) have the highest median income of $39,114 per family member.
| Income Bracket | # Families | Median Income |
| 2-Person Families | 1,454 (57.5%) | $78,196 |
| 3-Person Families | 587 (23.2%) | $62,411 |
| 4-Person Families | 323 (12.8%) | $84,700 |
| 5-Person Families | 113 (4.5%) | $195,568 |
| 6-Person Families | 52 (2.1%) | $187,000 |
| 7+ Person Families | 0 (0.0%) | $0 |
| Total | 2,529 (100.0%) | $81,938 |
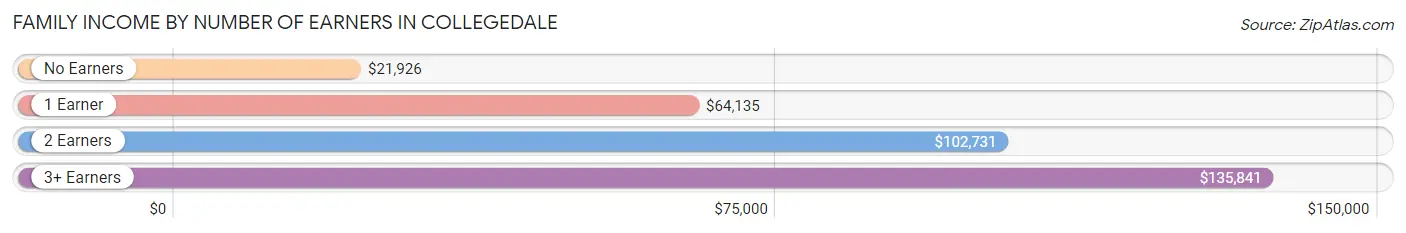
Family Income by Number of Earners in Collegedale
The median family income in Collegedale is $81,938, with families comprising 3+ earners (319) having the highest median family income of $135,841, while families with no earners (420) have the lowest median family income of $21,926, accounting for 12.6% and 16.6% of families, respectively.
| Number of Earners | # Families | Median Income |
| No Earners | 420 (16.6%) | $21,926 |
| 1 Earner | 693 (27.4%) | $64,135 |
| 2 Earners | 1,097 (43.4%) | $102,731 |
| 3+ Earners | 319 (12.6%) | $135,841 |
| Total | 2,529 (100.0%) | $81,938 |
Household Income in Collegedale
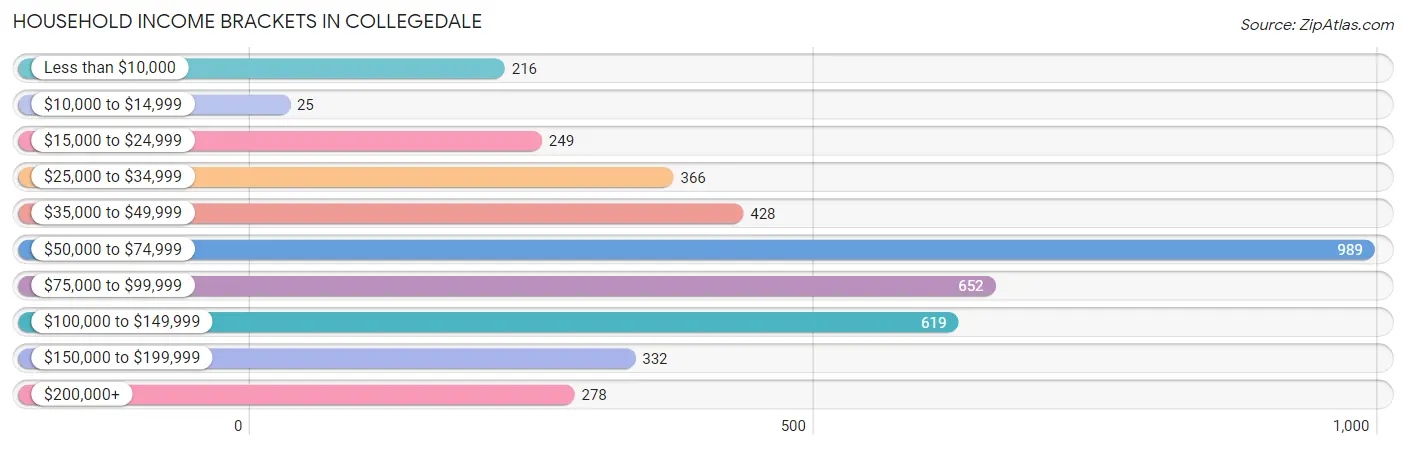
Household Income Brackets in Collegedale
With 989 households falling in the category, the $50,000 to $74,999 income range is the most frequent in Collegedale, accounting for 23.8% of all households. In contrast, only 25 households (0.6%) fall into the $10,000 to $14,999 income bracket, making it the least populous group.
| Income Bracket | # Households | % Households |
| Less than $10,000 | 216 | 5.2% |
| $10,000 to $14,999 | 25 | 0.6% |
| $15,000 to $24,999 | 249 | 6.0% |
| $25,000 to $34,999 | 366 | 8.8% |
| $35,000 to $49,999 | 428 | 10.3% |
| $50,000 to $74,999 | 989 | 23.8% |
| $75,000 to $99,999 | 652 | 15.7% |
| $100,000 to $149,999 | 619 | 14.9% |
| $150,000 to $199,999 | 332 | 8.0% |
| $200,000+ | 278 | 6.7% |
Household Income by Householder Age in Collegedale
The median household income in Collegedale is $69,942, with the highest median household income of $83,135 found in the 45 to 64 years age bracket for the primary householder. A total of 1,433 households (34.5%) fall into this category. Meanwhile, the 15 to 24 years age bracket for the primary householder has the lowest median household income of $42,417, with 179 households (4.3%) in this group.
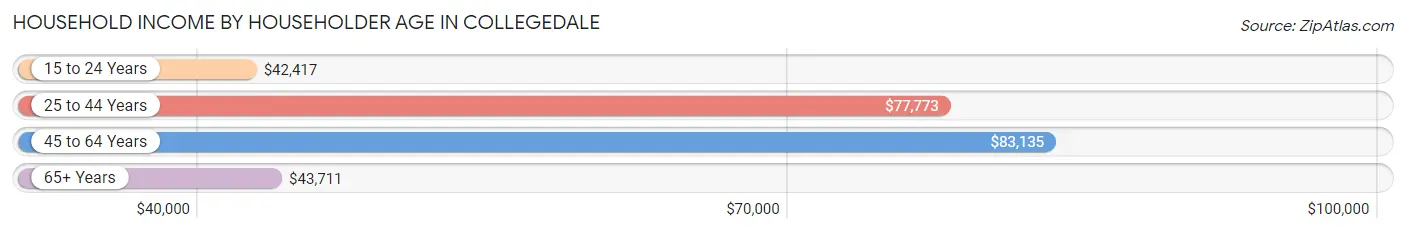
| Income Bracket | # Households | Median Income |
| 15 to 24 Years | 179 (4.3%) | $42,417 |
| 25 to 44 Years | 1,428 (34.4%) | $77,773 |
| 45 to 64 Years | 1,433 (34.5%) | $83,135 |
| 65+ Years | 1,115 (26.8%) | $43,711 |
| Total | 4,155 (100.0%) | $69,942 |
Poverty in Collegedale
Income Below Poverty by Sex and Age in Collegedale
With 8.9% poverty level for males and 7.3% for females among the residents of Collegedale, under 5 year old males and 6 to 11 year old females are the most vulnerable to poverty, with 69 males (33.2%) and 64 females (25.1%) in their respective age groups living below the poverty level.
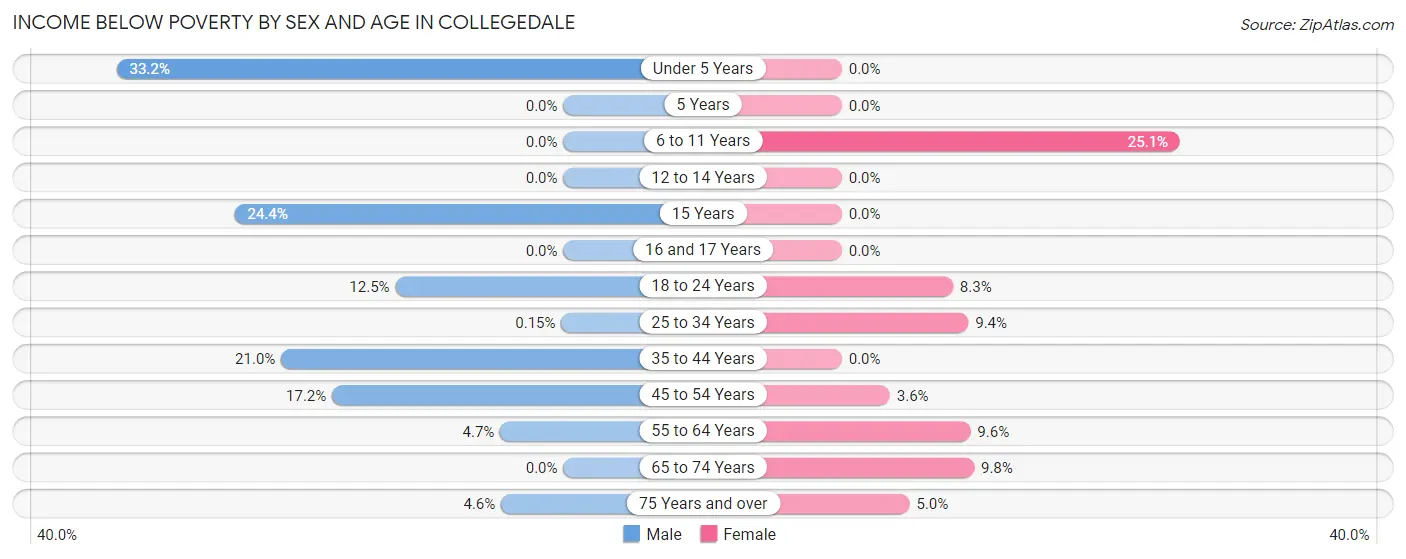
| Age Bracket | Male | Female |
| Under 5 Years | 69 (33.2%) | 0 (0.0%) |
| 5 Years | 0 (0.0%) | 0 (0.0%) |
| 6 to 11 Years | 0 (0.0%) | 64 (25.1%) |
| 12 to 14 Years | 0 (0.0%) | 0 (0.0%) |
| 15 Years | 31 (24.4%) | 0 (0.0%) |
| 16 and 17 Years | 0 (0.0%) | 0 (0.0%) |
| 18 to 24 Years | 58 (12.5%) | 26 (8.3%) |
| 25 to 34 Years | 1 (0.2%) | 110 (9.4%) |
| 35 to 44 Years | 75 (20.9%) | 0 (0.0%) |
| 45 to 54 Years | 96 (17.2%) | 26 (3.6%) |
| 55 to 64 Years | 32 (4.7%) | 64 (9.6%) |
| 65 to 74 Years | 0 (0.0%) | 44 (9.8%) |
| 75 Years and over | 17 (4.6%) | 18 (5.0%) |
| Total | 379 (8.9%) | 352 (7.3%) |
Income Above Poverty by Sex and Age in Collegedale
According to the poverty statistics in Collegedale, males aged 5 years and females aged under 5 years are the age groups that are most secure financially, with 100.0% of males and 100.0% of females in these age groups living above the poverty line.
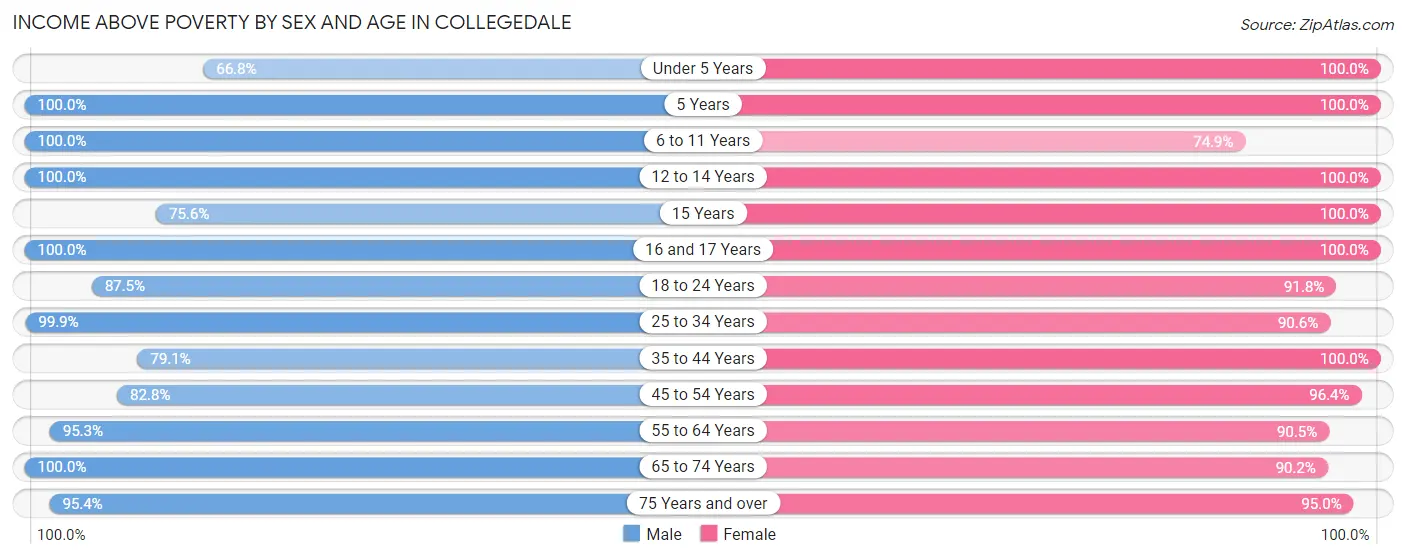
| Age Bracket | Male | Female |
| Under 5 Years | 139 (66.8%) | 90 (100.0%) |
| 5 Years | 15 (100.0%) | 60 (100.0%) |
| 6 to 11 Years | 250 (100.0%) | 191 (74.9%) |
| 12 to 14 Years | 114 (100.0%) | 122 (100.0%) |
| 15 Years | 96 (75.6%) | 25 (100.0%) |
| 16 and 17 Years | 80 (100.0%) | 62 (100.0%) |
| 18 to 24 Years | 407 (87.5%) | 289 (91.7%) |
| 25 to 34 Years | 659 (99.9%) | 1,062 (90.6%) |
| 35 to 44 Years | 283 (79.0%) | 500 (100.0%) |
| 45 to 54 Years | 463 (82.8%) | 703 (96.4%) |
| 55 to 64 Years | 651 (95.3%) | 606 (90.4%) |
| 65 to 74 Years | 379 (100.0%) | 404 (90.2%) |
| 75 Years and over | 351 (95.4%) | 340 (95.0%) |
| Total | 3,887 (91.1%) | 4,454 (92.7%) |
Income Below Poverty Among Married-Couple Families in Collegedale
The poverty statistics for married-couple families in Collegedale show that 5.4% or 102 of the total 1,897 families live below the poverty line. Families with 1 or 2 children have the highest poverty rate of 17.3%, comprising of 82 families. On the other hand, families with 3 or 4 children have the lowest poverty rate of 0.0%, which includes 0 families.
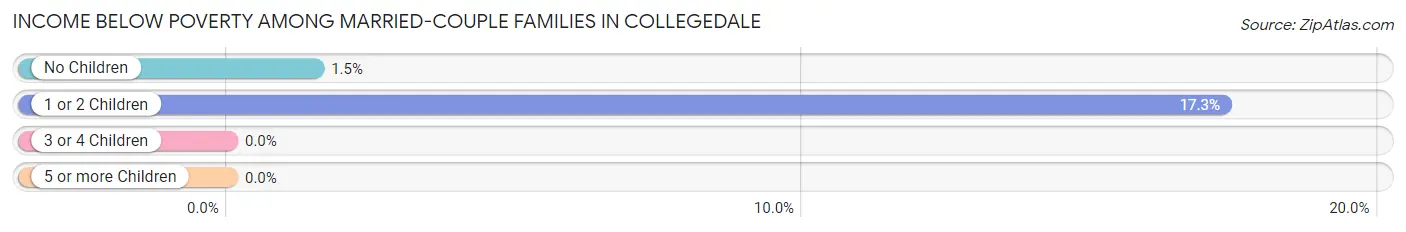
| Children | Above Poverty | Below Poverty |
| No Children | 1,313 (98.5%) | 20 (1.5%) |
| 1 or 2 Children | 392 (82.7%) | 82 (17.3%) |
| 3 or 4 Children | 90 (100.0%) | 0 (0.0%) |
| 5 or more Children | 0 (0.0%) | 0 (0.0%) |
| Total | 1,795 (94.6%) | 102 (5.4%) |
Income Below Poverty Among Single-Parent Households in Collegedale
According to the poverty data in Collegedale, 25.1% or 46 single-father households and 14.5% or 65 single-mother households are living below the poverty line. Among single-father households, those with no children have the highest poverty rate, with 46 households (28.2%) experiencing poverty. Likewise, among single-mother households, those with 1 or 2 children have the highest poverty rate, with 50 households (16.8%) falling below the poverty line.
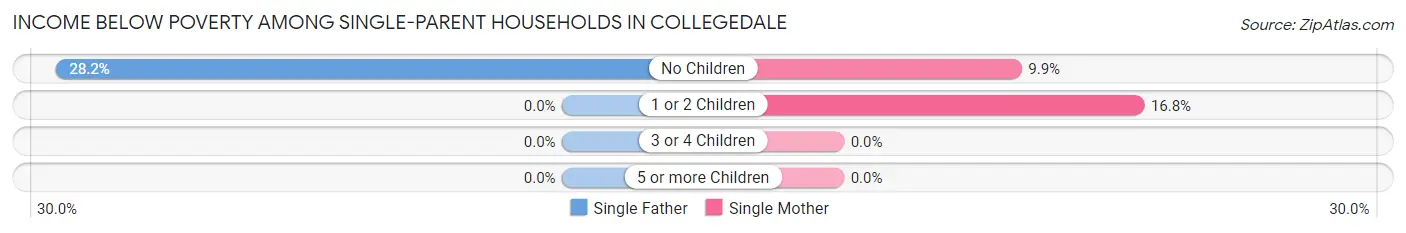
| Children | Single Father | Single Mother |
| No Children | 46 (28.2%) | 15 (9.9%) |
| 1 or 2 Children | 0 (0.0%) | 50 (16.8%) |
| 3 or 4 Children | 0 (0.0%) | 0 (0.0%) |
| 5 or more Children | 0 (0.0%) | 0 (0.0%) |
| Total | 46 (25.1%) | 65 (14.5%) |
Income Below Poverty Among Married-Couple vs Single-Parent Households in Collegedale
The poverty data for Collegedale shows that 102 of the married-couple family households (5.4%) and 111 of the single-parent households (17.6%) are living below the poverty level. Within the married-couple family households, those with 1 or 2 children have the highest poverty rate, with 82 households (17.3%) falling below the poverty line. Among the single-parent households, those with no children have the highest poverty rate, with 61 household (19.4%) living below poverty.
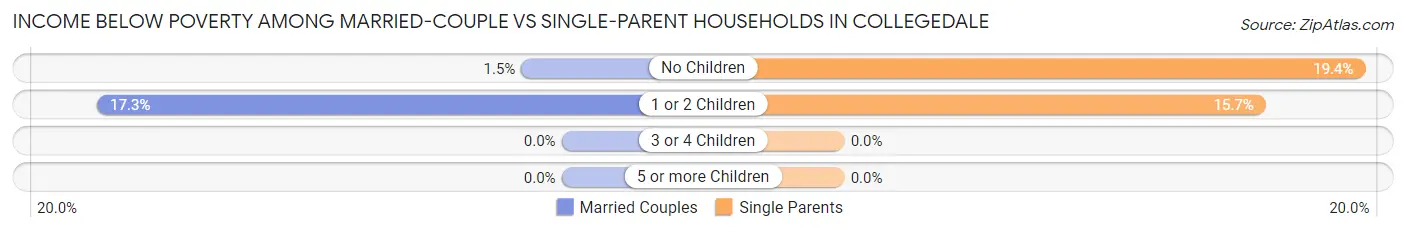
| Children | Married-Couple Families | Single-Parent Households |
| No Children | 20 (1.5%) | 61 (19.4%) |
| 1 or 2 Children | 82 (17.3%) | 50 (15.7%) |
| 3 or 4 Children | 0 (0.0%) | 0 (0.0%) |
| 5 or more Children | 0 (0.0%) | 0 (0.0%) |
| Total | 102 (5.4%) | 111 (17.6%) |
Race in Collegedale
The most populous races in Collegedale are White / Caucasian (7,926 | 72.1%), Black / African American (1,292 | 11.7%), and Hispanic or Latino (1,250 | 11.4%).
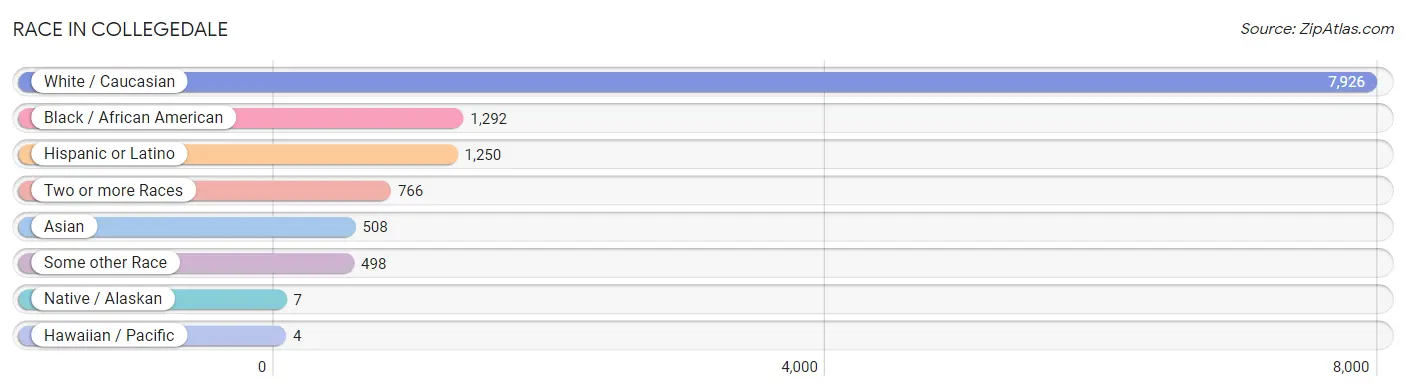
| Race | # Population | % Population |
| Asian | 508 | 4.6% |
| Black / African American | 1,292 | 11.7% |
| Hawaiian / Pacific | 4 | 0.0% |
| Hispanic or Latino | 1,250 | 11.4% |
| Native / Alaskan | 7 | 0.1% |
| White / Caucasian | 7,926 | 72.1% |
| Two or more Races | 766 | 7.0% |
| Some other Race | 498 | 4.5% |
| Total | 11,001 | 100.0% |
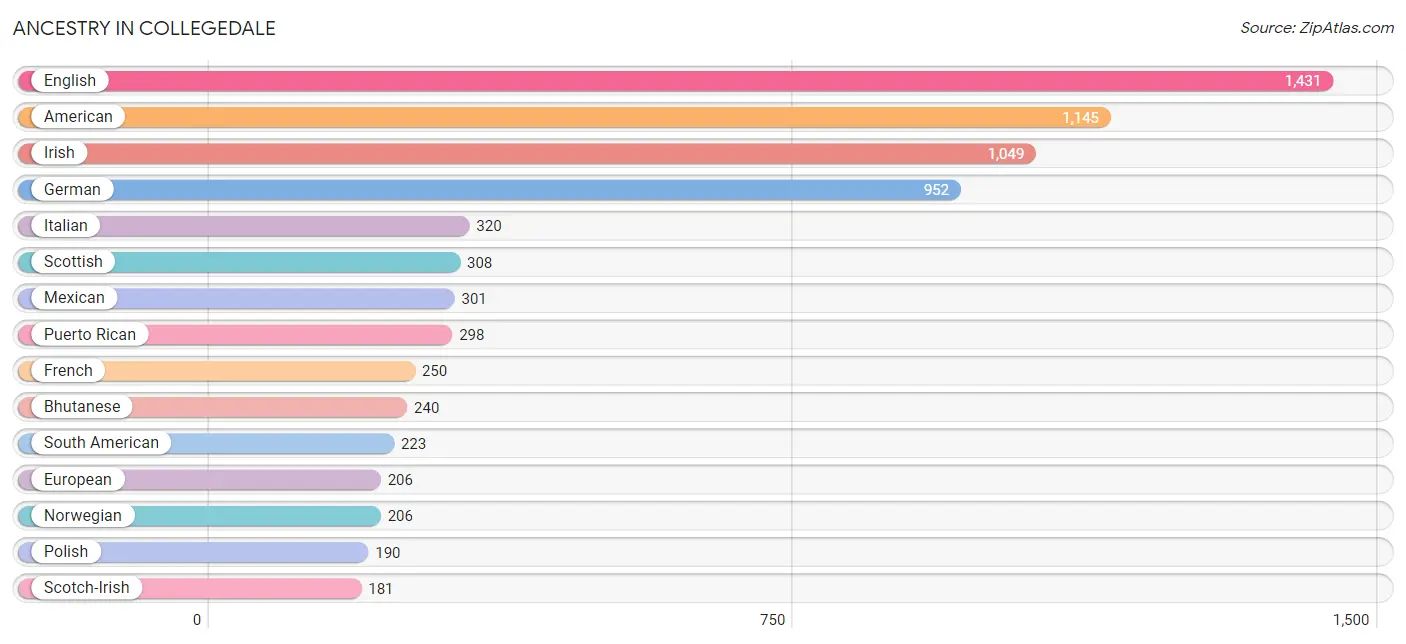
Ancestry in Collegedale
The most populous ancestries reported in Collegedale are English (1,431 | 13.0%), American (1,145 | 10.4%), Irish (1,049 | 9.5%), German (952 | 8.6%), and Italian (320 | 2.9%), together accounting for 44.5% of all Collegedale residents.
| Ancestry | # Population | % Population |
| African | 100 | 0.9% |
| Alaska Native | 45 | 0.4% |
| American | 1,145 | 10.4% |
| Arab | 16 | 0.2% |
| Bahamian | 8 | 0.1% |
| Belizean | 9 | 0.1% |
| Bhutanese | 240 | 2.2% |
| Brazilian | 16 | 0.2% |
| British | 71 | 0.6% |
| British West Indian | 7 | 0.1% |
| Burmese | 119 | 1.1% |
| Canadian | 14 | 0.1% |
| Central American | 104 | 0.9% |
| Cherokee | 51 | 0.5% |
| Chilean | 10 | 0.1% |
| Colombian | 7 | 0.1% |
| Creek | 7 | 0.1% |
| Croatian | 14 | 0.1% |
| Cuban | 16 | 0.2% |
| Czech | 14 | 0.1% |
| Danish | 13 | 0.1% |
| Dominican | 74 | 0.7% |
| Dutch | 84 | 0.8% |
| English | 1,431 | 13.0% |
| European | 206 | 1.9% |
| French | 250 | 2.3% |
| German | 952 | 8.6% |
| Greek | 23 | 0.2% |
| Guamanian / Chamorro | 1 | 0.0% |
| Guatemalan | 22 | 0.2% |
| Haitian | 180 | 1.6% |
| Honduran | 43 | 0.4% |
| Indian (Asian) | 113 | 1.0% |
| Irish | 1,049 | 9.5% |
| Italian | 320 | 2.9% |
| Jamaican | 145 | 1.3% |
| Japanese | 7 | 0.1% |
| Korean | 161 | 1.5% |
| Laotian | 50 | 0.4% |
| Lebanese | 16 | 0.2% |
| Mexican | 301 | 2.7% |
| Native Hawaiian | 39 | 0.4% |
| Navajo | 15 | 0.1% |
| Nicaraguan | 31 | 0.3% |
| Nigerian | 8 | 0.1% |
| Norwegian | 206 | 1.9% |
| Okinawan | 4 | 0.0% |
| Panamanian | 4 | 0.0% |
| Paraguayan | 15 | 0.1% |
| Peruvian | 112 | 1.0% |
| Polish | 190 | 1.7% |
| Portuguese | 77 | 0.7% |
| Puerto Rican | 298 | 2.7% |
| Romanian | 33 | 0.3% |
| Russian | 46 | 0.4% |
| Salvadoran | 4 | 0.0% |
| Scandinavian | 51 | 0.5% |
| Scotch-Irish | 181 | 1.7% |
| Scottish | 308 | 2.8% |
| South African | 15 | 0.1% |
| South American | 223 | 2.0% |
| Spaniard | 12 | 0.1% |
| Spanish | 28 | 0.3% |
| Sri Lankan | 8 | 0.1% |
| Subsaharan African | 123 | 1.1% |
| Swiss | 8 | 0.1% |
| Thai | 128 | 1.2% |
| Trinidadian and Tobagonian | 2 | 0.0% |
| Ukrainian | 148 | 1.3% |
| Venezuelan | 79 | 0.7% |
| Welsh | 132 | 1.2% | View All 71 Rows |
Immigrants in Collegedale
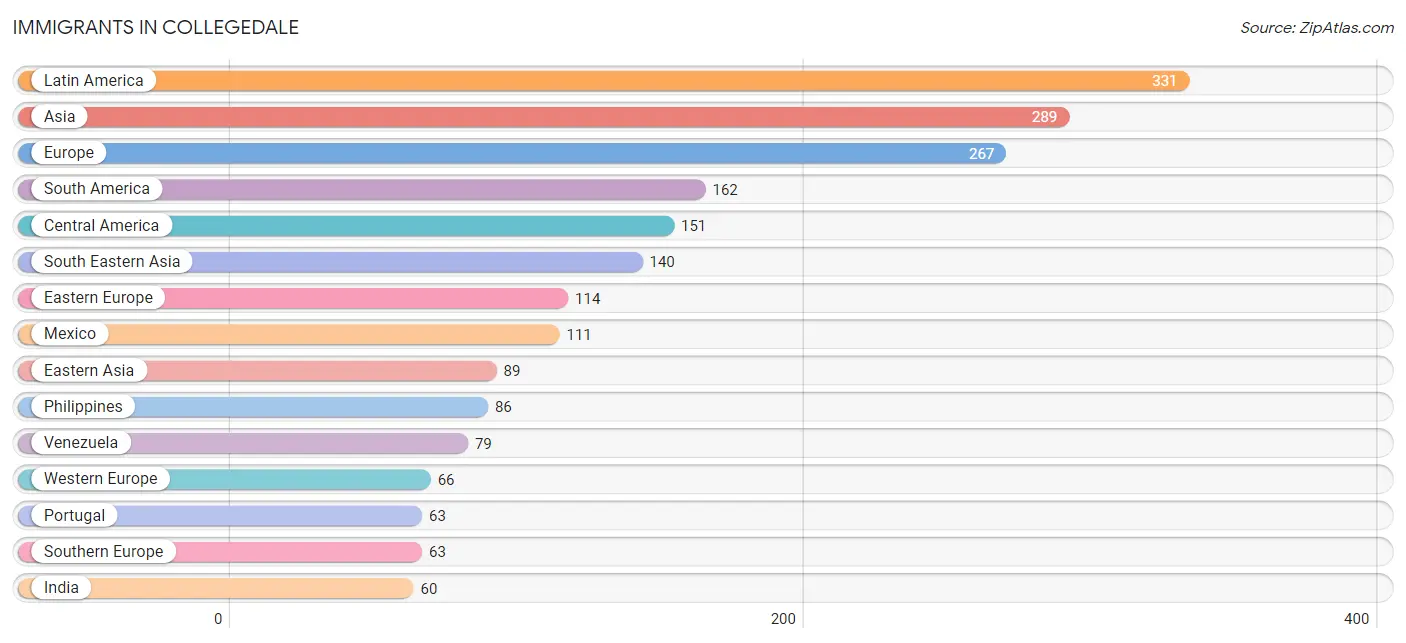
The most numerous immigrant groups reported in Collegedale came from Latin America (331 | 3.0%), Asia (289 | 2.6%), Europe (267 | 2.4%), South America (162 | 1.5%), and Central America (151 | 1.4%), together accounting for 10.9% of all Collegedale residents.
| Immigration Origin | # Population | % Population |
| Africa | 46 | 0.4% |
| Asia | 289 | 2.6% |
| Brazil | 1 | 0.0% |
| Cambodia | 7 | 0.1% |
| Canada | 8 | 0.1% |
| Caribbean | 18 | 0.2% |
| Central America | 151 | 1.4% |
| Chile | 10 | 0.1% |
| China | 20 | 0.2% |
| Croatia | 14 | 0.1% |
| Czechoslovakia | 9 | 0.1% |
| Dominican Republic | 17 | 0.2% |
| Eastern Asia | 89 | 0.8% |
| Eastern Europe | 114 | 1.0% |
| Europe | 267 | 2.4% |
| France | 23 | 0.2% |
| Germany | 43 | 0.4% |
| Guatemala | 3 | 0.0% |
| Honduras | 37 | 0.3% |
| India | 60 | 0.5% |
| Indonesia | 30 | 0.3% |
| Japan | 34 | 0.3% |
| Korea | 35 | 0.3% |
| Latin America | 331 | 3.0% |
| Malaysia | 17 | 0.2% |
| Mexico | 111 | 1.0% |
| Micronesia | 3 | 0.0% |
| Middle Africa | 14 | 0.1% |
| Nigeria | 8 | 0.1% |
| Northern Europe | 24 | 0.2% |
| Oceania | 3 | 0.0% |
| Peru | 57 | 0.5% |
| Philippines | 86 | 0.8% |
| Portugal | 63 | 0.6% |
| Romania | 15 | 0.1% |
| Russia | 46 | 0.4% |
| South Africa | 15 | 0.1% |
| South America | 162 | 1.5% |
| South Central Asia | 60 | 0.5% |
| South Eastern Asia | 140 | 1.3% |
| Southern Europe | 63 | 0.6% |
| Ukraine | 30 | 0.3% |
| Venezuela | 79 | 0.7% |
| Western Africa | 8 | 0.1% |
| Western Europe | 66 | 0.6% | View All 45 Rows |
Sex and Age in Collegedale
Sex and Age in Collegedale
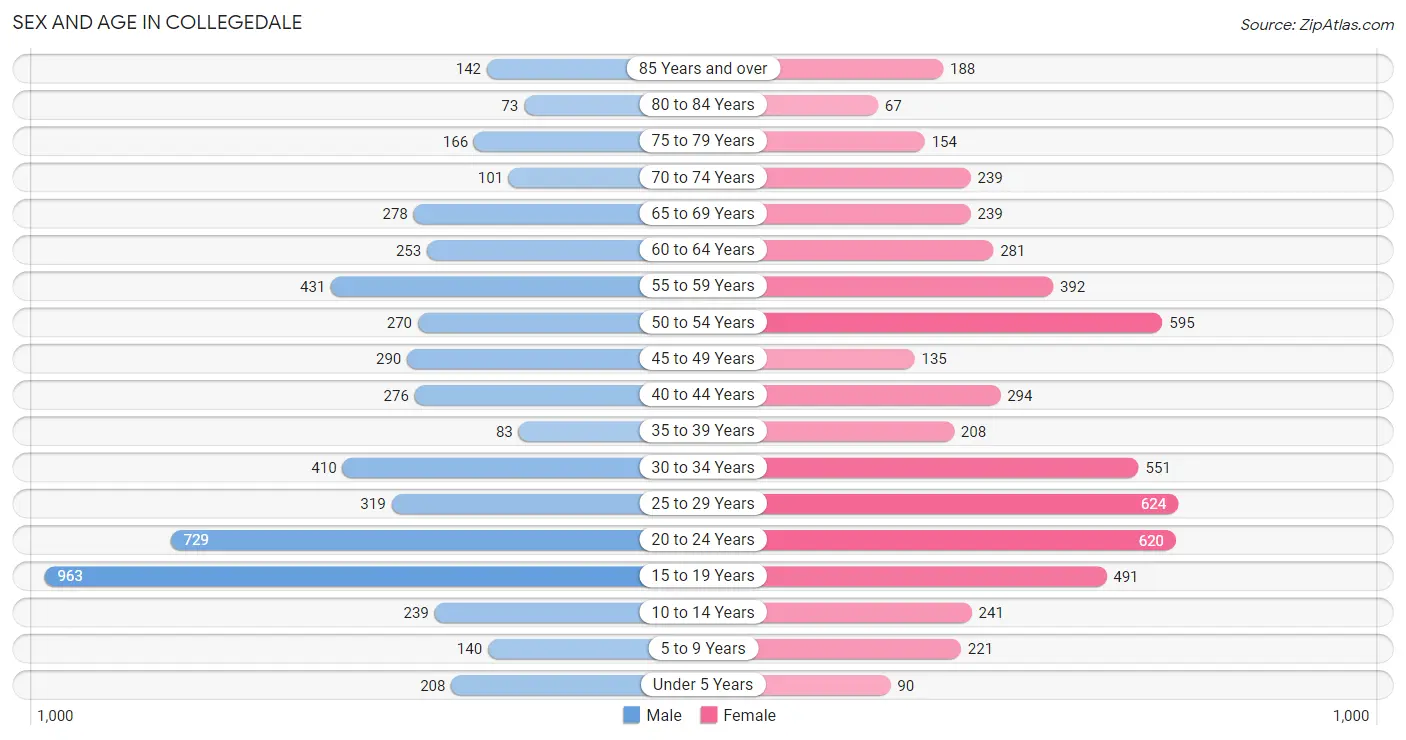
The most populous age groups in Collegedale are 15 to 19 Years (963 | 17.9%) for men and 25 to 29 Years (624 | 11.1%) for women.
| Age Bracket | Male | Female |
| Under 5 Years | 208 (3.9%) | 90 (1.6%) |
| 5 to 9 Years | 140 (2.6%) | 221 (3.9%) |
| 10 to 14 Years | 239 (4.4%) | 241 (4.3%) |
| 15 to 19 Years | 963 (17.9%) | 491 (8.7%) |
| 20 to 24 Years | 729 (13.6%) | 620 (11.0%) |
| 25 to 29 Years | 319 (5.9%) | 624 (11.1%) |
| 30 to 34 Years | 410 (7.6%) | 551 (9.8%) |
| 35 to 39 Years | 83 (1.5%) | 208 (3.7%) |
| 40 to 44 Years | 276 (5.1%) | 294 (5.2%) |
| 45 to 49 Years | 290 (5.4%) | 135 (2.4%) |
| 50 to 54 Years | 270 (5.0%) | 595 (10.6%) |
| 55 to 59 Years | 431 (8.0%) | 392 (7.0%) |
| 60 to 64 Years | 253 (4.7%) | 281 (5.0%) |
| 65 to 69 Years | 278 (5.2%) | 239 (4.3%) |
| 70 to 74 Years | 101 (1.9%) | 239 (4.3%) |
| 75 to 79 Years | 166 (3.1%) | 154 (2.7%) |
| 80 to 84 Years | 73 (1.4%) | 67 (1.2%) |
| 85 Years and over | 142 (2.6%) | 188 (3.3%) |
| Total | 5,371 (100.0%) | 5,630 (100.0%) |
Families and Households in Collegedale
Median Family Size in Collegedale
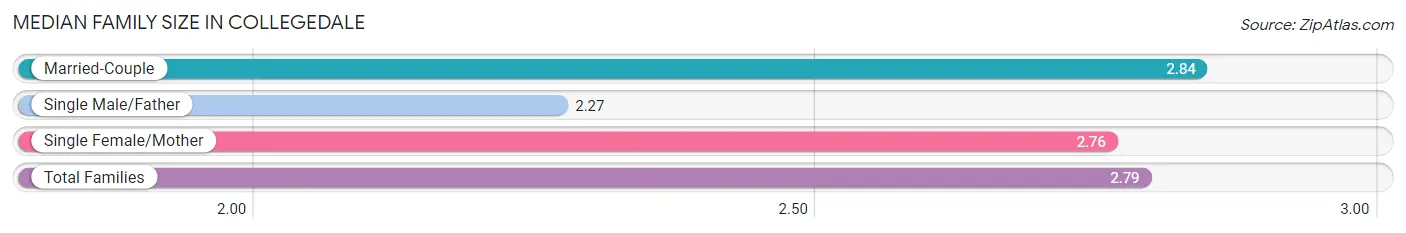
The median family size in Collegedale is 2.79 persons per family, with married-couple families (1,897 | 75.0%) accounting for the largest median family size of 2.84 persons per family. On the other hand, single male/father families (183 | 7.2%) represent the smallest median family size with 2.27 persons per family.
| Family Type | # Families | Family Size |
| Married-Couple | 1,897 (75.0%) | 2.84 |
| Single Male/Father | 183 (7.2%) | 2.27 |
| Single Female/Mother | 449 (17.7%) | 2.76 |
| Total Families | 2,529 (100.0%) | 2.79 |
Median Household Size in Collegedale
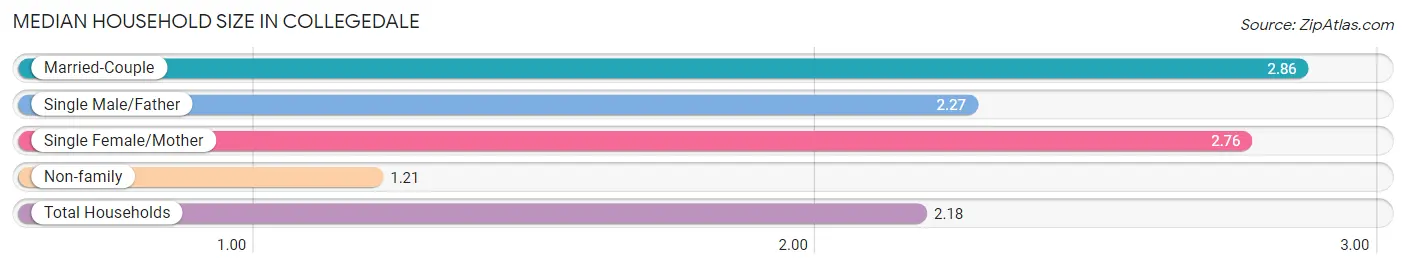
The median household size in Collegedale is 2.18 persons per household, with married-couple households (1,897 | 45.7%) accounting for the largest median household size of 2.86 persons per household. non-family households (1,626 | 39.1%) represent the smallest median household size with 1.21 persons per household.
| Household Type | # Households | Household Size |
| Married-Couple | 1,897 (45.7%) | 2.86 |
| Single Male/Father | 183 (4.4%) | 2.27 |
| Single Female/Mother | 449 (10.8%) | 2.76 |
| Non-family | 1,626 (39.1%) | 1.21 |
| Total Households | 4,155 (100.0%) | 2.18 |
Household Size by Marriage Status in Collegedale
Out of a total of 4,155 households in Collegedale, 2,529 (60.9%) are family households, while 1,626 (39.1%) are nonfamily households. The most numerous type of family households are 2-person households, comprising 1,454, and the most common type of nonfamily households are 1-person households, comprising 1,394.
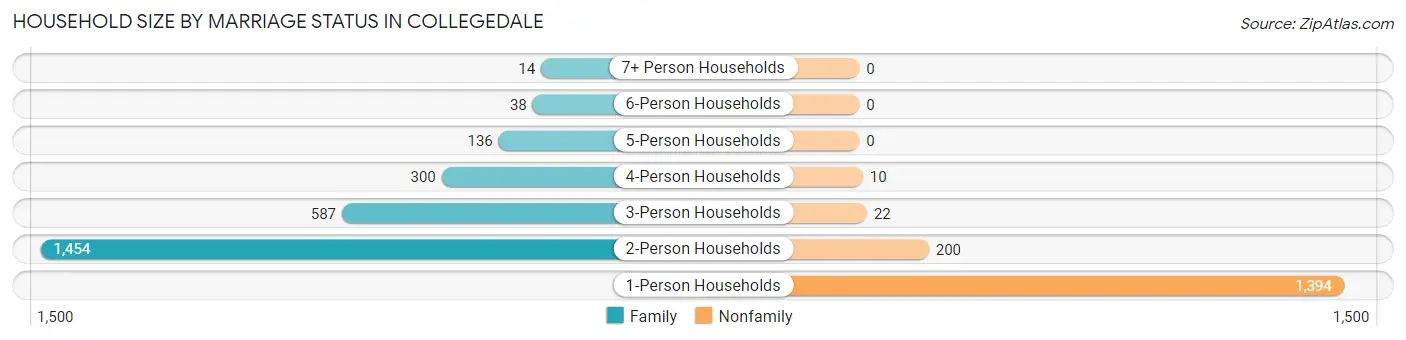
| Household Size | Family Households | Nonfamily Households |
| 1-Person Households | - | 1,394 (33.6%) |
| 2-Person Households | 1,454 (35.0%) | 200 (4.8%) |
| 3-Person Households | 587 (14.1%) | 22 (0.5%) |
| 4-Person Households | 300 (7.2%) | 10 (0.2%) |
| 5-Person Households | 136 (3.3%) | 0 (0.0%) |
| 6-Person Households | 38 (0.9%) | 0 (0.0%) |
| 7+ Person Households | 14 (0.3%) | 0 (0.0%) |
| Total | 2,529 (60.9%) | 1,626 (39.1%) |
Female Fertility in Collegedale
Fertility by Age in Collegedale
Average fertility rate in Collegedale is 18.0 births per 1,000 women. Women in the age bracket of 35 to 50 years have the highest fertility rate with 32.0 births per 1,000 women. Women in the age bracket of 20 to 34 years acount for 56.4% of all women with births.
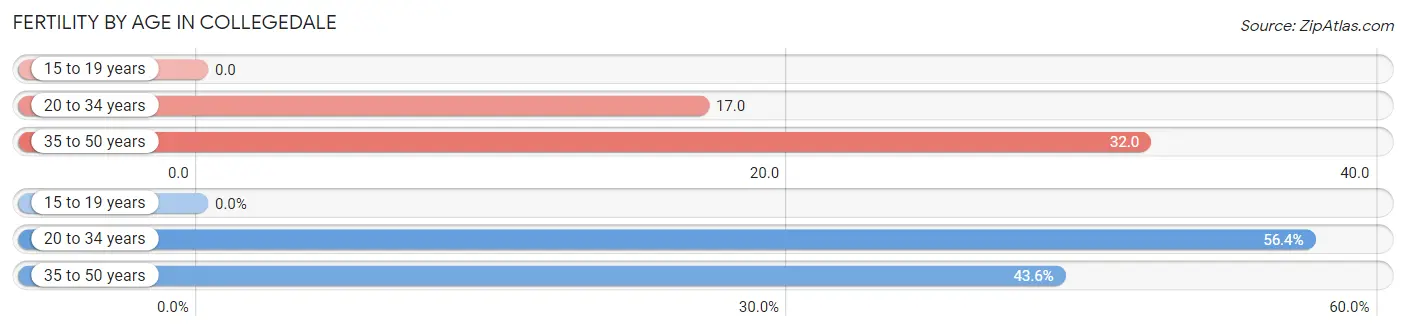
| Age Bracket | Women with Births | Births / 1,000 Women |
| 15 to 19 years | 0 (0.0%) | 0.0 |
| 20 to 34 years | 31 (56.4%) | 17.0 |
| 35 to 50 years | 24 (43.6%) | 32.0 |
| Total | 55 (100.0%) | 18.0 |
Fertility by Age by Marriage Status in Collegedale
76.4% of women with births (55) in Collegedale are married. The highest percentage of unmarried women with births falls into 20 to 34 years age bracket with 41.9% of them unmarried at the time of birth, while the lowest percentage of unmarried women with births belong to 35 to 50 years age bracket with 0.0% of them unmarried.
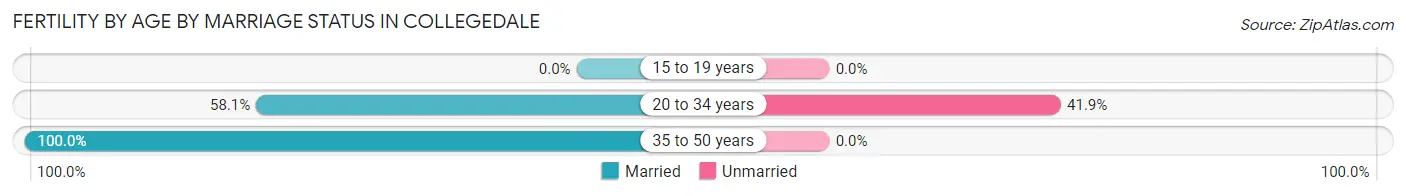
| Age Bracket | Married | Unmarried |
| 15 to 19 years | 0 (0.0%) | 0 (0.0%) |
| 20 to 34 years | 18 (58.1%) | 13 (41.9%) |
| 35 to 50 years | 24 (100.0%) | 0 (0.0%) |
| Total | 42 (76.4%) | 13 (23.6%) |
Fertility by Education in Collegedale
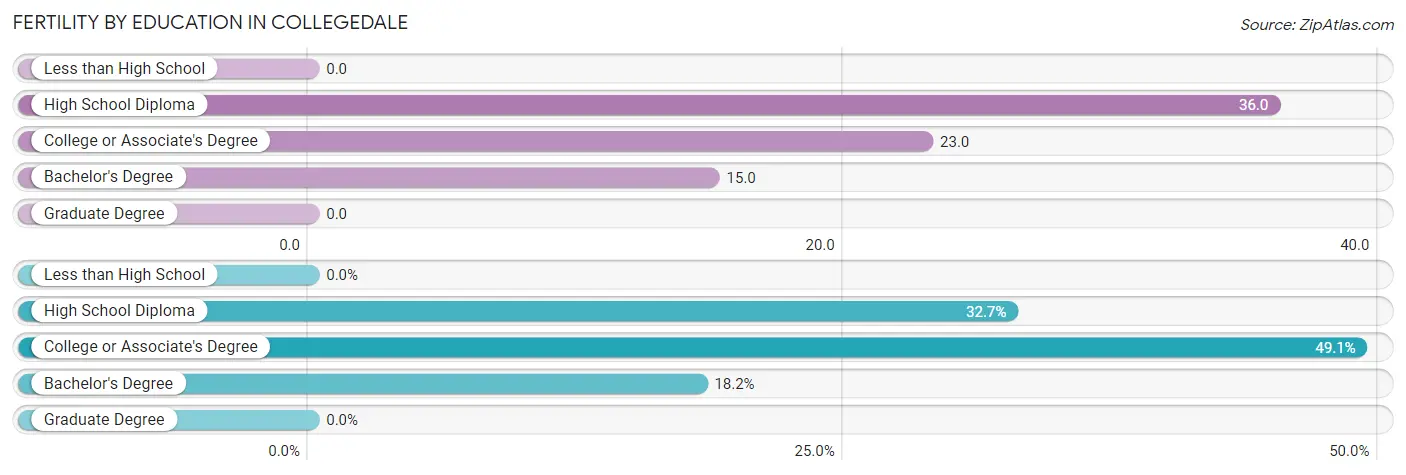
| Educational Attainment | Women with Births | Births / 1,000 Women |
| Less than High School | 0 (0.0%) | 0.0 |
| High School Diploma | 18 (32.7%) | 36.0 |
| College or Associate's Degree | 27 (49.1%) | 23.0 |
| Bachelor's Degree | 10 (18.2%) | 15.0 |
| Graduate Degree | 0 (0.0%) | 0.0 |
| Total | 55 (100.0%) | 18.0 |
Fertility by Education by Marriage Status in Collegedale
23.6% of women with births in Collegedale are unmarried. Women with the educational attainment of high school diploma are most likely to be married with 100.0% of them married at childbirth, while women with the educational attainment of college or associate's degree are least likely to be married with 48.1% of them unmarried at childbirth.
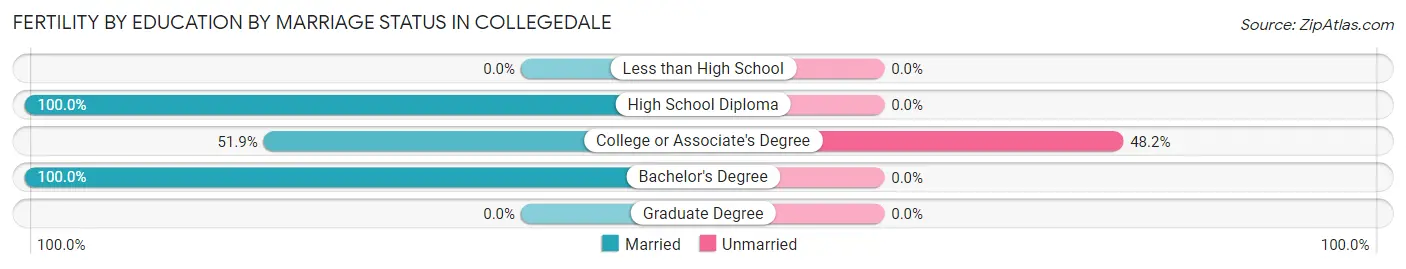
| Educational Attainment | Married | Unmarried |
| Less than High School | 0 (0.0%) | 0 (0.0%) |
| High School Diploma | 18 (100.0%) | 0 (0.0%) |
| College or Associate's Degree | 14 (51.8%) | 13 (48.1%) |
| Bachelor's Degree | 10 (100.0%) | 0 (0.0%) |
| Graduate Degree | 0 (0.0%) | 0 (0.0%) |
| Total | 42 (76.4%) | 13 (23.6%) |
Employment Characteristics in Collegedale
Employment by Class of Employer in Collegedale
Among the 6,199 employed individuals in Collegedale, private company employees (4,149 | 66.9%), not-for-profit organizations (1,108 | 17.9%), and self-employed (not incorporated) (434 | 7.0%) make up the most common classes of employment.
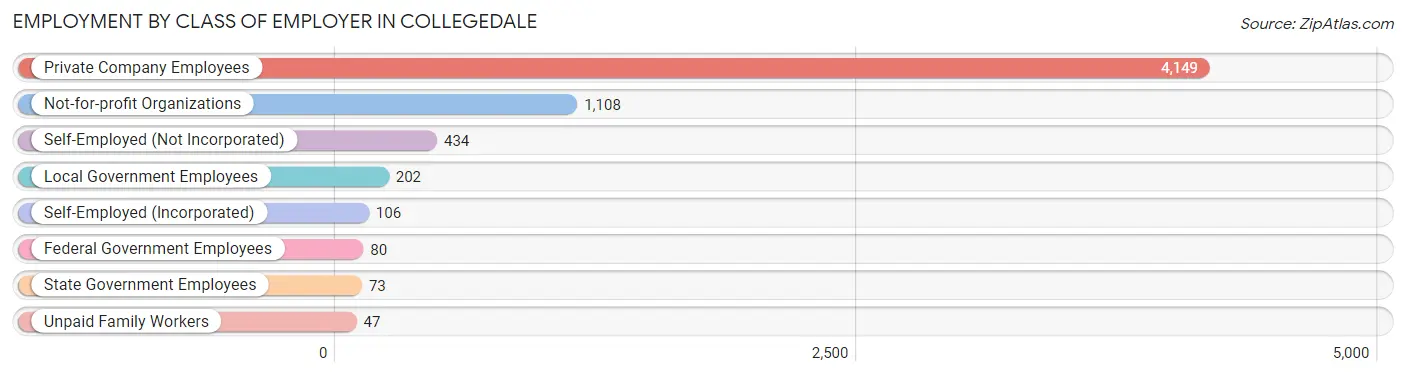
| Employer Class | # Employees | % Employees |
| Private Company Employees | 4,149 | 66.9% |
| Self-Employed (Incorporated) | 106 | 1.7% |
| Self-Employed (Not Incorporated) | 434 | 7.0% |
| Not-for-profit Organizations | 1,108 | 17.9% |
| Local Government Employees | 202 | 3.3% |
| State Government Employees | 73 | 1.2% |
| Federal Government Employees | 80 | 1.3% |
| Unpaid Family Workers | 47 | 0.8% |
| Total | 6,199 | 100.0% |
Employment Status by Age in Collegedale
According to the labor force statistics for Collegedale, out of the total population over 16 years of age (9,710), 67.5% or 6,554 individuals are in the labor force, with 2.7% or 177 of them unemployed. The age group with the highest labor force participation rate is 25 to 29 years, with 97.8% or 922 individuals in the labor force. Within the labor force, the 75 years and over age range has the highest percentage of unemployed individuals, with 12.6% or 15 of them being unemployed.
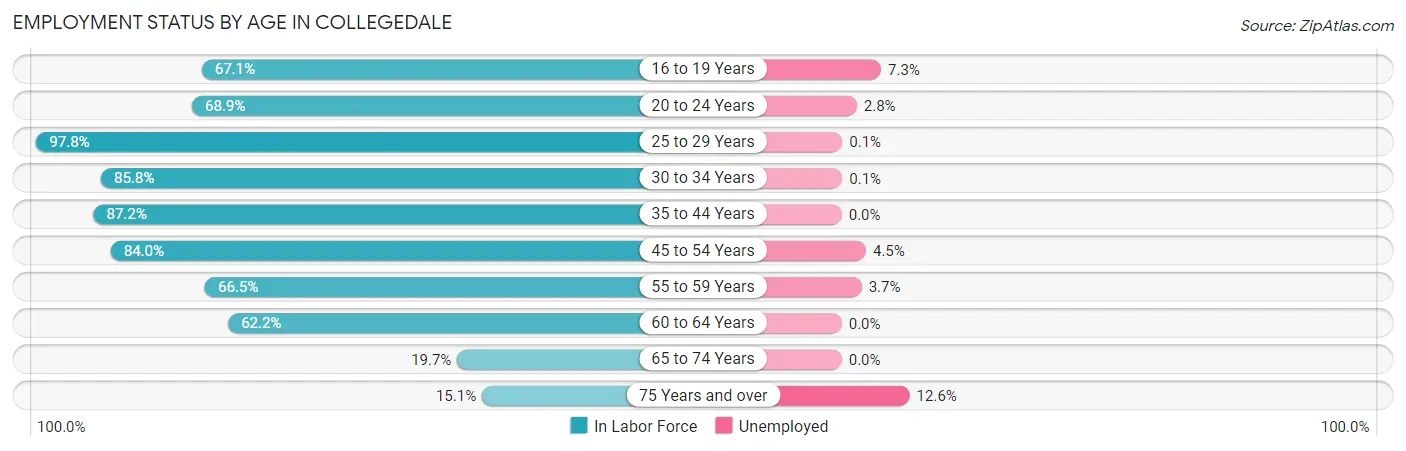
| Age Bracket | In Labor Force | Unemployed |
| 16 to 19 Years | 874 (67.1%) | 64 (7.3%) |
| 20 to 24 Years | 929 (68.9%) | 26 (2.8%) |
| 25 to 29 Years | 922 (97.8%) | 1 (0.1%) |
| 30 to 34 Years | 825 (85.8%) | 1 (0.1%) |
| 35 to 44 Years | 751 (87.2%) | 0 (0.0%) |
| 45 to 54 Years | 1,084 (84.0%) | 49 (4.5%) |
| 55 to 59 Years | 547 (66.5%) | 20 (3.7%) |
| 60 to 64 Years | 332 (62.2%) | 0 (0.0%) |
| 65 to 74 Years | 169 (19.7%) | 0 (0.0%) |
| 75 Years and over | 119 (15.1%) | 15 (12.6%) |
| Total | 6,554 (67.5%) | 177 (2.7%) |
Employment Status by Educational Attainment in Collegedale
According to labor force statistics for Collegedale, 82.4% of individuals (4,459) out of the total population between 25 and 64 years of age (5,412) are in the labor force, with 1.6% or 71 of them being unemployed. The group with the highest labor force participation rate are those with the educational attainment of high school diploma, with 88.0% or 801 individuals in the labor force. Within the labor force, individuals with less than high school education have the highest percentage of unemployment, with 6.9% or 17 of them being unemployed.
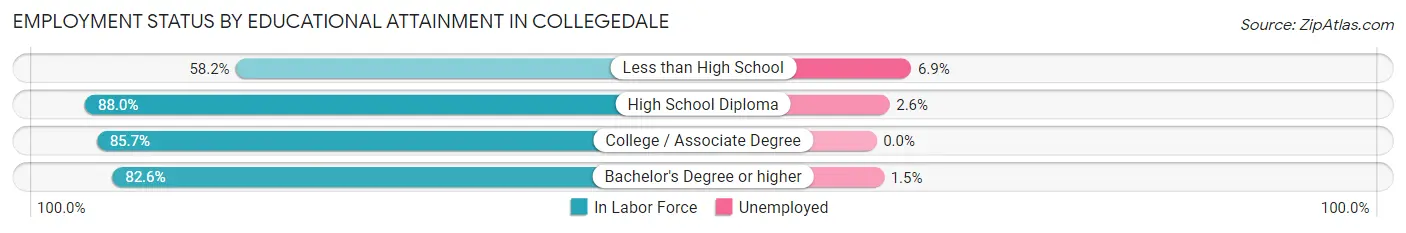
| Educational Attainment | In Labor Force | Unemployed |
| Less than High School | 248 (58.2%) | 29 (6.9%) |
| High School Diploma | 801 (88.0%) | 24 (2.6%) |
| College / Associate Degree | 1,245 (85.7%) | 0 (0.0%) |
| Bachelor's Degree or higher | 2,167 (82.6%) | 39 (1.5%) |
| Total | 4,459 (82.4%) | 87 (1.6%) |
Employment Occupations by Sex in Collegedale
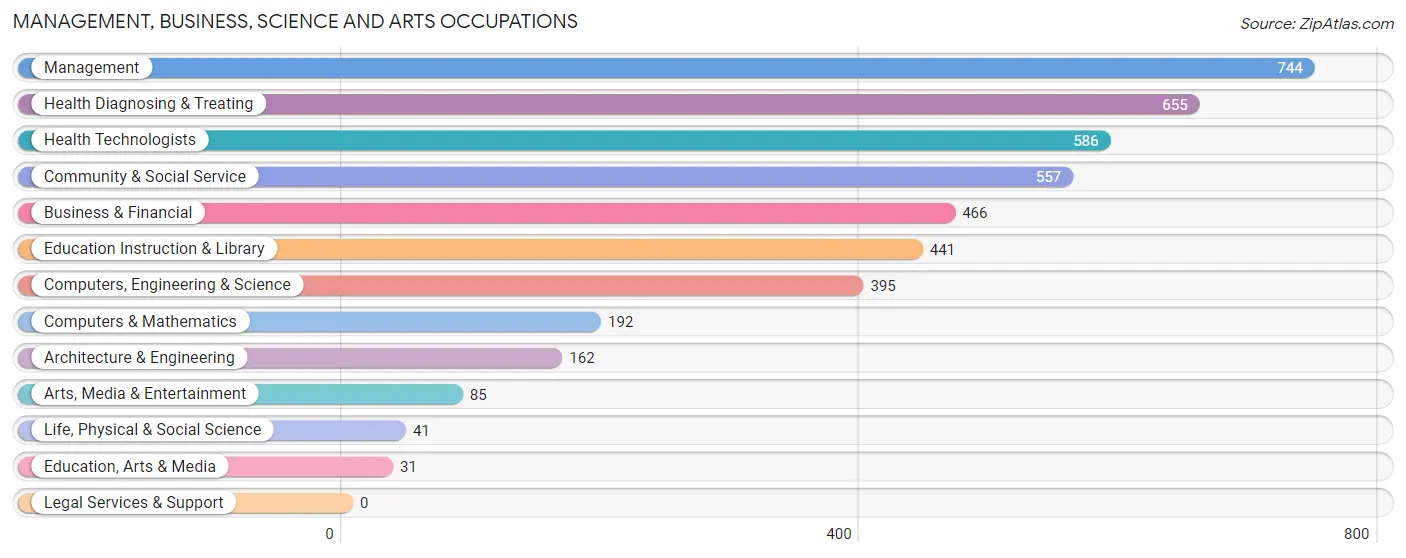
Management, Business, Science and Arts Occupations
The most common Management, Business, Science and Arts occupations in Collegedale are Management (744 | 11.7%), Health Diagnosing & Treating (655 | 10.3%), Health Technologists (586 | 9.2%), Community & Social Service (557 | 8.7%), and Business & Financial (466 | 7.3%).
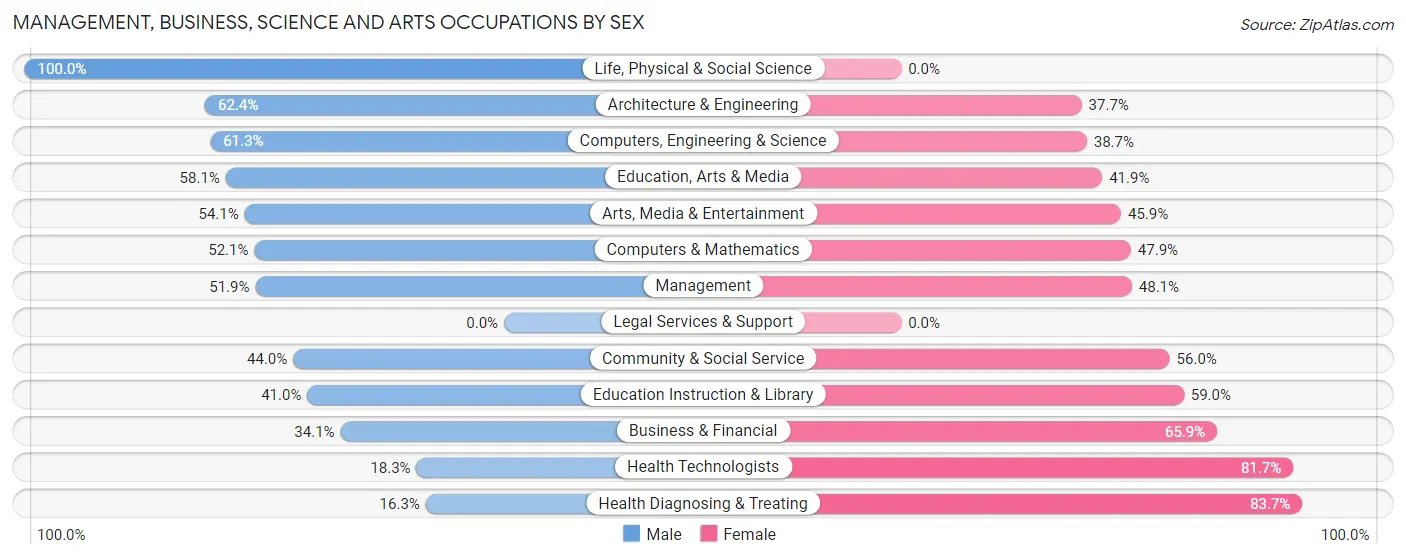
Management, Business, Science and Arts Occupations by Sex
Within the Management, Business, Science and Arts occupations in Collegedale, the most male-oriented occupations are Life, Physical & Social Science (100.0%), Architecture & Engineering (62.4%), and Computers, Engineering & Science (61.3%), while the most female-oriented occupations are Health Diagnosing & Treating (83.7%), Health Technologists (81.7%), and Business & Financial (65.9%).
| Occupation | Male | Female |
| Management | 386 (51.9%) | 358 (48.1%) |
| Business & Financial | 159 (34.1%) | 307 (65.9%) |
| Computers, Engineering & Science | 242 (61.3%) | 153 (38.7%) |
| Computers & Mathematics | 100 (52.1%) | 92 (47.9%) |
| Architecture & Engineering | 101 (62.4%) | 61 (37.7%) |
| Life, Physical & Social Science | 41 (100.0%) | 0 (0.0%) |
| Community & Social Service | 245 (44.0%) | 312 (56.0%) |
| Education, Arts & Media | 18 (58.1%) | 13 (41.9%) |
| Legal Services & Support | 0 (0.0%) | 0 (0.0%) |
| Education Instruction & Library | 181 (41.0%) | 260 (59.0%) |
| Arts, Media & Entertainment | 46 (54.1%) | 39 (45.9%) |
| Health Diagnosing & Treating | 107 (16.3%) | 548 (83.7%) |
| Health Technologists | 107 (18.3%) | 479 (81.7%) |
| Total (Category) | 1,139 (40.4%) | 1,678 (59.6%) |
| Total (Overall) | 3,174 (49.8%) | 3,201 (50.2%) |
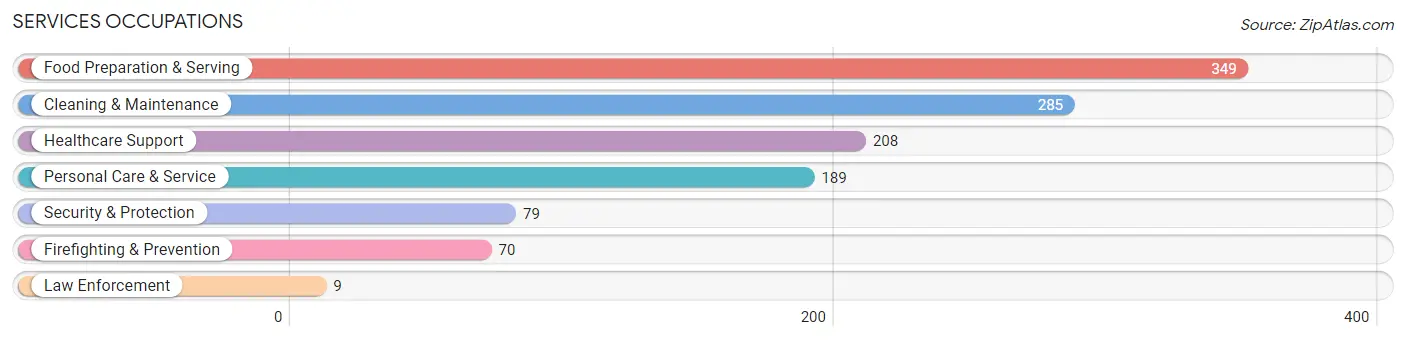
Services Occupations
The most common Services occupations in Collegedale are Food Preparation & Serving (349 | 5.5%), Cleaning & Maintenance (285 | 4.5%), Healthcare Support (208 | 3.3%), Personal Care & Service (189 | 3.0%), and Security & Protection (79 | 1.2%).
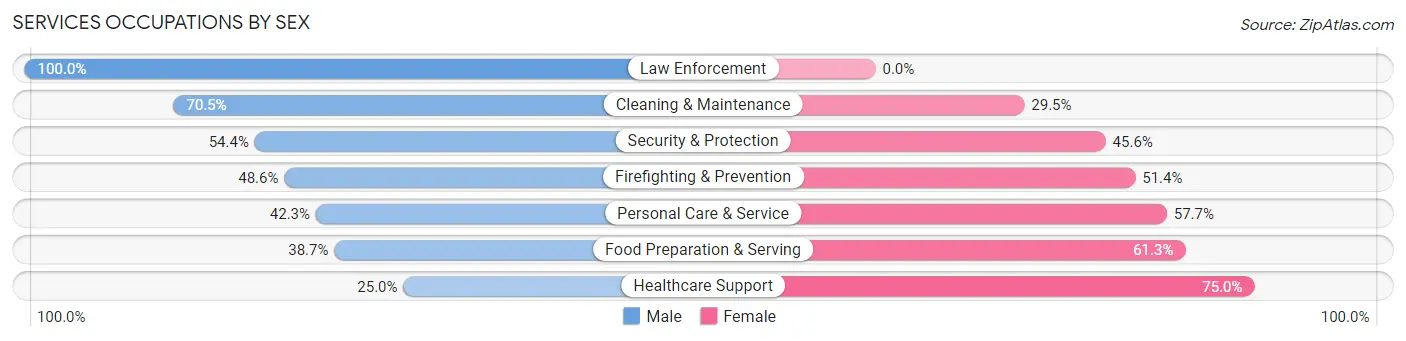
Services Occupations by Sex
Within the Services occupations in Collegedale, the most male-oriented occupations are Law Enforcement (100.0%), Cleaning & Maintenance (70.5%), and Security & Protection (54.4%), while the most female-oriented occupations are Healthcare Support (75.0%), Food Preparation & Serving (61.3%), and Personal Care & Service (57.7%).
| Occupation | Male | Female |
| Healthcare Support | 52 (25.0%) | 156 (75.0%) |
| Security & Protection | 43 (54.4%) | 36 (45.6%) |
| Firefighting & Prevention | 34 (48.6%) | 36 (51.4%) |
| Law Enforcement | 9 (100.0%) | 0 (0.0%) |
| Food Preparation & Serving | 135 (38.7%) | 214 (61.3%) |
| Cleaning & Maintenance | 201 (70.5%) | 84 (29.5%) |
| Personal Care & Service | 80 (42.3%) | 109 (57.7%) |
| Total (Category) | 511 (46.0%) | 599 (54.0%) |
| Total (Overall) | 3,174 (49.8%) | 3,201 (50.2%) |
Sales and Office Occupations
The most common Sales and Office occupations in Collegedale are Office & Administration (904 | 14.2%), and Sales & Related (442 | 6.9%).
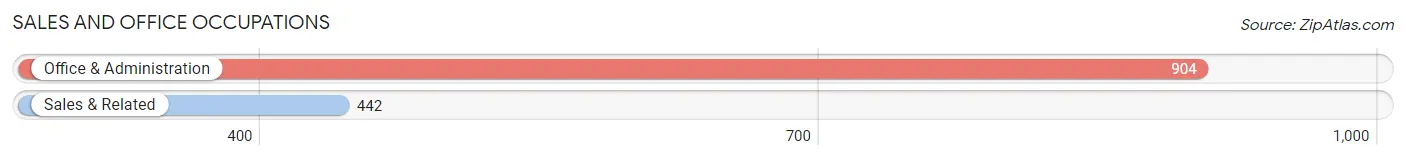
Sales and Office Occupations by Sex
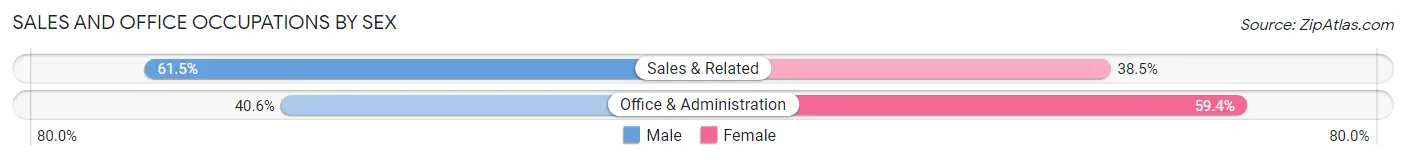
| Occupation | Male | Female |
| Sales & Related | 272 (61.5%) | 170 (38.5%) |
| Office & Administration | 367 (40.6%) | 537 (59.4%) |
| Total (Category) | 639 (47.5%) | 707 (52.5%) |
| Total (Overall) | 3,174 (49.8%) | 3,201 (50.2%) |
Natural Resources, Construction and Maintenance Occupations
The most common Natural Resources, Construction and Maintenance occupations in Collegedale are Construction & Extraction (205 | 3.2%), and Installation, Maintenance & Repair (202 | 3.2%).
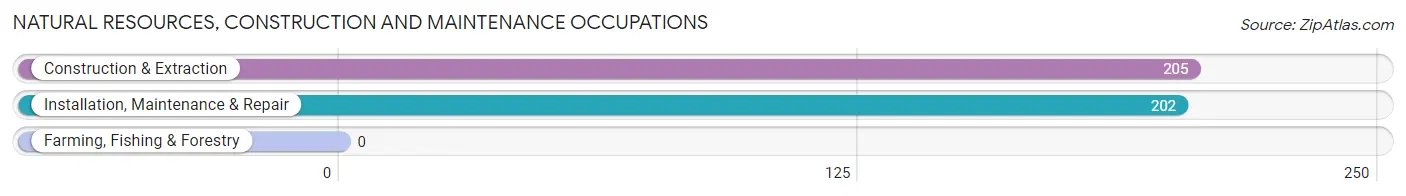
Natural Resources, Construction and Maintenance Occupations by Sex
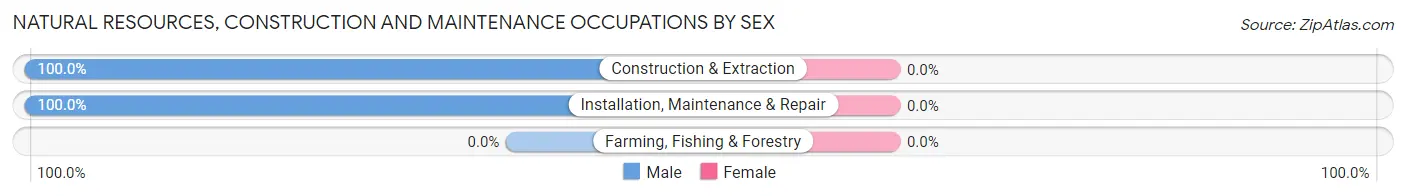
| Occupation | Male | Female |
| Farming, Fishing & Forestry | 0 (0.0%) | 0 (0.0%) |
| Construction & Extraction | 205 (100.0%) | 0 (0.0%) |
| Installation, Maintenance & Repair | 202 (100.0%) | 0 (0.0%) |
| Total (Category) | 407 (100.0%) | 0 (0.0%) |
| Total (Overall) | 3,174 (49.8%) | 3,201 (50.2%) |
Production, Transportation and Moving Occupations
The most common Production, Transportation and Moving occupations in Collegedale are Production (304 | 4.8%), Material Moving (245 | 3.8%), and Transportation (146 | 2.3%).
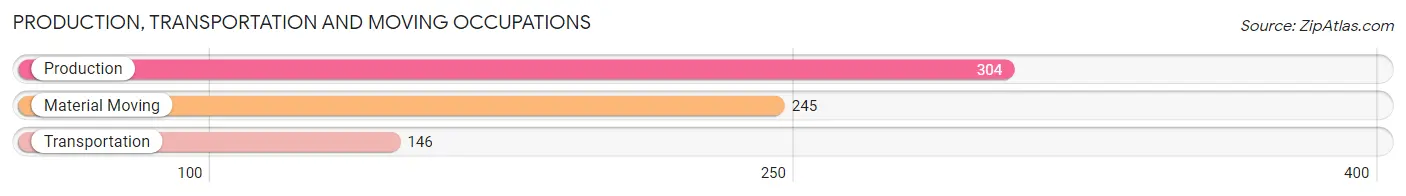
Production, Transportation and Moving Occupations by Sex
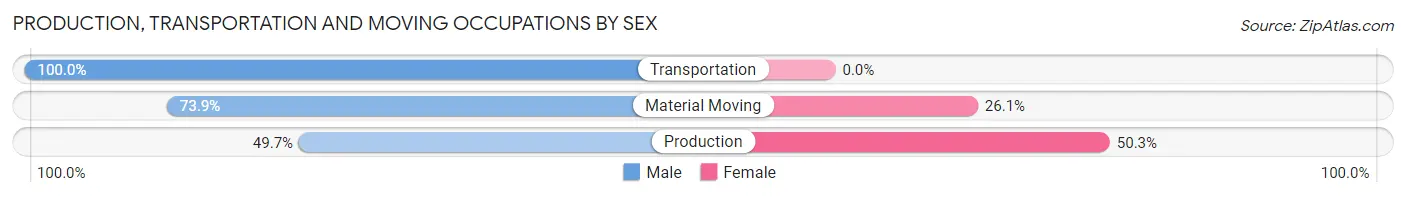
| Occupation | Male | Female |
| Production | 151 (49.7%) | 153 (50.3%) |
| Transportation | 146 (100.0%) | 0 (0.0%) |
| Material Moving | 181 (73.9%) | 64 (26.1%) |
| Total (Category) | 478 (68.8%) | 217 (31.2%) |
| Total (Overall) | 3,174 (49.8%) | 3,201 (50.2%) |
Employment Industries by Sex in Collegedale
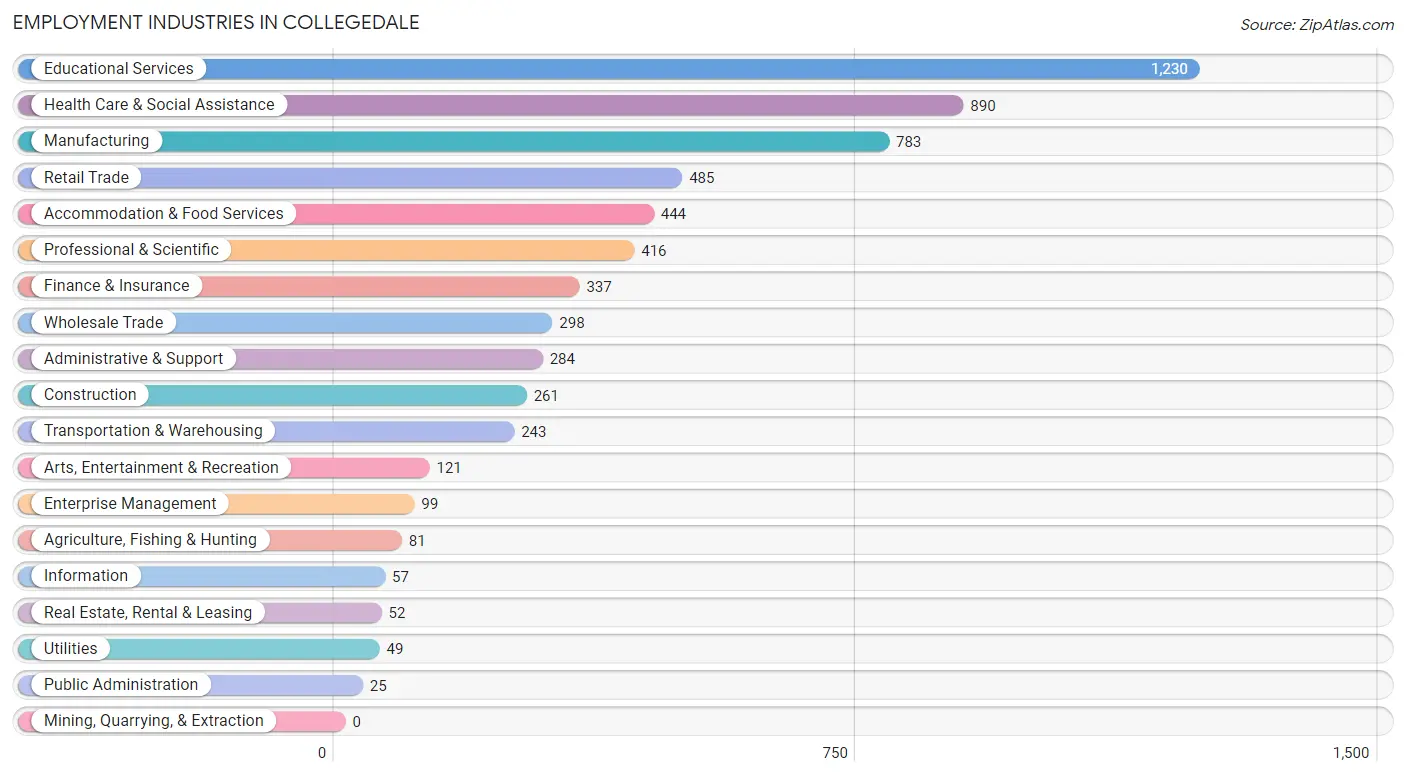
Employment Industries in Collegedale
The major employment industries in Collegedale include Educational Services (1,230 | 19.3%), Health Care & Social Assistance (890 | 14.0%), Manufacturing (783 | 12.3%), Retail Trade (485 | 7.6%), and Accommodation & Food Services (444 | 7.0%).
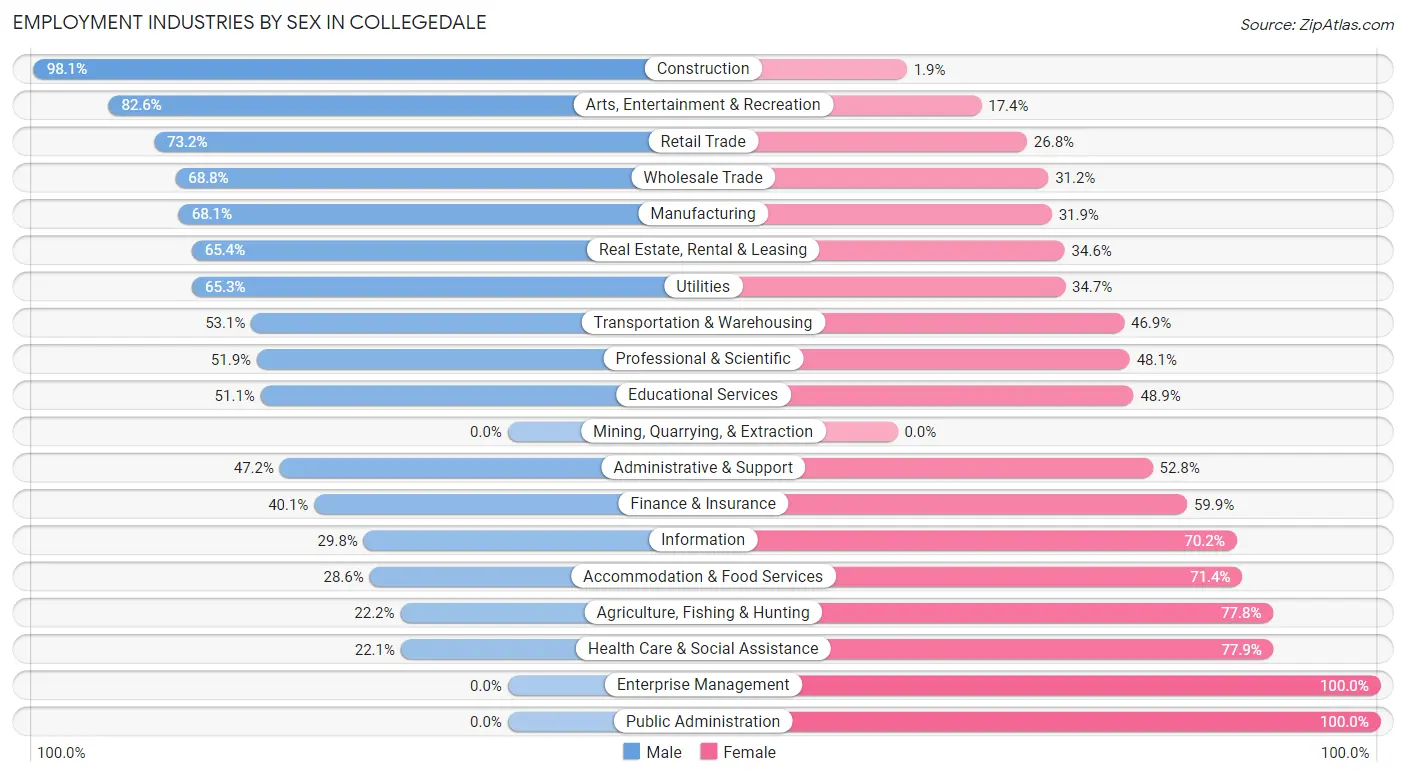
Employment Industries by Sex in Collegedale
The Collegedale industries that see more men than women are Construction (98.1%), Arts, Entertainment & Recreation (82.6%), and Retail Trade (73.2%), whereas the industries that tend to have a higher number of women are Enterprise Management (100.0%), Public Administration (100.0%), and Health Care & Social Assistance (77.9%).
| Industry | Male | Female |
| Agriculture, Fishing & Hunting | 18 (22.2%) | 63 (77.8%) |
| Mining, Quarrying, & Extraction | 0 (0.0%) | 0 (0.0%) |
| Construction | 256 (98.1%) | 5 (1.9%) |
| Manufacturing | 533 (68.1%) | 250 (31.9%) |
| Wholesale Trade | 205 (68.8%) | 93 (31.2%) |
| Retail Trade | 355 (73.2%) | 130 (26.8%) |
| Transportation & Warehousing | 129 (53.1%) | 114 (46.9%) |
| Utilities | 32 (65.3%) | 17 (34.7%) |
| Information | 17 (29.8%) | 40 (70.2%) |
| Finance & Insurance | 135 (40.1%) | 202 (59.9%) |
| Real Estate, Rental & Leasing | 34 (65.4%) | 18 (34.6%) |
| Professional & Scientific | 216 (51.9%) | 200 (48.1%) |
| Enterprise Management | 0 (0.0%) | 99 (100.0%) |
| Administrative & Support | 134 (47.2%) | 150 (52.8%) |
| Educational Services | 629 (51.1%) | 601 (48.9%) |
| Health Care & Social Assistance | 197 (22.1%) | 693 (77.9%) |
| Arts, Entertainment & Recreation | 100 (82.6%) | 21 (17.4%) |
| Accommodation & Food Services | 127 (28.6%) | 317 (71.4%) |
| Public Administration | 0 (0.0%) | 25 (100.0%) |
| Total | 3,174 (49.8%) | 3,201 (50.2%) |
Education in Collegedale
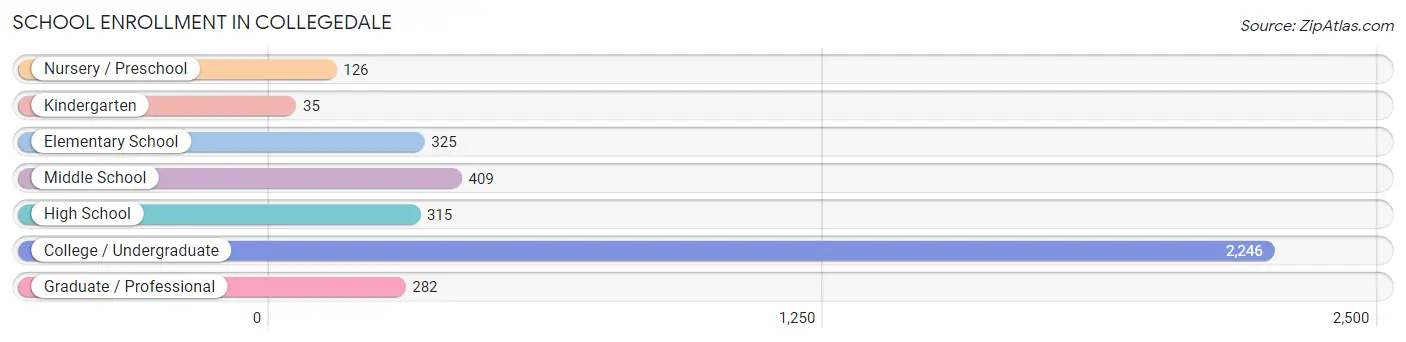
School Enrollment in Collegedale
The most common levels of schooling among the 3,738 students in Collegedale are college / undergraduate (2,246 | 60.1%), middle school (409 | 10.9%), and elementary school (325 | 8.7%).
| School Level | # Students | % Students |
| Nursery / Preschool | 126 | 3.4% |
| Kindergarten | 35 | 0.9% |
| Elementary School | 325 | 8.7% |
| Middle School | 409 | 10.9% |
| High School | 315 | 8.4% |
| College / Undergraduate | 2,246 | 60.1% |
| Graduate / Professional | 282 | 7.5% |
| Total | 3,738 | 100.0% |
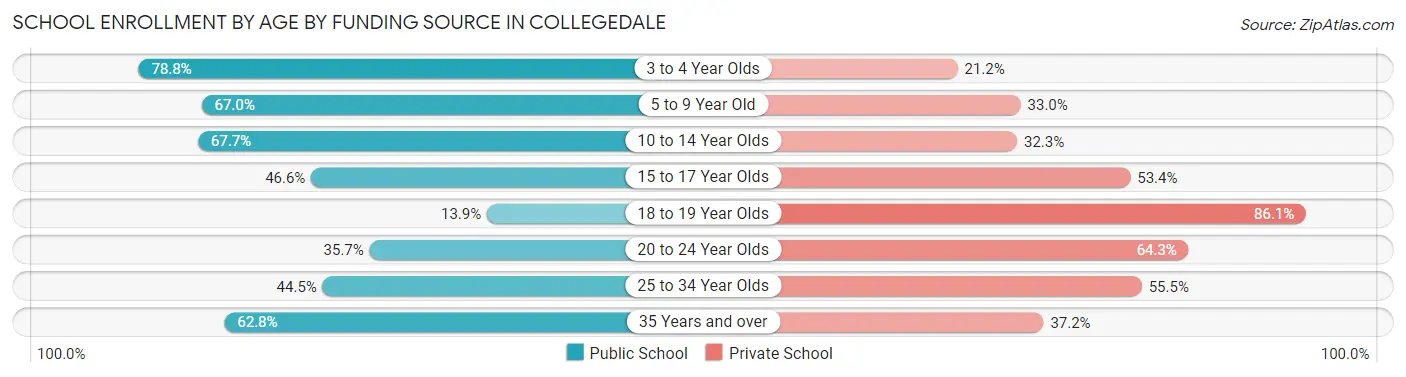
School Enrollment by Age by Funding Source in Collegedale
Out of a total of 3,738 students who are enrolled in schools in Collegedale, 2,243 (60.0%) attend a private institution, while the remaining 1,495 (40.0%) are enrolled in public schools. The age group of 18 to 19 year olds has the highest likelihood of being enrolled in private schools, with 926 (86.1% in the age bracket) enrolled. Conversely, the age group of 3 to 4 year olds has the lowest likelihood of being enrolled in a private school, with 52 (78.8% in the age bracket) attending a public institution.
| Age Bracket | Public School | Private School |
| 3 to 4 Year Olds | 52 (78.8%) | 14 (21.2%) |
| 5 to 9 Year Old | 242 (67.0%) | 119 (33.0%) |
| 10 to 14 Year Olds | 325 (67.7%) | 155 (32.3%) |
| 15 to 17 Year Olds | 145 (46.6%) | 166 (53.4%) |
| 18 to 19 Year Olds | 149 (13.9%) | 926 (86.1%) |
| 20 to 24 Year Olds | 341 (35.7%) | 613 (64.3%) |
| 25 to 34 Year Olds | 161 (44.5%) | 201 (55.5%) |
| 35 Years and over | 81 (62.8%) | 48 (37.2%) |
| Total | 1,495 (40.0%) | 2,243 (60.0%) |
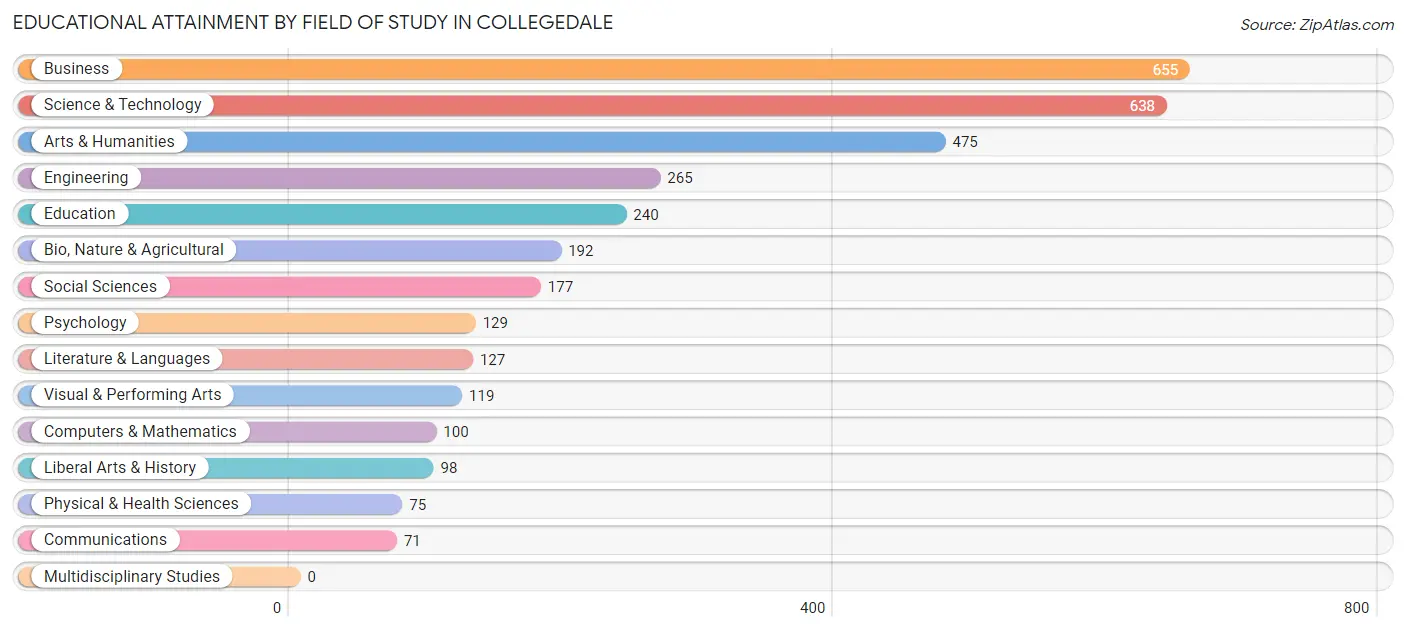
Educational Attainment by Field of Study in Collegedale
Business (655 | 19.5%), science & technology (638 | 19.0%), arts & humanities (475 | 14.1%), engineering (265 | 7.9%), and education (240 | 7.1%) are the most common fields of study among 3,361 individuals in Collegedale who have obtained a bachelor's degree or higher.
| Field of Study | # Graduates | % Graduates |
| Computers & Mathematics | 100 | 3.0% |
| Bio, Nature & Agricultural | 192 | 5.7% |
| Physical & Health Sciences | 75 | 2.2% |
| Psychology | 129 | 3.8% |
| Social Sciences | 177 | 5.3% |
| Engineering | 265 | 7.9% |
| Multidisciplinary Studies | 0 | 0.0% |
| Science & Technology | 638 | 19.0% |
| Business | 655 | 19.5% |
| Education | 240 | 7.1% |
| Literature & Languages | 127 | 3.8% |
| Liberal Arts & History | 98 | 2.9% |
| Visual & Performing Arts | 119 | 3.5% |
| Communications | 71 | 2.1% |
| Arts & Humanities | 475 | 14.1% |
| Total | 3,361 | 100.0% |
Transportation & Commute in Collegedale
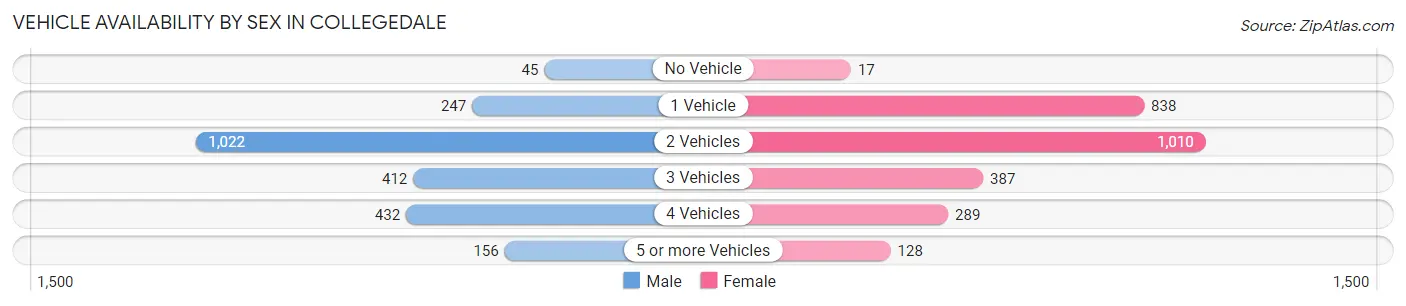
Vehicle Availability by Sex in Collegedale
The most prevalent vehicle ownership categories in Collegedale are males with 2 vehicles (1,022, accounting for 44.2%) and females with 2 vehicles (1,010, making up 38.3%).
| Vehicles Available | Male | Female |
| No Vehicle | 45 (1.9%) | 17 (0.6%) |
| 1 Vehicle | 247 (10.7%) | 838 (31.4%) |
| 2 Vehicles | 1,022 (44.2%) | 1,010 (37.8%) |
| 3 Vehicles | 412 (17.8%) | 387 (14.5%) |
| 4 Vehicles | 432 (18.7%) | 289 (10.8%) |
| 5 or more Vehicles | 156 (6.7%) | 128 (4.8%) |
| Total | 2,314 (100.0%) | 2,669 (100.0%) |
Commute Time in Collegedale
The most frequently occuring commute durations in Collegedale are 5 to 9 minutes (1,071 commuters, 20.3%), 30 to 34 minutes (816 commuters, 15.4%), and 10 to 14 minutes (768 commuters, 14.5%).
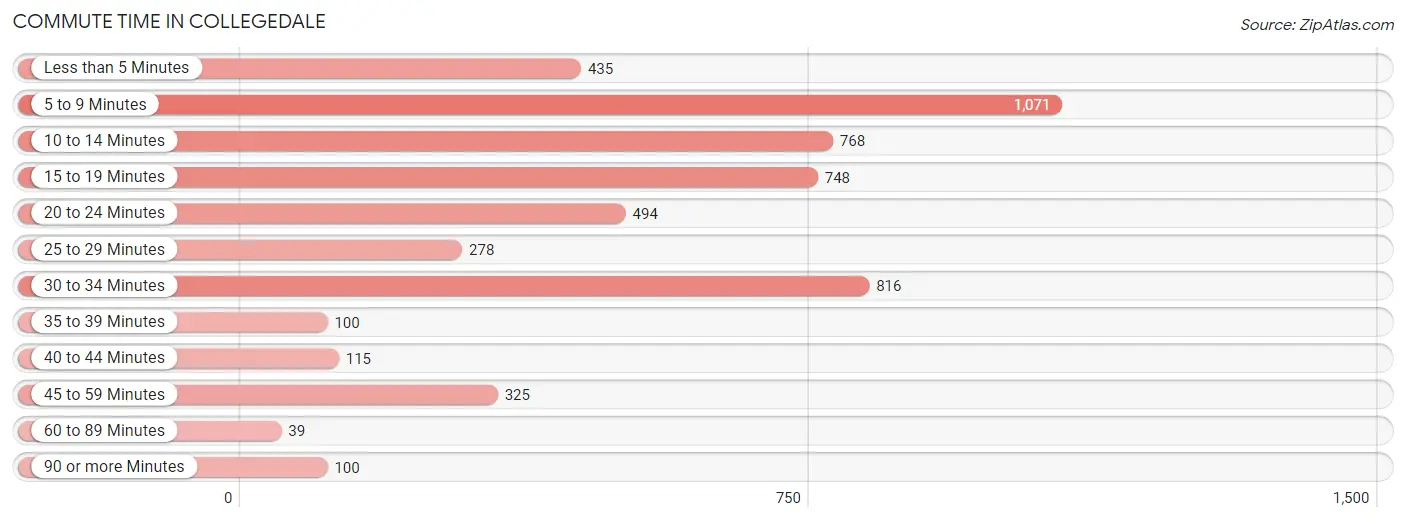
| Commute Time | # Commuters | % Commuters |
| Less than 5 Minutes | 435 | 8.2% |
| 5 to 9 Minutes | 1,071 | 20.3% |
| 10 to 14 Minutes | 768 | 14.5% |
| 15 to 19 Minutes | 748 | 14.1% |
| 20 to 24 Minutes | 494 | 9.3% |
| 25 to 29 Minutes | 278 | 5.3% |
| 30 to 34 Minutes | 816 | 15.4% |
| 35 to 39 Minutes | 100 | 1.9% |
| 40 to 44 Minutes | 115 | 2.2% |
| 45 to 59 Minutes | 325 | 6.1% |
| 60 to 89 Minutes | 39 | 0.7% |
| 90 or more Minutes | 100 | 1.9% |
Commute Time by Sex in Collegedale
The most common commute times in Collegedale are 30 to 34 minutes (478 commuters, 17.1%) for males and 5 to 9 minutes (672 commuters, 27.0%) for females.
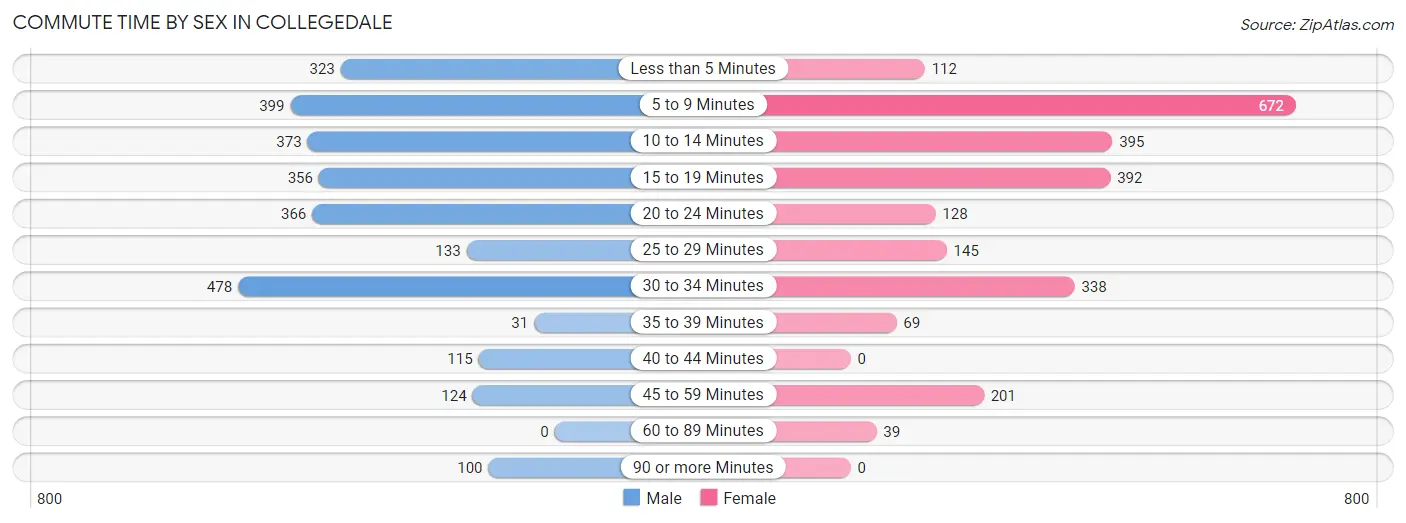
| Commute Time | Male | Female |
| Less than 5 Minutes | 323 (11.5%) | 112 (4.5%) |
| 5 to 9 Minutes | 399 (14.3%) | 672 (27.0%) |
| 10 to 14 Minutes | 373 (13.3%) | 395 (15.9%) |
| 15 to 19 Minutes | 356 (12.7%) | 392 (15.7%) |
| 20 to 24 Minutes | 366 (13.1%) | 128 (5.1%) |
| 25 to 29 Minutes | 133 (4.8%) | 145 (5.8%) |
| 30 to 34 Minutes | 478 (17.1%) | 338 (13.6%) |
| 35 to 39 Minutes | 31 (1.1%) | 69 (2.8%) |
| 40 to 44 Minutes | 115 (4.1%) | 0 (0.0%) |
| 45 to 59 Minutes | 124 (4.4%) | 201 (8.1%) |
| 60 to 89 Minutes | 0 (0.0%) | 39 (1.6%) |
| 90 or more Minutes | 100 (3.6%) | 0 (0.0%) |
Time of Departure to Work by Sex in Collegedale
The most frequent times of departure to work in Collegedale are 8:00 AM to 8:29 AM (645, 23.1%) for males and 12:00 PM to 3:59 PM (472, 19.0%) for females.
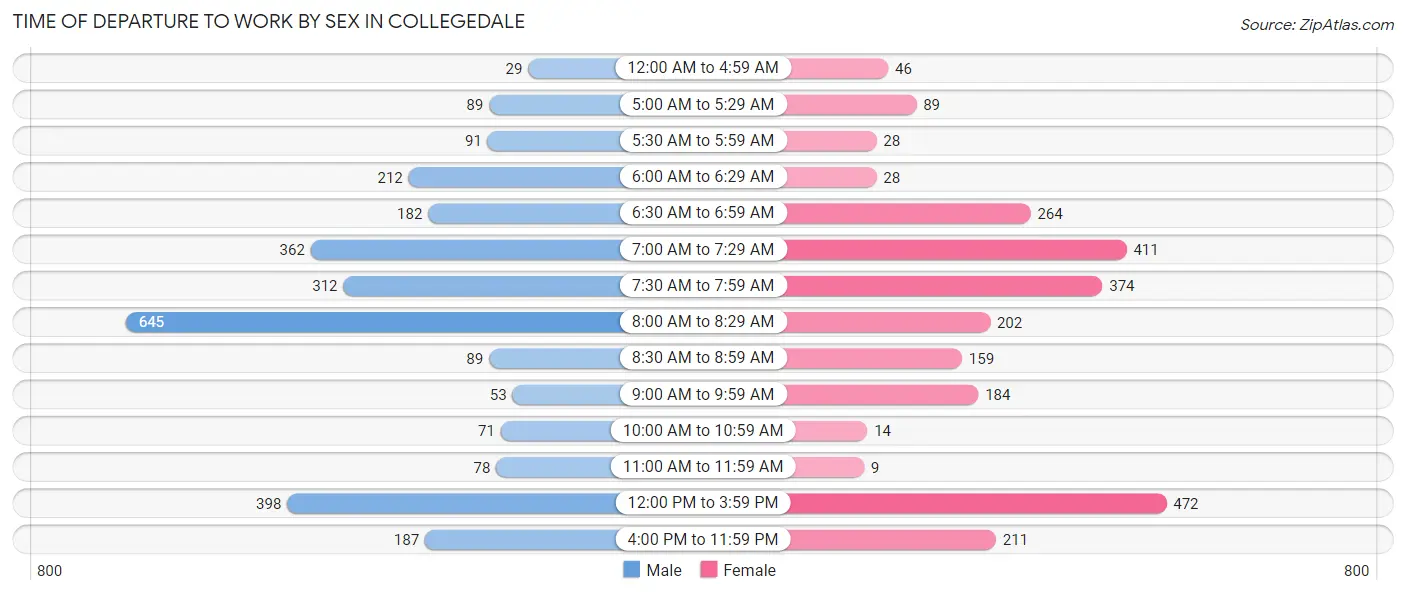
| Time of Departure | Male | Female |
| 12:00 AM to 4:59 AM | 29 (1.0%) | 46 (1.8%) |
| 5:00 AM to 5:29 AM | 89 (3.2%) | 89 (3.6%) |
| 5:30 AM to 5:59 AM | 91 (3.3%) | 28 (1.1%) |
| 6:00 AM to 6:29 AM | 212 (7.6%) | 28 (1.1%) |
| 6:30 AM to 6:59 AM | 182 (6.5%) | 264 (10.6%) |
| 7:00 AM to 7:29 AM | 362 (12.9%) | 411 (16.5%) |
| 7:30 AM to 7:59 AM | 312 (11.2%) | 374 (15.0%) |
| 8:00 AM to 8:29 AM | 645 (23.1%) | 202 (8.1%) |
| 8:30 AM to 8:59 AM | 89 (3.2%) | 159 (6.4%) |
| 9:00 AM to 9:59 AM | 53 (1.9%) | 184 (7.4%) |
| 10:00 AM to 10:59 AM | 71 (2.5%) | 14 (0.6%) |
| 11:00 AM to 11:59 AM | 78 (2.8%) | 9 (0.4%) |
| 12:00 PM to 3:59 PM | 398 (14.2%) | 472 (19.0%) |
| 4:00 PM to 11:59 PM | 187 (6.7%) | 211 (8.5%) |
| Total | 2,798 (100.0%) | 2,491 (100.0%) |
Housing Occupancy in Collegedale
Occupancy by Ownership in Collegedale
Of the total 4,155 dwellings in Collegedale, owner-occupied units account for 1,740 (41.9%), while renter-occupied units make up 2,415 (58.1%).
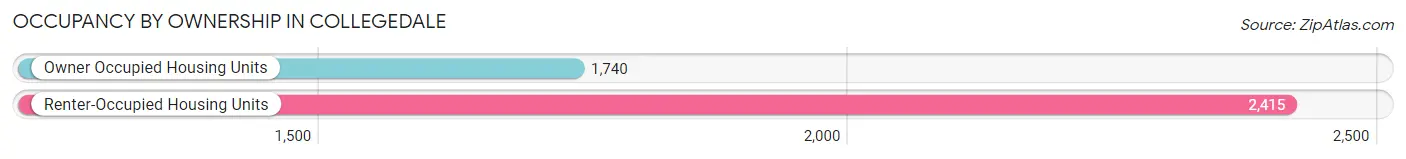
| Occupancy | # Housing Units | % Housing Units |
| Owner Occupied Housing Units | 1,740 | 41.9% |
| Renter-Occupied Housing Units | 2,415 | 58.1% |
| Total Occupied Housing Units | 4,155 | 100.0% |
Occupancy by Household Size in Collegedale
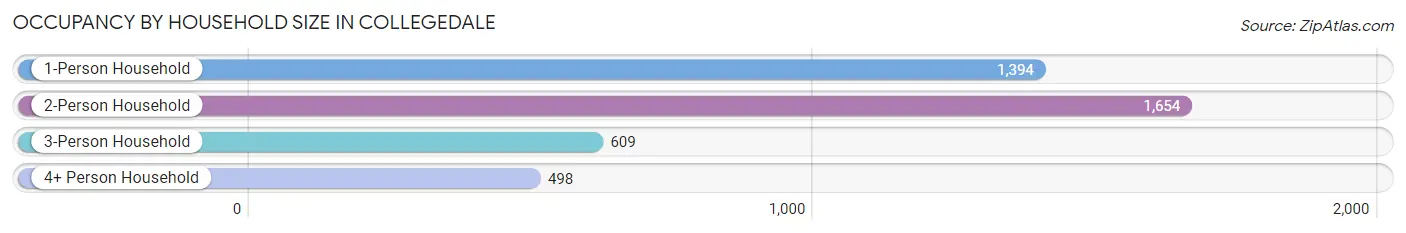
| Household Size | # Housing Units | % Housing Units |
| 1-Person Household | 1,394 | 33.6% |
| 2-Person Household | 1,654 | 39.8% |
| 3-Person Household | 609 | 14.7% |
| 4+ Person Household | 498 | 12.0% |
| Total Housing Units | 4,155 | 100.0% |
Occupancy by Ownership by Household Size in Collegedale
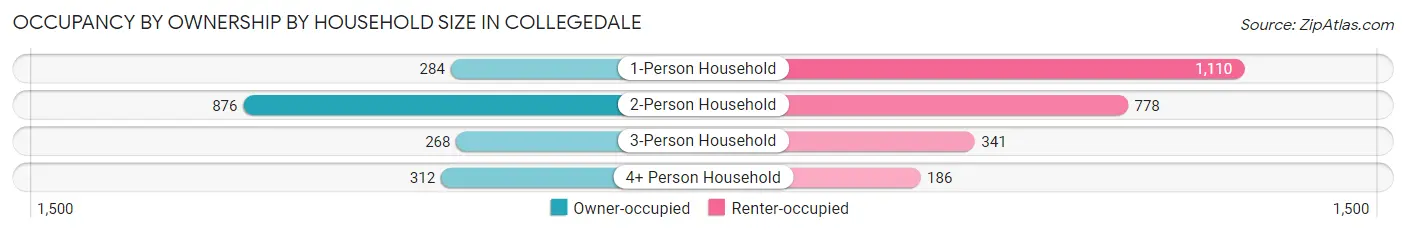
| Household Size | Owner-occupied | Renter-occupied |
| 1-Person Household | 284 (20.4%) | 1,110 (79.6%) |
| 2-Person Household | 876 (53.0%) | 778 (47.0%) |
| 3-Person Household | 268 (44.0%) | 341 (56.0%) |
| 4+ Person Household | 312 (62.6%) | 186 (37.3%) |
| Total Housing Units | 1,740 (41.9%) | 2,415 (58.1%) |
Occupancy by Educational Attainment in Collegedale
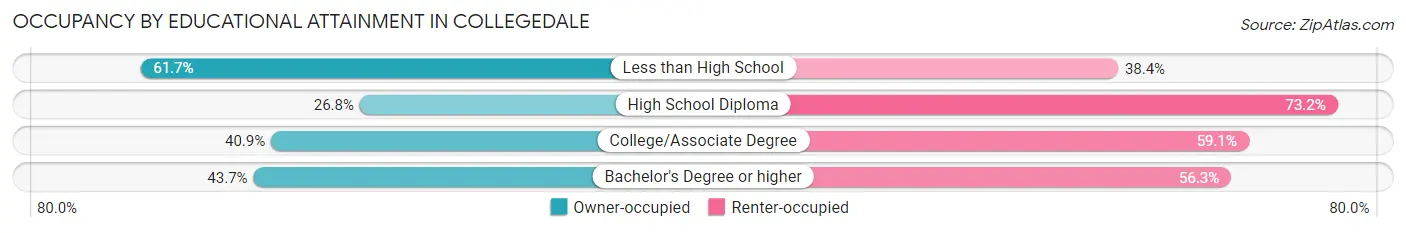
| Household Size | Owner-occupied | Renter-occupied |
| Less than High School | 164 (61.7%) | 102 (38.4%) |
| High School Diploma | 143 (26.8%) | 390 (73.2%) |
| College/Associate Degree | 495 (40.9%) | 715 (59.1%) |
| Bachelor's Degree or higher | 938 (43.7%) | 1,208 (56.3%) |
Occupancy by Age of Householder in Collegedale
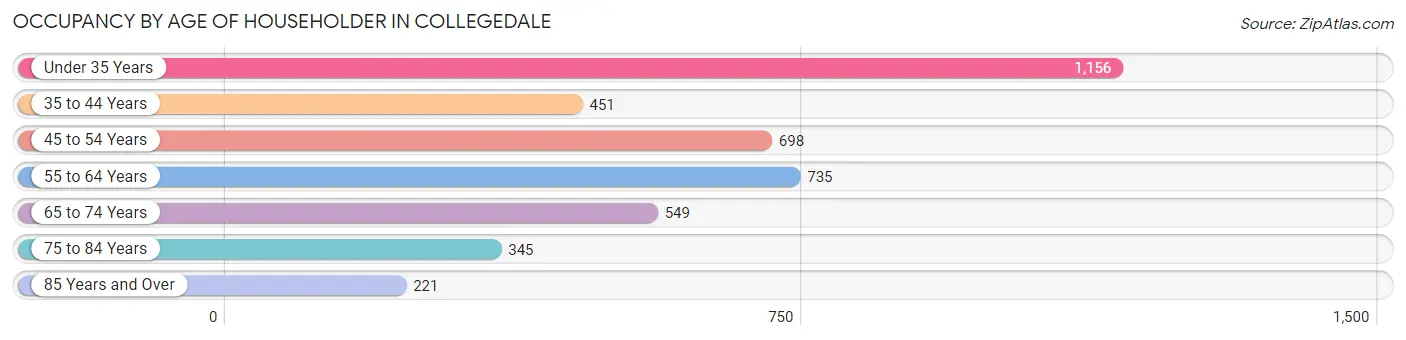
| Age Bracket | # Households | % Households |
| Under 35 Years | 1,156 | 27.8% |
| 35 to 44 Years | 451 | 10.8% |
| 45 to 54 Years | 698 | 16.8% |
| 55 to 64 Years | 735 | 17.7% |
| 65 to 74 Years | 549 | 13.2% |
| 75 to 84 Years | 345 | 8.3% |
| 85 Years and Over | 221 | 5.3% |
| Total | 4,155 | 100.0% |
Housing Finances in Collegedale
Median Income by Occupancy in Collegedale
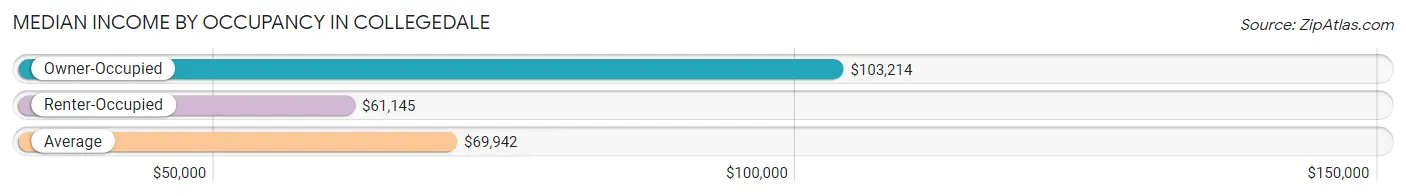
| Occupancy Type | # Households | Median Income |
| Owner-Occupied | 1,740 (41.9%) | $103,214 |
| Renter-Occupied | 2,415 (58.1%) | $61,145 |
| Average | 4,155 (100.0%) | $69,942 |
Occupancy by Householder Income Bracket in Collegedale
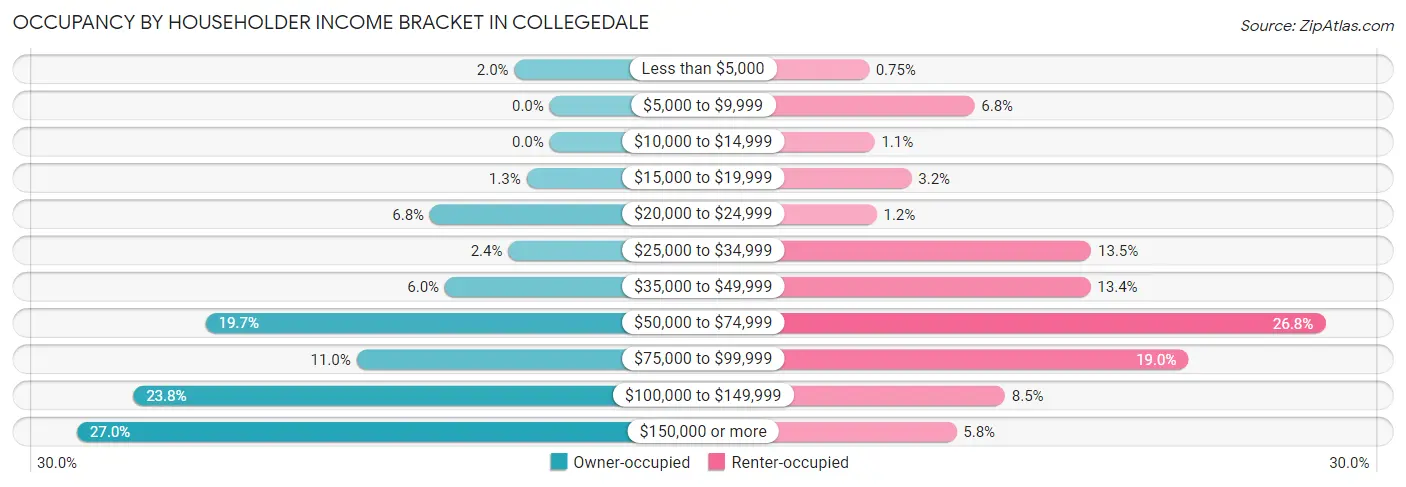
| Income Bracket | Owner-occupied | Renter-occupied |
| Less than $5,000 | 35 (2.0%) | 18 (0.7%) |
| $5,000 to $9,999 | 0 (0.0%) | 164 (6.8%) |
| $10,000 to $14,999 | 0 (0.0%) | 26 (1.1%) |
| $15,000 to $19,999 | 23 (1.3%) | 77 (3.2%) |
| $20,000 to $24,999 | 119 (6.8%) | 29 (1.2%) |
| $25,000 to $34,999 | 41 (2.4%) | 325 (13.5%) |
| $35,000 to $49,999 | 104 (6.0%) | 324 (13.4%) |
| $50,000 to $74,999 | 342 (19.7%) | 648 (26.8%) |
| $75,000 to $99,999 | 192 (11.0%) | 459 (19.0%) |
| $100,000 to $149,999 | 414 (23.8%) | 206 (8.5%) |
| $150,000 or more | 470 (27.0%) | 139 (5.8%) |
| Total | 1,740 (100.0%) | 2,415 (100.0%) |
Monthly Housing Cost Tiers in Collegedale
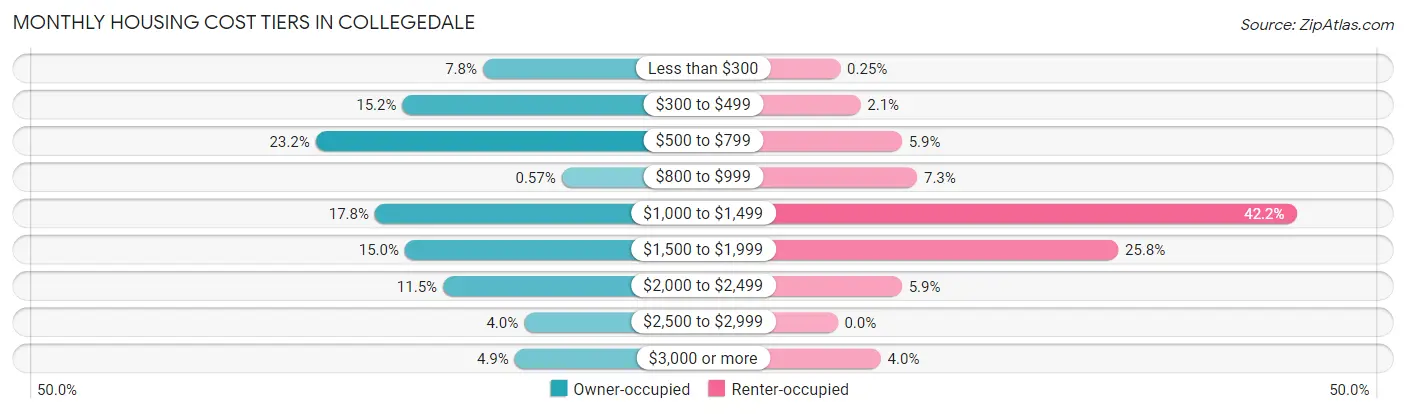
| Monthly Cost | Owner-occupied | Renter-occupied |
| Less than $300 | 136 (7.8%) | 6 (0.3%) |
| $300 to $499 | 265 (15.2%) | 51 (2.1%) |
| $500 to $799 | 404 (23.2%) | 143 (5.9%) |
| $800 to $999 | 10 (0.6%) | 177 (7.3%) |
| $1,000 to $1,499 | 309 (17.8%) | 1,020 (42.2%) |
| $1,500 to $1,999 | 261 (15.0%) | 624 (25.8%) |
| $2,000 to $2,499 | 200 (11.5%) | 143 (5.9%) |
| $2,500 to $2,999 | 70 (4.0%) | 0 (0.0%) |
| $3,000 or more | 85 (4.9%) | 96 (4.0%) |
| Total | 1,740 (100.0%) | 2,415 (100.0%) |
Physical Housing Characteristics in Collegedale
Housing Structures in Collegedale
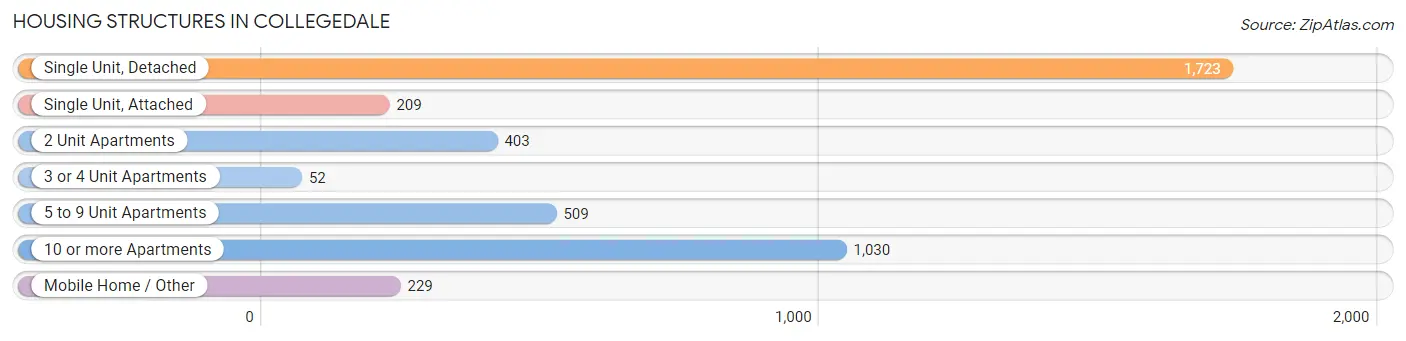
| Structure Type | # Housing Units | % Housing Units |
| Single Unit, Detached | 1,723 | 41.5% |
| Single Unit, Attached | 209 | 5.0% |
| 2 Unit Apartments | 403 | 9.7% |
| 3 or 4 Unit Apartments | 52 | 1.3% |
| 5 to 9 Unit Apartments | 509 | 12.2% |
| 10 or more Apartments | 1,030 | 24.8% |
| Mobile Home / Other | 229 | 5.5% |
| Total | 4,155 | 100.0% |
Housing Structures by Occupancy in Collegedale
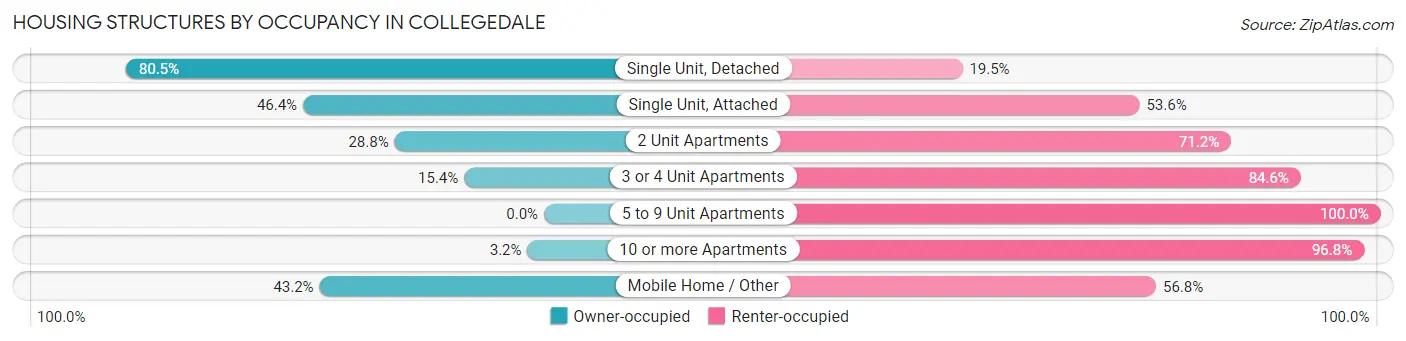
| Structure Type | Owner-occupied | Renter-occupied |
| Single Unit, Detached | 1,387 (80.5%) | 336 (19.5%) |
| Single Unit, Attached | 97 (46.4%) | 112 (53.6%) |
| 2 Unit Apartments | 116 (28.8%) | 287 (71.2%) |
| 3 or 4 Unit Apartments | 8 (15.4%) | 44 (84.6%) |
| 5 to 9 Unit Apartments | 0 (0.0%) | 509 (100.0%) |
| 10 or more Apartments | 33 (3.2%) | 997 (96.8%) |
| Mobile Home / Other | 99 (43.2%) | 130 (56.8%) |
| Total | 1,740 (41.9%) | 2,415 (58.1%) |
Housing Structures by Number of Rooms in Collegedale
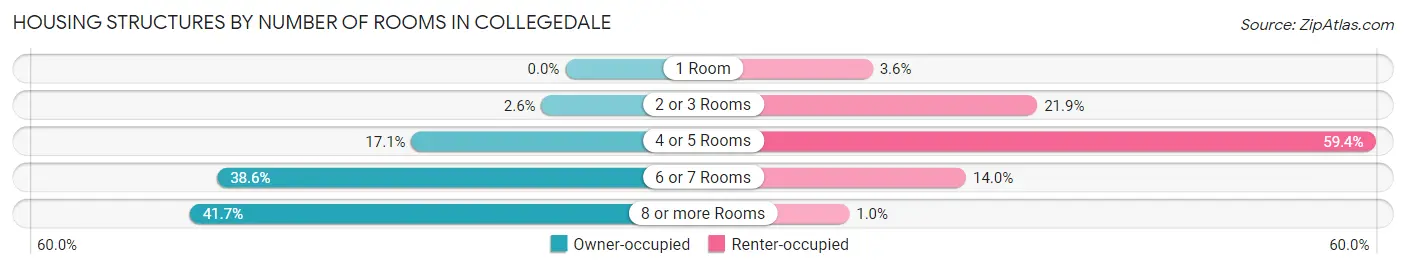
| Number of Rooms | Owner-occupied | Renter-occupied |
| 1 Room | 0 (0.0%) | 88 (3.6%) |
| 2 or 3 Rooms | 46 (2.6%) | 529 (21.9%) |
| 4 or 5 Rooms | 297 (17.1%) | 1,435 (59.4%) |
| 6 or 7 Rooms | 672 (38.6%) | 338 (14.0%) |
| 8 or more Rooms | 725 (41.7%) | 25 (1.0%) |
| Total | 1,740 (100.0%) | 2,415 (100.0%) |
Housing Structure by Heating Type in Collegedale
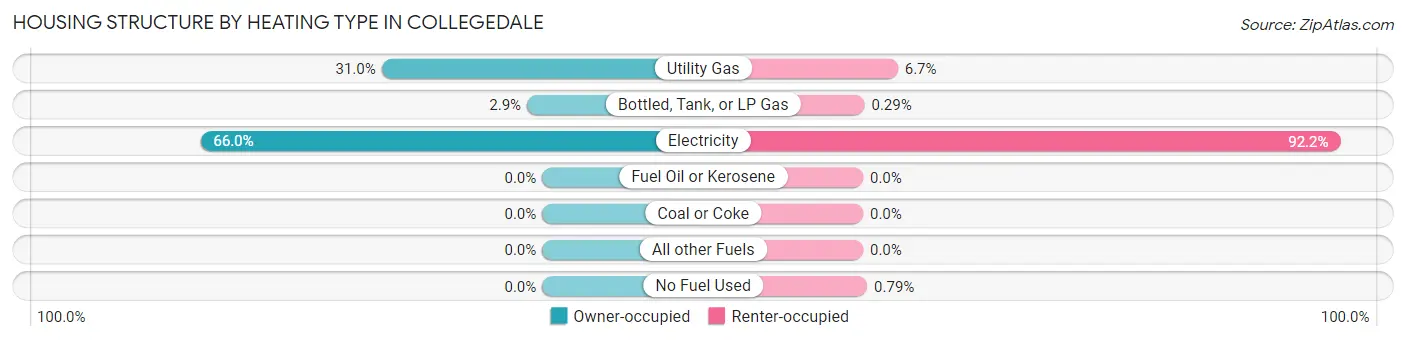
| Heating Type | Owner-occupied | Renter-occupied |
| Utility Gas | 540 (31.0%) | 162 (6.7%) |
| Bottled, Tank, or LP Gas | 51 (2.9%) | 7 (0.3%) |
| Electricity | 1,149 (66.0%) | 2,227 (92.2%) |
| Fuel Oil or Kerosene | 0 (0.0%) | 0 (0.0%) |
| Coal or Coke | 0 (0.0%) | 0 (0.0%) |
| All other Fuels | 0 (0.0%) | 0 (0.0%) |
| No Fuel Used | 0 (0.0%) | 19 (0.8%) |
| Total | 1,740 (100.0%) | 2,415 (100.0%) |
Household Vehicle Usage in Collegedale
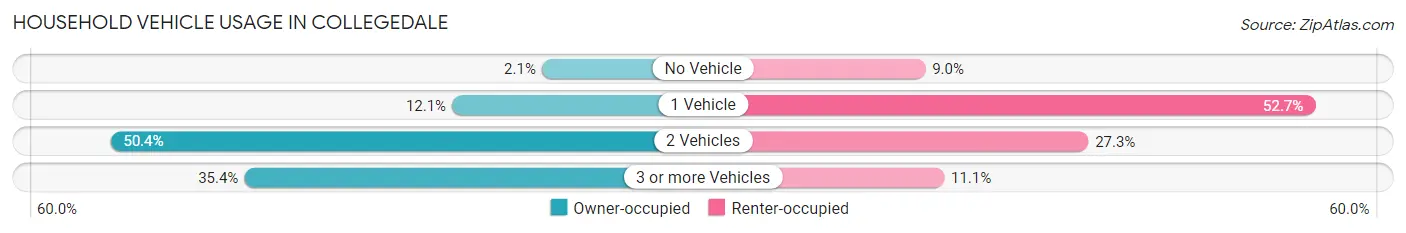
| Vehicles per Household | Owner-occupied | Renter-occupied |
| No Vehicle | 36 (2.1%) | 217 (9.0%) |
| 1 Vehicle | 211 (12.1%) | 1,272 (52.7%) |
| 2 Vehicles | 877 (50.4%) | 658 (27.3%) |
| 3 or more Vehicles | 616 (35.4%) | 268 (11.1%) |
| Total | 1,740 (100.0%) | 2,415 (100.0%) |
Real Estate & Mortgages in Collegedale
Real Estate and Mortgage Overview in Collegedale
| Characteristic | Without Mortgage | With Mortgage |
| Housing Units | 779 | 961 |
| Median Property Value | $331,000 | $332,000 |
| Median Household Income | $65,375 | $331 |
| Monthly Housing Costs | $498 | $85 |
| Real Estate Taxes | $2,419 | $0 |
Property Value by Mortgage Status in Collegedale
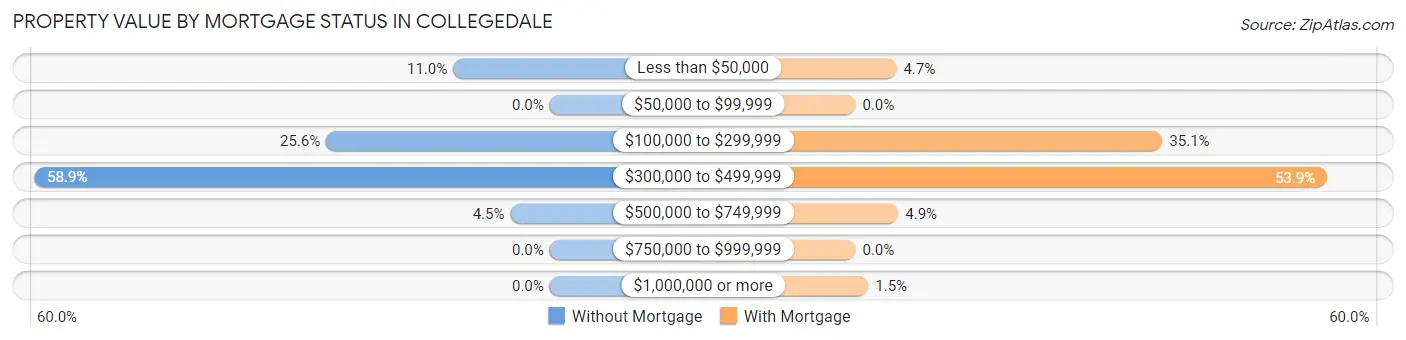
| Property Value | Without Mortgage | With Mortgage |
| Less than $50,000 | 86 (11.0%) | 45 (4.7%) |
| $50,000 to $99,999 | 0 (0.0%) | 0 (0.0%) |
| $100,000 to $299,999 | 199 (25.6%) | 337 (35.1%) |
| $300,000 to $499,999 | 459 (58.9%) | 518 (53.9%) |
| $500,000 to $749,999 | 35 (4.5%) | 47 (4.9%) |
| $750,000 to $999,999 | 0 (0.0%) | 0 (0.0%) |
| $1,000,000 or more | 0 (0.0%) | 14 (1.5%) |
| Total | 779 (100.0%) | 961 (100.0%) |
Household Income by Mortgage Status in Collegedale
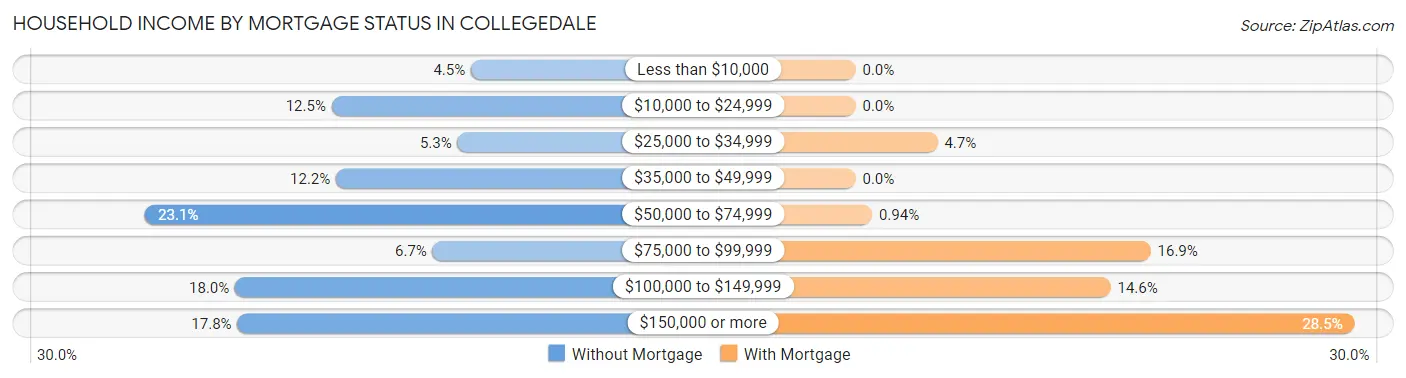
| Household Income | Without Mortgage | With Mortgage |
| Less than $10,000 | 35 (4.5%) | 0 (0.0%) |
| $10,000 to $24,999 | 97 (12.4%) | 0 (0.0%) |
| $25,000 to $34,999 | 41 (5.3%) | 45 (4.7%) |
| $35,000 to $49,999 | 95 (12.2%) | 0 (0.0%) |
| $50,000 to $74,999 | 180 (23.1%) | 9 (0.9%) |
| $75,000 to $99,999 | 52 (6.7%) | 162 (16.9%) |
| $100,000 to $149,999 | 140 (18.0%) | 140 (14.6%) |
| $150,000 or more | 139 (17.8%) | 274 (28.5%) |
| Total | 779 (100.0%) | 961 (100.0%) |
Property Value to Household Income Ratio in Collegedale
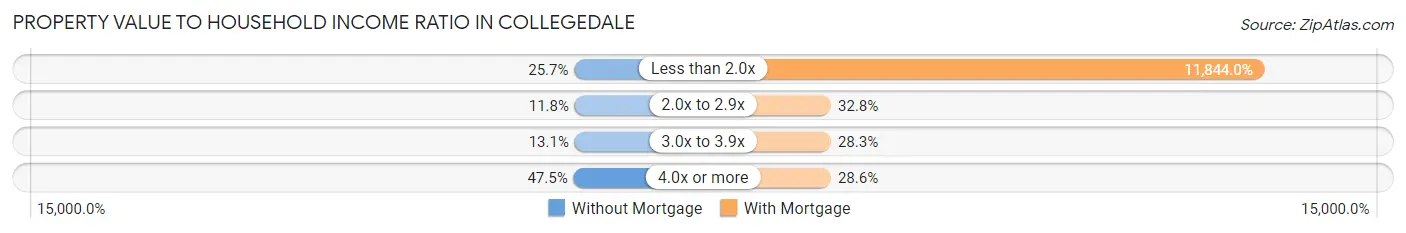
| Value-to-Income Ratio | Without Mortgage | With Mortgage |
| Less than 2.0x | 200 (25.7%) | 113,821 (11,844.0%) |
| 2.0x to 2.9x | 92 (11.8%) | 315 (32.8%) |
| 3.0x to 3.9x | 102 (13.1%) | 272 (28.3%) |
| 4.0x or more | 370 (47.5%) | 275 (28.6%) |
| Total | 779 (100.0%) | 961 (100.0%) |
Real Estate Taxes by Mortgage Status in Collegedale
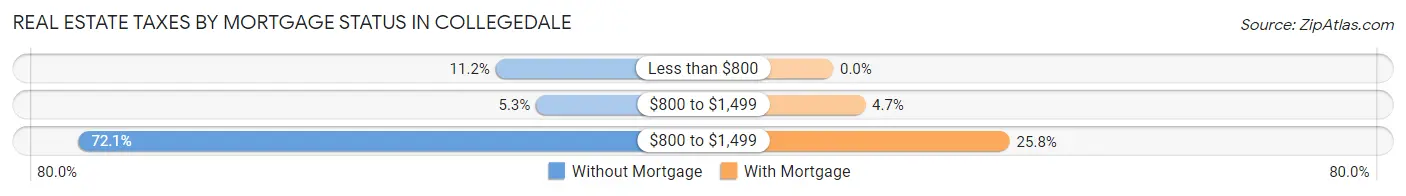
| Property Taxes | Without Mortgage | With Mortgage |
| Less than $800 | 87 (11.2%) | 0 (0.0%) |
| $800 to $1,499 | 41 (5.3%) | 45 (4.7%) |
| $800 to $1,499 | 562 (72.1%) | 248 (25.8%) |
| Total | 779 (100.0%) | 961 (100.0%) |
Health & Disability in Collegedale
Health Insurance Coverage by Age in Collegedale
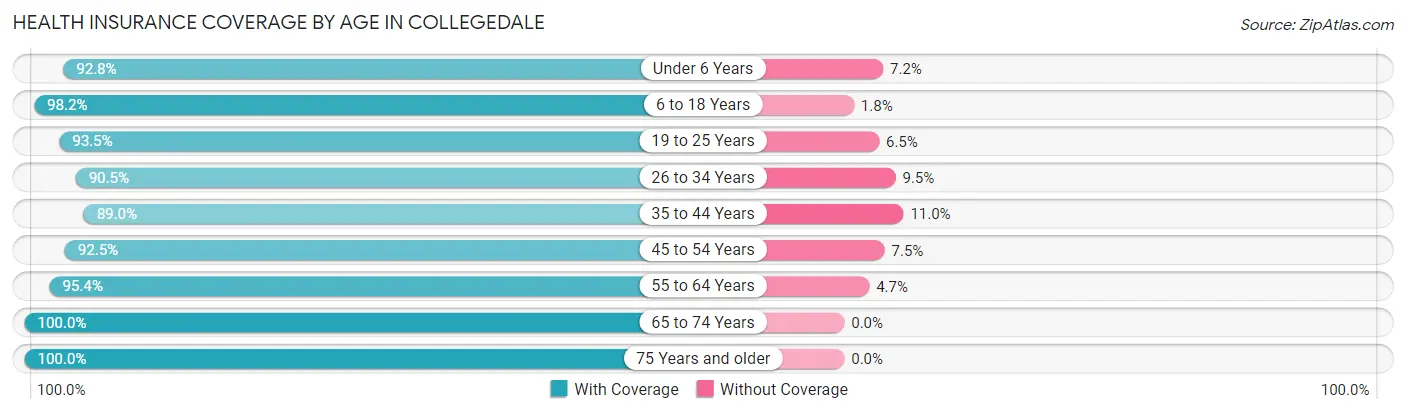
| Age Bracket | With Coverage | Without Coverage |
| Under 6 Years | 346 (92.8%) | 27 (7.2%) |
| 6 to 18 Years | 1,649 (98.2%) | 30 (1.8%) |
| 19 to 25 Years | 2,195 (93.5%) | 152 (6.5%) |
| 26 to 34 Years | 1,309 (90.5%) | 138 (9.5%) |
| 35 to 44 Years | 766 (89.0%) | 95 (11.0%) |
| 45 to 54 Years | 1,193 (92.5%) | 97 (7.5%) |
| 55 to 64 Years | 1,292 (95.4%) | 63 (4.6%) |
| 65 to 74 Years | 827 (100.0%) | 0 (0.0%) |
| 75 Years and older | 726 (100.0%) | 0 (0.0%) |
| Total | 10,303 (94.5%) | 602 (5.5%) |
Health Insurance Coverage by Citizenship Status in Collegedale
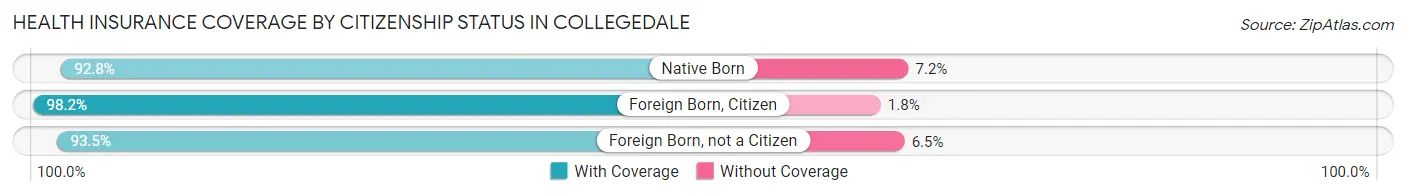
| Citizenship Status | With Coverage | Without Coverage |
| Native Born | 346 (92.8%) | 27 (7.2%) |
| Foreign Born, Citizen | 1,649 (98.2%) | 30 (1.8%) |
| Foreign Born, not a Citizen | 2,195 (93.5%) | 152 (6.5%) |
Health Insurance Coverage by Household Income in Collegedale
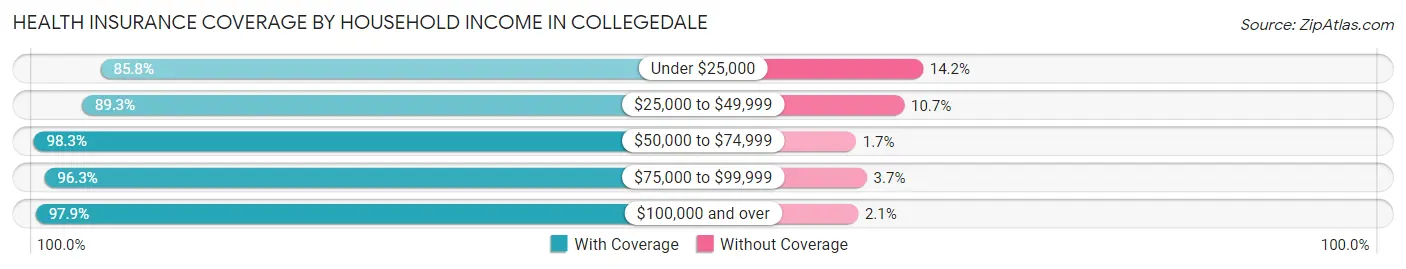
| Household Income | With Coverage | Without Coverage |
| Under $25,000 | 837 (85.8%) | 139 (14.2%) |
| $25,000 to $49,999 | 1,181 (89.3%) | 142 (10.7%) |
| $50,000 to $74,999 | 1,750 (98.3%) | 30 (1.7%) |
| $75,000 to $99,999 | 1,528 (96.3%) | 59 (3.7%) |
| $100,000 and over | 3,326 (97.9%) | 71 (2.1%) |
Public vs Private Health Insurance Coverage by Age in Collegedale
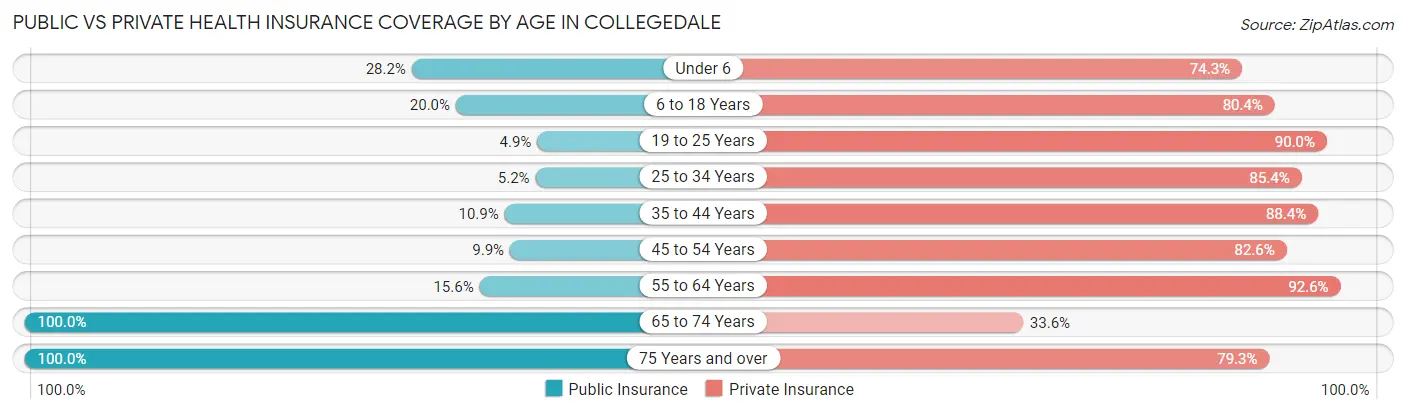
| Age Bracket | Public Insurance | Private Insurance |
| Under 6 | 105 (28.1%) | 277 (74.3%) |
| 6 to 18 Years | 335 (20.0%) | 1,349 (80.3%) |
| 19 to 25 Years | 114 (4.9%) | 2,113 (90.0%) |
| 25 to 34 Years | 75 (5.2%) | 1,235 (85.4%) |
| 35 to 44 Years | 94 (10.9%) | 761 (88.4%) |
| 45 to 54 Years | 128 (9.9%) | 1,065 (82.6%) |
| 55 to 64 Years | 211 (15.6%) | 1,254 (92.5%) |
| 65 to 74 Years | 827 (100.0%) | 278 (33.6%) |
| 75 Years and over | 726 (100.0%) | 576 (79.3%) |
| Total | 2,615 (24.0%) | 8,908 (81.7%) |
Disability Status by Sex by Age in Collegedale
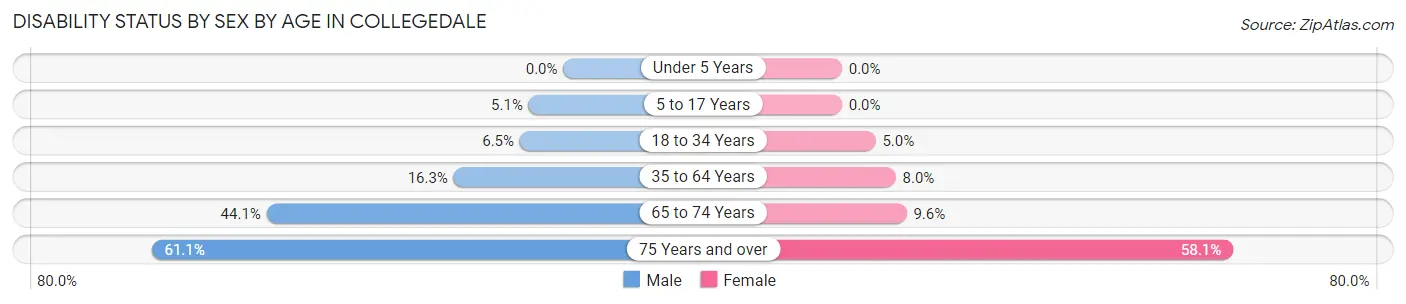
| Age Bracket | Male | Female |
| Under 5 Years | 0 (0.0%) | 0 (0.0%) |
| 5 to 17 Years | 31 (5.1%) | 0 (0.0%) |
| 18 to 34 Years | 142 (6.5%) | 110 (5.0%) |
| 35 to 64 Years | 261 (16.3%) | 152 (8.0%) |
| 65 to 74 Years | 167 (44.1%) | 43 (9.6%) |
| 75 Years and over | 225 (61.1%) | 208 (58.1%) |
Disability Class by Sex by Age in Collegedale
Disability Class: Hearing Difficulty
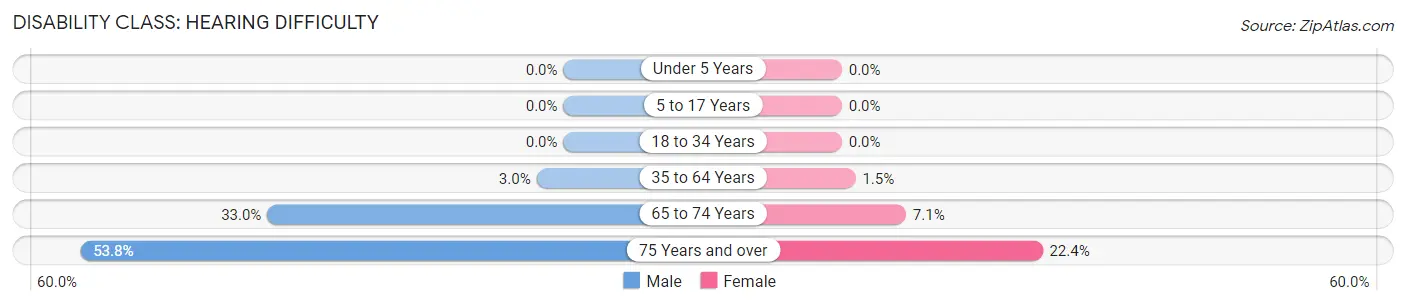
| Age Bracket | Male | Female |
| Under 5 Years | 0 (0.0%) | 0 (0.0%) |
| 5 to 17 Years | 0 (0.0%) | 0 (0.0%) |
| 18 to 34 Years | 0 (0.0%) | 0 (0.0%) |
| 35 to 64 Years | 48 (3.0%) | 29 (1.5%) |
| 65 to 74 Years | 125 (33.0%) | 32 (7.1%) |
| 75 Years and over | 198 (53.8%) | 80 (22.4%) |
Disability Class: Vision Difficulty
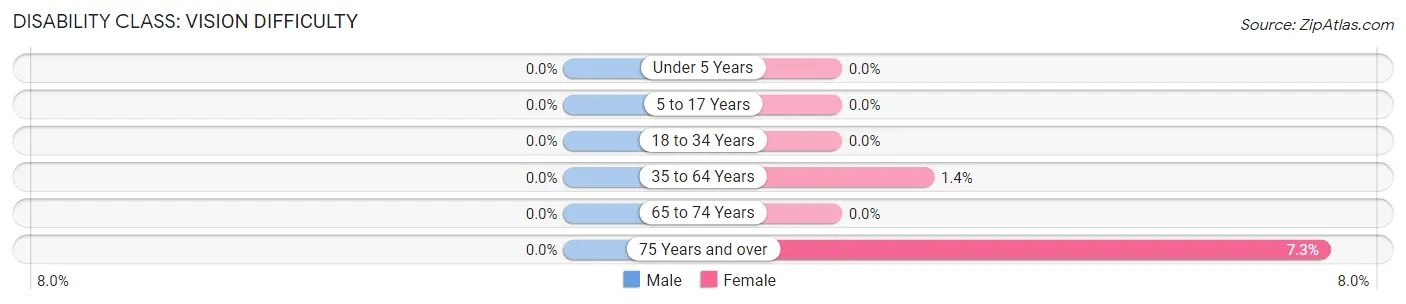
| Age Bracket | Male | Female |
| Under 5 Years | 0 (0.0%) | 0 (0.0%) |
| 5 to 17 Years | 0 (0.0%) | 0 (0.0%) |
| 18 to 34 Years | 0 (0.0%) | 0 (0.0%) |
| 35 to 64 Years | 0 (0.0%) | 26 (1.4%) |
| 65 to 74 Years | 0 (0.0%) | 0 (0.0%) |
| 75 Years and over | 0 (0.0%) | 26 (7.3%) |
Disability Class: Cognitive Difficulty
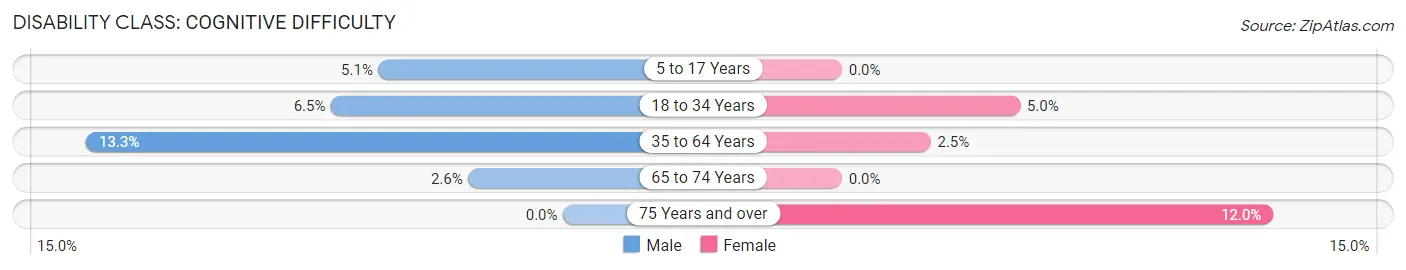
| Age Bracket | Male | Female |
| 5 to 17 Years | 31 (5.1%) | 0 (0.0%) |
| 18 to 34 Years | 142 (6.5%) | 109 (5.0%) |
| 35 to 64 Years | 213 (13.3%) | 47 (2.5%) |
| 65 to 74 Years | 10 (2.6%) | 0 (0.0%) |
| 75 Years and over | 0 (0.0%) | 43 (12.0%) |
Disability Class: Ambulatory Difficulty
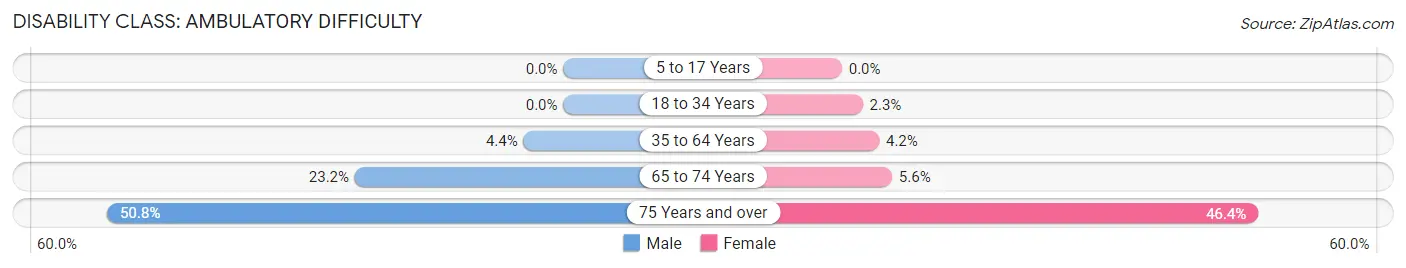
| Age Bracket | Male | Female |
| 5 to 17 Years | 0 (0.0%) | 0 (0.0%) |
| 18 to 34 Years | 0 (0.0%) | 51 (2.3%) |
| 35 to 64 Years | 71 (4.4%) | 79 (4.2%) |
| 65 to 74 Years | 88 (23.2%) | 25 (5.6%) |
| 75 Years and over | 187 (50.8%) | 166 (46.4%) |
Disability Class: Self-Care Difficulty
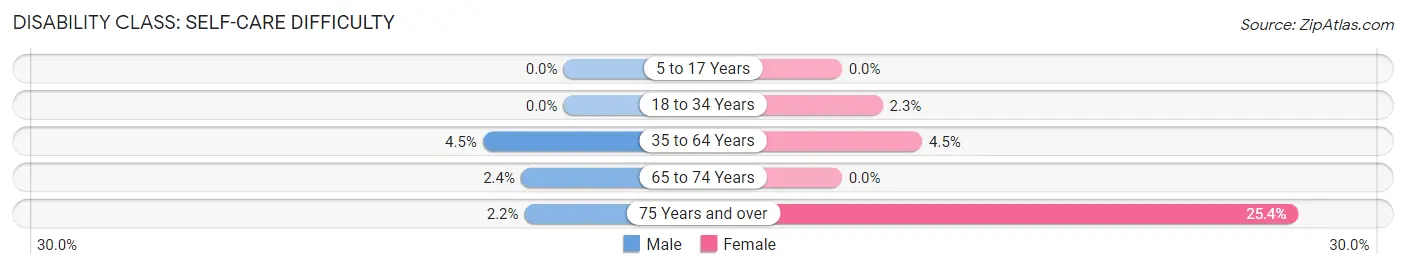
| Age Bracket | Male | Female |
| 5 to 17 Years | 0 (0.0%) | 0 (0.0%) |
| 18 to 34 Years | 0 (0.0%) | 50 (2.3%) |
| 35 to 64 Years | 72 (4.5%) | 85 (4.5%) |
| 65 to 74 Years | 9 (2.4%) | 0 (0.0%) |
| 75 Years and over | 8 (2.2%) | 91 (25.4%) |
Technology Access in Collegedale
Computing Device Access in Collegedale
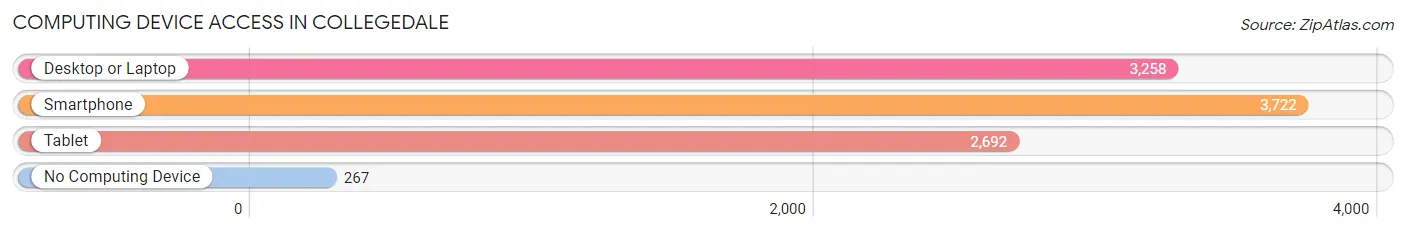
| Device Type | # Households | % Households |
| Desktop or Laptop | 3,258 | 78.4% |
| Smartphone | 3,722 | 89.6% |
| Tablet | 2,692 | 64.8% |
| No Computing Device | 267 | 6.4% |
| Total | 4,155 | 100.0% |
Internet Access in Collegedale
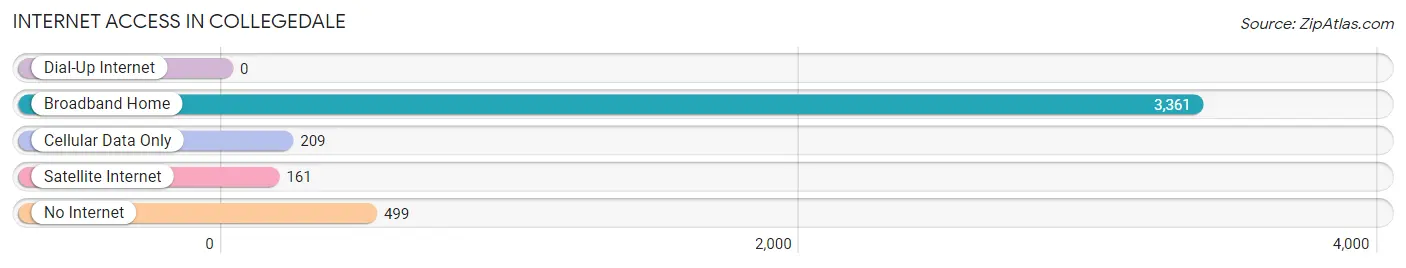
| Internet Type | # Households | % Households |
| Dial-Up Internet | 0 | 0.0% |
| Broadband Home | 3,361 | 80.9% |
| Cellular Data Only | 209 | 5.0% |
| Satellite Internet | 161 | 3.9% |
| No Internet | 499 | 12.0% |
| Total | 4,155 | 100.0% |
Collegedale Summary
Collegedale, Tennessee is a small city located in Hamilton County, just east of Chattanooga. It is a part of the Chattanooga metropolitan area and is home to Southern Adventist University. The city has a population of 8,282 as of the 2010 census.
History
Collegedale was founded in 1916 by the Southern Union Conference of Seventh-day Adventists. The city was named after the college that was established in the area, Southern Junior College, which later became Southern Adventist University. The college was established to provide higher education for the Seventh-day Adventist Church. The city was incorporated in 1968.
Geography
Collegedale is located in Hamilton County, Tennessee, just east of Chattanooga. It is situated in the foothills of the Appalachian Mountains and is part of the Chattanooga metropolitan area. The city has a total area of 8.3 square miles, all of which is land. The city is located at an elevation of 1,000 feet above sea level.
Economy
The economy of Collegedale is largely driven by the presence of Southern Adventist University. The university is the largest employer in the city, providing jobs for over 1,000 people. Other major employers in the city include the Collegedale Market, Collegedale Public Schools, and the Collegedale Medical Center. The city also has a number of small businesses, including restaurants, retail stores, and professional services.
Demographics
As of the 2010 census, Collegedale had a population of 8,282. The racial makeup of the city was 87.3% White, 5.2% African American, 0.3% Native American, 2.2% Asian, 0.1% Pacific Islander, 1.7% from other races, and 3.3% from two or more races. Hispanic or Latino of any race were 4.2% of the population.
The median income for a household in Collegedale was $50,945, and the median income for a family was $62,917. The per capita income for the city was $25,945. About 8.2% of families and 11.2% of the population were below the poverty line, including 14.2% of those under age 18 and 5.2% of those age 65 or over.
Common Questions
What is Per Capita Income in Collegedale?
Per Capita income in Collegedale is $35,881.
What is the Median Family Income in Collegedale?
Median Family Income in Collegedale is $81,938.
What is the Median Household income in Collegedale?
Median Household Income in Collegedale is $69,942.
What is Income or Wage Gap in Collegedale?
Income or Wage Gap in Collegedale is 40.7%.
Women in Collegedale earn 59.3 cents for every dollar earned by a man.
What is Inequality or Gini Index in Collegedale?
Inequality or Gini Index in Collegedale is 0.42.
What is the Total Population of Collegedale?
Total Population of Collegedale is 11,001.
What is the Total Male Population of Collegedale?
Total Male Population of Collegedale is 5,371.
What is the Total Female Population of Collegedale?
Total Female Population of Collegedale is 5,630.
What is the Ratio of Males per 100 Females in Collegedale?
There are 95.40 Males per 100 Females in Collegedale.
What is the Ratio of Females per 100 Males in Collegedale?
There are 104.82 Females per 100 Males in Collegedale.
What is the Median Population Age in Collegedale?
Median Population Age in Collegedale is 32.8 Years.
What is the Average Family Size in Collegedale
Average Family Size in Collegedale is 2.8 People.
What is the Average Household Size in Collegedale
Average Household Size in Collegedale is 2.2 People.
How Large is the Labor Force in Collegedale?
There are 6,554 People in the Labor Forcein in Collegedale.
What is the Percentage of People in the Labor Force in Collegedale?
67.5% of People are in the Labor Force in Collegedale.
What is the Unemployment Rate in Collegedale?
Unemployment Rate in Collegedale is 2.7%.