Forest Hills, TN Map & Demographics
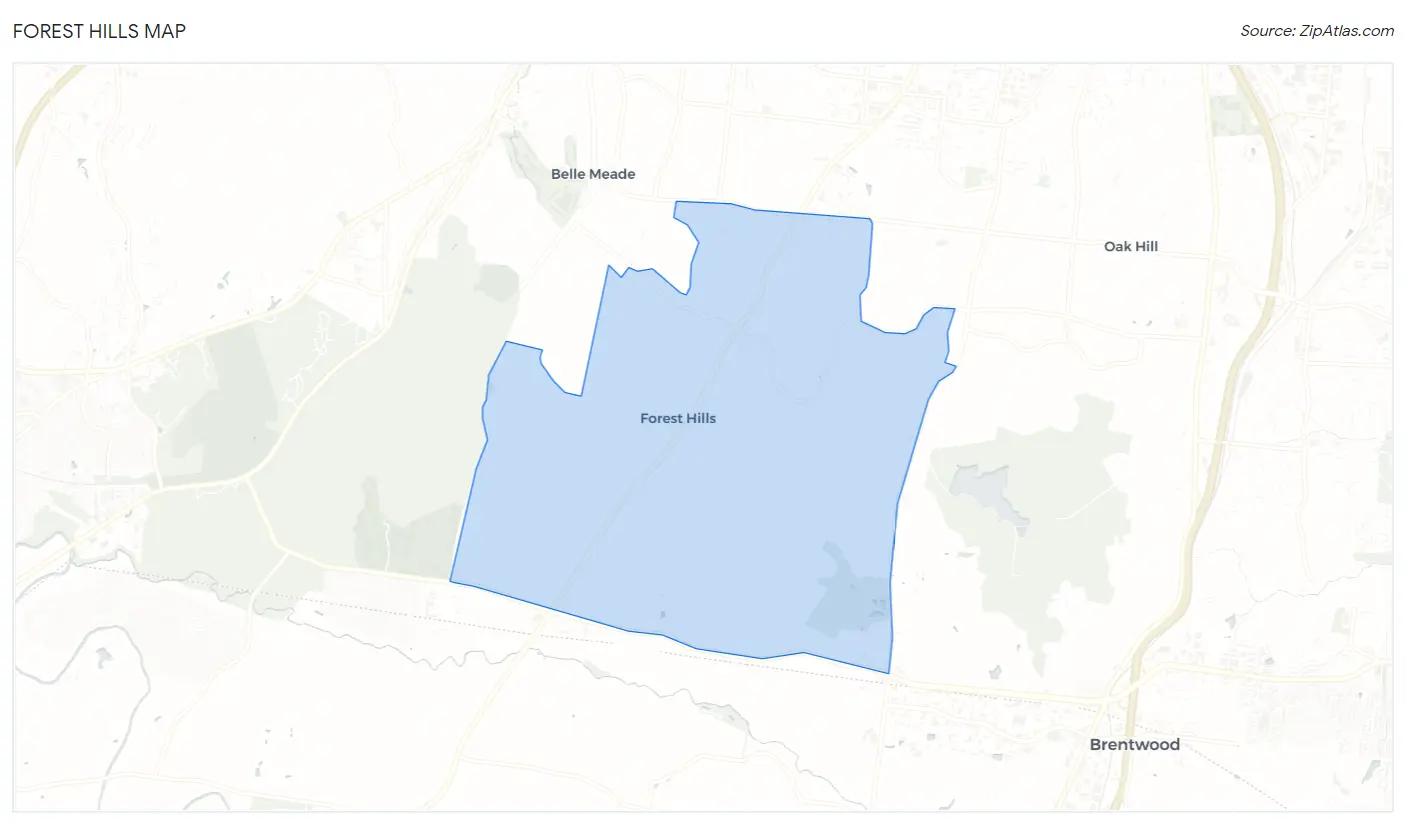
Forest Hills Map
Forest Hills Overview
$138,286
PER CAPITA INCOME
$250,001
AVG FAMILY INCOME
$239,643
AVG HOUSEHOLD INCOME
59.8%
WAGE / INCOME GAP [ % ]
40.2¢/ $1
WAGE / INCOME GAP [ $ ]
$19,504
FAMILY INCOME DEFICIT
0.51
INEQUALITY / GINI INDEX
4,922
TOTAL POPULATION
2,467
MALE POPULATION
2,455
FEMALE POPULATION
100.49
MALES / 100 FEMALES
99.51
FEMALES / 100 MALES
48.6
MEDIAN AGE
3.0
AVG FAMILY SIZE
2.7
AVG HOUSEHOLD SIZE
2,259
LABOR FORCE [ PEOPLE ]
57.4%
PERCENT IN LABOR FORCE
1.2%
UNEMPLOYMENT RATE
Forest Hills Area Codes
Income in Forest Hills
Income Overview in Forest Hills
Per Capita Income in Forest Hills is $138,286, while median incomes of families and households are $250,001 and $239,643 respectively.
| Characteristic | Number | Measure |
| Per Capita Income | 4,922 | $138,286 |
| Median Family Income | 1,448 | $250,001 |
| Mean Family Income | 1,448 | $408,168 |
| Median Household Income | 1,798 | $239,643 |
| Mean Household Income | 1,798 | $362,454 |
| Income Deficit | 1,448 | $19,504 |
| Wage / Income Gap (%) | 4,922 | 59.79% |
| Wage / Income Gap ($) | 4,922 | 40.21¢ per $1 |
| Gini / Inequality Index | 4,922 | 0.51 |
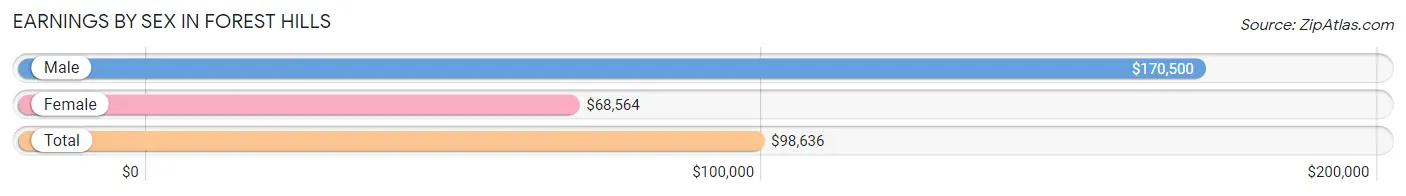
Earnings by Sex in Forest Hills
Average Earnings in Forest Hills are $98,636, $170,500 for men and $68,564 for women, a difference of 59.8%.
| Sex | Number | Average Earnings |
| Male | 1,546 (62.1%) | $170,500 |
| Female | 944 (37.9%) | $68,564 |
| Total | 2,490 (100.0%) | $98,636 |
Earnings by Sex by Income Bracket in Forest Hills
The most common earnings brackets in Forest Hills are $100,000+ for men (906 | 58.6%) and $100,000+ for women (321 | 34.0%).
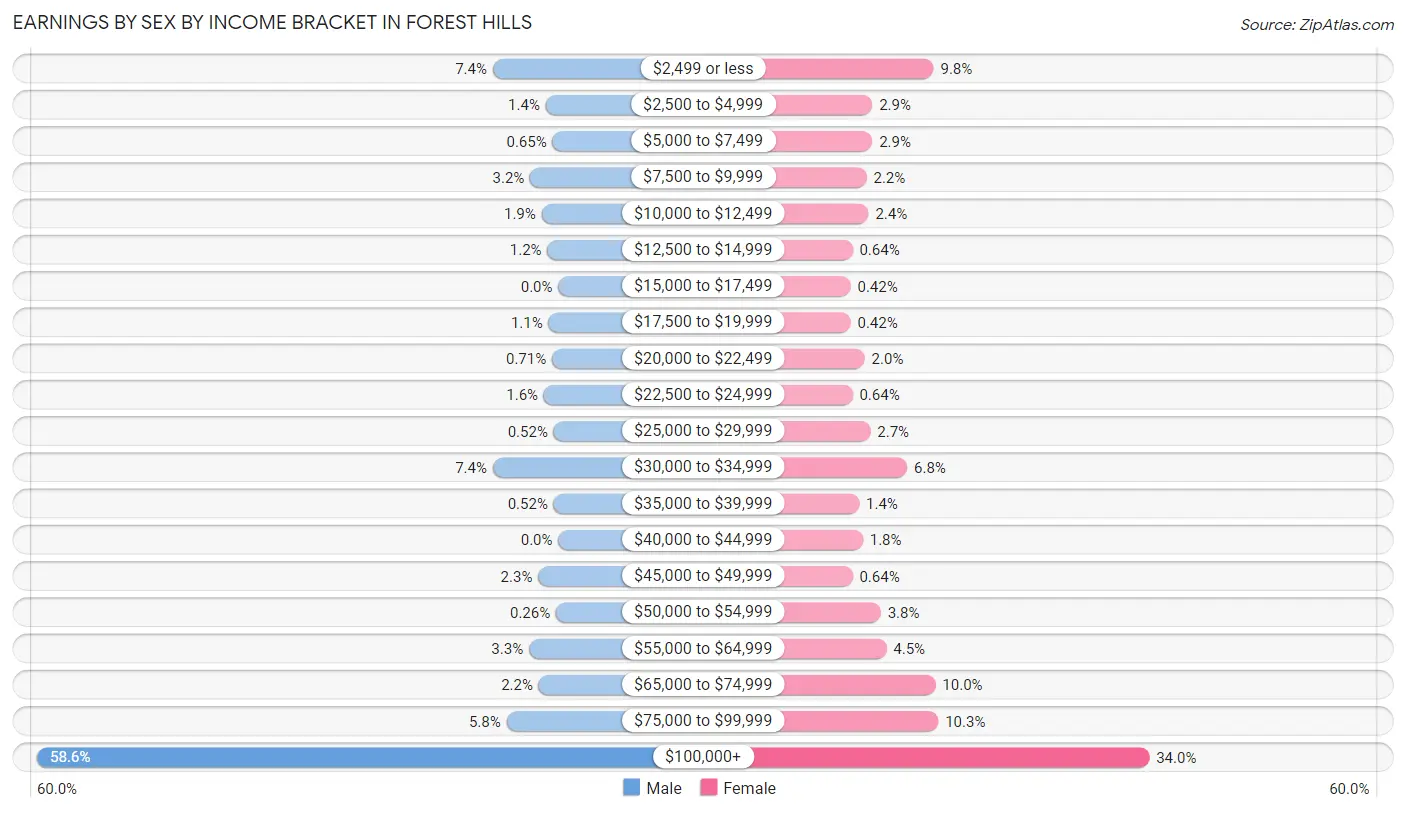
| Income | Male | Female |
| $2,499 or less | 114 (7.4%) | 92 (9.8%) |
| $2,500 to $4,999 | 22 (1.4%) | 27 (2.9%) |
| $5,000 to $7,499 | 10 (0.6%) | 27 (2.9%) |
| $7,500 to $9,999 | 49 (3.2%) | 21 (2.2%) |
| $10,000 to $12,499 | 29 (1.9%) | 23 (2.4%) |
| $12,500 to $14,999 | 19 (1.2%) | 6 (0.6%) |
| $15,000 to $17,499 | 0 (0.0%) | 4 (0.4%) |
| $17,500 to $19,999 | 17 (1.1%) | 4 (0.4%) |
| $20,000 to $22,499 | 11 (0.7%) | 19 (2.0%) |
| $22,500 to $24,999 | 25 (1.6%) | 6 (0.6%) |
| $25,000 to $29,999 | 8 (0.5%) | 25 (2.6%) |
| $30,000 to $34,999 | 114 (7.4%) | 64 (6.8%) |
| $35,000 to $39,999 | 8 (0.5%) | 13 (1.4%) |
| $40,000 to $44,999 | 0 (0.0%) | 17 (1.8%) |
| $45,000 to $49,999 | 35 (2.3%) | 6 (0.6%) |
| $50,000 to $54,999 | 4 (0.3%) | 36 (3.8%) |
| $55,000 to $64,999 | 51 (3.3%) | 42 (4.4%) |
| $65,000 to $74,999 | 34 (2.2%) | 94 (10.0%) |
| $75,000 to $99,999 | 90 (5.8%) | 97 (10.3%) |
| $100,000+ | 906 (58.6%) | 321 (34.0%) |
| Total | 1,546 (100.0%) | 944 (100.0%) |
Earnings by Sex by Educational Attainment in Forest Hills
Average earnings in Forest Hills are $204,018 for men and $69,574 for women, a difference of 65.9%. Men with an educational attainment of graduate degree enjoy the highest average annual earnings of $250,001, while those with bachelor's degree education earn the least with $161,188. Women with an educational attainment of college or associate's degree earn the most with the average annual earnings of $102,875, while those with bachelor's degree education have the smallest earnings of $69,043.
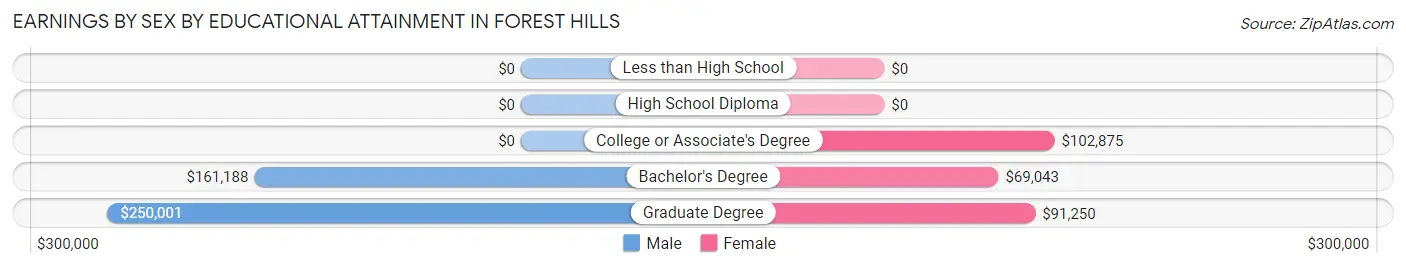
| Educational Attainment | Male Income | Female Income |
| Less than High School | - | - |
| High School Diploma | - | - |
| College or Associate's Degree | - | - |
| Bachelor's Degree | $161,188 | $69,043 |
| Graduate Degree | $250,001 | $91,250 |
| Total | $204,018 | $69,574 |
Family Income in Forest Hills
Family Income Brackets in Forest Hills
According to the Forest Hills family income data, there are 933 families falling into the $200,000+ income range, which is the most common income bracket and makes up 64.4% of all families.
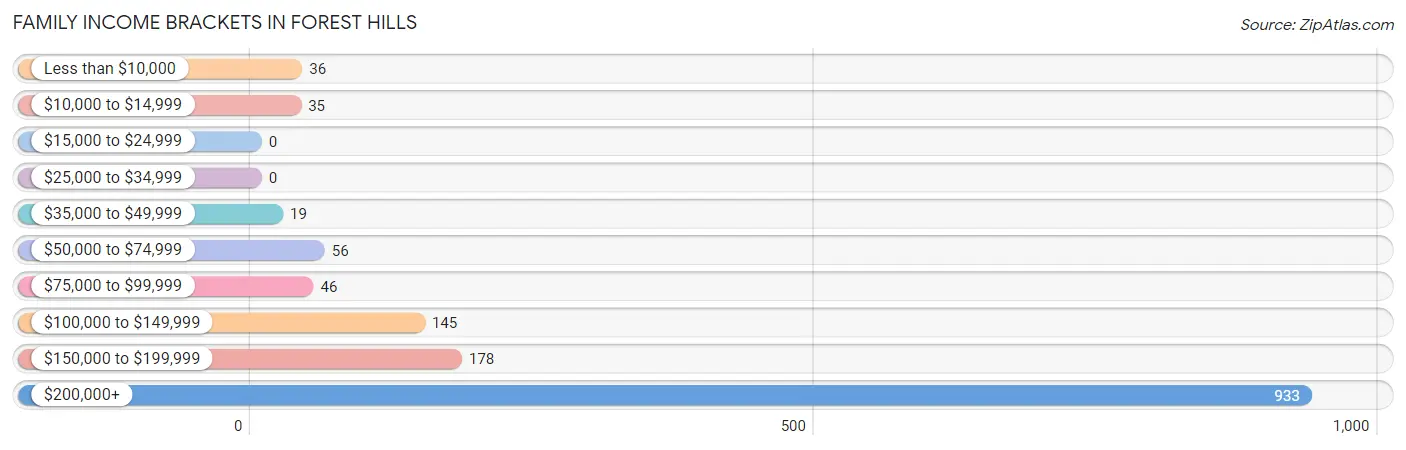
| Income Bracket | # Families | % Families |
| Less than $10,000 | 36 | 2.5% |
| $10,000 to $14,999 | 35 | 2.4% |
| $15,000 to $24,999 | 0 | 0.0% |
| $25,000 to $34,999 | 0 | 0.0% |
| $35,000 to $49,999 | 19 | 1.3% |
| $50,000 to $74,999 | 56 | 3.9% |
| $75,000 to $99,999 | 46 | 3.2% |
| $100,000 to $149,999 | 145 | 10.0% |
| $150,000 to $199,999 | 178 | 12.3% |
| $200,000+ | 933 | 64.4% |
Family Income by Famaliy Size in Forest Hills
2-person families (713 | 49.2%) account for the highest median family income in Forest Hills with $250,001 per family, while 2-person families (713 | 49.2%) have the highest median income of $125,000 per family member.
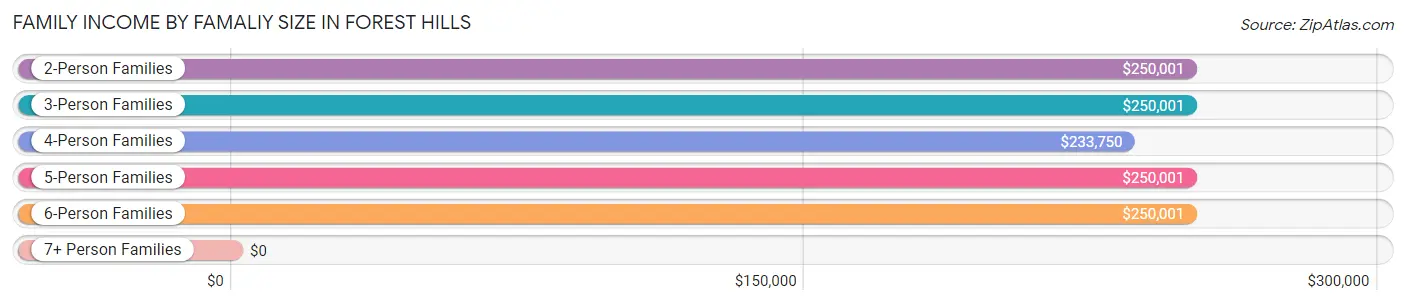
| Income Bracket | # Families | Median Income |
| 2-Person Families | 713 (49.2%) | $250,001 |
| 3-Person Families | 253 (17.5%) | $250,001 |
| 4-Person Families | 336 (23.2%) | $233,750 |
| 5-Person Families | 129 (8.9%) | $250,001 |
| 6-Person Families | 17 (1.2%) | $250,001 |
| 7+ Person Families | 0 (0.0%) | $0 |
| Total | 1,448 (100.0%) | $250,001 |
Family Income by Number of Earners in Forest Hills
The median family income in Forest Hills is $250,001, with families comprising no earners (200) having the highest median family income of $250,001, while families with 1 earner (571) have the lowest median family income of $232,730, accounting for 13.8% and 39.4% of families, respectively.
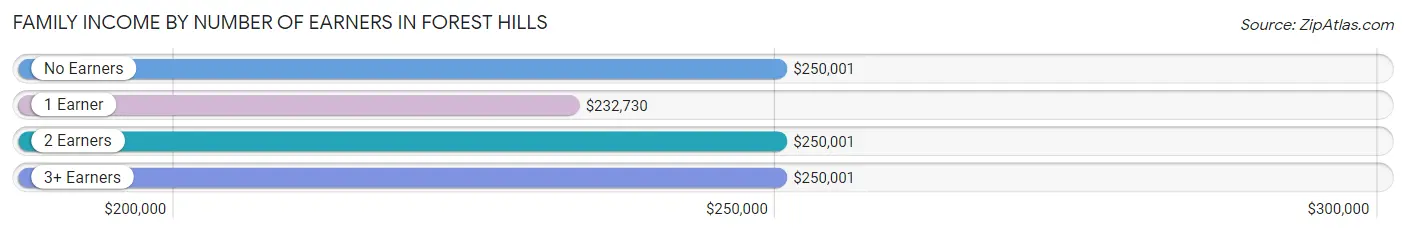
| Number of Earners | # Families | Median Income |
| No Earners | 200 (13.8%) | $250,001 |
| 1 Earner | 571 (39.4%) | $232,730 |
| 2 Earners | 579 (40.0%) | $250,001 |
| 3+ Earners | 98 (6.8%) | $250,001 |
| Total | 1,448 (100.0%) | $250,001 |
Household Income in Forest Hills
Household Income Brackets in Forest Hills
With 1,046 households falling in the category, the $200,000+ income range is the most frequent in Forest Hills, accounting for 58.2% of all households. In contrast, only 5 households (0.3%) fall into the $15,000 to $24,999 income bracket, making it the least populous group.
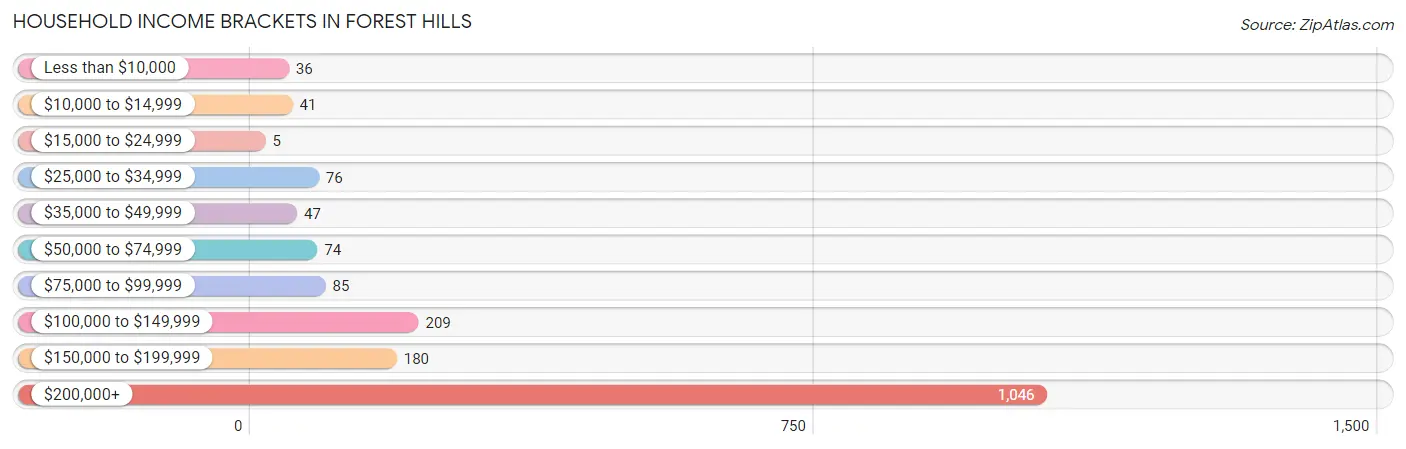
| Income Bracket | # Households | % Households |
| Less than $10,000 | 36 | 2.0% |
| $10,000 to $14,999 | 41 | 2.3% |
| $15,000 to $24,999 | 5 | 0.3% |
| $25,000 to $34,999 | 76 | 4.2% |
| $35,000 to $49,999 | 47 | 2.6% |
| $50,000 to $74,999 | 74 | 4.1% |
| $75,000 to $99,999 | 85 | 4.7% |
| $100,000 to $149,999 | 209 | 11.6% |
| $150,000 to $199,999 | 180 | 10.0% |
| $200,000+ | 1,046 | 58.2% |
Household Income by Householder Age in Forest Hills
The median household income in Forest Hills is $239,643, with the highest median household income of $250,001 found in the 45 to 64 years age bracket for the primary householder. A total of 829 households (46.1%) fall into this category.
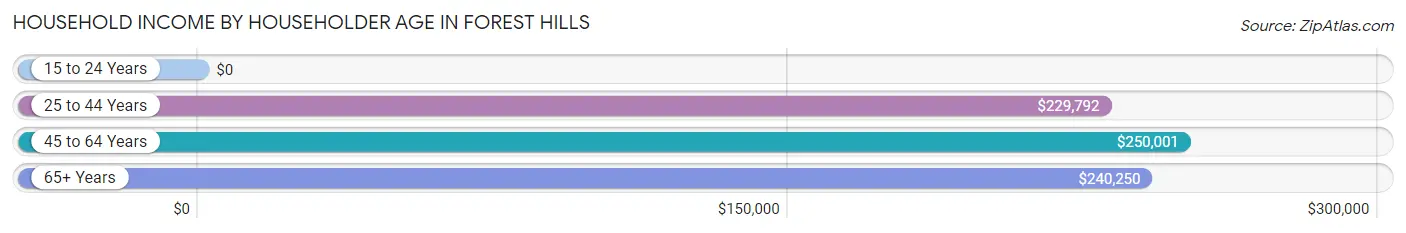
| Income Bracket | # Households | Median Income |
| 15 to 24 Years | 0 (0.0%) | $0 |
| 25 to 44 Years | 369 (20.5%) | $229,792 |
| 45 to 64 Years | 829 (46.1%) | $250,001 |
| 65+ Years | 600 (33.4%) | $240,250 |
| Total | 1,798 (100.0%) | $239,643 |
Poverty in Forest Hills
Income Below Poverty by Sex and Age in Forest Hills
With 7.3% poverty level for males and 6.5% for females among the residents of Forest Hills, 15 year old males and under 5 year old females are the most vulnerable to poverty, with 24 males (44.4%) and 41 females (29.7%) in their respective age groups living below the poverty level.
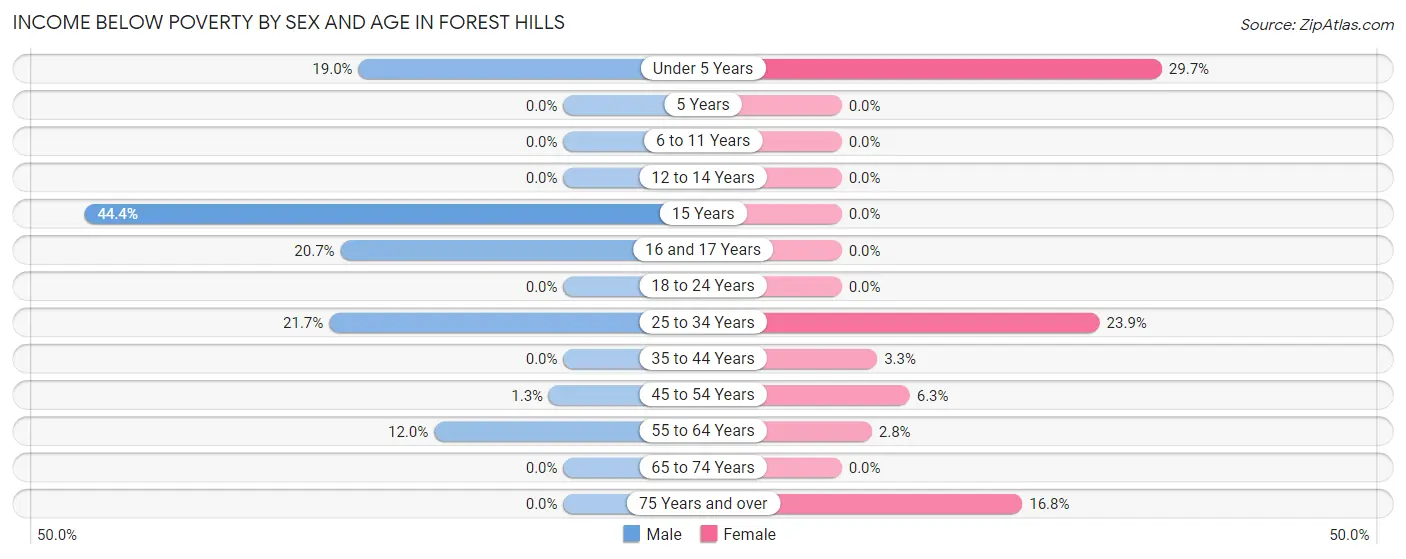
| Age Bracket | Male | Female |
| Under 5 Years | 39 (19.0%) | 41 (29.7%) |
| 5 Years | 0 (0.0%) | 0 (0.0%) |
| 6 to 11 Years | 0 (0.0%) | 0 (0.0%) |
| 12 to 14 Years | 0 (0.0%) | 0 (0.0%) |
| 15 Years | 24 (44.4%) | 0 (0.0%) |
| 16 and 17 Years | 24 (20.7%) | 0 (0.0%) |
| 18 to 24 Years | 0 (0.0%) | 0 (0.0%) |
| 25 to 34 Years | 40 (21.7%) | 39 (23.9%) |
| 35 to 44 Years | 0 (0.0%) | 8 (3.3%) |
| 45 to 54 Years | 5 (1.3%) | 25 (6.3%) |
| 55 to 64 Years | 48 (12.0%) | 14 (2.8%) |
| 65 to 74 Years | 0 (0.0%) | 0 (0.0%) |
| 75 Years and over | 0 (0.0%) | 33 (16.8%) |
| Total | 180 (7.3%) | 160 (6.5%) |
Income Above Poverty by Sex and Age in Forest Hills
According to the poverty statistics in Forest Hills, males aged 5 years and females aged 5 years are the age groups that are most secure financially, with 100.0% of males and 100.0% of females in these age groups living above the poverty line.
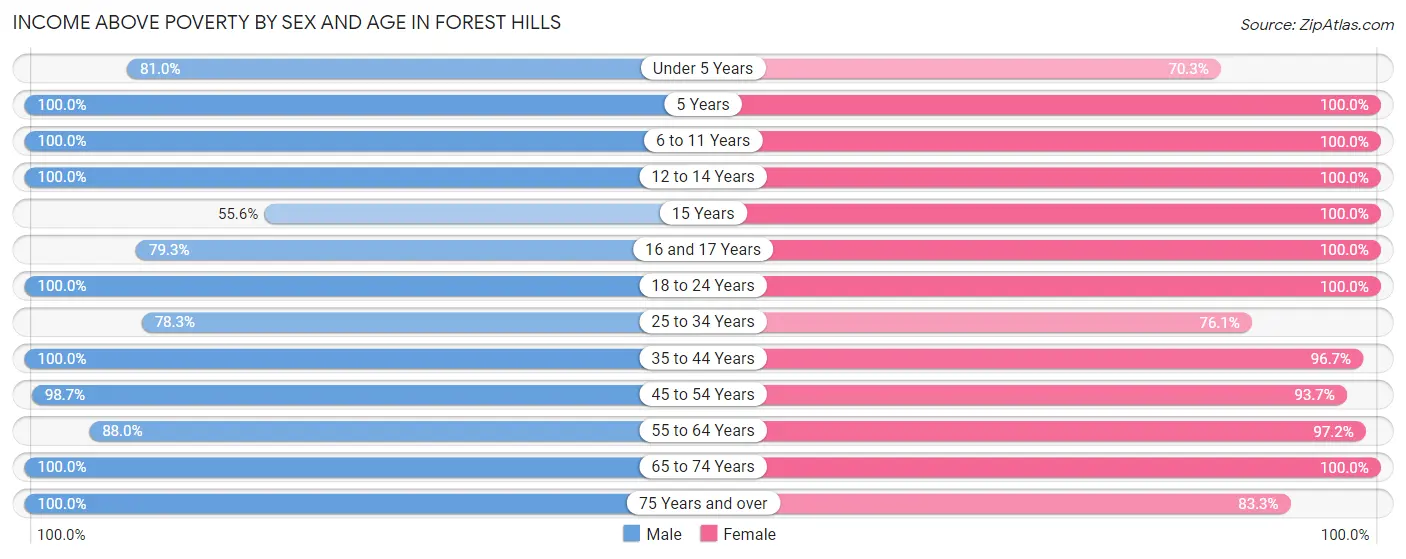
| Age Bracket | Male | Female |
| Under 5 Years | 166 (81.0%) | 97 (70.3%) |
| 5 Years | 60 (100.0%) | 54 (100.0%) |
| 6 to 11 Years | 71 (100.0%) | 175 (100.0%) |
| 12 to 14 Years | 67 (100.0%) | 132 (100.0%) |
| 15 Years | 30 (55.6%) | 30 (100.0%) |
| 16 and 17 Years | 92 (79.3%) | 98 (100.0%) |
| 18 to 24 Years | 190 (100.0%) | 44 (100.0%) |
| 25 to 34 Years | 144 (78.3%) | 124 (76.1%) |
| 35 to 44 Years | 161 (100.0%) | 235 (96.7%) |
| 45 to 54 Years | 369 (98.7%) | 371 (93.7%) |
| 55 to 64 Years | 352 (88.0%) | 488 (97.2%) |
| 65 to 74 Years | 300 (100.0%) | 283 (100.0%) |
| 75 Years and over | 285 (100.0%) | 164 (83.3%) |
| Total | 2,287 (92.7%) | 2,295 (93.5%) |
Income Below Poverty Among Married-Couple Families in Forest Hills
The poverty statistics for married-couple families in Forest Hills show that 5.2% or 71 of the total 1,364 families live below the poverty line. Families with 1 or 2 children have the highest poverty rate of 13.2%, comprising of 64 families. On the other hand, families with 3 or 4 children have the lowest poverty rate of 0.0%, which includes 0 families.
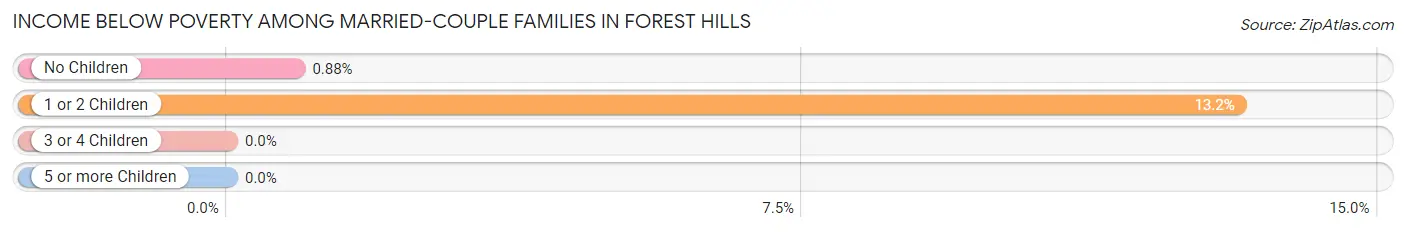
| Children | Above Poverty | Below Poverty |
| No Children | 784 (99.1%) | 7 (0.9%) |
| 1 or 2 Children | 422 (86.8%) | 64 (13.2%) |
| 3 or 4 Children | 87 (100.0%) | 0 (0.0%) |
| 5 or more Children | 0 (0.0%) | 0 (0.0%) |
| Total | 1,293 (94.8%) | 71 (5.2%) |
Income Below Poverty Among Single-Parent Households in Forest Hills
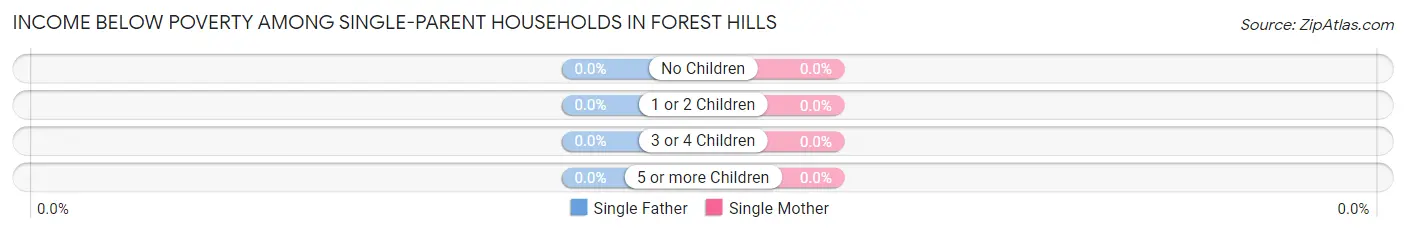
| Children | Single Father | Single Mother |
| No Children | 0 (0.0%) | 0 (0.0%) |
| 1 or 2 Children | 0 (0.0%) | 0 (0.0%) |
| 3 or 4 Children | 0 (0.0%) | 0 (0.0%) |
| 5 or more Children | 0 (0.0%) | 0 (0.0%) |
| Total | 0 (0.0%) | 0 (0.0%) |
Income Below Poverty Among Married-Couple vs Single-Parent Households in Forest Hills
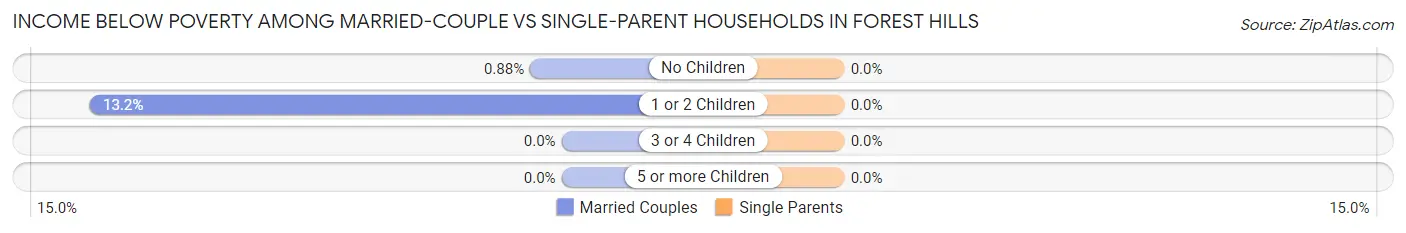
| Children | Married-Couple Families | Single-Parent Households |
| No Children | 7 (0.9%) | 0 (0.0%) |
| 1 or 2 Children | 64 (13.2%) | 0 (0.0%) |
| 3 or 4 Children | 0 (0.0%) | 0 (0.0%) |
| 5 or more Children | 0 (0.0%) | 0 (0.0%) |
| Total | 71 (5.2%) | 0 (0.0%) |
Race in Forest Hills
The most populous races in Forest Hills are White / Caucasian (4,609 | 93.6%), Hispanic or Latino (312 | 6.3%), and Two or more Races (233 | 4.7%).
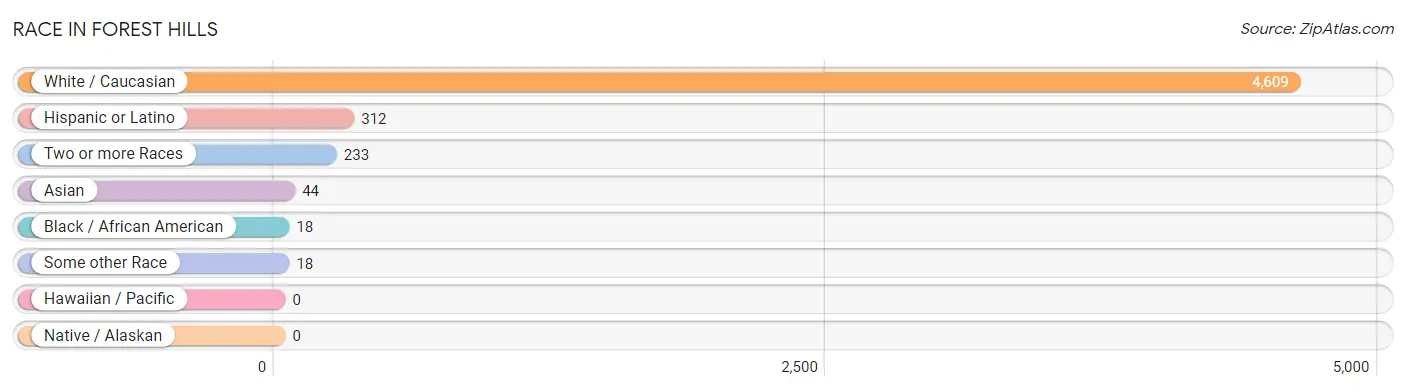
| Race | # Population | % Population |
| Asian | 44 | 0.9% |
| Black / African American | 18 | 0.4% |
| Hawaiian / Pacific | 0 | 0.0% |
| Hispanic or Latino | 312 | 6.3% |
| Native / Alaskan | 0 | 0.0% |
| White / Caucasian | 4,609 | 93.6% |
| Two or more Races | 233 | 4.7% |
| Some other Race | 18 | 0.4% |
| Total | 4,922 | 100.0% |
Ancestry in Forest Hills
The most populous ancestries reported in Forest Hills are English (918 | 18.6%), German (764 | 15.5%), Irish (565 | 11.5%), Scottish (374 | 7.6%), and French (279 | 5.7%), together accounting for 58.9% of all Forest Hills residents.
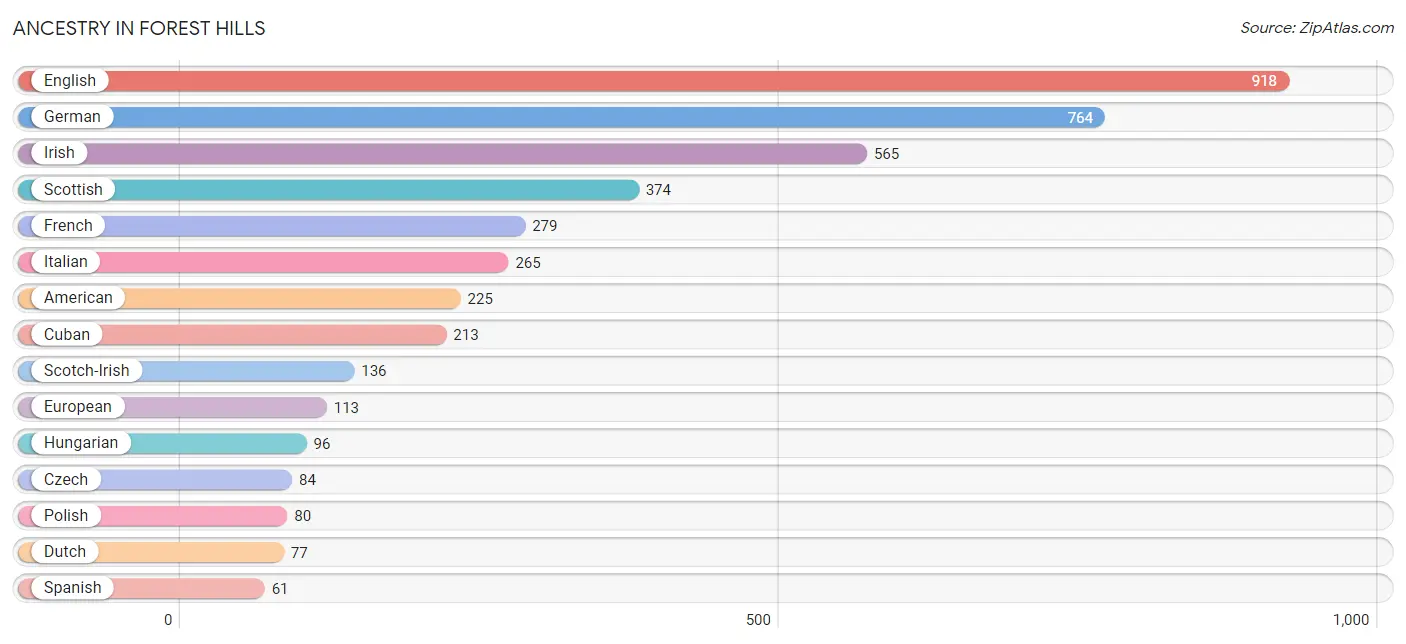
| Ancestry | # Population | % Population |
| African | 16 | 0.3% |
| American | 225 | 4.6% |
| Arab | 30 | 0.6% |
| Austrian | 40 | 0.8% |
| British | 15 | 0.3% |
| Bulgarian | 6 | 0.1% |
| Crow | 25 | 0.5% |
| Cuban | 213 | 4.3% |
| Czech | 84 | 1.7% |
| Danish | 30 | 0.6% |
| Dutch | 77 | 1.6% |
| Eastern European | 18 | 0.4% |
| English | 918 | 18.6% |
| European | 113 | 2.3% |
| Filipino | 27 | 0.5% |
| Finnish | 8 | 0.2% |
| French | 279 | 5.7% |
| French Canadian | 12 | 0.2% |
| German | 764 | 15.5% |
| Hungarian | 96 | 1.9% |
| Irish | 565 | 11.5% |
| Italian | 265 | 5.4% |
| Latvian | 12 | 0.2% |
| Lebanese | 30 | 0.6% |
| Lithuanian | 10 | 0.2% |
| Lumbee | 14 | 0.3% |
| Mexican | 32 | 0.6% |
| Native Hawaiian | 5 | 0.1% |
| Northern European | 14 | 0.3% |
| Norwegian | 40 | 0.8% |
| Peruvian | 6 | 0.1% |
| Polish | 80 | 1.6% |
| Romanian | 5 | 0.1% |
| Russian | 60 | 1.2% |
| Scandinavian | 13 | 0.3% |
| Scotch-Irish | 136 | 2.8% |
| Scottish | 374 | 7.6% |
| Slovak | 5 | 0.1% |
| South African | 15 | 0.3% |
| South American | 6 | 0.1% |
| Spanish | 61 | 1.2% |
| Subsaharan African | 31 | 0.6% |
| Swedish | 59 | 1.2% |
| Swiss | 25 | 0.5% |
| Thai | 54 | 1.1% |
| Ukrainian | 10 | 0.2% |
| Welsh | 21 | 0.4% | View All 47 Rows |
Immigrants in Forest Hills
The most numerous immigrant groups reported in Forest Hills came from Latin America (120 | 2.4%), Caribbean (113 | 2.3%), Cuba (113 | 2.3%), Asia (50 | 1.0%), and Africa (35 | 0.7%), together accounting for 8.8% of all Forest Hills residents.
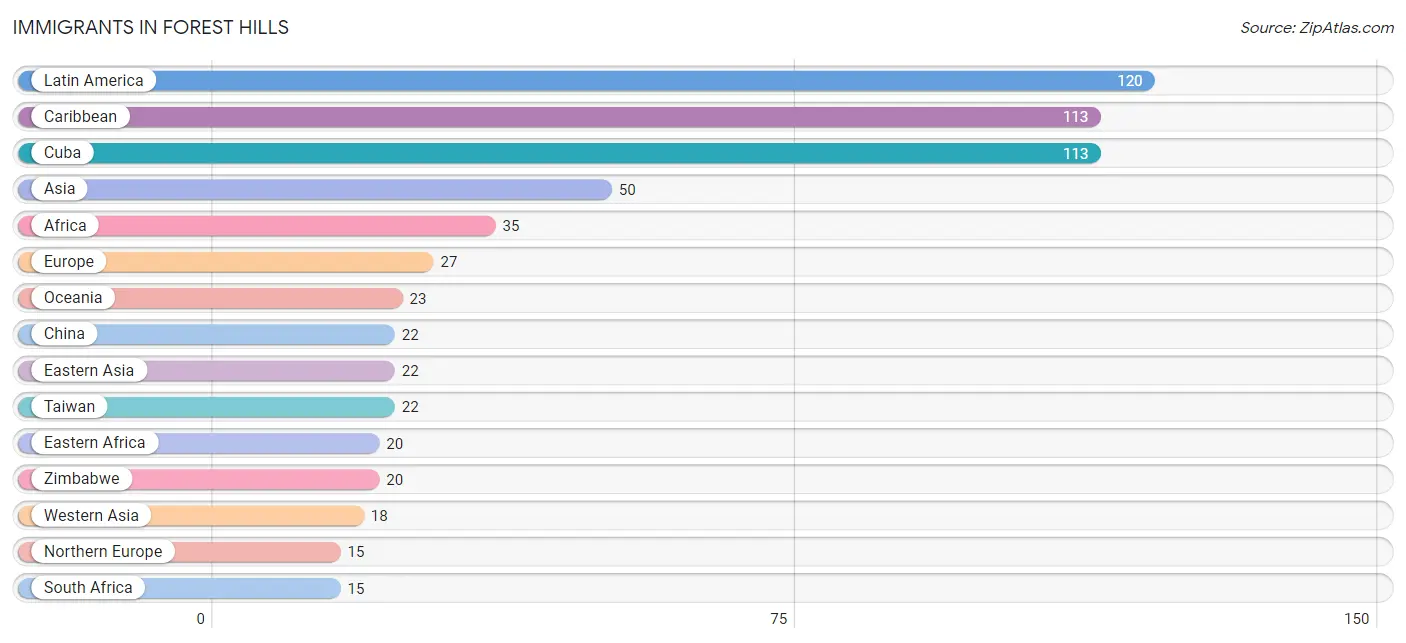
| Immigration Origin | # Population | % Population |
| Africa | 35 | 0.7% |
| Asia | 50 | 1.0% |
| Caribbean | 113 | 2.3% |
| China | 22 | 0.4% |
| Cuba | 113 | 2.3% |
| Eastern Africa | 20 | 0.4% |
| Eastern Asia | 22 | 0.4% |
| Eastern Europe | 8 | 0.2% |
| Europe | 27 | 0.5% |
| Guyana | 7 | 0.1% |
| India | 10 | 0.2% |
| Ireland | 5 | 0.1% |
| Israel | 11 | 0.2% |
| Italy | 4 | 0.1% |
| Latin America | 120 | 2.4% |
| Lebanon | 7 | 0.1% |
| Northern Europe | 15 | 0.3% |
| Oceania | 23 | 0.5% |
| Russia | 8 | 0.2% |
| South Africa | 15 | 0.3% |
| South America | 7 | 0.1% |
| South Central Asia | 10 | 0.2% |
| Southern Europe | 4 | 0.1% |
| Taiwan | 22 | 0.4% |
| Western Asia | 18 | 0.4% |
| Zimbabwe | 20 | 0.4% | View All 26 Rows |
Sex and Age in Forest Hills
Sex and Age in Forest Hills
The most populous age groups in Forest Hills are 55 to 59 Years (260 | 10.5%) for men and 55 to 59 Years (352 | 14.3%) for women.
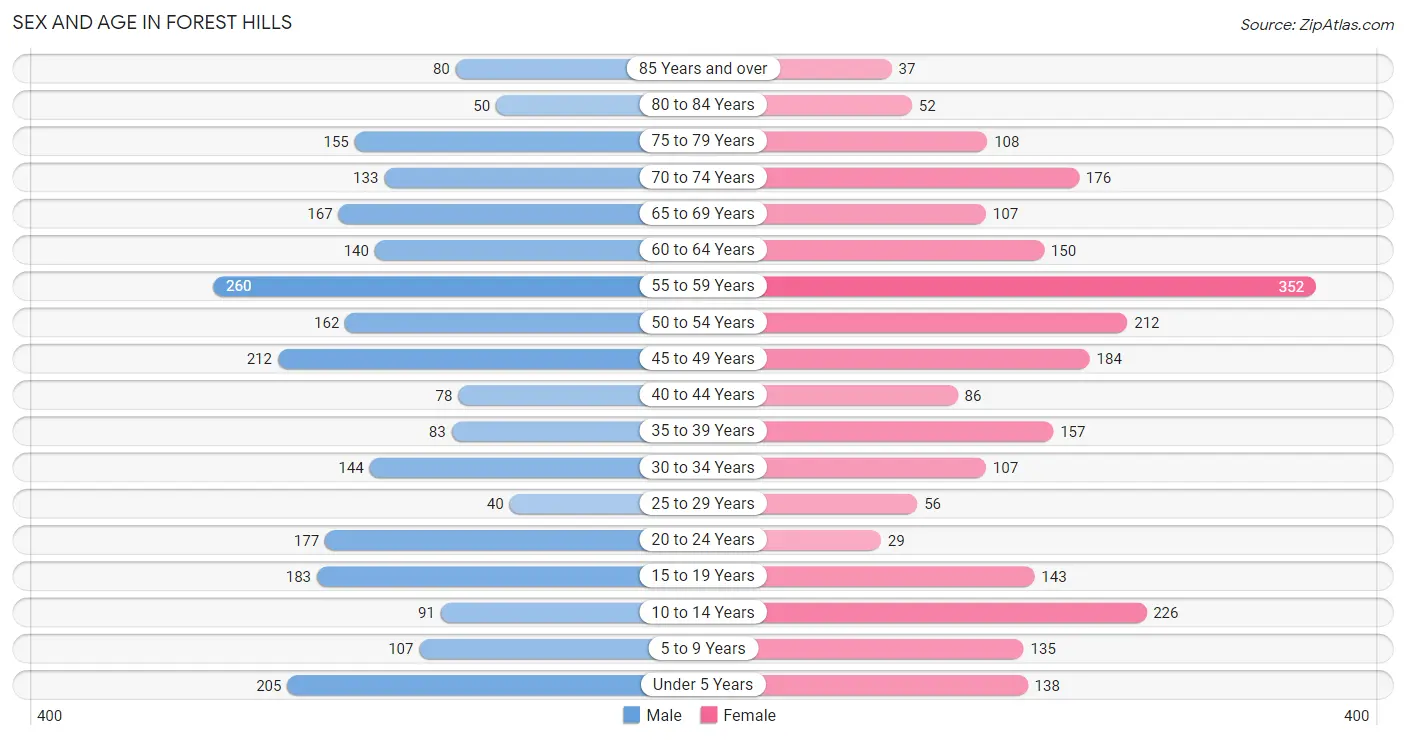
| Age Bracket | Male | Female |
| Under 5 Years | 205 (8.3%) | 138 (5.6%) |
| 5 to 9 Years | 107 (4.3%) | 135 (5.5%) |
| 10 to 14 Years | 91 (3.7%) | 226 (9.2%) |
| 15 to 19 Years | 183 (7.4%) | 143 (5.8%) |
| 20 to 24 Years | 177 (7.2%) | 29 (1.2%) |
| 25 to 29 Years | 40 (1.6%) | 56 (2.3%) |
| 30 to 34 Years | 144 (5.8%) | 107 (4.4%) |
| 35 to 39 Years | 83 (3.4%) | 157 (6.4%) |
| 40 to 44 Years | 78 (3.2%) | 86 (3.5%) |
| 45 to 49 Years | 212 (8.6%) | 184 (7.5%) |
| 50 to 54 Years | 162 (6.6%) | 212 (8.6%) |
| 55 to 59 Years | 260 (10.5%) | 352 (14.3%) |
| 60 to 64 Years | 140 (5.7%) | 150 (6.1%) |
| 65 to 69 Years | 167 (6.8%) | 107 (4.4%) |
| 70 to 74 Years | 133 (5.4%) | 176 (7.2%) |
| 75 to 79 Years | 155 (6.3%) | 108 (4.4%) |
| 80 to 84 Years | 50 (2.0%) | 52 (2.1%) |
| 85 Years and over | 80 (3.2%) | 37 (1.5%) |
| Total | 2,467 (100.0%) | 2,455 (100.0%) |
Families and Households in Forest Hills
Median Family Size in Forest Hills
The median family size in Forest Hills is 2.98 persons per family, with single male/father families (39 | 2.7%) accounting for the largest median family size of 4.1 persons per family. On the other hand, single female/mother families (45 | 3.1%) represent the smallest median family size with 2.73 persons per family.
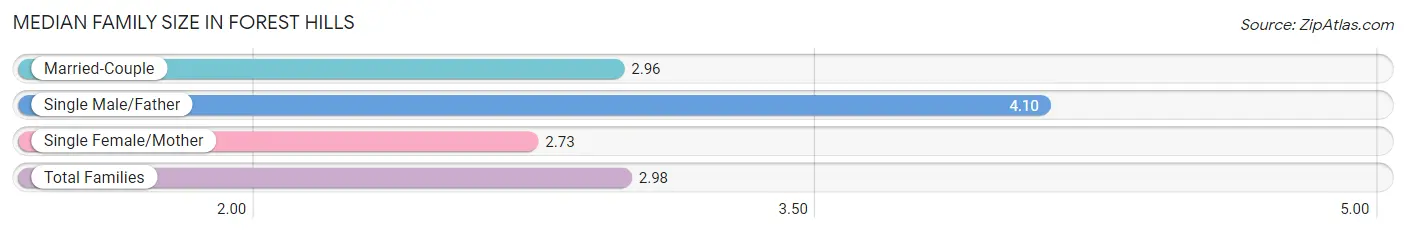
| Family Type | # Families | Family Size |
| Married-Couple | 1,364 (94.2%) | 2.96 |
| Single Male/Father | 39 (2.7%) | 4.10 |
| Single Female/Mother | 45 (3.1%) | 2.73 |
| Total Families | 1,448 (100.0%) | 2.98 |
Median Household Size in Forest Hills
The median household size in Forest Hills is 2.74 persons per household, with single male/father households (39 | 2.2%) accounting for the largest median household size of 4.23 persons per household. non-family households (350 | 19.5%) represent the smallest median household size with 1.66 persons per household.
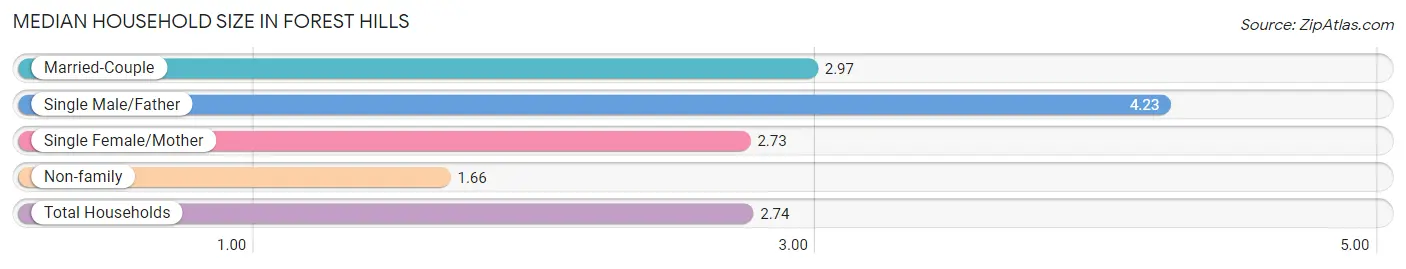
| Household Type | # Households | Household Size |
| Married-Couple | 1,364 (75.9%) | 2.97 |
| Single Male/Father | 39 (2.2%) | 4.23 |
| Single Female/Mother | 45 (2.5%) | 2.73 |
| Non-family | 350 (19.5%) | 1.66 |
| Total Households | 1,798 (100.0%) | 2.74 |
Household Size by Marriage Status in Forest Hills
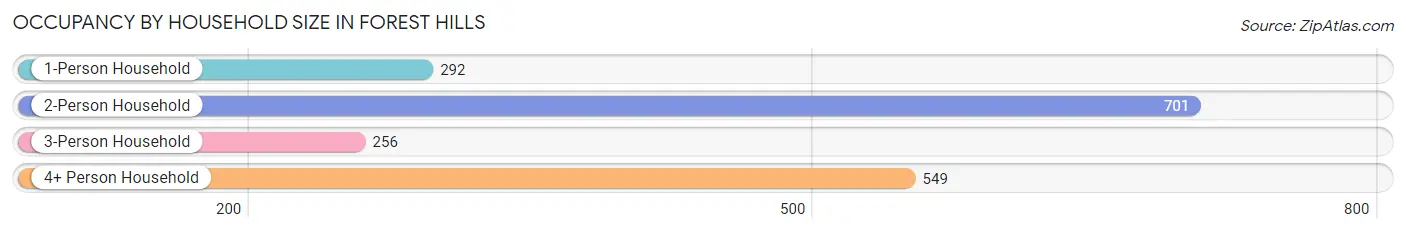
Out of a total of 1,798 households in Forest Hills, 1,448 (80.5%) are family households, while 350 (19.5%) are nonfamily households. The most numerous type of family households are 2-person households, comprising 701, and the most common type of nonfamily households are 1-person households, comprising 292.
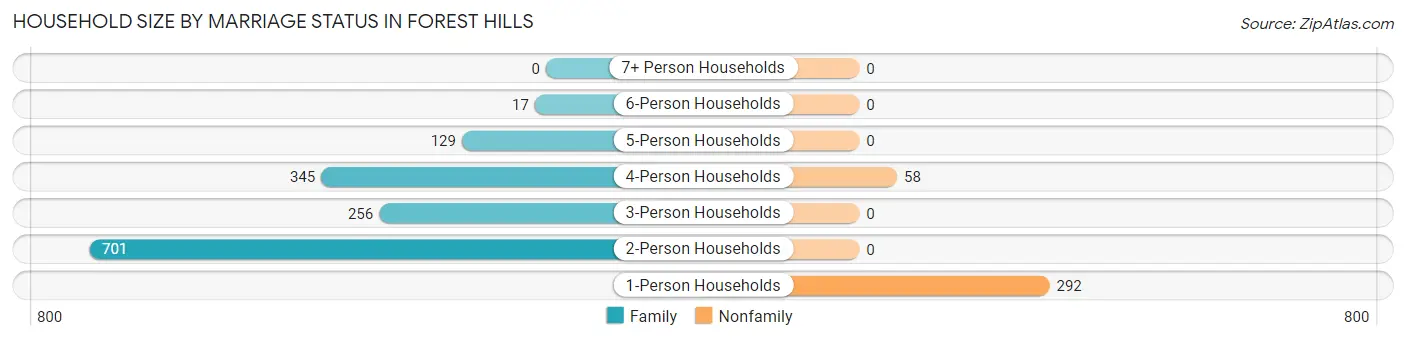
| Household Size | Family Households | Nonfamily Households |
| 1-Person Households | - | 292 (16.2%) |
| 2-Person Households | 701 (39.0%) | 0 (0.0%) |
| 3-Person Households | 256 (14.2%) | 0 (0.0%) |
| 4-Person Households | 345 (19.2%) | 58 (3.2%) |
| 5-Person Households | 129 (7.2%) | 0 (0.0%) |
| 6-Person Households | 17 (0.9%) | 0 (0.0%) |
| 7+ Person Households | 0 (0.0%) | 0 (0.0%) |
| Total | 1,448 (80.5%) | 350 (19.5%) |
Female Fertility in Forest Hills
Fertility by Age in Forest Hills
Average fertility rate in Forest Hills is 51.0 births per 1,000 women. Women in the age bracket of 20 to 34 years have the highest fertility rate with 203.0 births per 1,000 women. Women in the age bracket of 20 to 34 years acount for 100.0% of all women with births.
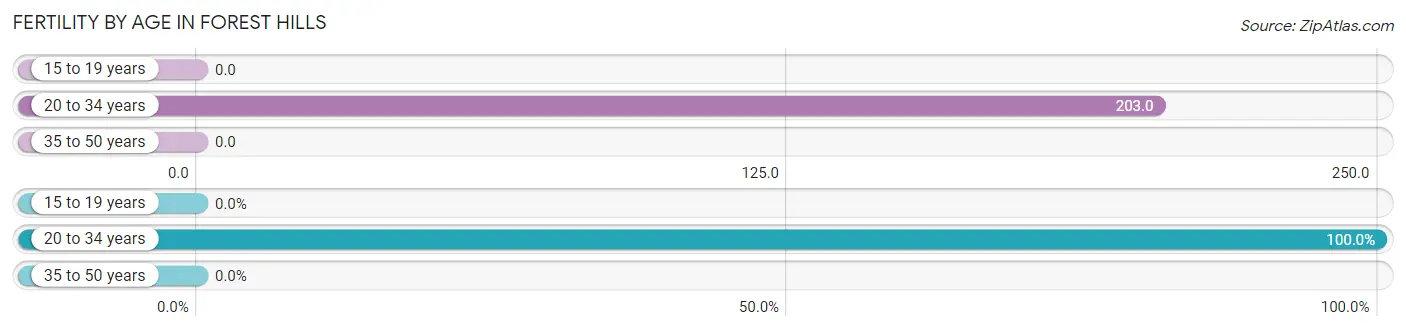
| Age Bracket | Women with Births | Births / 1,000 Women |
| 15 to 19 years | 0 (0.0%) | 0.0 |
| 20 to 34 years | 39 (100.0%) | 203.0 |
| 35 to 50 years | 0 (0.0%) | 0.0 |
| Total | 39 (100.0%) | 51.0 |
Fertility by Age by Marriage Status in Forest Hills
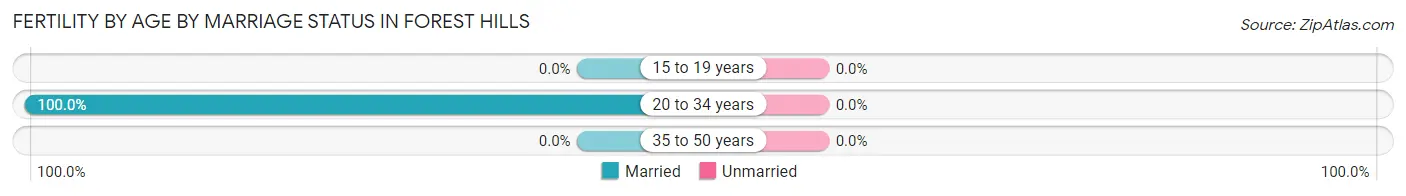
| Age Bracket | Married | Unmarried |
| 15 to 19 years | 0 (0.0%) | 0 (0.0%) |
| 20 to 34 years | 39 (100.0%) | 0 (0.0%) |
| 35 to 50 years | 0 (0.0%) | 0 (0.0%) |
| Total | 39 (100.0%) | 0 (0.0%) |
Fertility by Education in Forest Hills
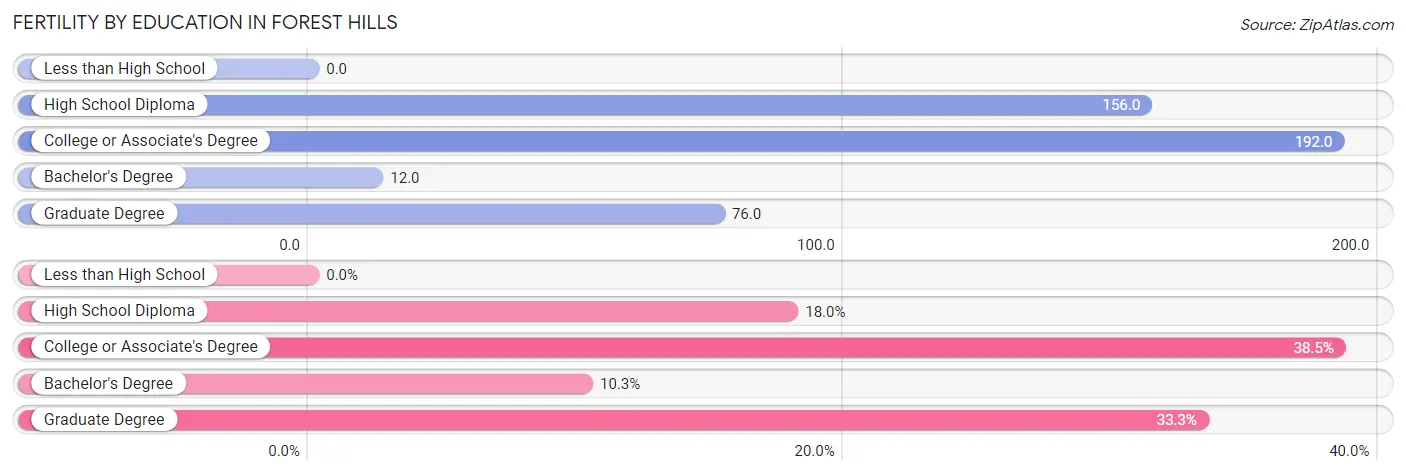
| Educational Attainment | Women with Births | Births / 1,000 Women |
| Less than High School | 0 (0.0%) | 0.0 |
| High School Diploma | 7 (17.9%) | 156.0 |
| College or Associate's Degree | 15 (38.5%) | 192.0 |
| Bachelor's Degree | 4 (10.3%) | 12.0 |
| Graduate Degree | 13 (33.3%) | 76.0 |
| Total | 39 (100.0%) | 51.0 |
Fertility by Education by Marriage Status in Forest Hills
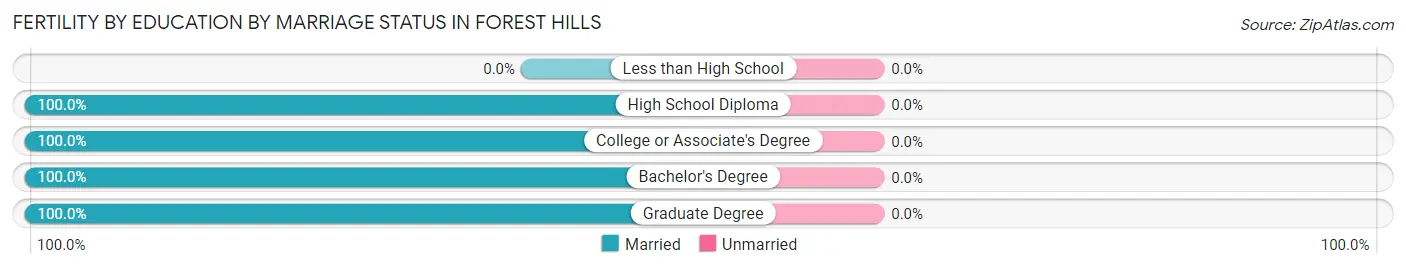
| Educational Attainment | Married | Unmarried |
| Less than High School | 0 (0.0%) | 0 (0.0%) |
| High School Diploma | 7 (100.0%) | 0 (0.0%) |
| College or Associate's Degree | 15 (100.0%) | 0 (0.0%) |
| Bachelor's Degree | 4 (100.0%) | 0 (0.0%) |
| Graduate Degree | 13 (100.0%) | 0 (0.0%) |
| Total | 39 (100.0%) | 0 (0.0%) |
Employment Characteristics in Forest Hills
Employment by Class of Employer in Forest Hills
Among the 2,222 employed individuals in Forest Hills, private company employees (1,306 | 58.8%), not-for-profit organizations (347 | 15.6%), and self-employed (not incorporated) (283 | 12.7%) make up the most common classes of employment.
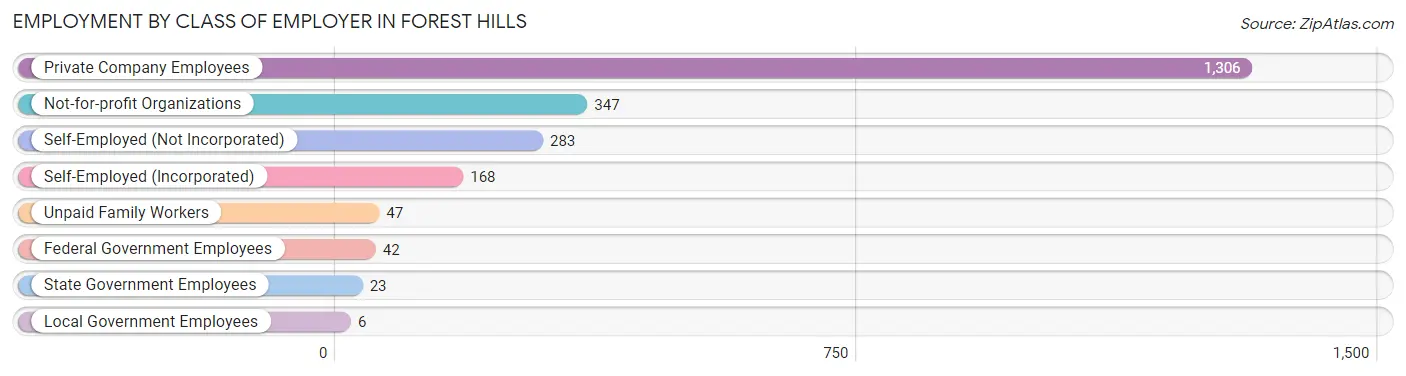
| Employer Class | # Employees | % Employees |
| Private Company Employees | 1,306 | 58.8% |
| Self-Employed (Incorporated) | 168 | 7.6% |
| Self-Employed (Not Incorporated) | 283 | 12.7% |
| Not-for-profit Organizations | 347 | 15.6% |
| Local Government Employees | 6 | 0.3% |
| State Government Employees | 23 | 1.0% |
| Federal Government Employees | 42 | 1.9% |
| Unpaid Family Workers | 47 | 2.1% |
| Total | 2,222 | 100.0% |
Employment Status by Age in Forest Hills
According to the labor force statistics for Forest Hills, out of the total population over 16 years of age (3,936), 57.4% or 2,259 individuals are in the labor force, with 1.2% or 27 of them unemployed. The age group with the highest labor force participation rate is 25 to 29 years, with 86.5% or 83 individuals in the labor force. Within the labor force, the 30 to 34 years age range has the highest percentage of unemployed individuals, with 12.5% or 17 of them being unemployed.
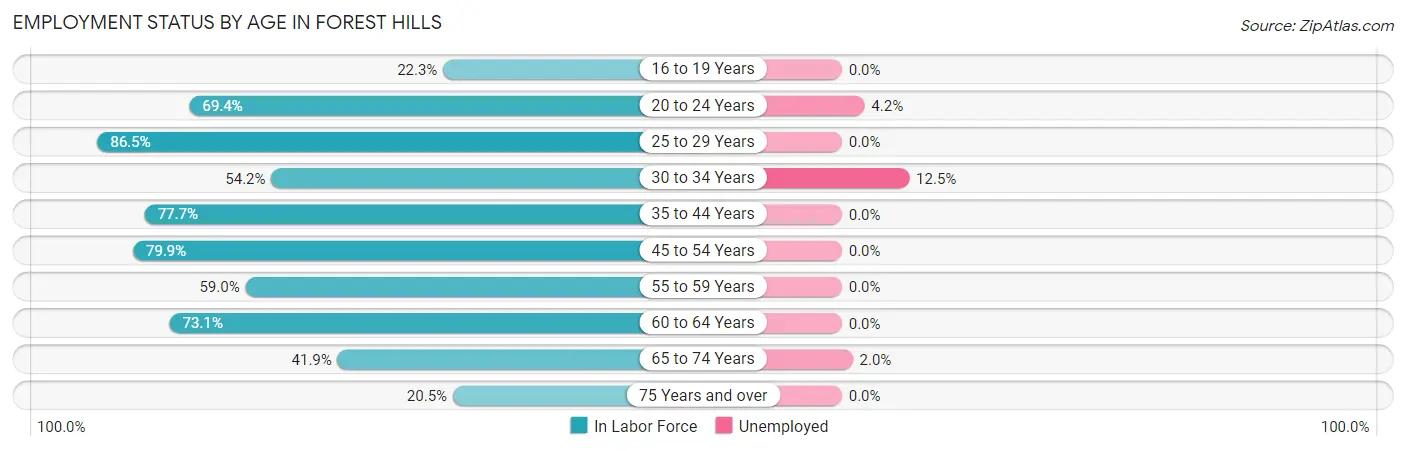
| Age Bracket | In Labor Force | Unemployed |
| 16 to 19 Years | 54 (22.3%) | 0 (0.0%) |
| 20 to 24 Years | 143 (69.4%) | 6 (4.2%) |
| 25 to 29 Years | 83 (86.5%) | 0 (0.0%) |
| 30 to 34 Years | 136 (54.2%) | 17 (12.5%) |
| 35 to 44 Years | 314 (77.7%) | 0 (0.0%) |
| 45 to 54 Years | 615 (79.9%) | 0 (0.0%) |
| 55 to 59 Years | 361 (59.0%) | 0 (0.0%) |
| 60 to 64 Years | 212 (73.1%) | 0 (0.0%) |
| 65 to 74 Years | 244 (41.9%) | 5 (2.0%) |
| 75 Years and over | 99 (20.5%) | 0 (0.0%) |
| Total | 2,259 (57.4%) | 27 (1.2%) |
Employment Status by Educational Attainment in Forest Hills
According to labor force statistics for Forest Hills, 71.0% of individuals (1,720) out of the total population between 25 and 64 years of age (2,423) are in the labor force, with 1.0% or 17 of them being unemployed. The group with the highest labor force participation rate are those with the educational attainment of bachelor's degree or higher, with 76.4% or 1,494 individuals in the labor force. Within the labor force, individuals with bachelor's degree or higher education have the highest percentage of unemployment, with 1.1% or 16 of them being unemployed.
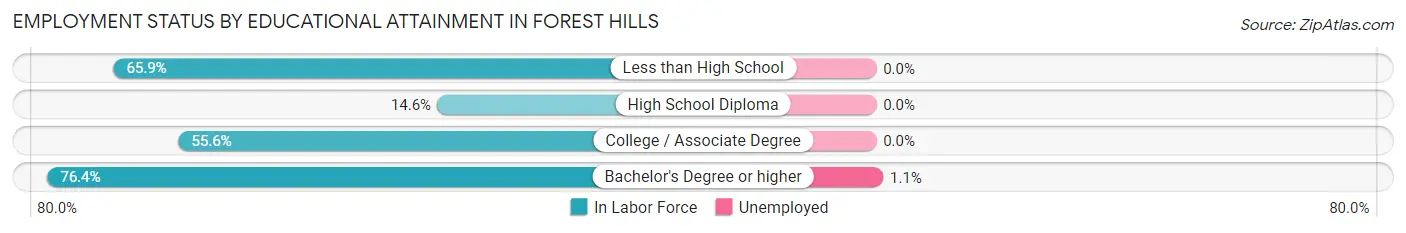
| Educational Attainment | In Labor Force | Unemployed |
| Less than High School | 27 (65.9%) | 0 (0.0%) |
| High School Diploma | 13 (14.6%) | 0 (0.0%) |
| College / Associate Degree | 188 (55.6%) | 0 (0.0%) |
| Bachelor's Degree or higher | 1,494 (76.4%) | 22 (1.1%) |
| Total | 1,720 (71.0%) | 24 (1.0%) |
Employment Occupations by Sex in Forest Hills
Management, Business, Science and Arts Occupations
The most common Management, Business, Science and Arts occupations in Forest Hills are Management (433 | 19.4%), Community & Social Service (408 | 18.3%), Health Diagnosing & Treating (341 | 15.3%), Health Technologists (314 | 14.1%), and Business & Financial (231 | 10.3%).
Management, Business, Science and Arts Occupations by Sex
Within the Management, Business, Science and Arts occupations in Forest Hills, the most male-oriented occupations are Computers & Mathematics (80.8%), Arts, Media & Entertainment (73.3%), and Health Technologists (71.7%), while the most female-oriented occupations are Education, Arts & Media (57.1%), Life, Physical & Social Science (51.4%), and Education Instruction & Library (50.7%).
| Occupation | Male | Female |
| Management | 302 (69.8%) | 131 (30.2%) |
| Business & Financial | 154 (66.7%) | 77 (33.3%) |
| Computers, Engineering & Science | 69 (67.0%) | 34 (33.0%) |
| Computers & Mathematics | 38 (80.8%) | 9 (19.2%) |
| Architecture & Engineering | 14 (66.7%) | 7 (33.3%) |
| Life, Physical & Social Science | 17 (48.6%) | 18 (51.4%) |
| Community & Social Service | 251 (61.5%) | 157 (38.5%) |
| Education, Arts & Media | 6 (42.9%) | 8 (57.1%) |
| Legal Services & Support | 96 (67.1%) | 47 (32.9%) |
| Education Instruction & Library | 72 (49.3%) | 74 (50.7%) |
| Arts, Media & Entertainment | 77 (73.3%) | 28 (26.7%) |
| Health Diagnosing & Treating | 230 (67.4%) | 111 (32.6%) |
| Health Technologists | 225 (71.7%) | 89 (28.3%) |
| Total (Category) | 1,006 (66.4%) | 510 (33.6%) |
| Total (Overall) | 1,439 (64.4%) | 794 (35.6%) |
Services Occupations
The most common Services occupations in Forest Hills are Food Preparation & Serving (64 | 2.9%), Personal Care & Service (22 | 1.0%), Healthcare Support (14 | 0.6%), and Cleaning & Maintenance (12 | 0.5%).
Services Occupations by Sex
Within the Services occupations in Forest Hills, the most male-oriented occupations are Food Preparation & Serving (65.6%), Cleaning & Maintenance (50.0%), and Personal Care & Service (13.6%), while the most female-oriented occupations are Healthcare Support (100.0%), Personal Care & Service (86.4%), and Cleaning & Maintenance (50.0%).
| Occupation | Male | Female |
| Healthcare Support | 0 (0.0%) | 14 (100.0%) |
| Security & Protection | 0 (0.0%) | 0 (0.0%) |
| Firefighting & Prevention | 0 (0.0%) | 0 (0.0%) |
| Law Enforcement | 0 (0.0%) | 0 (0.0%) |
| Food Preparation & Serving | 42 (65.6%) | 22 (34.4%) |
| Cleaning & Maintenance | 6 (50.0%) | 6 (50.0%) |
| Personal Care & Service | 3 (13.6%) | 19 (86.4%) |
| Total (Category) | 51 (45.5%) | 61 (54.5%) |
| Total (Overall) | 1,439 (64.4%) | 794 (35.6%) |
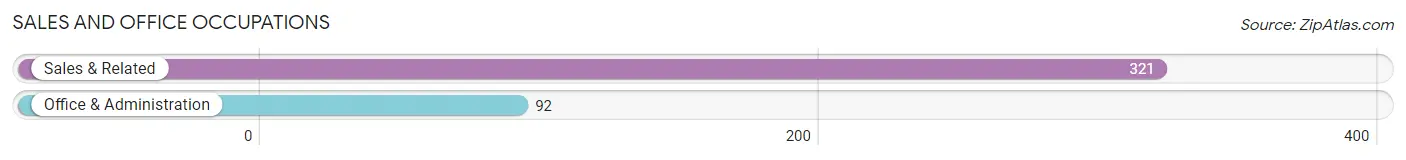
Sales and Office Occupations
The most common Sales and Office occupations in Forest Hills are Sales & Related (321 | 14.4%), and Office & Administration (92 | 4.1%).
Sales and Office Occupations by Sex
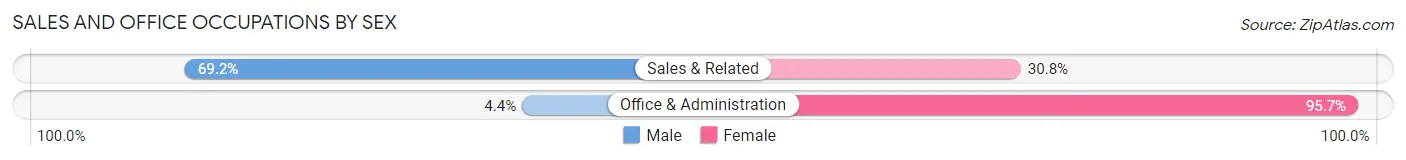
| Occupation | Male | Female |
| Sales & Related | 222 (69.2%) | 99 (30.8%) |
| Office & Administration | 4 (4.3%) | 88 (95.7%) |
| Total (Category) | 226 (54.7%) | 187 (45.3%) |
| Total (Overall) | 1,439 (64.4%) | 794 (35.6%) |
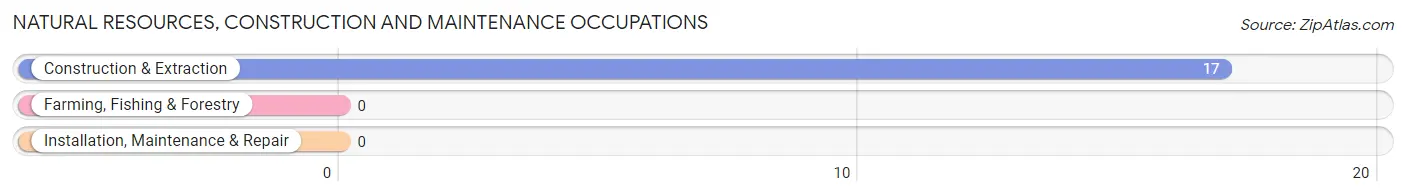
Natural Resources, Construction and Maintenance Occupations
The most common Natural Resources, Construction and Maintenance occupations in Forest Hills are , and Construction & Extraction (17 | 0.8%).
Natural Resources, Construction and Maintenance Occupations by Sex
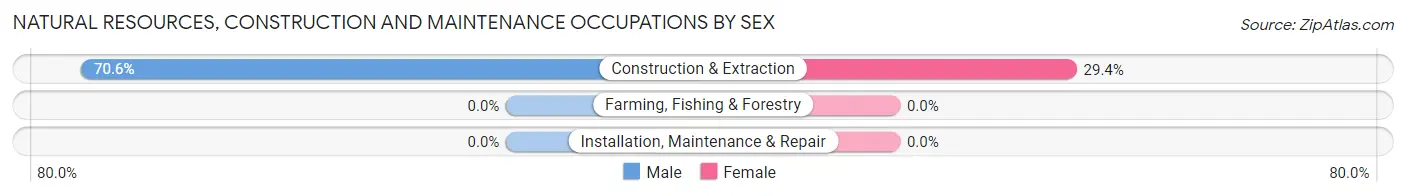
| Occupation | Male | Female |
| Farming, Fishing & Forestry | 0 (0.0%) | 0 (0.0%) |
| Construction & Extraction | 12 (70.6%) | 5 (29.4%) |
| Installation, Maintenance & Repair | 0 (0.0%) | 0 (0.0%) |
| Total (Category) | 12 (70.6%) | 5 (29.4%) |
| Total (Overall) | 1,439 (64.4%) | 794 (35.6%) |
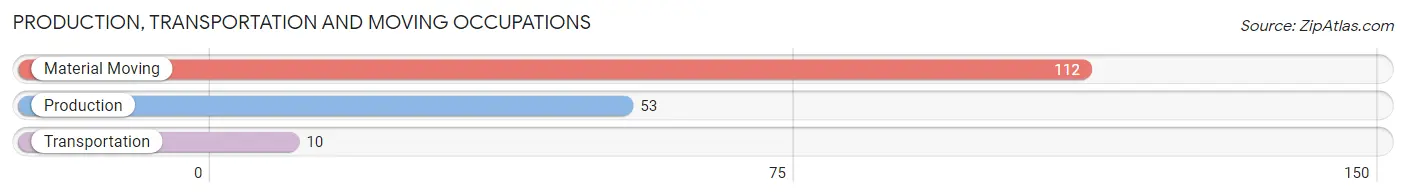
Production, Transportation and Moving Occupations
The most common Production, Transportation and Moving occupations in Forest Hills are Material Moving (112 | 5.0%), Production (53 | 2.4%), and Transportation (10 | 0.4%).
Production, Transportation and Moving Occupations by Sex
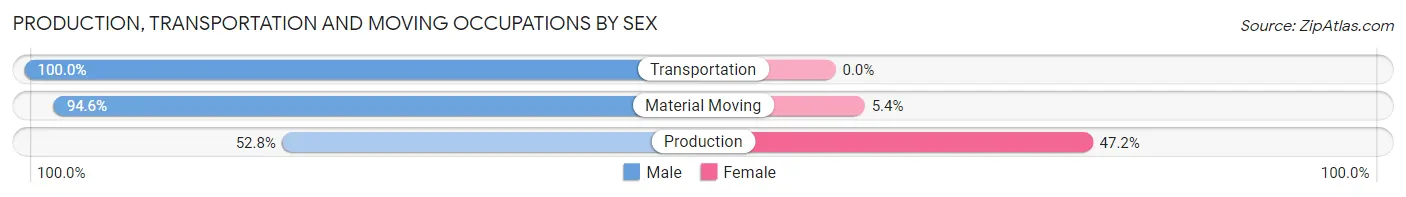
| Occupation | Male | Female |
| Production | 28 (52.8%) | 25 (47.2%) |
| Transportation | 10 (100.0%) | 0 (0.0%) |
| Material Moving | 106 (94.6%) | 6 (5.4%) |
| Total (Category) | 144 (82.3%) | 31 (17.7%) |
| Total (Overall) | 1,439 (64.4%) | 794 (35.6%) |
Employment Industries by Sex in Forest Hills
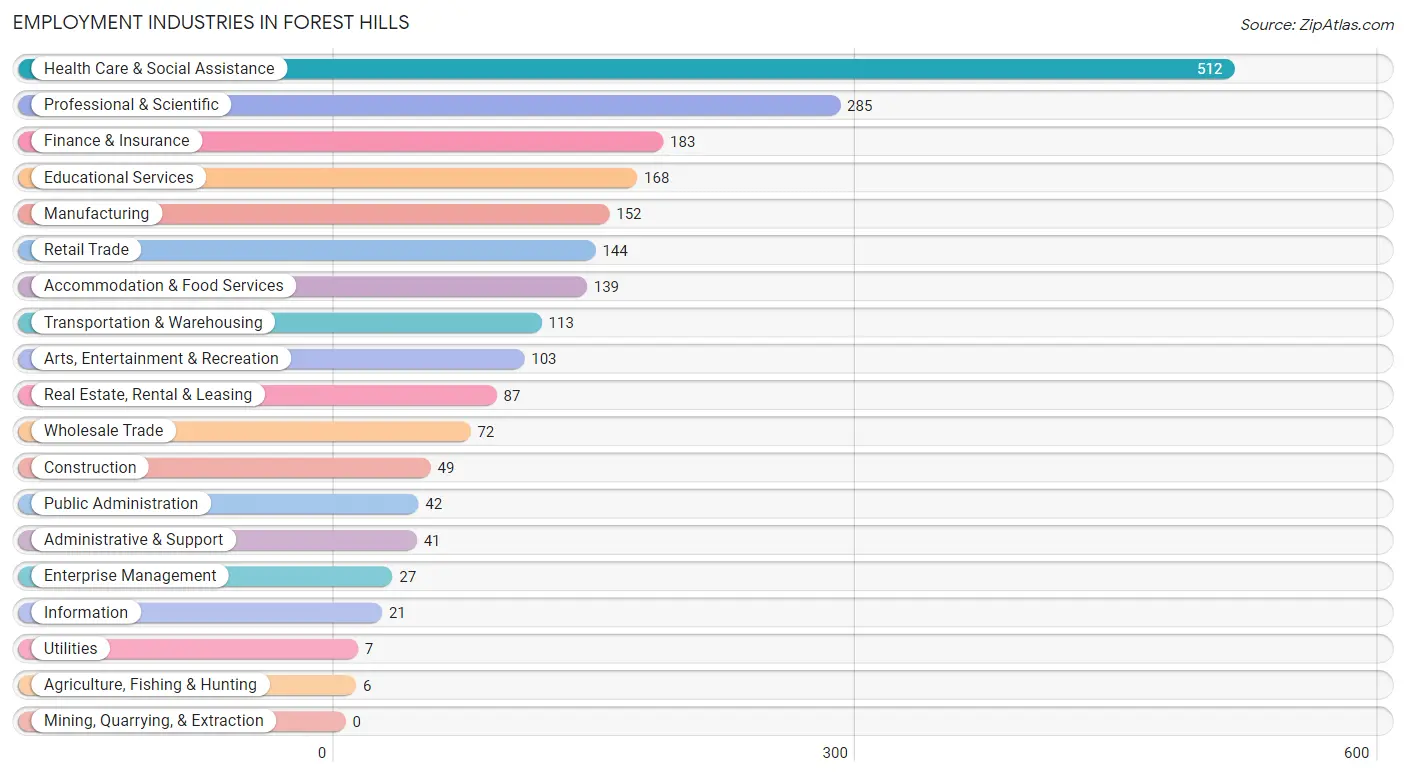
Employment Industries in Forest Hills
The major employment industries in Forest Hills include Health Care & Social Assistance (512 | 22.9%), Professional & Scientific (285 | 12.8%), Finance & Insurance (183 | 8.2%), Educational Services (168 | 7.5%), and Manufacturing (152 | 6.8%).
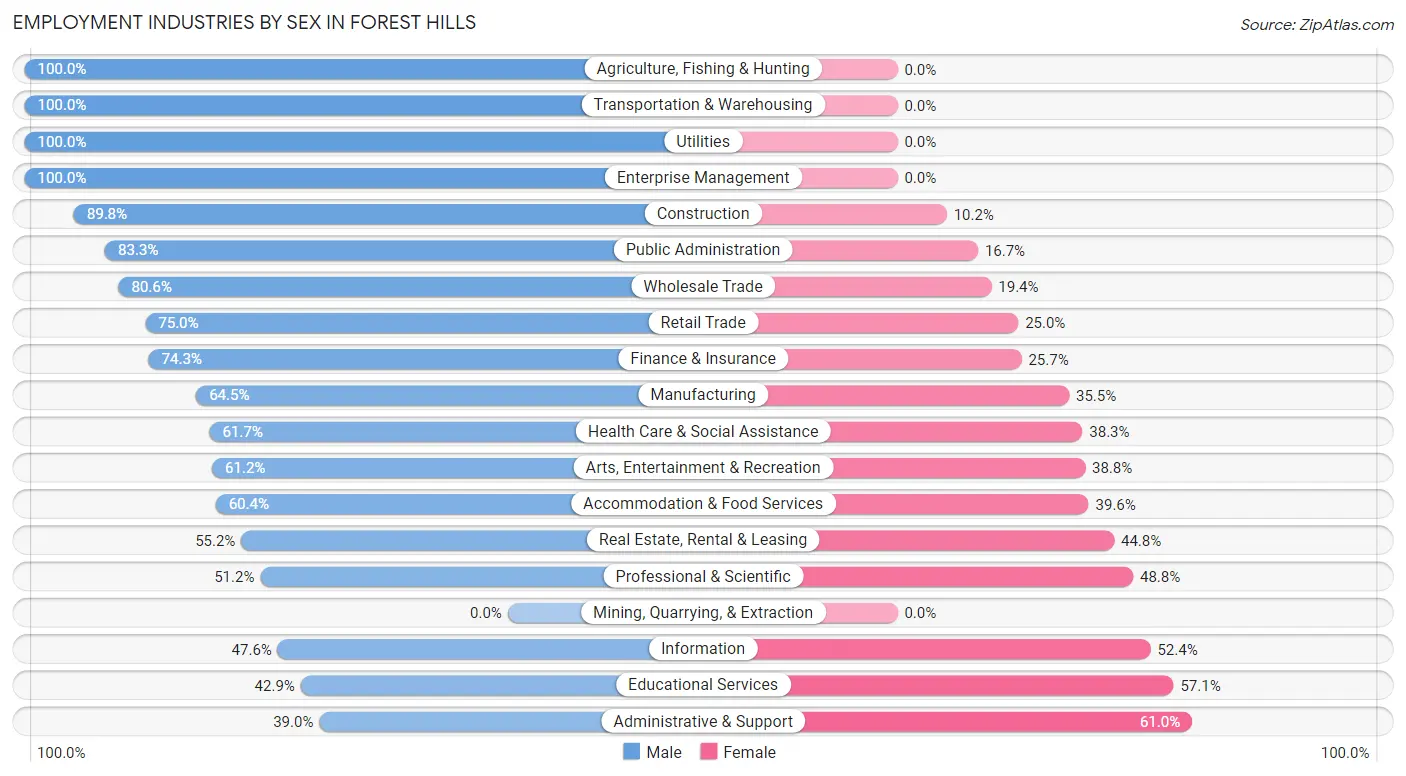
Employment Industries by Sex in Forest Hills
The Forest Hills industries that see more men than women are Agriculture, Fishing & Hunting (100.0%), Transportation & Warehousing (100.0%), and Utilities (100.0%), whereas the industries that tend to have a higher number of women are Administrative & Support (61.0%), Educational Services (57.1%), and Information (52.4%).
| Industry | Male | Female |
| Agriculture, Fishing & Hunting | 6 (100.0%) | 0 (0.0%) |
| Mining, Quarrying, & Extraction | 0 (0.0%) | 0 (0.0%) |
| Construction | 44 (89.8%) | 5 (10.2%) |
| Manufacturing | 98 (64.5%) | 54 (35.5%) |
| Wholesale Trade | 58 (80.6%) | 14 (19.4%) |
| Retail Trade | 108 (75.0%) | 36 (25.0%) |
| Transportation & Warehousing | 113 (100.0%) | 0 (0.0%) |
| Utilities | 7 (100.0%) | 0 (0.0%) |
| Information | 10 (47.6%) | 11 (52.4%) |
| Finance & Insurance | 136 (74.3%) | 47 (25.7%) |
| Real Estate, Rental & Leasing | 48 (55.2%) | 39 (44.8%) |
| Professional & Scientific | 146 (51.2%) | 139 (48.8%) |
| Enterprise Management | 27 (100.0%) | 0 (0.0%) |
| Administrative & Support | 16 (39.0%) | 25 (61.0%) |
| Educational Services | 72 (42.9%) | 96 (57.1%) |
| Health Care & Social Assistance | 316 (61.7%) | 196 (38.3%) |
| Arts, Entertainment & Recreation | 63 (61.2%) | 40 (38.8%) |
| Accommodation & Food Services | 84 (60.4%) | 55 (39.6%) |
| Public Administration | 35 (83.3%) | 7 (16.7%) |
| Total | 1,439 (64.4%) | 794 (35.6%) |
Education in Forest Hills
School Enrollment in Forest Hills
The most common levels of schooling among the 1,066 students in Forest Hills are high school (340 | 31.9%), middle school (266 | 24.9%), and nursery / preschool (149 | 14.0%).
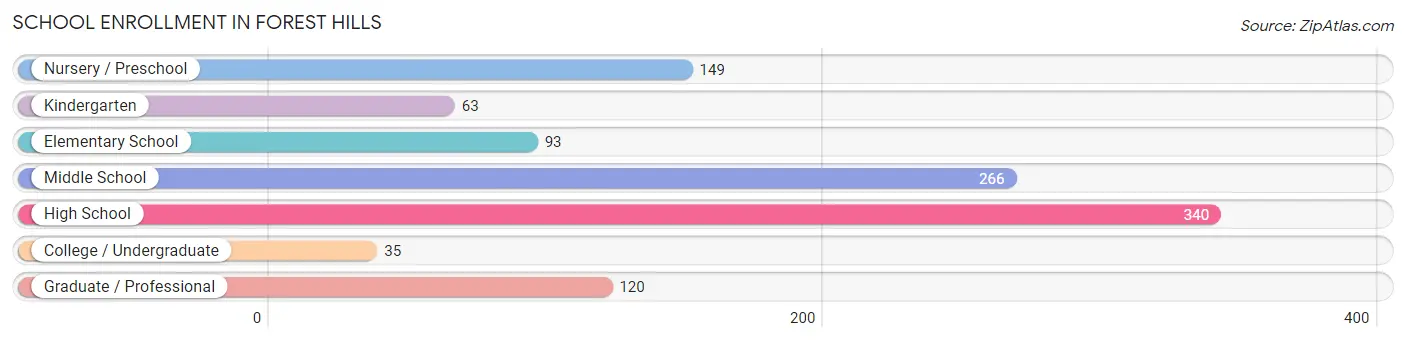
| School Level | # Students | % Students |
| Nursery / Preschool | 149 | 14.0% |
| Kindergarten | 63 | 5.9% |
| Elementary School | 93 | 8.7% |
| Middle School | 266 | 24.9% |
| High School | 340 | 31.9% |
| College / Undergraduate | 35 | 3.3% |
| Graduate / Professional | 120 | 11.3% |
| Total | 1,066 | 100.0% |
School Enrollment by Age by Funding Source in Forest Hills
Out of a total of 1,066 students who are enrolled in schools in Forest Hills, 863 (81.0%) attend a private institution, while the remaining 203 (19.0%) are enrolled in public schools. The age group of 18 to 19 year olds has the highest likelihood of being enrolled in private schools, with 28 (100.0% in the age bracket) enrolled. Conversely, the age group of 20 to 24 year olds has the lowest likelihood of being enrolled in a private school, with 15 (35.7% in the age bracket) attending a public institution.
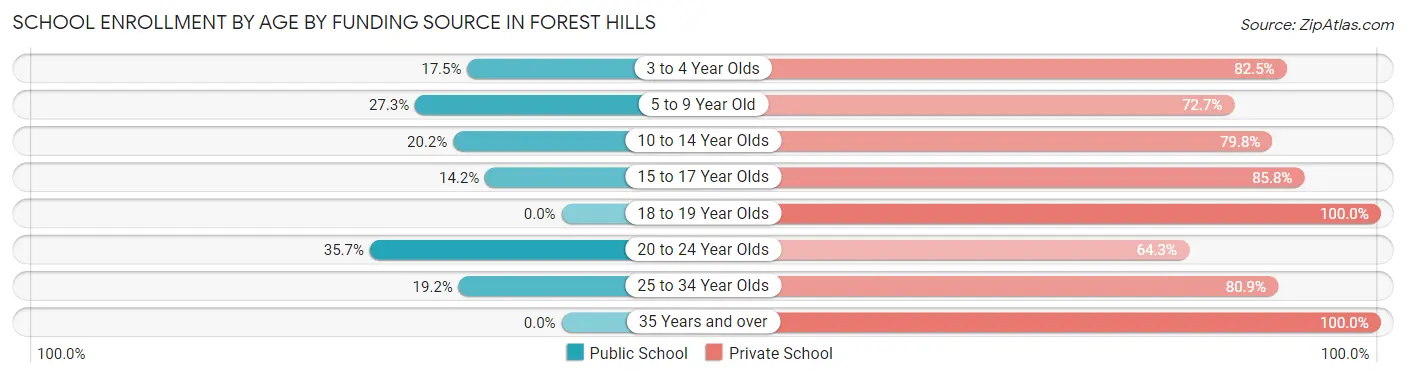
| Age Bracket | Public School | Private School |
| 3 to 4 Year Olds | 10 (17.5%) | 47 (82.5%) |
| 5 to 9 Year Old | 66 (27.3%) | 176 (72.7%) |
| 10 to 14 Year Olds | 64 (20.2%) | 253 (79.8%) |
| 15 to 17 Year Olds | 39 (14.2%) | 235 (85.8%) |
| 18 to 19 Year Olds | 0 (0.0%) | 28 (100.0%) |
| 20 to 24 Year Olds | 15 (35.7%) | 27 (64.3%) |
| 25 to 34 Year Olds | 9 (19.2%) | 38 (80.8%) |
| 35 Years and over | 0 (0.0%) | 59 (100.0%) |
| Total | 203 (19.0%) | 863 (81.0%) |
Educational Attainment by Field of Study in Forest Hills
Business (551 | 19.0%), physical & health sciences (264 | 9.1%), education (249 | 8.6%), science & technology (226 | 7.8%), and engineering (222 | 7.7%) are the most common fields of study among 2,898 individuals in Forest Hills who have obtained a bachelor's degree or higher.
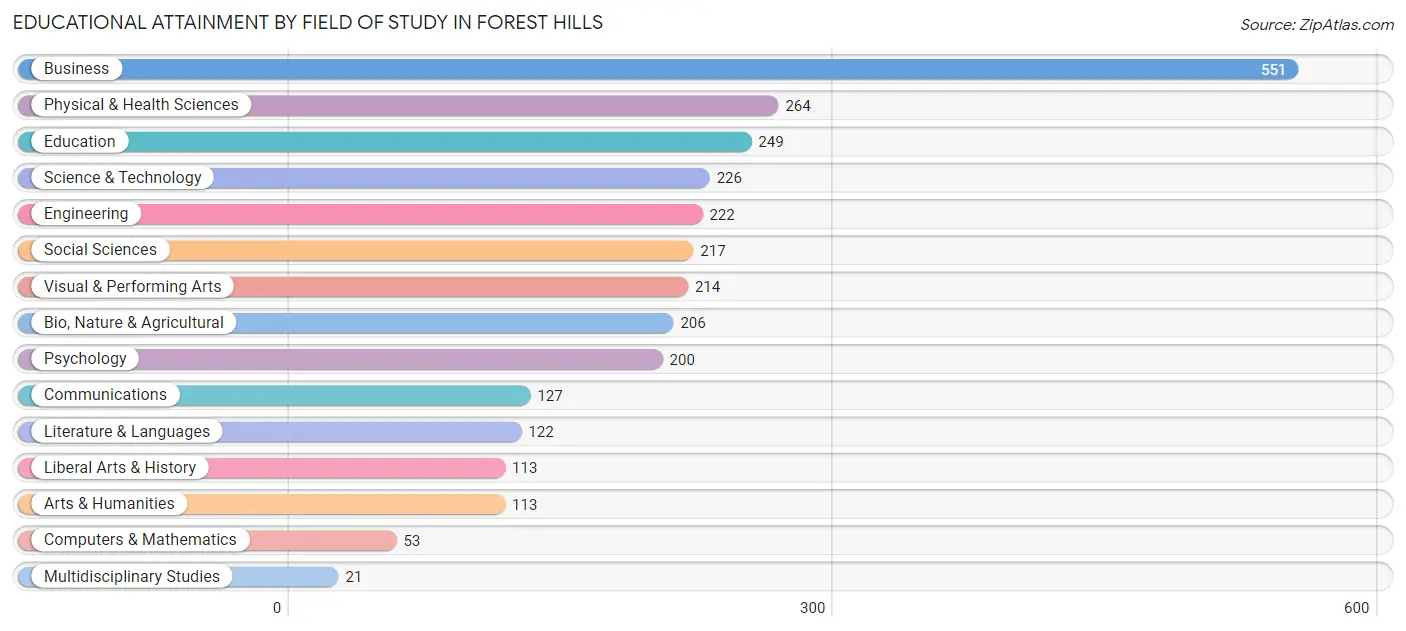
| Field of Study | # Graduates | % Graduates |
| Computers & Mathematics | 53 | 1.8% |
| Bio, Nature & Agricultural | 206 | 7.1% |
| Physical & Health Sciences | 264 | 9.1% |
| Psychology | 200 | 6.9% |
| Social Sciences | 217 | 7.5% |
| Engineering | 222 | 7.7% |
| Multidisciplinary Studies | 21 | 0.7% |
| Science & Technology | 226 | 7.8% |
| Business | 551 | 19.0% |
| Education | 249 | 8.6% |
| Literature & Languages | 122 | 4.2% |
| Liberal Arts & History | 113 | 3.9% |
| Visual & Performing Arts | 214 | 7.4% |
| Communications | 127 | 4.4% |
| Arts & Humanities | 113 | 3.9% |
| Total | 2,898 | 100.0% |
Transportation & Commute in Forest Hills
Vehicle Availability by Sex in Forest Hills
The most prevalent vehicle ownership categories in Forest Hills are males with 2 vehicles (527, accounting for 36.6%) and females with 2 vehicles (370, making up 67.3%).
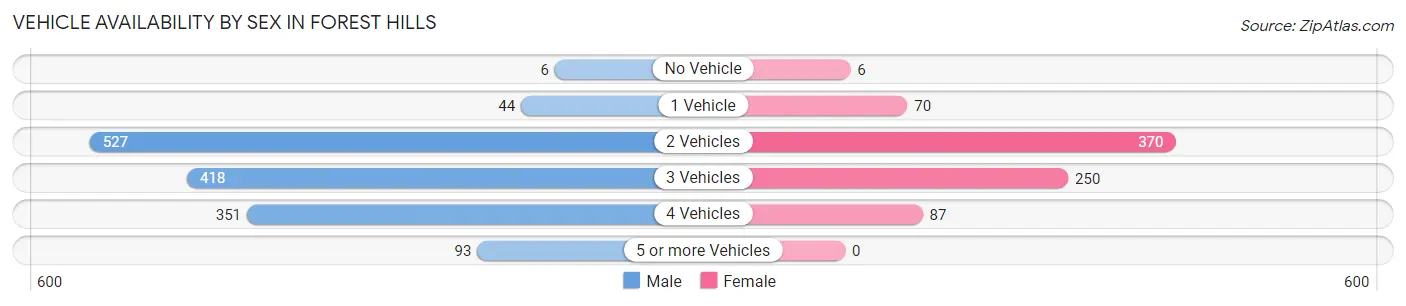
| Vehicles Available | Male | Female |
| No Vehicle | 6 (0.4%) | 6 (0.8%) |
| 1 Vehicle | 44 (3.1%) | 70 (8.9%) |
| 2 Vehicles | 527 (36.6%) | 370 (47.2%) |
| 3 Vehicles | 418 (29.0%) | 250 (31.9%) |
| 4 Vehicles | 351 (24.4%) | 87 (11.1%) |
| 5 or more Vehicles | 93 (6.5%) | 0 (0.0%) |
| Total | 1,439 (100.0%) | 783 (100.0%) |
Commute Time in Forest Hills
The most frequently occuring commute durations in Forest Hills are 20 to 24 minutes (474 commuters, 27.3%), 10 to 14 minutes (312 commuters, 18.0%), and 15 to 19 minutes (288 commuters, 16.6%).
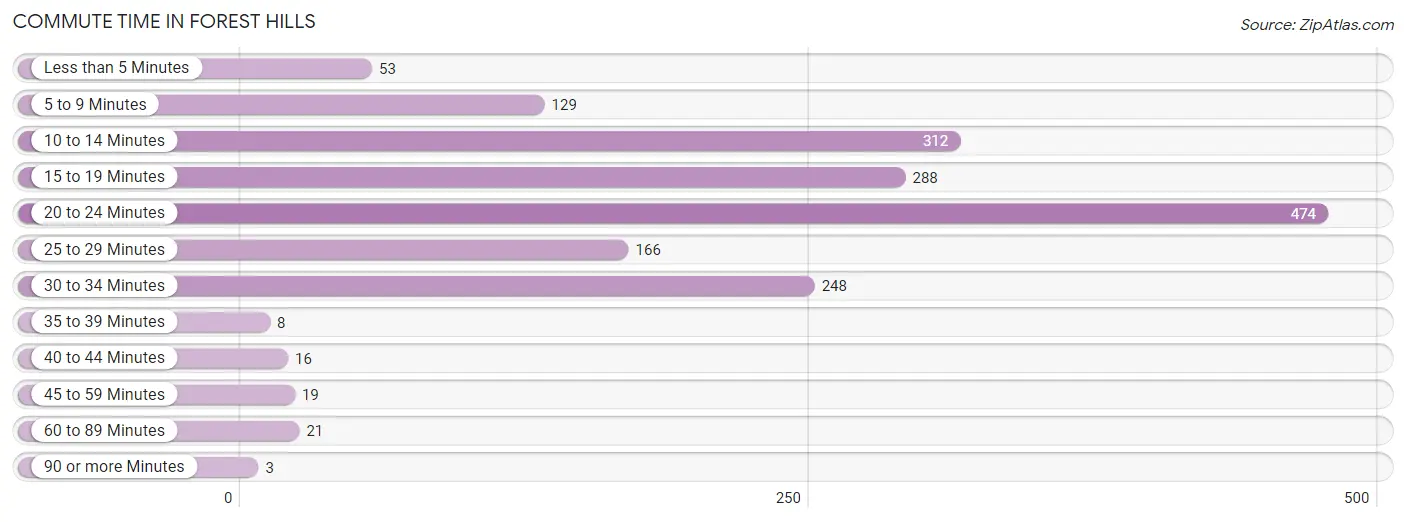
| Commute Time | # Commuters | % Commuters |
| Less than 5 Minutes | 53 | 3.0% |
| 5 to 9 Minutes | 129 | 7.4% |
| 10 to 14 Minutes | 312 | 18.0% |
| 15 to 19 Minutes | 288 | 16.6% |
| 20 to 24 Minutes | 474 | 27.3% |
| 25 to 29 Minutes | 166 | 9.6% |
| 30 to 34 Minutes | 248 | 14.3% |
| 35 to 39 Minutes | 8 | 0.5% |
| 40 to 44 Minutes | 16 | 0.9% |
| 45 to 59 Minutes | 19 | 1.1% |
| 60 to 89 Minutes | 21 | 1.2% |
| 90 or more Minutes | 3 | 0.2% |
Commute Time by Sex in Forest Hills
The most common commute times in Forest Hills are 20 to 24 minutes (328 commuters, 27.7%) for males and 20 to 24 minutes (146 commuters, 26.4%) for females.
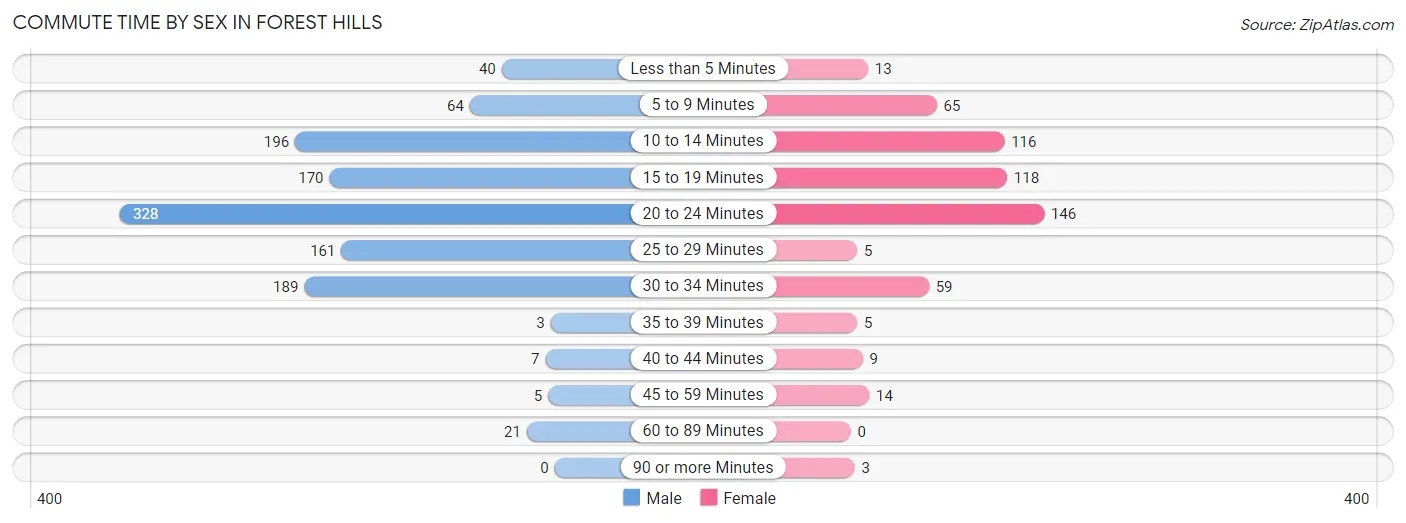
| Commute Time | Male | Female |
| Less than 5 Minutes | 40 (3.4%) | 13 (2.4%) |
| 5 to 9 Minutes | 64 (5.4%) | 65 (11.7%) |
| 10 to 14 Minutes | 196 (16.6%) | 116 (21.0%) |
| 15 to 19 Minutes | 170 (14.4%) | 118 (21.3%) |
| 20 to 24 Minutes | 328 (27.7%) | 146 (26.4%) |
| 25 to 29 Minutes | 161 (13.6%) | 5 (0.9%) |
| 30 to 34 Minutes | 189 (16.0%) | 59 (10.7%) |
| 35 to 39 Minutes | 3 (0.3%) | 5 (0.9%) |
| 40 to 44 Minutes | 7 (0.6%) | 9 (1.6%) |
| 45 to 59 Minutes | 5 (0.4%) | 14 (2.5%) |
| 60 to 89 Minutes | 21 (1.8%) | 0 (0.0%) |
| 90 or more Minutes | 0 (0.0%) | 3 (0.5%) |
Time of Departure to Work by Sex in Forest Hills
The most frequent times of departure to work in Forest Hills are 8:00 AM to 8:29 AM (227, 19.2%) for males and 8:00 AM to 8:29 AM (156, 28.2%) for females.
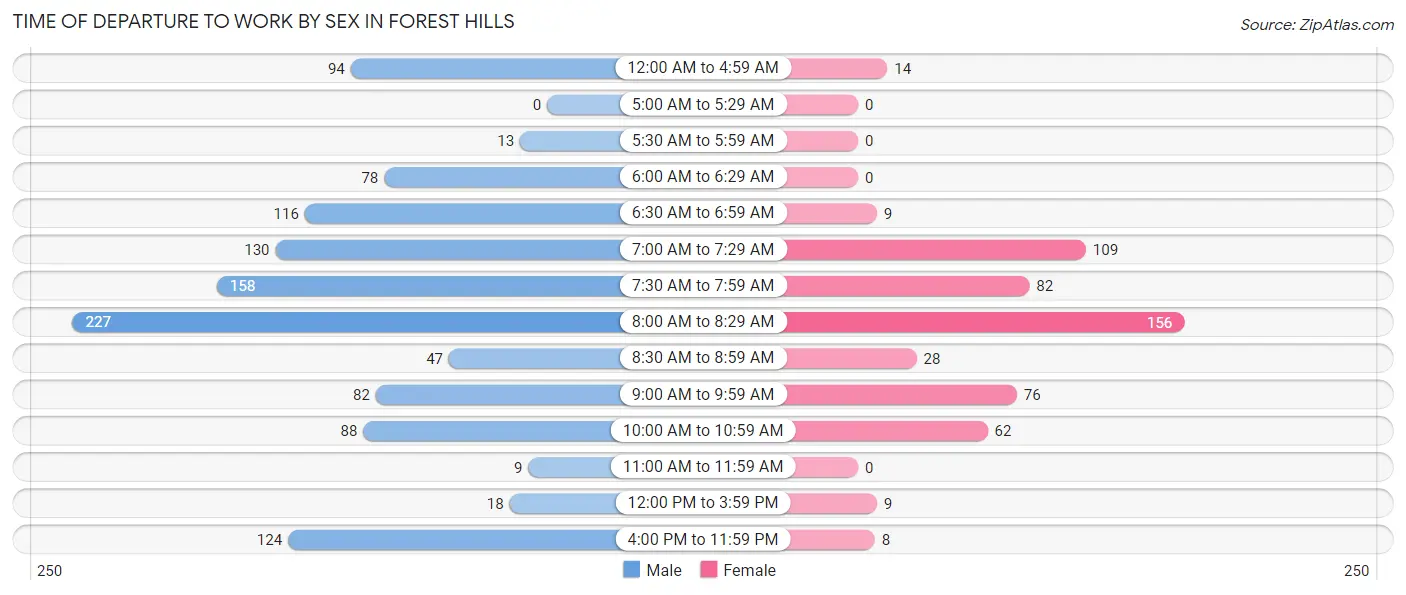
| Time of Departure | Male | Female |
| 12:00 AM to 4:59 AM | 94 (7.9%) | 14 (2.5%) |
| 5:00 AM to 5:29 AM | 0 (0.0%) | 0 (0.0%) |
| 5:30 AM to 5:59 AM | 13 (1.1%) | 0 (0.0%) |
| 6:00 AM to 6:29 AM | 78 (6.6%) | 0 (0.0%) |
| 6:30 AM to 6:59 AM | 116 (9.8%) | 9 (1.6%) |
| 7:00 AM to 7:29 AM | 130 (11.0%) | 109 (19.7%) |
| 7:30 AM to 7:59 AM | 158 (13.3%) | 82 (14.8%) |
| 8:00 AM to 8:29 AM | 227 (19.2%) | 156 (28.2%) |
| 8:30 AM to 8:59 AM | 47 (4.0%) | 28 (5.1%) |
| 9:00 AM to 9:59 AM | 82 (6.9%) | 76 (13.7%) |
| 10:00 AM to 10:59 AM | 88 (7.4%) | 62 (11.2%) |
| 11:00 AM to 11:59 AM | 9 (0.8%) | 0 (0.0%) |
| 12:00 PM to 3:59 PM | 18 (1.5%) | 9 (1.6%) |
| 4:00 PM to 11:59 PM | 124 (10.5%) | 8 (1.5%) |
| Total | 1,184 (100.0%) | 553 (100.0%) |
Housing Occupancy in Forest Hills
Occupancy by Ownership in Forest Hills
Of the total 1,798 dwellings in Forest Hills, owner-occupied units account for 1,758 (97.8%), while renter-occupied units make up 40 (2.2%).
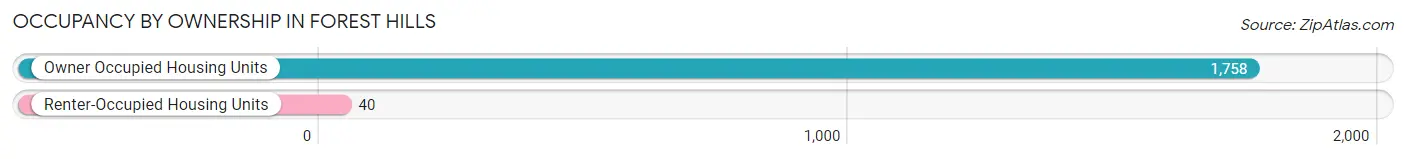
| Occupancy | # Housing Units | % Housing Units |
| Owner Occupied Housing Units | 1,758 | 97.8% |
| Renter-Occupied Housing Units | 40 | 2.2% |
| Total Occupied Housing Units | 1,798 | 100.0% |
Occupancy by Household Size in Forest Hills
| Household Size | # Housing Units | % Housing Units |
| 1-Person Household | 292 | 16.2% |
| 2-Person Household | 701 | 39.0% |
| 3-Person Household | 256 | 14.2% |
| 4+ Person Household | 549 | 30.5% |
| Total Housing Units | 1,798 | 100.0% |
Occupancy by Ownership by Household Size in Forest Hills
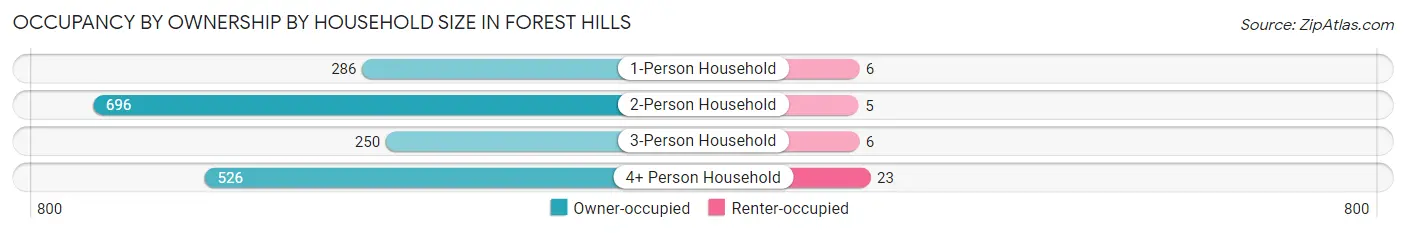
| Household Size | Owner-occupied | Renter-occupied |
| 1-Person Household | 286 (98.0%) | 6 (2.1%) |
| 2-Person Household | 696 (99.3%) | 5 (0.7%) |
| 3-Person Household | 250 (97.7%) | 6 (2.3%) |
| 4+ Person Household | 526 (95.8%) | 23 (4.2%) |
| Total Housing Units | 1,758 (97.8%) | 40 (2.2%) |
Occupancy by Educational Attainment in Forest Hills
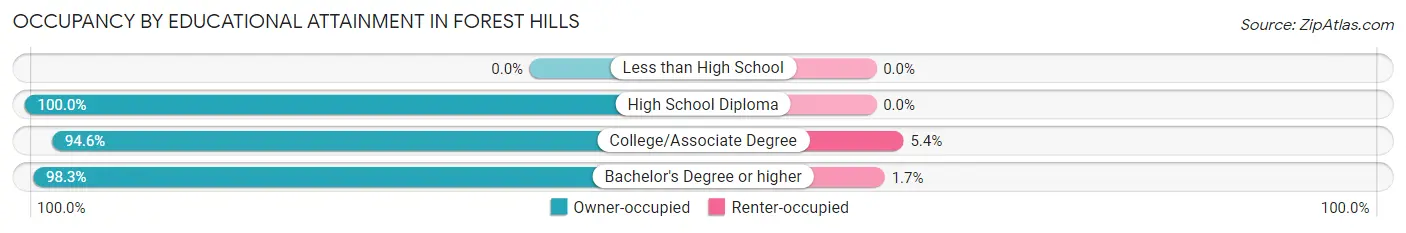
| Household Size | Owner-occupied | Renter-occupied |
| Less than High School | 0 (0.0%) | 0 (0.0%) |
| High School Diploma | 40 (100.0%) | 0 (0.0%) |
| College/Associate Degree | 262 (94.6%) | 15 (5.4%) |
| Bachelor's Degree or higher | 1,456 (98.3%) | 25 (1.7%) |
Occupancy by Age of Householder in Forest Hills
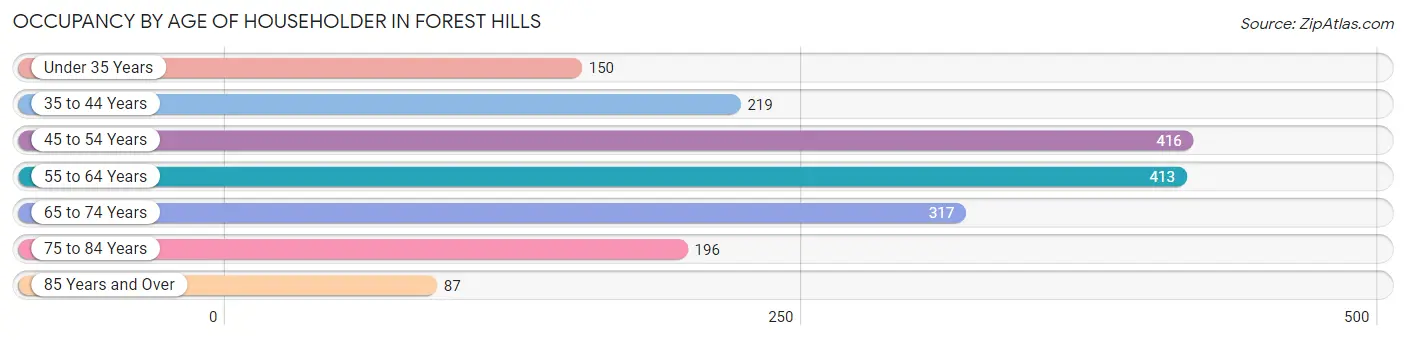
| Age Bracket | # Households | % Households |
| Under 35 Years | 150 | 8.3% |
| 35 to 44 Years | 219 | 12.2% |
| 45 to 54 Years | 416 | 23.1% |
| 55 to 64 Years | 413 | 23.0% |
| 65 to 74 Years | 317 | 17.6% |
| 75 to 84 Years | 196 | 10.9% |
| 85 Years and Over | 87 | 4.8% |
| Total | 1,798 | 100.0% |
Housing Finances in Forest Hills
Median Income by Occupancy in Forest Hills
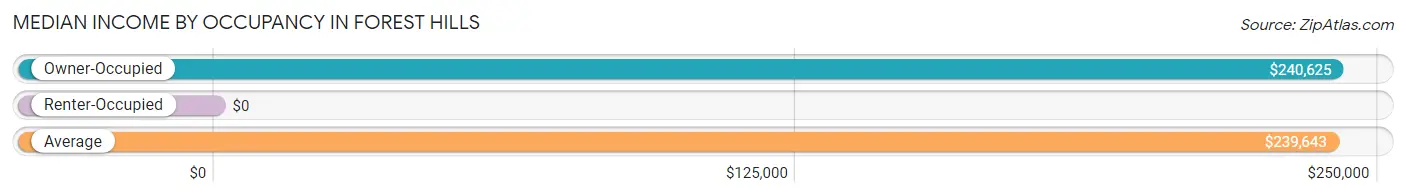
| Occupancy Type | # Households | Median Income |
| Owner-Occupied | 1,758 (97.8%) | $240,625 |
| Renter-Occupied | 40 (2.2%) | $0 |
| Average | 1,798 (100.0%) | $239,643 |
Occupancy by Householder Income Bracket in Forest Hills
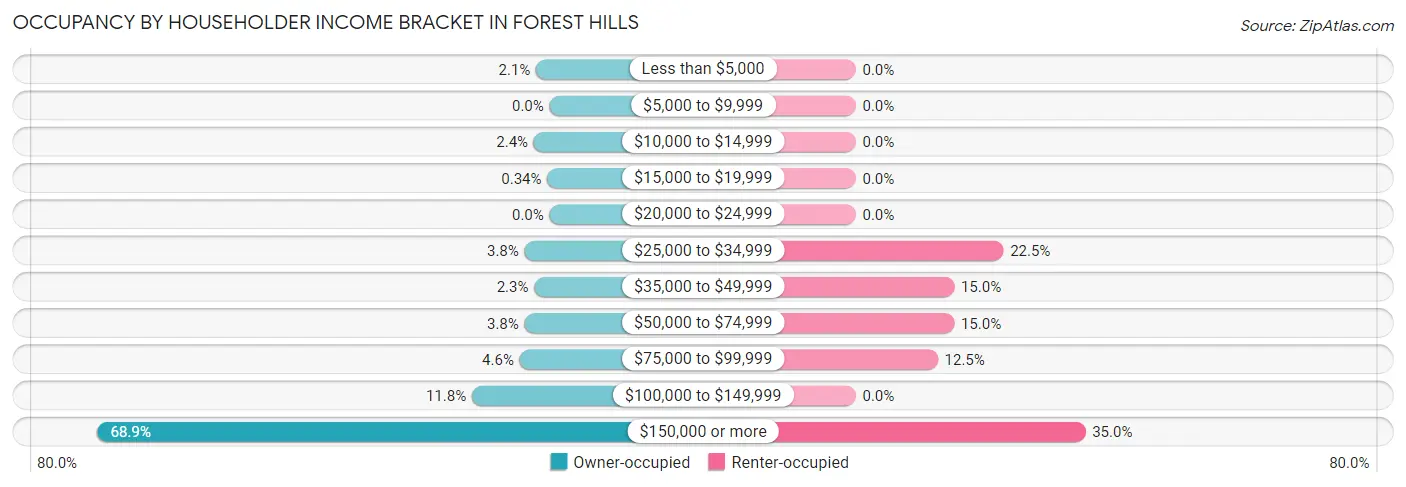
| Income Bracket | Owner-occupied | Renter-occupied |
| Less than $5,000 | 36 (2.1%) | 0 (0.0%) |
| $5,000 to $9,999 | 0 (0.0%) | 0 (0.0%) |
| $10,000 to $14,999 | 42 (2.4%) | 0 (0.0%) |
| $15,000 to $19,999 | 6 (0.3%) | 0 (0.0%) |
| $20,000 to $24,999 | 0 (0.0%) | 0 (0.0%) |
| $25,000 to $34,999 | 67 (3.8%) | 9 (22.5%) |
| $35,000 to $49,999 | 41 (2.3%) | 6 (15.0%) |
| $50,000 to $74,999 | 67 (3.8%) | 6 (15.0%) |
| $75,000 to $99,999 | 80 (4.5%) | 5 (12.5%) |
| $100,000 to $149,999 | 208 (11.8%) | 0 (0.0%) |
| $150,000 or more | 1,211 (68.9%) | 14 (35.0%) |
| Total | 1,758 (100.0%) | 40 (100.0%) |
Monthly Housing Cost Tiers in Forest Hills
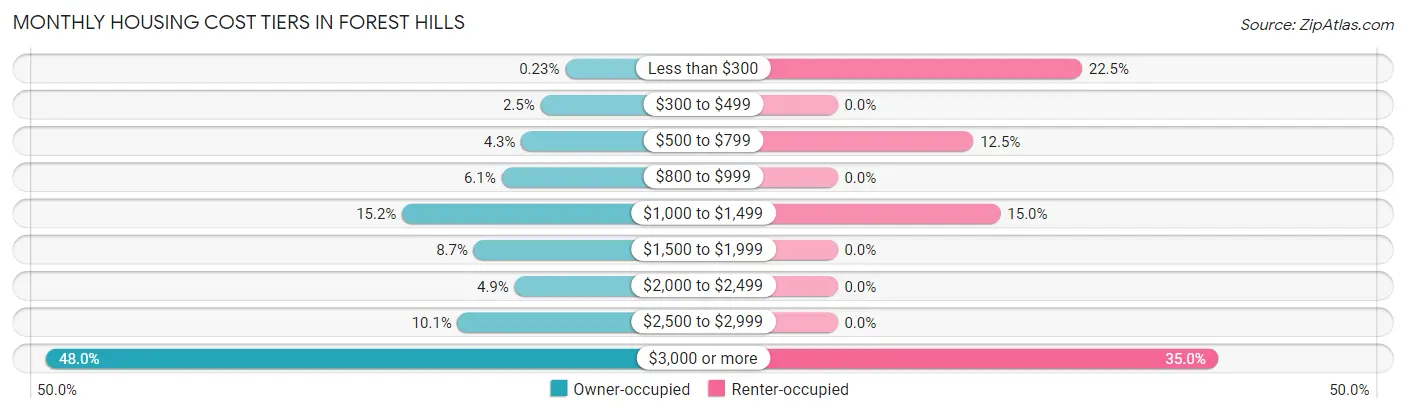
| Monthly Cost | Owner-occupied | Renter-occupied |
| Less than $300 | 4 (0.2%) | 9 (22.5%) |
| $300 to $499 | 44 (2.5%) | 0 (0.0%) |
| $500 to $799 | 75 (4.3%) | 5 (12.5%) |
| $800 to $999 | 107 (6.1%) | 0 (0.0%) |
| $1,000 to $1,499 | 268 (15.2%) | 6 (15.0%) |
| $1,500 to $1,999 | 152 (8.6%) | 0 (0.0%) |
| $2,000 to $2,499 | 86 (4.9%) | 0 (0.0%) |
| $2,500 to $2,999 | 178 (10.1%) | 0 (0.0%) |
| $3,000 or more | 844 (48.0%) | 14 (35.0%) |
| Total | 1,758 (100.0%) | 40 (100.0%) |
Physical Housing Characteristics in Forest Hills
Housing Structures in Forest Hills
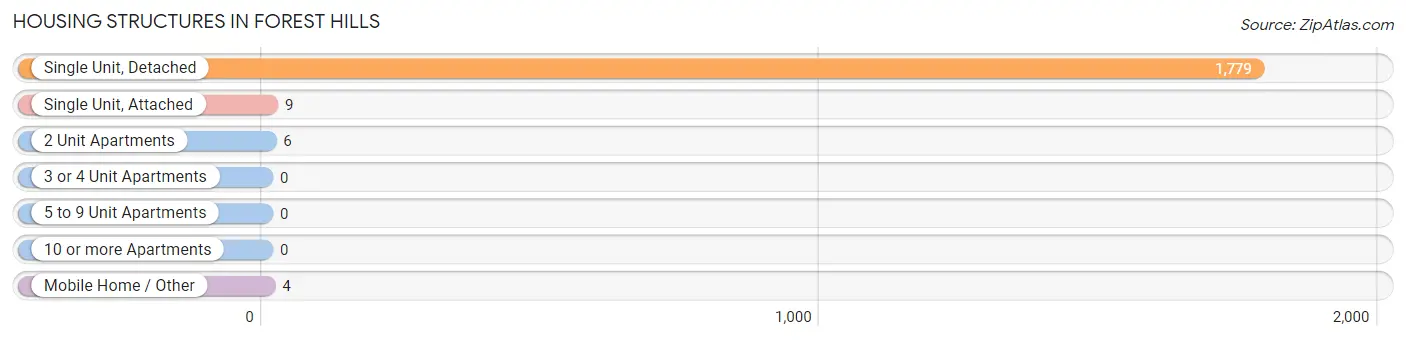
| Structure Type | # Housing Units | % Housing Units |
| Single Unit, Detached | 1,779 | 98.9% |
| Single Unit, Attached | 9 | 0.5% |
| 2 Unit Apartments | 6 | 0.3% |
| 3 or 4 Unit Apartments | 0 | 0.0% |
| 5 to 9 Unit Apartments | 0 | 0.0% |
| 10 or more Apartments | 0 | 0.0% |
| Mobile Home / Other | 4 | 0.2% |
| Total | 1,798 | 100.0% |
Housing Structures by Occupancy in Forest Hills
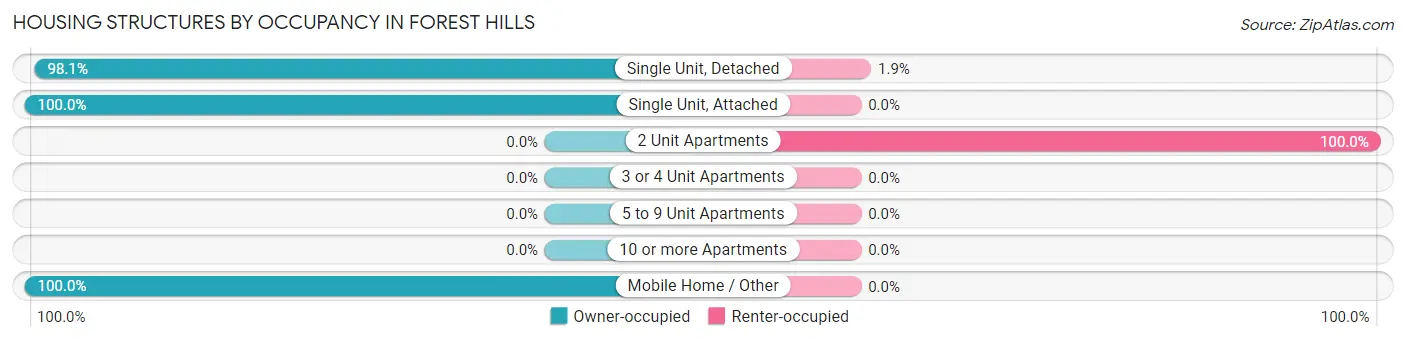
| Structure Type | Owner-occupied | Renter-occupied |
| Single Unit, Detached | 1,745 (98.1%) | 34 (1.9%) |
| Single Unit, Attached | 9 (100.0%) | 0 (0.0%) |
| 2 Unit Apartments | 0 (0.0%) | 6 (100.0%) |
| 3 or 4 Unit Apartments | 0 (0.0%) | 0 (0.0%) |
| 5 to 9 Unit Apartments | 0 (0.0%) | 0 (0.0%) |
| 10 or more Apartments | 0 (0.0%) | 0 (0.0%) |
| Mobile Home / Other | 4 (100.0%) | 0 (0.0%) |
| Total | 1,758 (97.8%) | 40 (2.2%) |
Housing Structures by Number of Rooms in Forest Hills
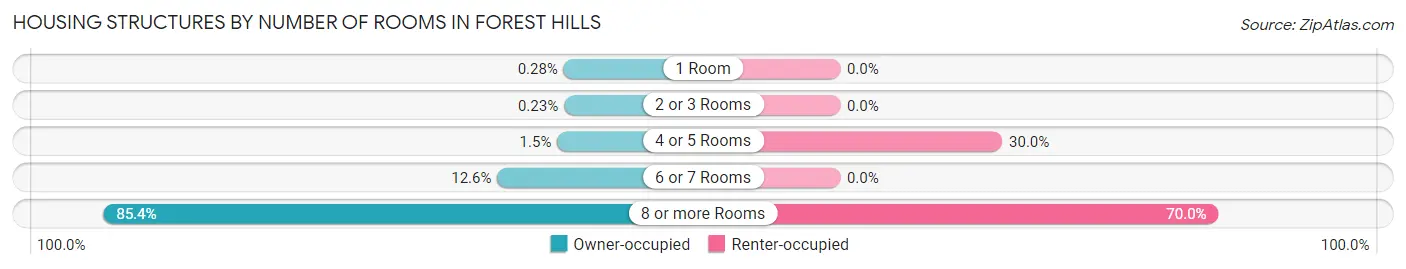
| Number of Rooms | Owner-occupied | Renter-occupied |
| 1 Room | 5 (0.3%) | 0 (0.0%) |
| 2 or 3 Rooms | 4 (0.2%) | 0 (0.0%) |
| 4 or 5 Rooms | 26 (1.5%) | 12 (30.0%) |
| 6 or 7 Rooms | 221 (12.6%) | 0 (0.0%) |
| 8 or more Rooms | 1,502 (85.4%) | 28 (70.0%) |
| Total | 1,758 (100.0%) | 40 (100.0%) |
Housing Structure by Heating Type in Forest Hills
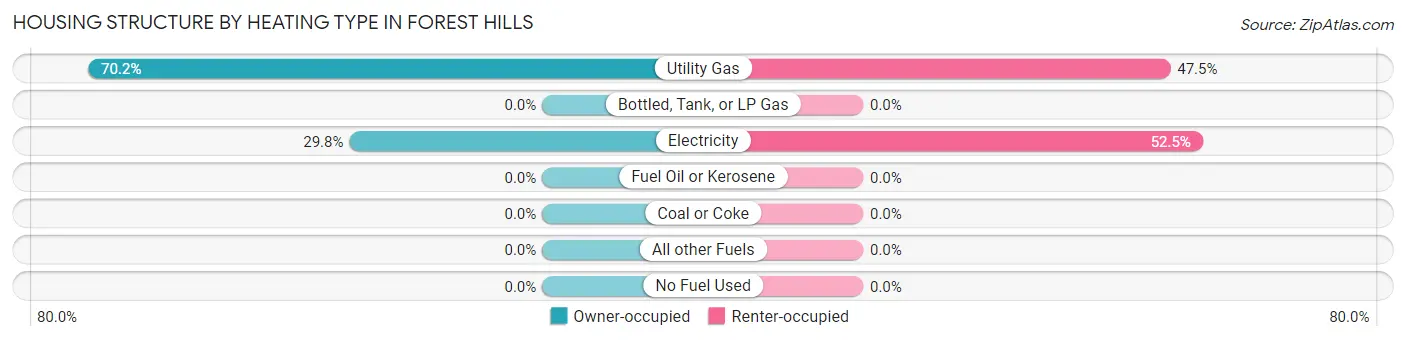
| Heating Type | Owner-occupied | Renter-occupied |
| Utility Gas | 1,234 (70.2%) | 19 (47.5%) |
| Bottled, Tank, or LP Gas | 0 (0.0%) | 0 (0.0%) |
| Electricity | 524 (29.8%) | 21 (52.5%) |
| Fuel Oil or Kerosene | 0 (0.0%) | 0 (0.0%) |
| Coal or Coke | 0 (0.0%) | 0 (0.0%) |
| All other Fuels | 0 (0.0%) | 0 (0.0%) |
| No Fuel Used | 0 (0.0%) | 0 (0.0%) |
| Total | 1,758 (100.0%) | 40 (100.0%) |
Household Vehicle Usage in Forest Hills
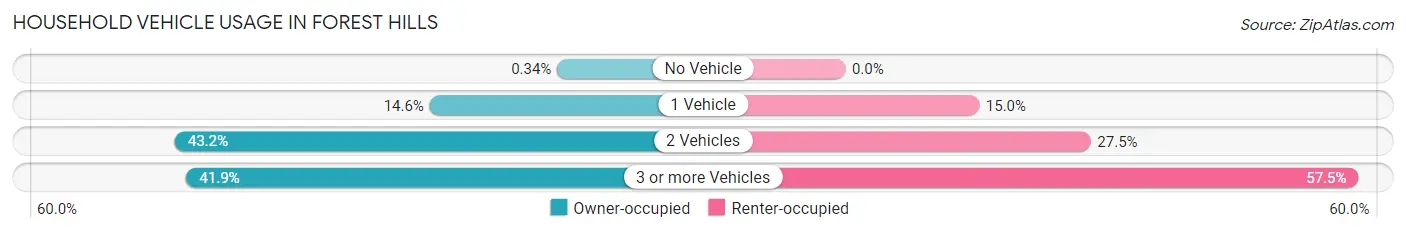
| Vehicles per Household | Owner-occupied | Renter-occupied |
| No Vehicle | 6 (0.3%) | 0 (0.0%) |
| 1 Vehicle | 257 (14.6%) | 6 (15.0%) |
| 2 Vehicles | 759 (43.2%) | 11 (27.5%) |
| 3 or more Vehicles | 736 (41.9%) | 23 (57.5%) |
| Total | 1,758 (100.0%) | 40 (100.0%) |
Real Estate & Mortgages in Forest Hills
Real Estate and Mortgage Overview in Forest Hills
| Characteristic | Without Mortgage | With Mortgage |
| Housing Units | 684 | 1,074 |
| Median Property Value | $1,106,100 | $995,800 |
| Median Household Income | $250,001 | $761 |
| Monthly Housing Costs | $1,129 | $800 |
| Real Estate Taxes | $6,516 | $30 |
Property Value by Mortgage Status in Forest Hills
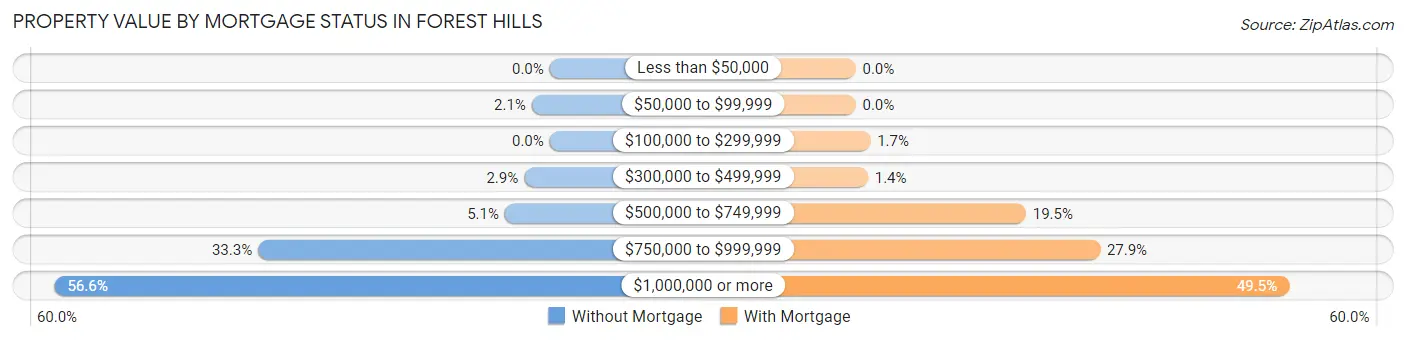
| Property Value | Without Mortgage | With Mortgage |
| Less than $50,000 | 0 (0.0%) | 0 (0.0%) |
| $50,000 to $99,999 | 14 (2.1%) | 0 (0.0%) |
| $100,000 to $299,999 | 0 (0.0%) | 18 (1.7%) |
| $300,000 to $499,999 | 20 (2.9%) | 15 (1.4%) |
| $500,000 to $749,999 | 35 (5.1%) | 209 (19.5%) |
| $750,000 to $999,999 | 228 (33.3%) | 300 (27.9%) |
| $1,000,000 or more | 387 (56.6%) | 532 (49.5%) |
| Total | 684 (100.0%) | 1,074 (100.0%) |
Household Income by Mortgage Status in Forest Hills
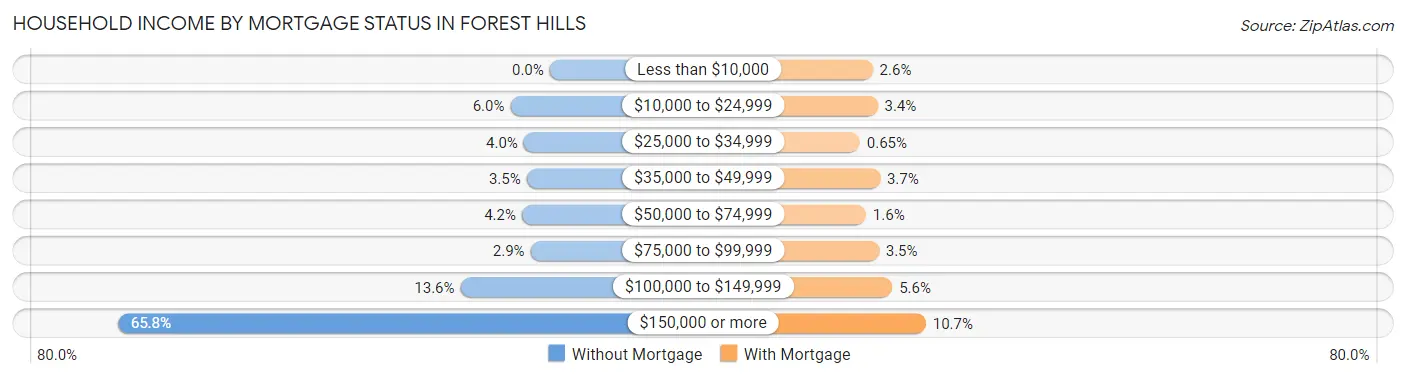
| Household Income | Without Mortgage | With Mortgage |
| Less than $10,000 | 0 (0.0%) | 28 (2.6%) |
| $10,000 to $24,999 | 41 (6.0%) | 36 (3.4%) |
| $25,000 to $34,999 | 27 (4.0%) | 7 (0.6%) |
| $35,000 to $49,999 | 24 (3.5%) | 40 (3.7%) |
| $50,000 to $74,999 | 29 (4.2%) | 17 (1.6%) |
| $75,000 to $99,999 | 20 (2.9%) | 38 (3.5%) |
| $100,000 to $149,999 | 93 (13.6%) | 60 (5.6%) |
| $150,000 or more | 450 (65.8%) | 115 (10.7%) |
| Total | 684 (100.0%) | 1,074 (100.0%) |
Property Value to Household Income Ratio in Forest Hills
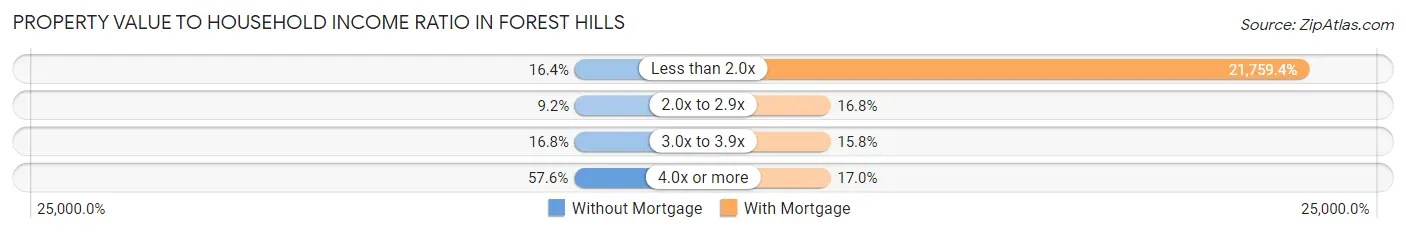
| Value-to-Income Ratio | Without Mortgage | With Mortgage |
| Less than 2.0x | 112 (16.4%) | 233,696 (21,759.4%) |
| 2.0x to 2.9x | 63 (9.2%) | 180 (16.8%) |
| 3.0x to 3.9x | 115 (16.8%) | 170 (15.8%) |
| 4.0x or more | 394 (57.6%) | 182 (17.0%) |
| Total | 684 (100.0%) | 1,074 (100.0%) |
Real Estate Taxes by Mortgage Status in Forest Hills
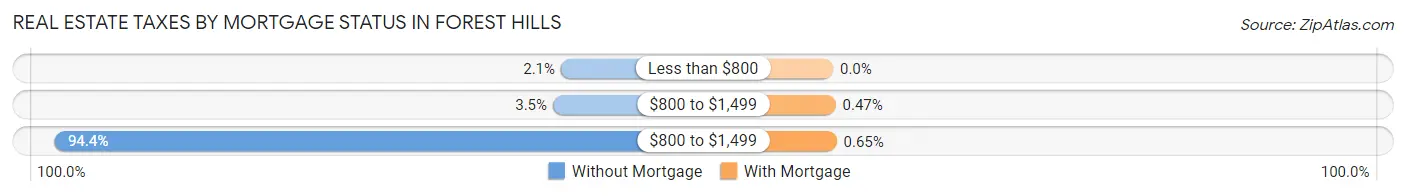
| Property Taxes | Without Mortgage | With Mortgage |
| Less than $800 | 14 (2.1%) | 0 (0.0%) |
| $800 to $1,499 | 24 (3.5%) | 5 (0.5%) |
| $800 to $1,499 | 646 (94.4%) | 7 (0.6%) |
| Total | 684 (100.0%) | 1,074 (100.0%) |
Health & Disability in Forest Hills
Health Insurance Coverage by Age in Forest Hills
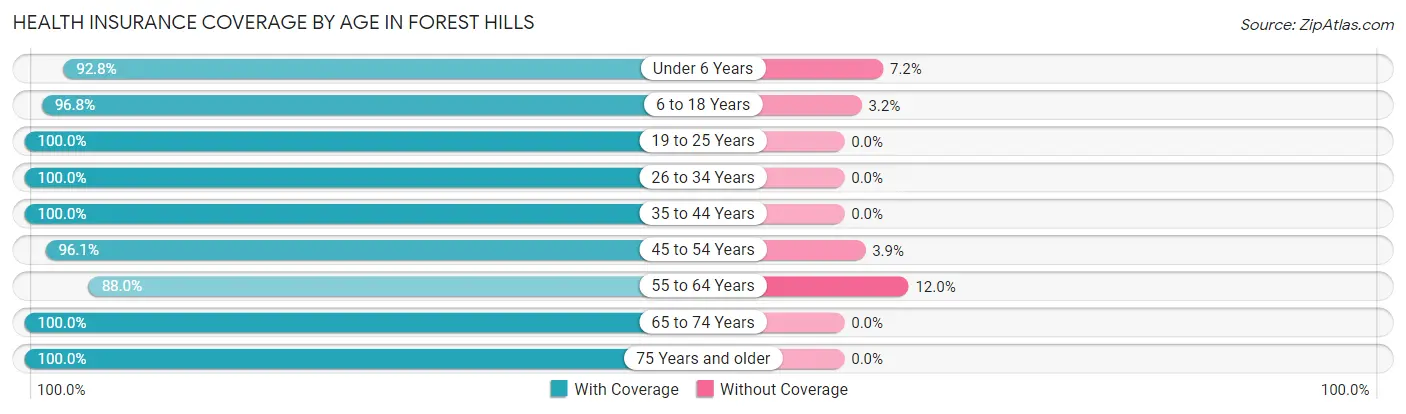
| Age Bracket | With Coverage | Without Coverage |
| Under 6 Years | 424 (92.8%) | 33 (7.2%) |
| 6 to 18 Years | 725 (96.8%) | 24 (3.2%) |
| 19 to 25 Years | 241 (100.0%) | 0 (0.0%) |
| 26 to 34 Years | 334 (100.0%) | 0 (0.0%) |
| 35 to 44 Years | 404 (100.0%) | 0 (0.0%) |
| 45 to 54 Years | 740 (96.1%) | 30 (3.9%) |
| 55 to 64 Years | 794 (88.0%) | 108 (12.0%) |
| 65 to 74 Years | 583 (100.0%) | 0 (0.0%) |
| 75 Years and older | 482 (100.0%) | 0 (0.0%) |
| Total | 4,727 (96.0%) | 195 (4.0%) |
Health Insurance Coverage by Citizenship Status in Forest Hills
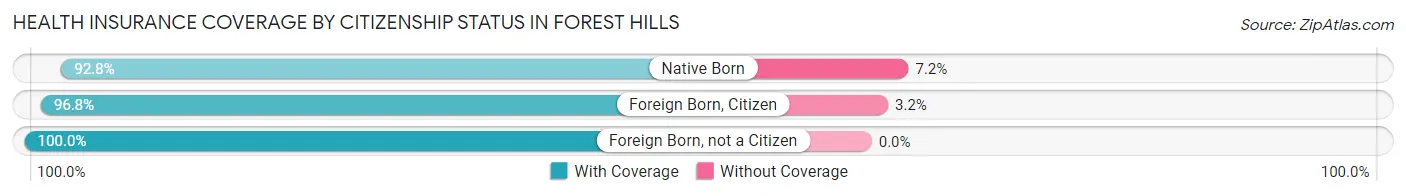
| Citizenship Status | With Coverage | Without Coverage |
| Native Born | 424 (92.8%) | 33 (7.2%) |
| Foreign Born, Citizen | 725 (96.8%) | 24 (3.2%) |
| Foreign Born, not a Citizen | 241 (100.0%) | 0 (0.0%) |
Health Insurance Coverage by Household Income in Forest Hills
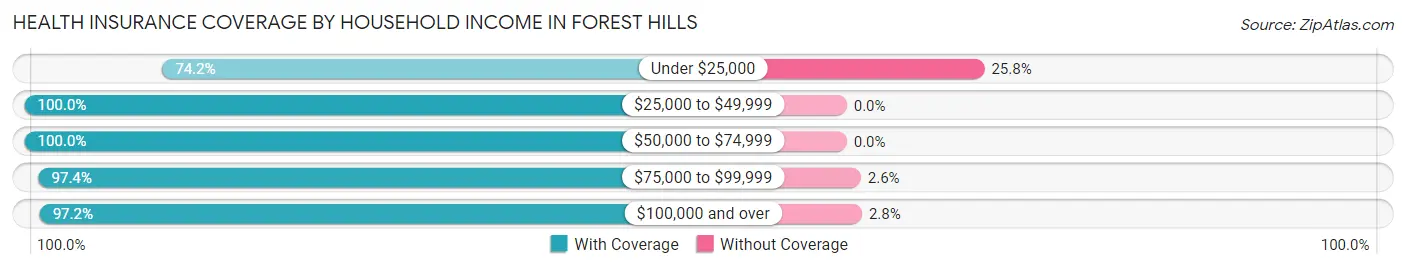
| Household Income | With Coverage | Without Coverage |
| Under $25,000 | 210 (74.2%) | 73 (25.8%) |
| $25,000 to $49,999 | 177 (100.0%) | 0 (0.0%) |
| $50,000 to $74,999 | 151 (100.0%) | 0 (0.0%) |
| $75,000 to $99,999 | 148 (97.4%) | 4 (2.6%) |
| $100,000 and over | 4,041 (97.2%) | 118 (2.8%) |
Public vs Private Health Insurance Coverage by Age in Forest Hills
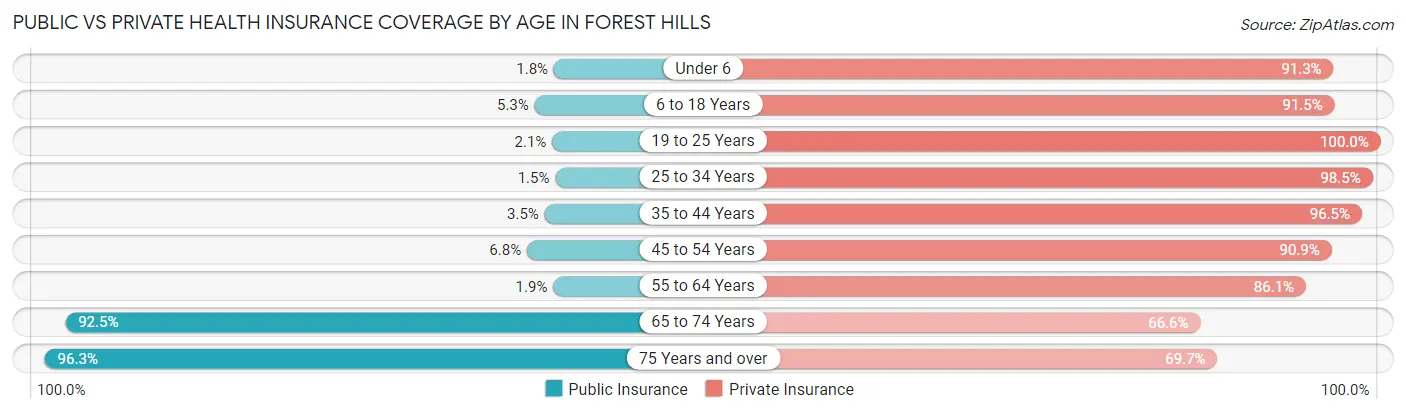
| Age Bracket | Public Insurance | Private Insurance |
| Under 6 | 8 (1.8%) | 417 (91.2%) |
| 6 to 18 Years | 40 (5.3%) | 685 (91.5%) |
| 19 to 25 Years | 5 (2.1%) | 241 (100.0%) |
| 25 to 34 Years | 5 (1.5%) | 329 (98.5%) |
| 35 to 44 Years | 14 (3.5%) | 390 (96.5%) |
| 45 to 54 Years | 52 (6.8%) | 700 (90.9%) |
| 55 to 64 Years | 17 (1.9%) | 777 (86.1%) |
| 65 to 74 Years | 539 (92.4%) | 388 (66.5%) |
| 75 Years and over | 464 (96.3%) | 336 (69.7%) |
| Total | 1,144 (23.2%) | 4,263 (86.6%) |
Disability Status by Sex by Age in Forest Hills
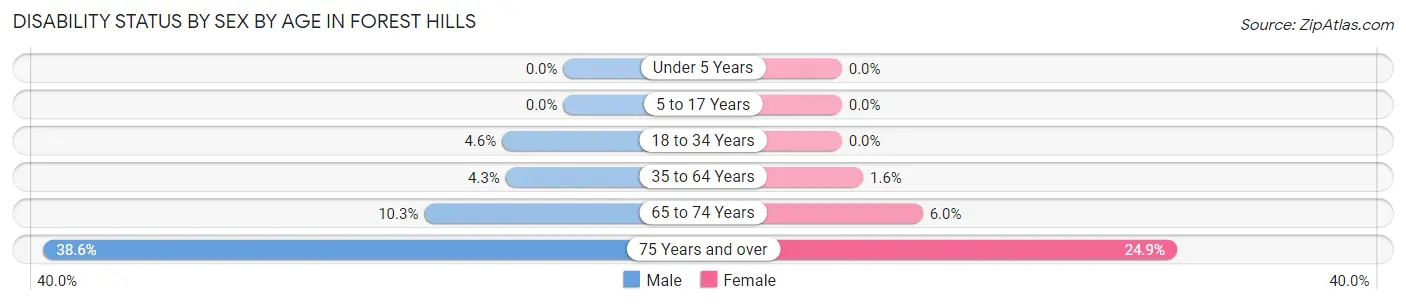
| Age Bracket | Male | Female |
| Under 5 Years | 0 (0.0%) | 0 (0.0%) |
| 5 to 17 Years | 0 (0.0%) | 0 (0.0%) |
| 18 to 34 Years | 17 (4.5%) | 0 (0.0%) |
| 35 to 64 Years | 40 (4.3%) | 18 (1.6%) |
| 65 to 74 Years | 31 (10.3%) | 17 (6.0%) |
| 75 Years and over | 110 (38.6%) | 49 (24.9%) |
Disability Class by Sex by Age in Forest Hills
Disability Class: Hearing Difficulty
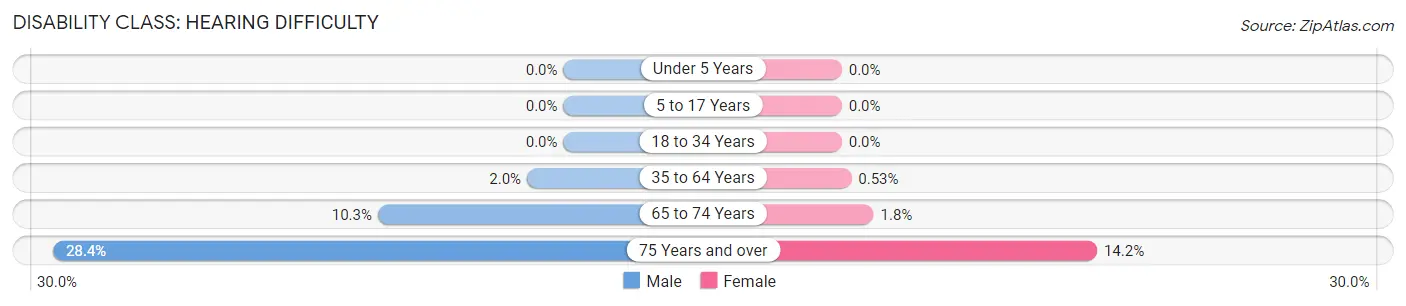
| Age Bracket | Male | Female |
| Under 5 Years | 0 (0.0%) | 0 (0.0%) |
| 5 to 17 Years | 0 (0.0%) | 0 (0.0%) |
| 18 to 34 Years | 0 (0.0%) | 0 (0.0%) |
| 35 to 64 Years | 19 (2.0%) | 6 (0.5%) |
| 65 to 74 Years | 31 (10.3%) | 5 (1.8%) |
| 75 Years and over | 81 (28.4%) | 28 (14.2%) |
Disability Class: Vision Difficulty
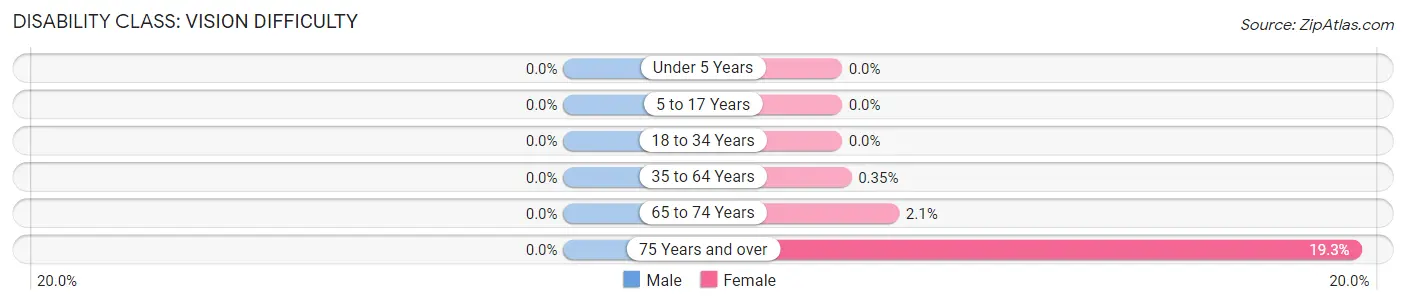
| Age Bracket | Male | Female |
| Under 5 Years | 0 (0.0%) | 0 (0.0%) |
| 5 to 17 Years | 0 (0.0%) | 0 (0.0%) |
| 18 to 34 Years | 0 (0.0%) | 0 (0.0%) |
| 35 to 64 Years | 0 (0.0%) | 4 (0.4%) |
| 65 to 74 Years | 0 (0.0%) | 6 (2.1%) |
| 75 Years and over | 0 (0.0%) | 38 (19.3%) |
Disability Class: Cognitive Difficulty
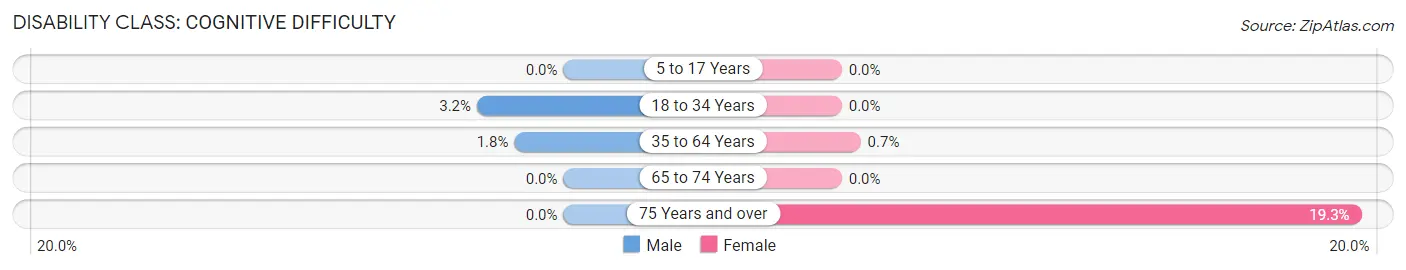
| Age Bracket | Male | Female |
| 5 to 17 Years | 0 (0.0%) | 0 (0.0%) |
| 18 to 34 Years | 12 (3.2%) | 0 (0.0%) |
| 35 to 64 Years | 17 (1.8%) | 8 (0.7%) |
| 65 to 74 Years | 0 (0.0%) | 0 (0.0%) |
| 75 Years and over | 0 (0.0%) | 38 (19.3%) |
Disability Class: Ambulatory Difficulty
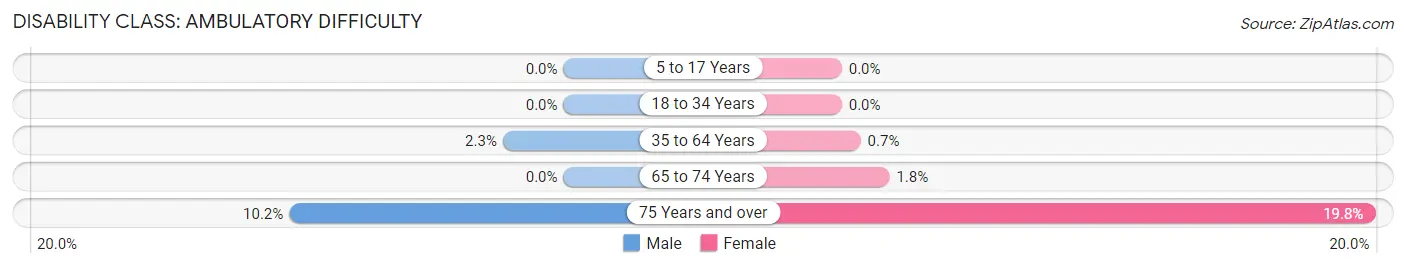
| Age Bracket | Male | Female |
| 5 to 17 Years | 0 (0.0%) | 0 (0.0%) |
| 18 to 34 Years | 0 (0.0%) | 0 (0.0%) |
| 35 to 64 Years | 21 (2.2%) | 8 (0.7%) |
| 65 to 74 Years | 0 (0.0%) | 5 (1.8%) |
| 75 Years and over | 29 (10.2%) | 39 (19.8%) |
Disability Class: Self-Care Difficulty
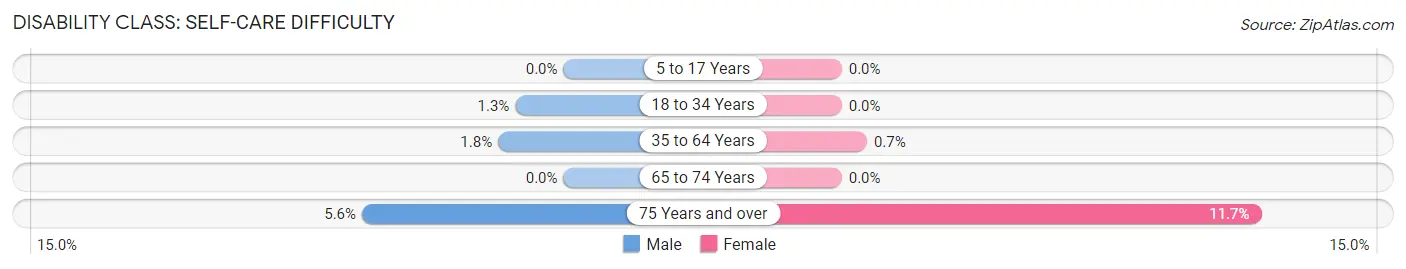
| Age Bracket | Male | Female |
| 5 to 17 Years | 0 (0.0%) | 0 (0.0%) |
| 18 to 34 Years | 5 (1.3%) | 0 (0.0%) |
| 35 to 64 Years | 17 (1.8%) | 8 (0.7%) |
| 65 to 74 Years | 0 (0.0%) | 0 (0.0%) |
| 75 Years and over | 16 (5.6%) | 23 (11.7%) |
Technology Access in Forest Hills
Computing Device Access in Forest Hills
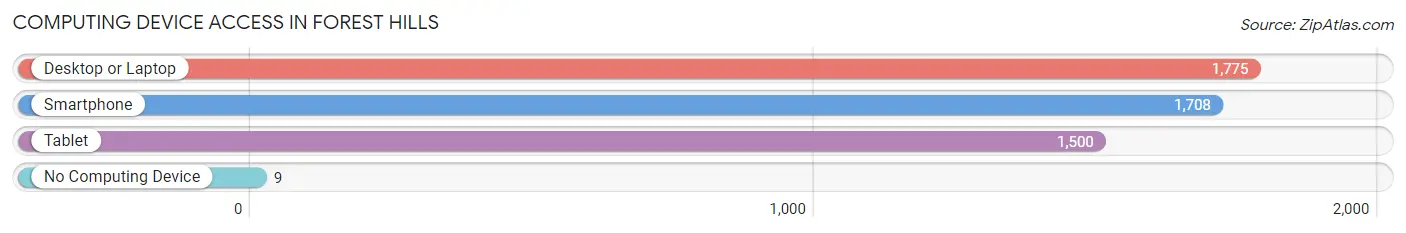
| Device Type | # Households | % Households |
| Desktop or Laptop | 1,775 | 98.7% |
| Smartphone | 1,708 | 95.0% |
| Tablet | 1,500 | 83.4% |
| No Computing Device | 9 | 0.5% |
| Total | 1,798 | 100.0% |
Internet Access in Forest Hills
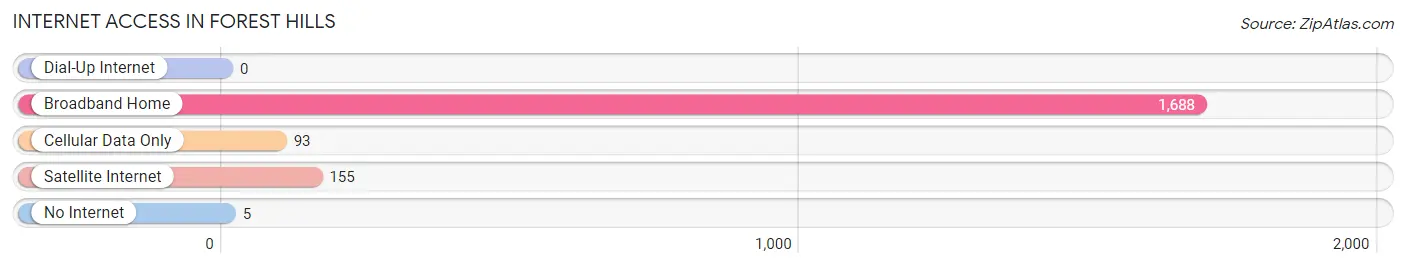
| Internet Type | # Households | % Households |
| Dial-Up Internet | 0 | 0.0% |
| Broadband Home | 1,688 | 93.9% |
| Cellular Data Only | 93 | 5.2% |
| Satellite Internet | 155 | 8.6% |
| No Internet | 5 | 0.3% |
| Total | 1,798 | 100.0% |
Forest Hills Summary
History
The area now known as Forest Hills, Tennessee was first settled in the late 1700s by a group of settlers from North Carolina. The area was originally known as “The Big Bottom” due to its large, flat bottomland. The settlers built a small community and named it Forest Hills after the abundance of trees in the area.
In 1820, the first post office was established in Forest Hills. The town grew slowly over the next few decades, with the population reaching just over 200 by the time of the Civil War. During the war, the town was occupied by Union forces and the post office was closed. After the war, the town slowly began to rebuild and the post office was reopened in 1868.
In the late 1800s, the town began to grow rapidly. The railroad came to town in 1887, bringing with it new businesses and industry. The town was incorporated in 1889 and the population had grown to over 1,000 by the turn of the century.
In the early 1900s, the town continued to grow and prosper. The town was home to several businesses, including a cotton mill, a furniture factory, and a brickyard. The town also had several churches, a school, and a library.
In the 1950s, the town began to decline as many of the businesses and factories closed. The population dropped to just over 500 by the 1970s. In the 1980s, the town began to experience a resurgence as new businesses and industries moved into the area. The population has grown steadily since then and now stands at over 2,000.
Geography
Forest Hills is located in Davidson County, Tennessee, about 15 miles south of Nashville. The town is situated in a valley between two hills, hence the name. The town is bordered by the Harpeth River to the east and the Cumberland River to the west. The town is located in a temperate climate, with hot summers and mild winters.
Economy
The economy of Forest Hills is largely based on the service industry. The town is home to several restaurants, retail stores, and other businesses. The town is also home to several manufacturing companies, including a furniture factory and a brickyard. The town is also home to several farms, which produce a variety of crops.
Demographics
As of the 2010 census, the population of Forest Hills was 2,072. The population is largely white (90.2%), with small percentages of African American (4.3%), Hispanic (2.2%), and Asian (1.3%) residents. The median household income is $50,945, and the median home value is $179,400. The town has a low unemployment rate of 4.2%.
Common Questions
What is Per Capita Income in Forest Hills?
Per Capita income in Forest Hills is $138,286.
What is the Median Family Income in Forest Hills?
Median Family Income in Forest Hills is $250,001.
What is the Median Household income in Forest Hills?
Median Household Income in Forest Hills is $239,643.
What is Income or Wage Gap in Forest Hills?
Income or Wage Gap in Forest Hills is 59.8%.
Women in Forest Hills earn 40.2 cents for every dollar earned by a man.
What is Family Income Deficit in Forest Hills?
Family Income Deficit in Forest Hills is $19,504.
Families that are below poverty line in Forest Hills earn $19,504 less on average than the poverty threshold level.
What is Inequality or Gini Index in Forest Hills?
Inequality or Gini Index in Forest Hills is 0.51.
What is the Total Population of Forest Hills?
Total Population of Forest Hills is 4,922.
What is the Total Male Population of Forest Hills?
Total Male Population of Forest Hills is 2,467.
What is the Total Female Population of Forest Hills?
Total Female Population of Forest Hills is 2,455.
What is the Ratio of Males per 100 Females in Forest Hills?
There are 100.49 Males per 100 Females in Forest Hills.
What is the Ratio of Females per 100 Males in Forest Hills?
There are 99.51 Females per 100 Males in Forest Hills.
What is the Median Population Age in Forest Hills?
Median Population Age in Forest Hills is 48.6 Years.
What is the Average Family Size in Forest Hills
Average Family Size in Forest Hills is 3.0 People.
What is the Average Household Size in Forest Hills
Average Household Size in Forest Hills is 2.7 People.
How Large is the Labor Force in Forest Hills?
There are 2,259 People in the Labor Forcein in Forest Hills.
What is the Percentage of People in the Labor Force in Forest Hills?
57.4% of People are in the Labor Force in Forest Hills.
What is the Unemployment Rate in Forest Hills?
Unemployment Rate in Forest Hills is 1.2%.