Lakeland, TN Map & Demographics
Lakeland Map
Lakeland Overview
$48,883
PER CAPITA INCOME
$121,867
AVG FAMILY INCOME
$108,206
AVG HOUSEHOLD INCOME
29.7%
WAGE / INCOME GAP [ % ]
70.3¢/ $1
WAGE / INCOME GAP [ $ ]
0.40
INEQUALITY / GINI INDEX
13,811
TOTAL POPULATION
7,248
MALE POPULATION
6,563
FEMALE POPULATION
110.44
MALES / 100 FEMALES
90.55
FEMALES / 100 MALES
42.0
MEDIAN AGE
3.2
AVG FAMILY SIZE
2.7
AVG HOUSEHOLD SIZE
6,544
LABOR FORCE [ PEOPLE ]
62.9%
PERCENT IN LABOR FORCE
3.1%
UNEMPLOYMENT RATE
Lakeland Area Codes
Income in Lakeland
Income Overview in Lakeland
Per Capita Income in Lakeland is $48,883, while median incomes of families and households are $121,867 and $108,206 respectively.
| Characteristic | Number | Measure |
| Per Capita Income | 13,811 | $48,883 |
| Median Family Income | 3,866 | $121,867 |
| Mean Family Income | 3,866 | $150,771 |
| Median Household Income | 5,148 | $108,206 |
| Mean Household Income | 5,148 | $129,999 |
| Income Deficit | 3,866 | $0 |
| Wage / Income Gap (%) | 13,811 | 29.70% |
| Wage / Income Gap ($) | 13,811 | 70.30¢ per $1 |
| Gini / Inequality Index | 13,811 | 0.40 |
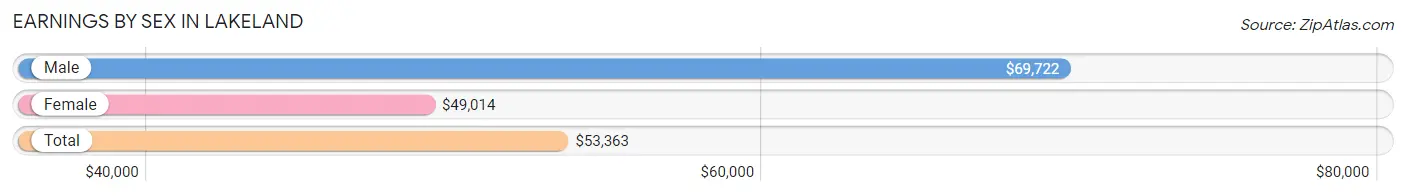
Earnings by Sex in Lakeland
Average Earnings in Lakeland are $53,363, $69,722 for men and $49,014 for women, a difference of 29.7%.
| Sex | Number | Average Earnings |
| Male | 3,954 (56.9%) | $69,722 |
| Female | 2,998 (43.1%) | $49,014 |
| Total | 6,952 (100.0%) | $53,363 |
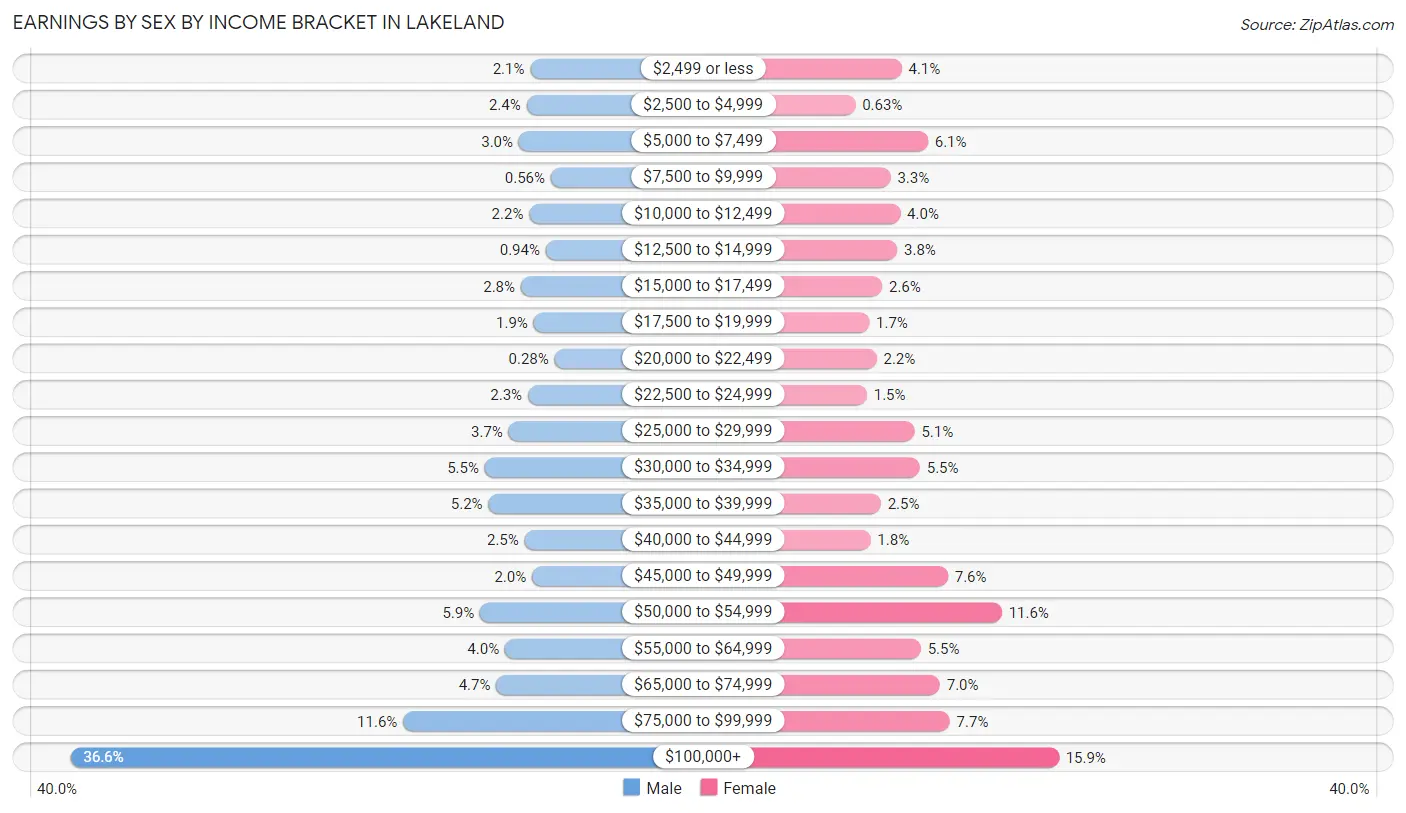
Earnings by Sex by Income Bracket in Lakeland
The most common earnings brackets in Lakeland are $100,000+ for men (1,446 | 36.6%) and $100,000+ for women (476 | 15.9%).
| Income | Male | Female |
| $2,499 or less | 83 (2.1%) | 123 (4.1%) |
| $2,500 to $4,999 | 94 (2.4%) | 19 (0.6%) |
| $5,000 to $7,499 | 117 (3.0%) | 182 (6.1%) |
| $7,500 to $9,999 | 22 (0.6%) | 98 (3.3%) |
| $10,000 to $12,499 | 86 (2.2%) | 120 (4.0%) |
| $12,500 to $14,999 | 37 (0.9%) | 113 (3.8%) |
| $15,000 to $17,499 | 111 (2.8%) | 79 (2.6%) |
| $17,500 to $19,999 | 73 (1.8%) | 50 (1.7%) |
| $20,000 to $22,499 | 11 (0.3%) | 67 (2.2%) |
| $22,500 to $24,999 | 90 (2.3%) | 45 (1.5%) |
| $25,000 to $29,999 | 147 (3.7%) | 152 (5.1%) |
| $30,000 to $34,999 | 218 (5.5%) | 164 (5.5%) |
| $35,000 to $39,999 | 207 (5.2%) | 76 (2.5%) |
| $40,000 to $44,999 | 100 (2.5%) | 53 (1.8%) |
| $45,000 to $49,999 | 78 (2.0%) | 227 (7.6%) |
| $50,000 to $54,999 | 232 (5.9%) | 348 (11.6%) |
| $55,000 to $64,999 | 158 (4.0%) | 166 (5.5%) |
| $65,000 to $74,999 | 184 (4.6%) | 209 (7.0%) |
| $75,000 to $99,999 | 460 (11.6%) | 231 (7.7%) |
| $100,000+ | 1,446 (36.6%) | 476 (15.9%) |
| Total | 3,954 (100.0%) | 2,998 (100.0%) |
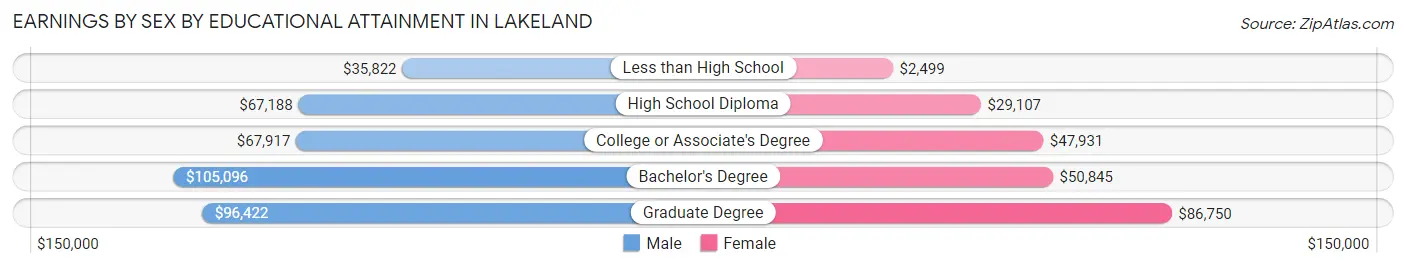
Earnings by Sex by Educational Attainment in Lakeland
Average earnings in Lakeland are $82,478 for men and $51,613 for women, a difference of 37.4%. Men with an educational attainment of bachelor's degree enjoy the highest average annual earnings of $105,096, while those with less than high school education earn the least with $35,822. Women with an educational attainment of graduate degree earn the most with the average annual earnings of $86,750, while those with less than high school education have the smallest earnings of $2,499.
| Educational Attainment | Male Income | Female Income |
| Less than High School | $35,822 | $2,499 |
| High School Diploma | $67,188 | $29,107 |
| College or Associate's Degree | $67,917 | $47,931 |
| Bachelor's Degree | $105,096 | $50,845 |
| Graduate Degree | $96,422 | $86,750 |
| Total | $82,478 | $51,613 |
Family Income in Lakeland
Family Income Brackets in Lakeland
According to the Lakeland family income data, there are 1,280 families falling into the $100,000 to $149,999 income range, which is the most common income bracket and makes up 33.1% of all families.
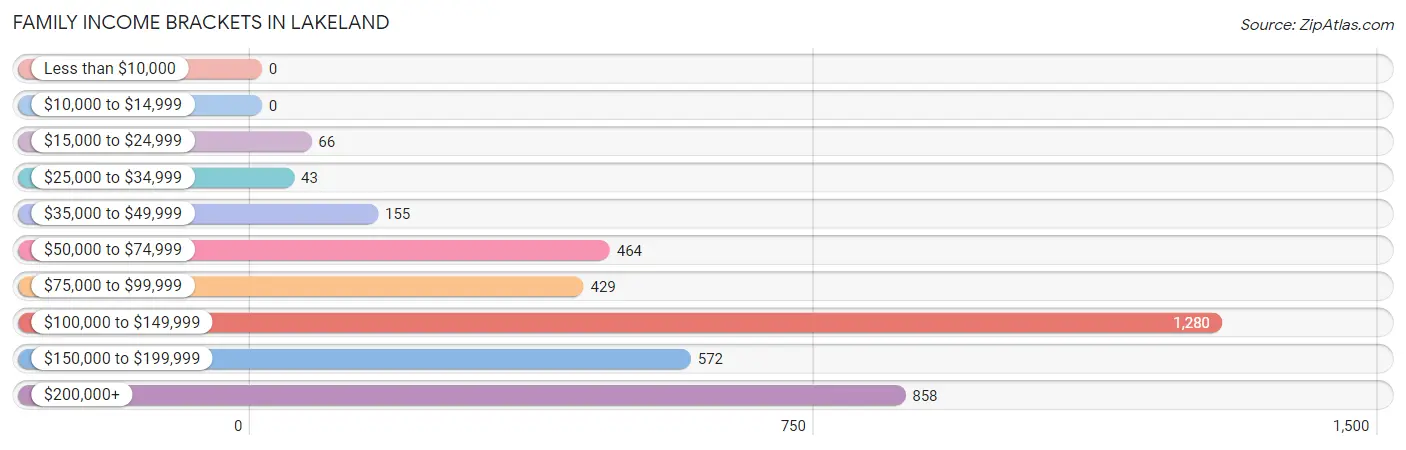
| Income Bracket | # Families | % Families |
| Less than $10,000 | 0 | 0.0% |
| $10,000 to $14,999 | 0 | 0.0% |
| $15,000 to $24,999 | 66 | 1.7% |
| $25,000 to $34,999 | 43 | 1.1% |
| $35,000 to $49,999 | 155 | 4.0% |
| $50,000 to $74,999 | 464 | 12.0% |
| $75,000 to $99,999 | 429 | 11.1% |
| $100,000 to $149,999 | 1,280 | 33.1% |
| $150,000 to $199,999 | 572 | 14.8% |
| $200,000+ | 858 | 22.2% |
Family Income by Famaliy Size in Lakeland
6-person families (118 | 3.0%) account for the highest median family income in Lakeland with $244,722 per family, while 2-person families (1,649 | 42.6%) have the highest median income of $57,766 per family member.
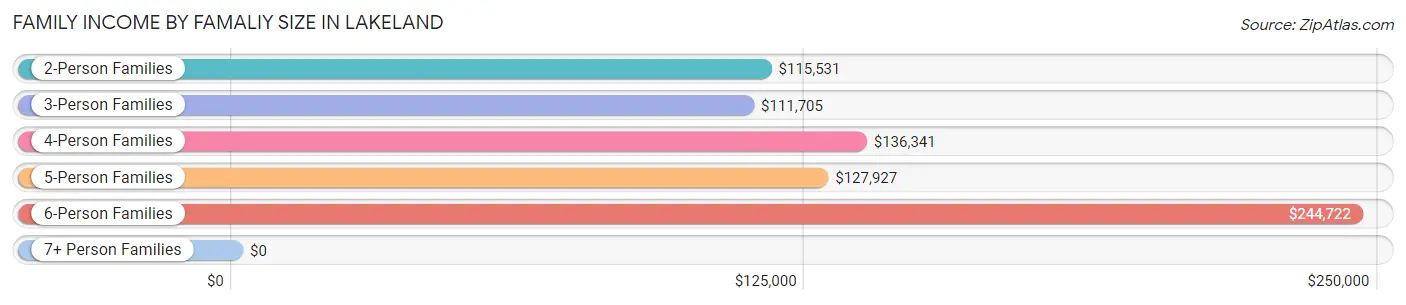
| Income Bracket | # Families | Median Income |
| 2-Person Families | 1,649 (42.6%) | $115,531 |
| 3-Person Families | 973 (25.2%) | $111,705 |
| 4-Person Families | 666 (17.2%) | $136,341 |
| 5-Person Families | 416 (10.8%) | $127,927 |
| 6-Person Families | 118 (3.0%) | $244,722 |
| 7+ Person Families | 44 (1.1%) | $0 |
| Total | 3,866 (100.0%) | $121,867 |
Family Income by Number of Earners in Lakeland
The median family income in Lakeland is $121,867, with families comprising 2 earners (1,583) having the highest median family income of $151,054, while families with no earners (439) have the lowest median family income of $92,578, accounting for 40.9% and 11.4% of families, respectively.
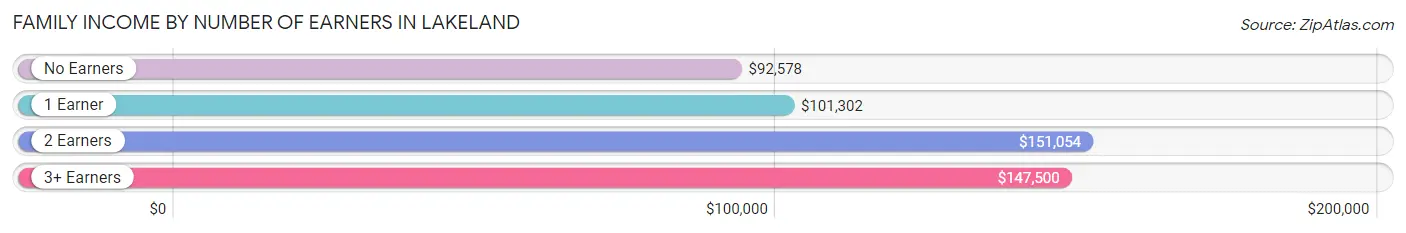
| Number of Earners | # Families | Median Income |
| No Earners | 439 (11.4%) | $92,578 |
| 1 Earner | 1,490 (38.5%) | $101,302 |
| 2 Earners | 1,583 (40.9%) | $151,054 |
| 3+ Earners | 354 (9.2%) | $147,500 |
| Total | 3,866 (100.0%) | $121,867 |
Household Income in Lakeland
Household Income Brackets in Lakeland
With 1,328 households falling in the category, the $100,000 to $149,999 income range is the most frequent in Lakeland, accounting for 25.8% of all households. In contrast, only 21 households (0.4%) fall into the $10,000 to $14,999 income bracket, making it the least populous group.
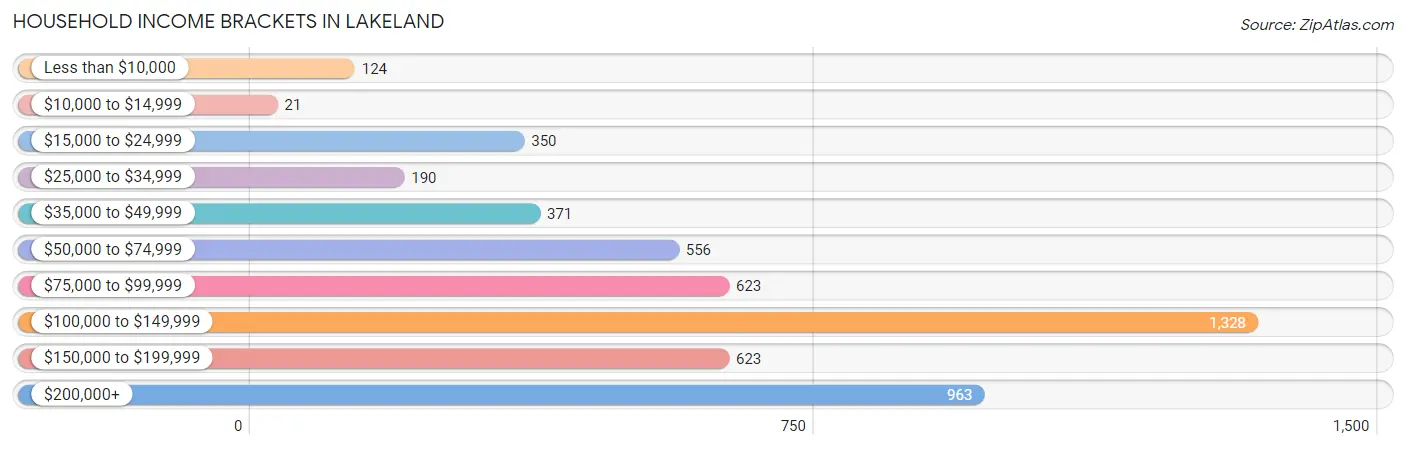
| Income Bracket | # Households | % Households |
| Less than $10,000 | 124 | 2.4% |
| $10,000 to $14,999 | 21 | 0.4% |
| $15,000 to $24,999 | 350 | 6.8% |
| $25,000 to $34,999 | 190 | 3.7% |
| $35,000 to $49,999 | 371 | 7.2% |
| $50,000 to $74,999 | 556 | 10.8% |
| $75,000 to $99,999 | 623 | 12.1% |
| $100,000 to $149,999 | 1,328 | 25.8% |
| $150,000 to $199,999 | 623 | 12.1% |
| $200,000+ | 963 | 18.7% |
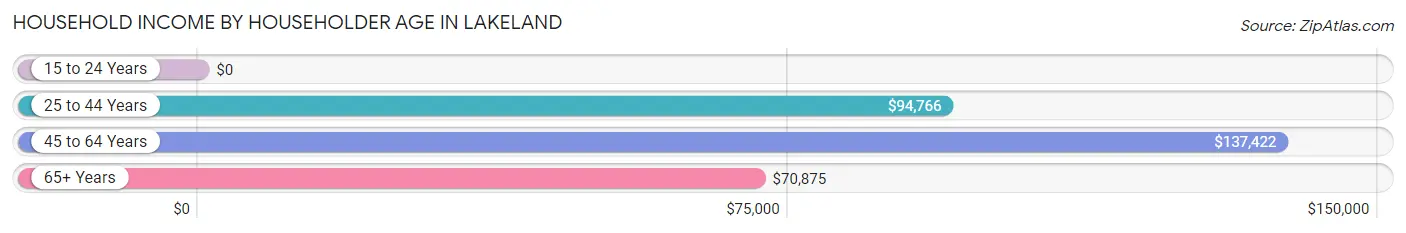
Household Income by Householder Age in Lakeland
The median household income in Lakeland is $108,206, with the highest median household income of $137,422 found in the 45 to 64 years age bracket for the primary householder. A total of 2,210 households (42.9%) fall into this category. Meanwhile, the 15 to 24 years age bracket for the primary householder has the lowest median household income of $0, with 52 households (1.0%) in this group.
| Income Bracket | # Households | Median Income |
| 15 to 24 Years | 52 (1.0%) | $0 |
| 25 to 44 Years | 1,555 (30.2%) | $94,766 |
| 45 to 64 Years | 2,210 (42.9%) | $137,422 |
| 65+ Years | 1,331 (25.9%) | $70,875 |
| Total | 5,148 (100.0%) | $108,206 |
Poverty in Lakeland
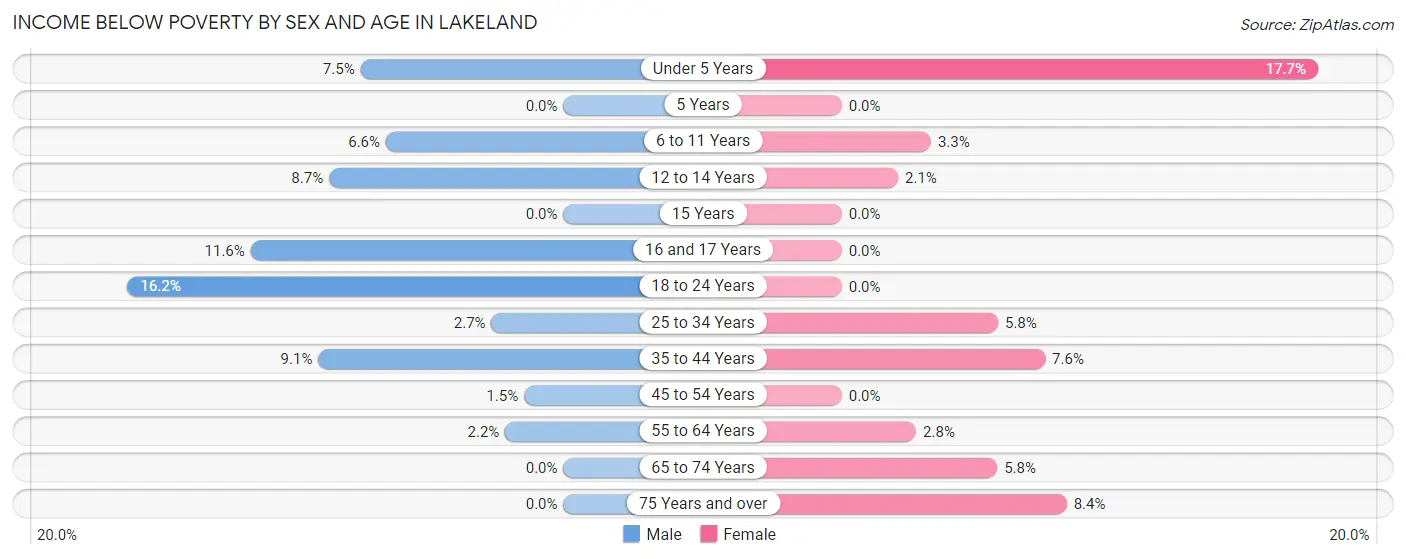
Income Below Poverty by Sex and Age in Lakeland
With 5.3% poverty level for males and 4.4% for females among the residents of Lakeland, 18 to 24 year old males and under 5 year old females are the most vulnerable to poverty, with 88 males (16.2%) and 44 females (17.7%) in their respective age groups living below the poverty level.
| Age Bracket | Male | Female |
| Under 5 Years | 49 (7.5%) | 44 (17.7%) |
| 5 Years | 0 (0.0%) | 0 (0.0%) |
| 6 to 11 Years | 47 (6.6%) | 21 (3.3%) |
| 12 to 14 Years | 34 (8.7%) | 9 (2.1%) |
| 15 Years | 0 (0.0%) | 0 (0.0%) |
| 16 and 17 Years | 31 (11.6%) | 0 (0.0%) |
| 18 to 24 Years | 88 (16.2%) | 0 (0.0%) |
| 25 to 34 Years | 11 (2.7%) | 32 (5.8%) |
| 35 to 44 Years | 90 (9.1%) | 75 (7.5%) |
| 45 to 54 Years | 18 (1.5%) | 0 (0.0%) |
| 55 to 64 Years | 15 (2.2%) | 22 (2.8%) |
| 65 to 74 Years | 0 (0.0%) | 42 (5.8%) |
| 75 Years and over | 0 (0.0%) | 44 (8.4%) |
| Total | 383 (5.3%) | 289 (4.4%) |
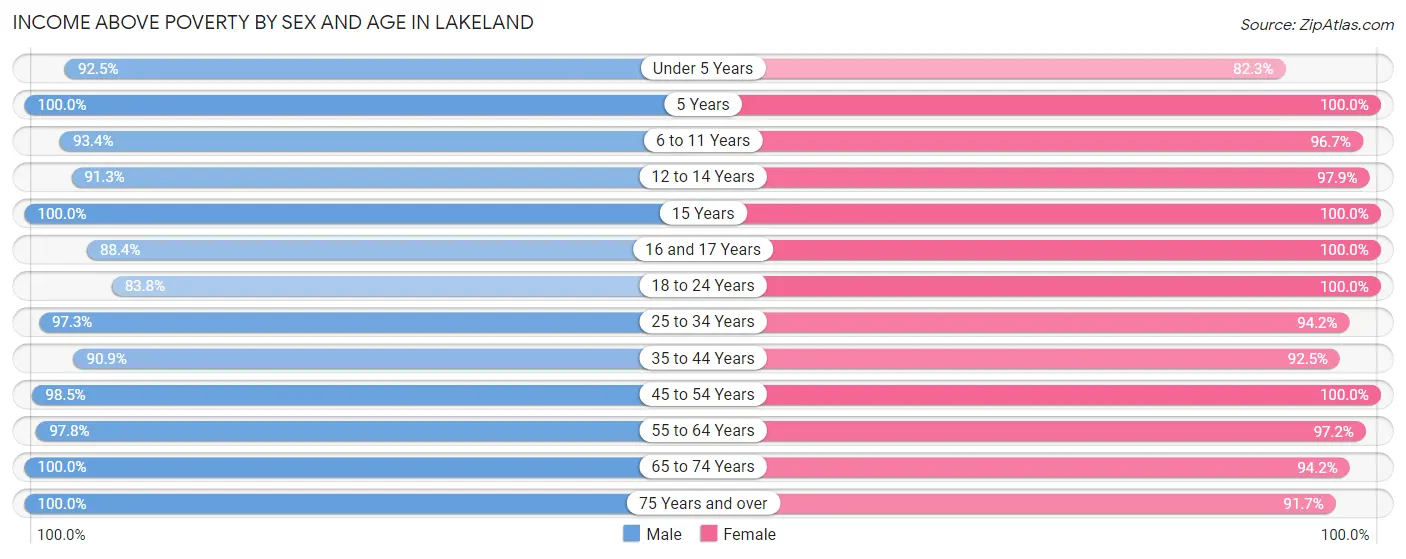
Income Above Poverty by Sex and Age in Lakeland
According to the poverty statistics in Lakeland, males aged 5 years and females aged 5 years are the age groups that are most secure financially, with 100.0% of males and 100.0% of females in these age groups living above the poverty line.
| Age Bracket | Male | Female |
| Under 5 Years | 602 (92.5%) | 205 (82.3%) |
| 5 Years | 58 (100.0%) | 77 (100.0%) |
| 6 to 11 Years | 666 (93.4%) | 614 (96.7%) |
| 12 to 14 Years | 357 (91.3%) | 422 (97.9%) |
| 15 Years | 108 (100.0%) | 94 (100.0%) |
| 16 and 17 Years | 236 (88.4%) | 161 (100.0%) |
| 18 to 24 Years | 456 (83.8%) | 269 (100.0%) |
| 25 to 34 Years | 401 (97.3%) | 520 (94.2%) |
| 35 to 44 Years | 899 (90.9%) | 919 (92.4%) |
| 45 to 54 Years | 1,217 (98.5%) | 1,049 (100.0%) |
| 55 to 64 Years | 681 (97.8%) | 775 (97.2%) |
| 65 to 74 Years | 840 (100.0%) | 686 (94.2%) |
| 75 Years and over | 344 (100.0%) | 483 (91.6%) |
| Total | 6,865 (94.7%) | 6,274 (95.6%) |
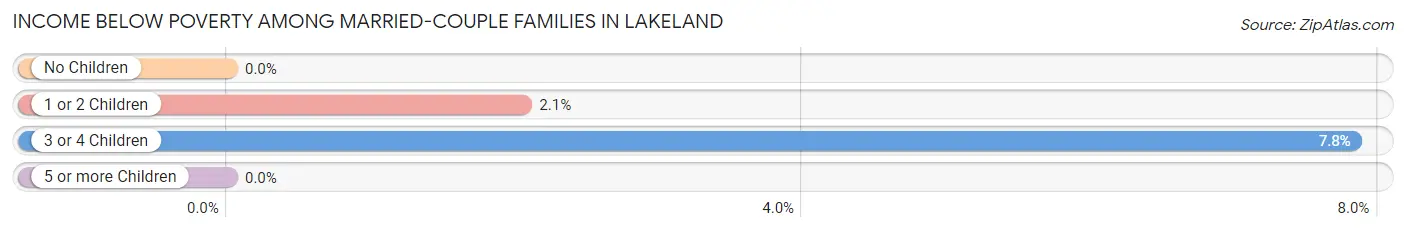
Income Below Poverty Among Married-Couple Families in Lakeland
The poverty statistics for married-couple families in Lakeland show that 1.5% or 48 of the total 3,115 families live below the poverty line. Families with 3 or 4 children have the highest poverty rate of 7.8%, comprising of 26 families. On the other hand, families with no children have the lowest poverty rate of 0.0%, which includes 0 families.
| Children | Above Poverty | Below Poverty |
| No Children | 1,709 (100.0%) | 0 (0.0%) |
| 1 or 2 Children | 1,052 (98.0%) | 22 (2.1%) |
| 3 or 4 Children | 306 (92.2%) | 26 (7.8%) |
| 5 or more Children | 0 (0.0%) | 0 (0.0%) |
| Total | 3,067 (98.5%) | 48 (1.5%) |
Income Below Poverty Among Single-Parent Households in Lakeland
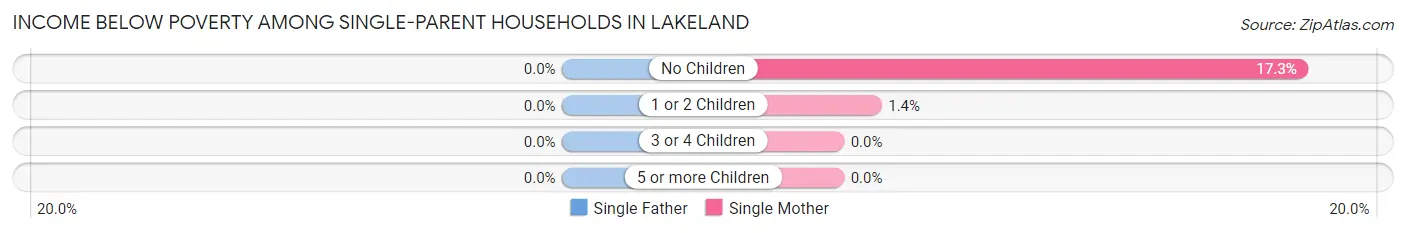
| Children | Single Father | Single Mother |
| No Children | 0 (0.0%) | 22 (17.3%) |
| 1 or 2 Children | 0 (0.0%) | 4 (1.4%) |
| 3 or 4 Children | 0 (0.0%) | 0 (0.0%) |
| 5 or more Children | 0 (0.0%) | 0 (0.0%) |
| Total | 0 (0.0%) | 26 (5.5%) |
Income Below Poverty Among Married-Couple vs Single-Parent Households in Lakeland
The poverty data for Lakeland shows that 48 of the married-couple family households (1.5%) and 26 of the single-parent households (3.5%) are living below the poverty level. Within the married-couple family households, those with 3 or 4 children have the highest poverty rate, with 26 households (7.8%) falling below the poverty line. Among the single-parent households, those with no children have the highest poverty rate, with 22 household (9.1%) living below poverty.
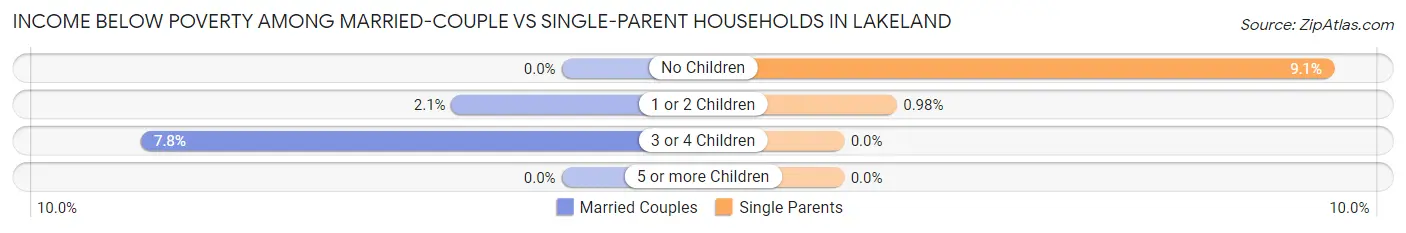
| Children | Married-Couple Families | Single-Parent Households |
| No Children | 0 (0.0%) | 22 (9.1%) |
| 1 or 2 Children | 22 (2.1%) | 4 (1.0%) |
| 3 or 4 Children | 26 (7.8%) | 0 (0.0%) |
| 5 or more Children | 0 (0.0%) | 0 (0.0%) |
| Total | 48 (1.5%) | 26 (3.5%) |
Race in Lakeland
The most populous races in Lakeland are White / Caucasian (10,932 | 79.1%), Black / African American (1,661 | 12.0%), and Hispanic or Latino (717 | 5.2%).
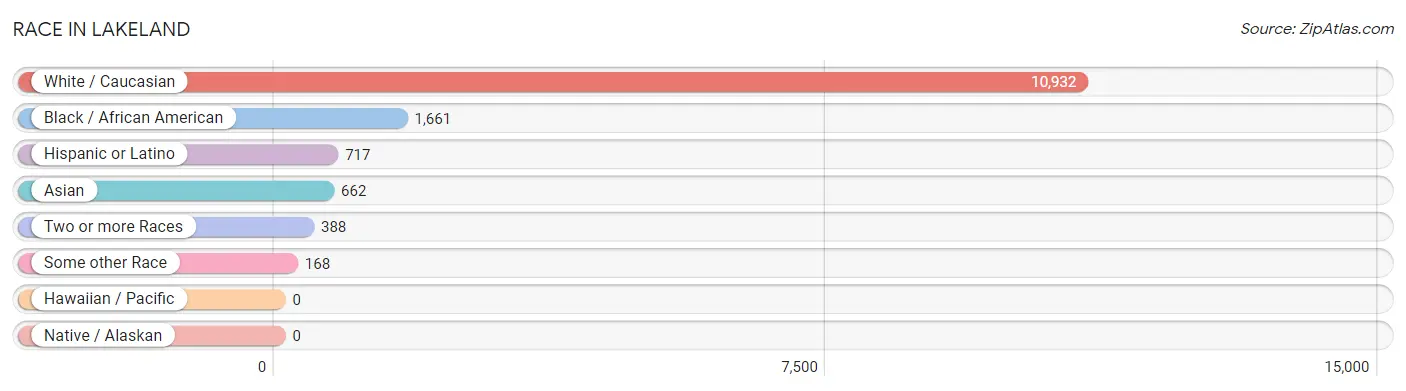
| Race | # Population | % Population |
| Asian | 662 | 4.8% |
| Black / African American | 1,661 | 12.0% |
| Hawaiian / Pacific | 0 | 0.0% |
| Hispanic or Latino | 717 | 5.2% |
| Native / Alaskan | 0 | 0.0% |
| White / Caucasian | 10,932 | 79.1% |
| Two or more Races | 388 | 2.8% |
| Some other Race | 168 | 1.2% |
| Total | 13,811 | 100.0% |
Ancestry in Lakeland
The most populous ancestries reported in Lakeland are German (1,815 | 13.1%), American (1,708 | 12.4%), English (1,707 | 12.4%), Irish (1,160 | 8.4%), and Italian (654 | 4.7%), together accounting for 51.0% of all Lakeland residents.
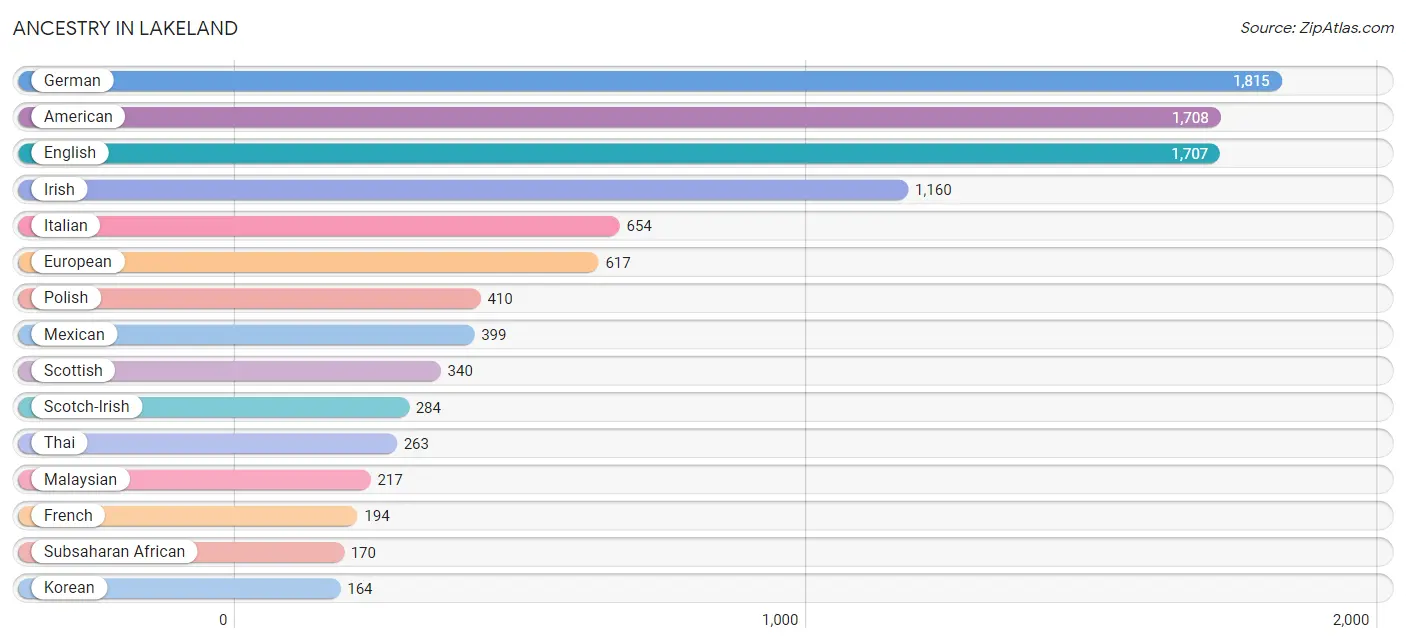
| Ancestry | # Population | % Population |
| African | 56 | 0.4% |
| American | 1,708 | 12.4% |
| Arab | 58 | 0.4% |
| Austrian | 27 | 0.2% |
| British | 23 | 0.2% |
| Central American | 62 | 0.4% |
| Cherokee | 17 | 0.1% |
| Colombian | 30 | 0.2% |
| Cuban | 97 | 0.7% |
| Czech | 25 | 0.2% |
| Czechoslovakian | 15 | 0.1% |
| Danish | 13 | 0.1% |
| Dutch | 96 | 0.7% |
| Eastern European | 14 | 0.1% |
| English | 1,707 | 12.4% |
| European | 617 | 4.5% |
| Filipino | 27 | 0.2% |
| French | 194 | 1.4% |
| French Canadian | 28 | 0.2% |
| German | 1,815 | 13.1% |
| Ghanaian | 71 | 0.5% |
| Greek | 50 | 0.4% |
| Guatemalan | 62 | 0.4% |
| Hungarian | 11 | 0.1% |
| Indian (Asian) | 91 | 0.7% |
| Iranian | 30 | 0.2% |
| Irish | 1,160 | 8.4% |
| Italian | 654 | 4.7% |
| Jamaican | 29 | 0.2% |
| Kenyan | 43 | 0.3% |
| Korean | 164 | 1.2% |
| Lebanese | 29 | 0.2% |
| Malaysian | 217 | 1.6% |
| Mexican | 399 | 2.9% |
| Norwegian | 64 | 0.5% |
| Polish | 410 | 3.0% |
| Puerto Rican | 80 | 0.6% |
| Russian | 51 | 0.4% |
| Scotch-Irish | 284 | 2.1% |
| Scottish | 340 | 2.5% |
| Slovak | 14 | 0.1% |
| South American | 30 | 0.2% |
| Spanish | 16 | 0.1% |
| Sri Lankan | 29 | 0.2% |
| Subsaharan African | 170 | 1.2% |
| Swedish | 56 | 0.4% |
| Thai | 263 | 1.9% |
| Ukrainian | 42 | 0.3% |
| Welsh | 61 | 0.4% |
| Yugoslavian | 43 | 0.3% | View All 50 Rows |
Immigrants in Lakeland
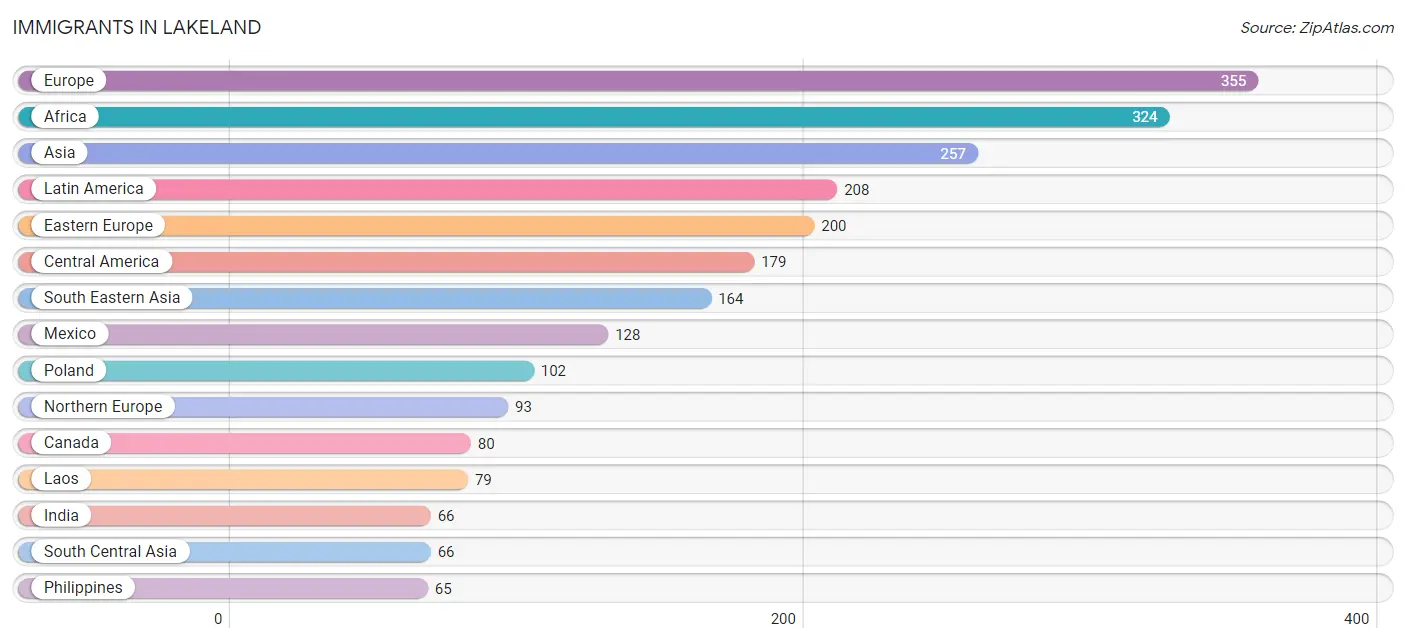
The most numerous immigrant groups reported in Lakeland came from Europe (355 | 2.6%), Africa (324 | 2.4%), Asia (257 | 1.9%), Latin America (208 | 1.5%), and Eastern Europe (200 | 1.5%), together accounting for 9.7% of all Lakeland residents.
| Immigration Origin | # Population | % Population |
| Africa | 324 | 2.4% |
| Asia | 257 | 1.9% |
| Austria | 14 | 0.1% |
| Bosnia and Herzegovina | 43 | 0.3% |
| Canada | 80 | 0.6% |
| Central America | 179 | 1.3% |
| China | 27 | 0.2% |
| Colombia | 16 | 0.1% |
| Eastern Africa | 43 | 0.3% |
| Eastern Asia | 27 | 0.2% |
| Eastern Europe | 200 | 1.5% |
| Europe | 355 | 2.6% |
| Germany | 40 | 0.3% |
| Ghana | 39 | 0.3% |
| Greece | 8 | 0.1% |
| Guatemala | 51 | 0.4% |
| India | 66 | 0.5% |
| Kenya | 43 | 0.3% |
| Laos | 79 | 0.6% |
| Latin America | 208 | 1.5% |
| Mexico | 128 | 0.9% |
| Northern Europe | 93 | 0.7% |
| Philippines | 65 | 0.5% |
| Poland | 102 | 0.7% |
| Russia | 13 | 0.1% |
| Scotland | 23 | 0.2% |
| South Africa | 36 | 0.3% |
| South America | 29 | 0.2% |
| South Central Asia | 66 | 0.5% |
| South Eastern Asia | 164 | 1.2% |
| Southern Europe | 8 | 0.1% |
| Taiwan | 27 | 0.2% |
| Ukraine | 42 | 0.3% |
| Vietnam | 20 | 0.1% |
| Western Africa | 39 | 0.3% |
| Western Europe | 54 | 0.4% | View All 36 Rows |
Sex and Age in Lakeland
Sex and Age in Lakeland
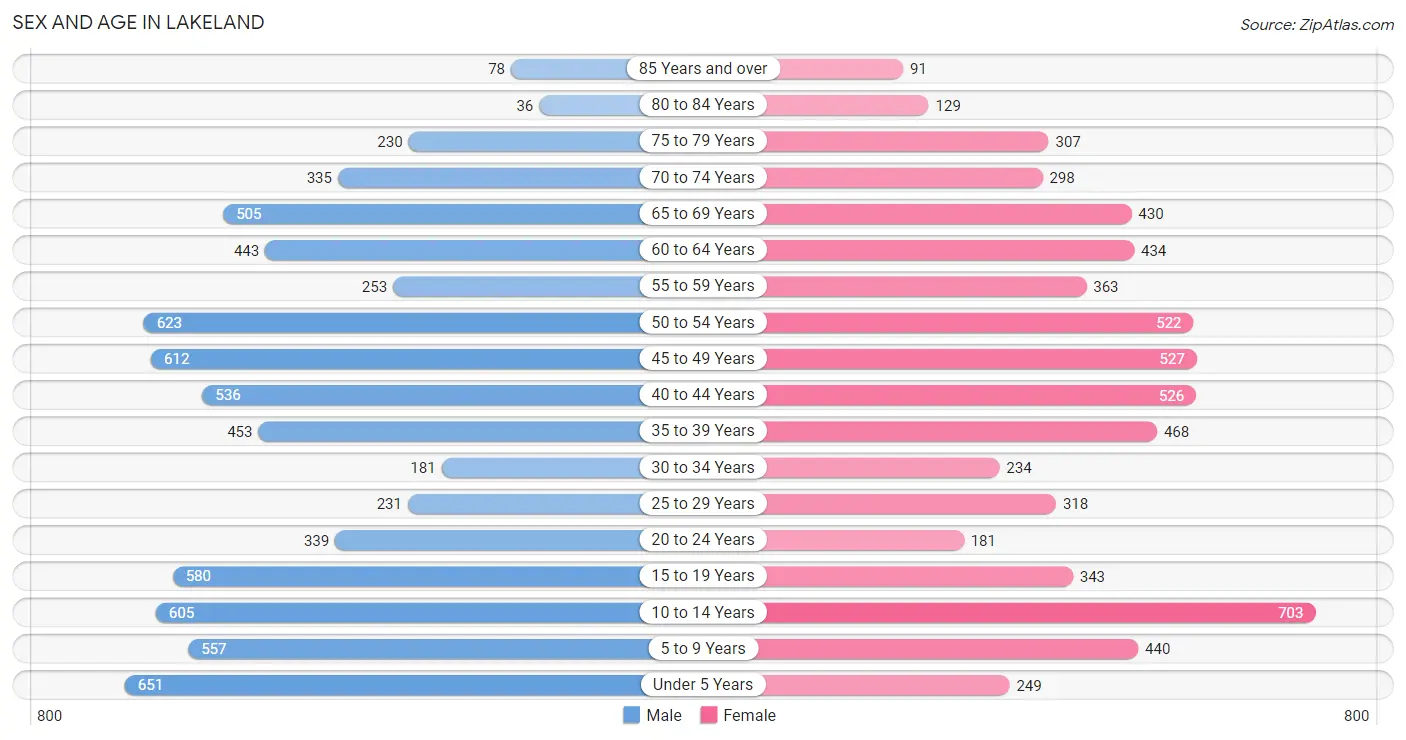
The most populous age groups in Lakeland are Under 5 Years (651 | 9.0%) for men and 10 to 14 Years (703 | 10.7%) for women.
| Age Bracket | Male | Female |
| Under 5 Years | 651 (9.0%) | 249 (3.8%) |
| 5 to 9 Years | 557 (7.7%) | 440 (6.7%) |
| 10 to 14 Years | 605 (8.4%) | 703 (10.7%) |
| 15 to 19 Years | 580 (8.0%) | 343 (5.2%) |
| 20 to 24 Years | 339 (4.7%) | 181 (2.8%) |
| 25 to 29 Years | 231 (3.2%) | 318 (4.9%) |
| 30 to 34 Years | 181 (2.5%) | 234 (3.6%) |
| 35 to 39 Years | 453 (6.2%) | 468 (7.1%) |
| 40 to 44 Years | 536 (7.4%) | 526 (8.0%) |
| 45 to 49 Years | 612 (8.4%) | 527 (8.0%) |
| 50 to 54 Years | 623 (8.6%) | 522 (8.0%) |
| 55 to 59 Years | 253 (3.5%) | 363 (5.5%) |
| 60 to 64 Years | 443 (6.1%) | 434 (6.6%) |
| 65 to 69 Years | 505 (7.0%) | 430 (6.6%) |
| 70 to 74 Years | 335 (4.6%) | 298 (4.5%) |
| 75 to 79 Years | 230 (3.2%) | 307 (4.7%) |
| 80 to 84 Years | 36 (0.5%) | 129 (2.0%) |
| 85 Years and over | 78 (1.1%) | 91 (1.4%) |
| Total | 7,248 (100.0%) | 6,563 (100.0%) |
Families and Households in Lakeland
Median Family Size in Lakeland
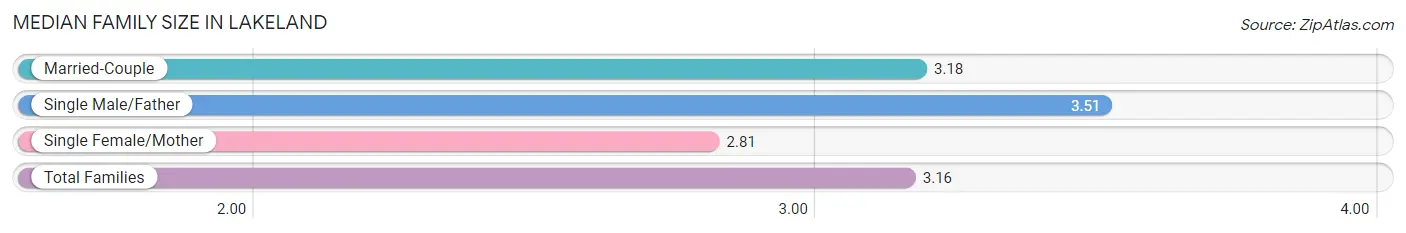
The median family size in Lakeland is 3.16 persons per family, with single male/father families (282 | 7.3%) accounting for the largest median family size of 3.51 persons per family. On the other hand, single female/mother families (469 | 12.1%) represent the smallest median family size with 2.81 persons per family.
| Family Type | # Families | Family Size |
| Married-Couple | 3,115 (80.6%) | 3.18 |
| Single Male/Father | 282 (7.3%) | 3.51 |
| Single Female/Mother | 469 (12.1%) | 2.81 |
| Total Families | 3,866 (100.0%) | 3.16 |
Median Household Size in Lakeland
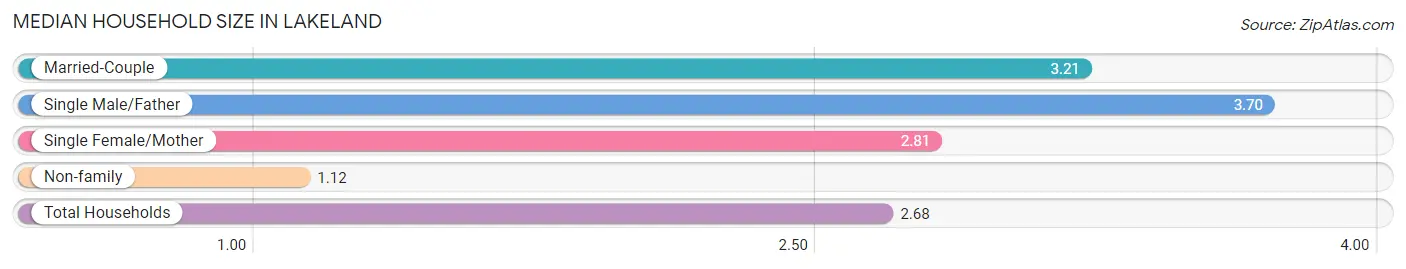
The median household size in Lakeland is 2.68 persons per household, with single male/father households (282 | 5.5%) accounting for the largest median household size of 3.7 persons per household. non-family households (1,282 | 24.9%) represent the smallest median household size with 1.12 persons per household.
| Household Type | # Households | Household Size |
| Married-Couple | 3,115 (60.5%) | 3.21 |
| Single Male/Father | 282 (5.5%) | 3.70 |
| Single Female/Mother | 469 (9.1%) | 2.81 |
| Non-family | 1,282 (24.9%) | 1.12 |
| Total Households | 5,148 (100.0%) | 2.68 |
Household Size by Marriage Status in Lakeland
Out of a total of 5,148 households in Lakeland, 3,866 (75.1%) are family households, while 1,282 (24.9%) are nonfamily households. The most numerous type of family households are 2-person households, comprising 1,589, and the most common type of nonfamily households are 1-person households, comprising 1,146.
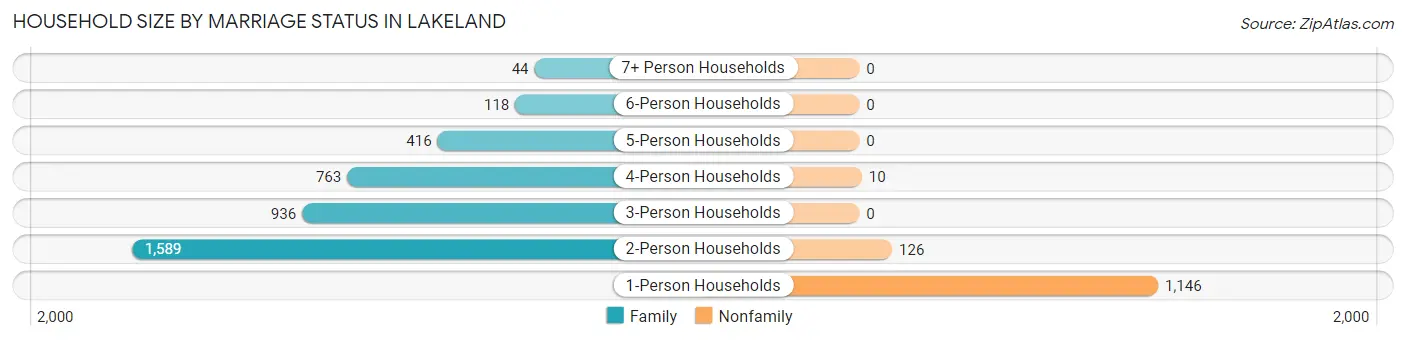
| Household Size | Family Households | Nonfamily Households |
| 1-Person Households | - | 1,146 (22.3%) |
| 2-Person Households | 1,589 (30.9%) | 126 (2.5%) |
| 3-Person Households | 936 (18.2%) | 0 (0.0%) |
| 4-Person Households | 763 (14.8%) | 10 (0.2%) |
| 5-Person Households | 416 (8.1%) | 0 (0.0%) |
| 6-Person Households | 118 (2.3%) | 0 (0.0%) |
| 7+ Person Households | 44 (0.9%) | 0 (0.0%) |
| Total | 3,866 (75.1%) | 1,282 (24.9%) |
Female Fertility in Lakeland
Fertility by Age in Lakeland
Average fertility rate in Lakeland is 40.0 births per 1,000 women. Women in the age bracket of 20 to 34 years have the highest fertility rate with 74.0 births per 1,000 women. Women in the age bracket of 35 to 50 years acount for 50.9% of all women with births.
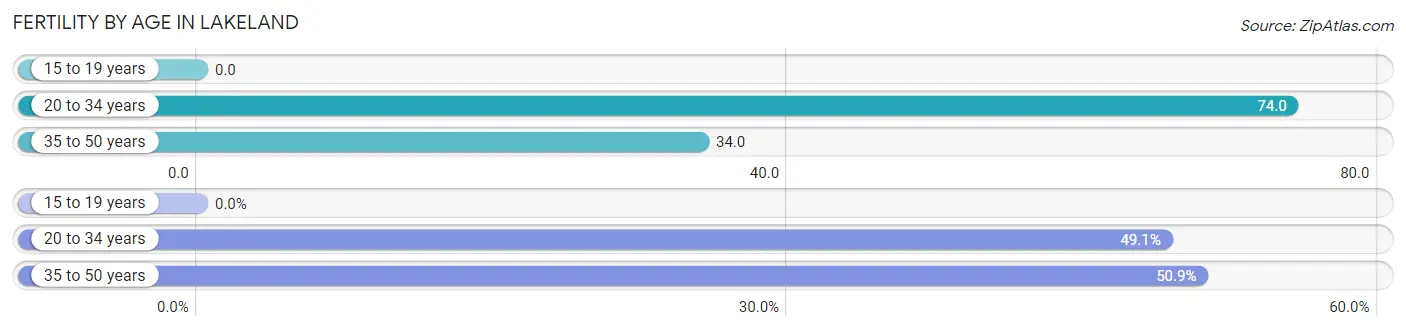
| Age Bracket | Women with Births | Births / 1,000 Women |
| 15 to 19 years | 0 (0.0%) | 0.0 |
| 20 to 34 years | 54 (49.1%) | 74.0 |
| 35 to 50 years | 56 (50.9%) | 34.0 |
| Total | 110 (100.0%) | 40.0 |
Fertility by Age by Marriage Status in Lakeland
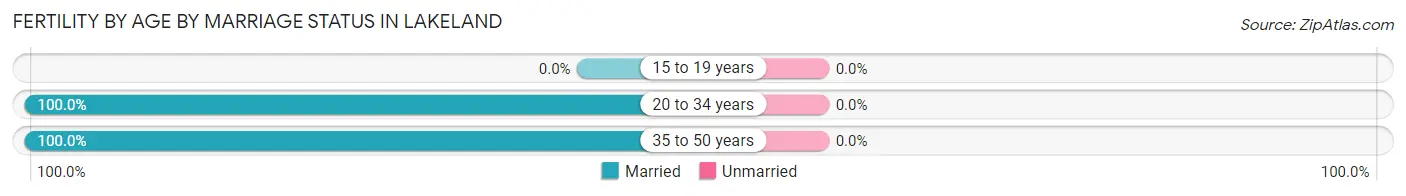
| Age Bracket | Married | Unmarried |
| 15 to 19 years | 0 (0.0%) | 0 (0.0%) |
| 20 to 34 years | 54 (100.0%) | 0 (0.0%) |
| 35 to 50 years | 56 (100.0%) | 0 (0.0%) |
| Total | 110 (100.0%) | 0 (0.0%) |
Fertility by Education in Lakeland
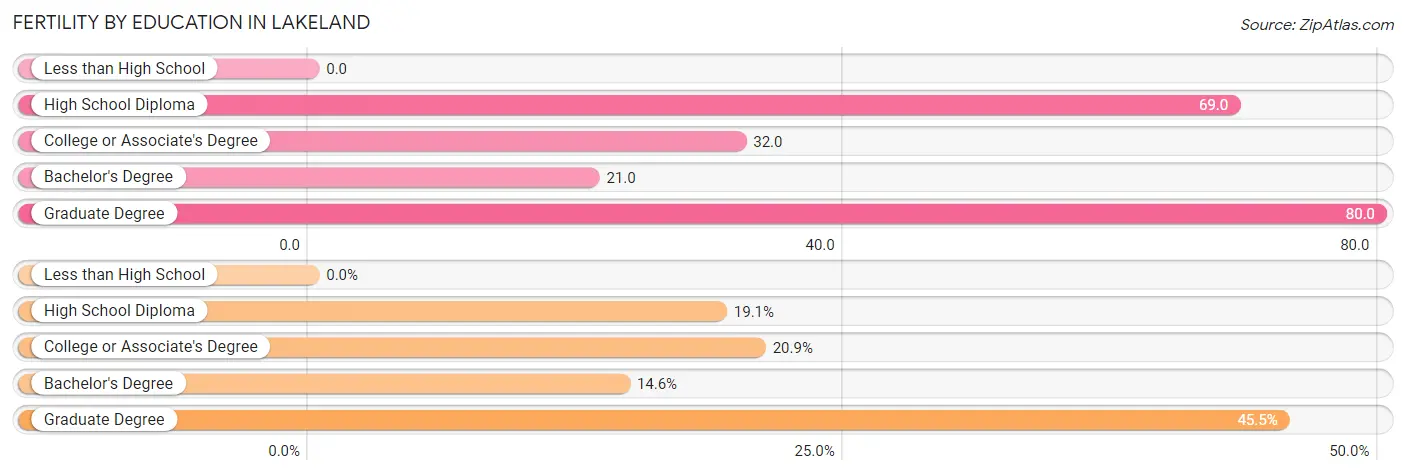
| Educational Attainment | Women with Births | Births / 1,000 Women |
| Less than High School | 0 (0.0%) | 0.0 |
| High School Diploma | 21 (19.1%) | 69.0 |
| College or Associate's Degree | 23 (20.9%) | 32.0 |
| Bachelor's Degree | 16 (14.5%) | 21.0 |
| Graduate Degree | 50 (45.5%) | 80.0 |
| Total | 110 (100.0%) | 40.0 |
Fertility by Education by Marriage Status in Lakeland
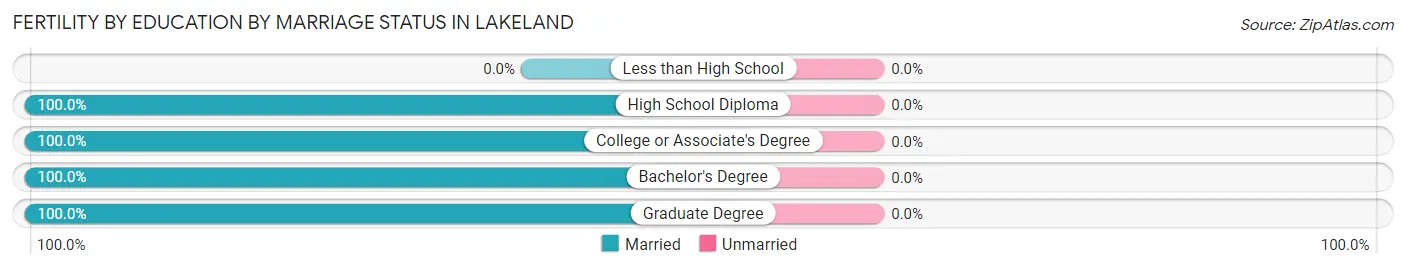
| Educational Attainment | Married | Unmarried |
| Less than High School | 0 (0.0%) | 0 (0.0%) |
| High School Diploma | 21 (100.0%) | 0 (0.0%) |
| College or Associate's Degree | 23 (100.0%) | 0 (0.0%) |
| Bachelor's Degree | 16 (100.0%) | 0 (0.0%) |
| Graduate Degree | 50 (100.0%) | 0 (0.0%) |
| Total | 110 (100.0%) | 0 (0.0%) |
Employment Characteristics in Lakeland
Employment by Class of Employer in Lakeland
Among the 6,294 employed individuals in Lakeland, private company employees (4,115 | 65.4%), not-for-profit organizations (542 | 8.6%), and local government employees (532 | 8.5%) make up the most common classes of employment.
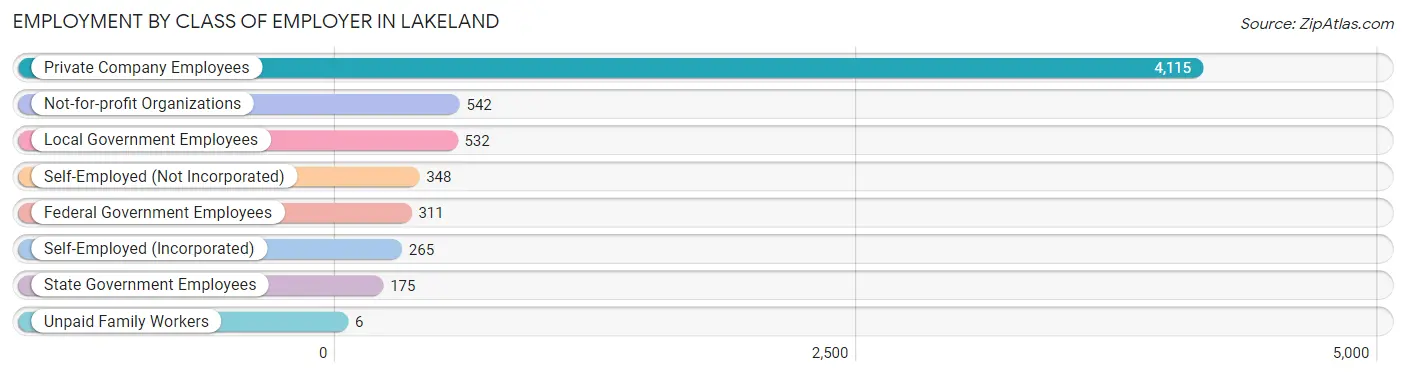
| Employer Class | # Employees | % Employees |
| Private Company Employees | 4,115 | 65.4% |
| Self-Employed (Incorporated) | 265 | 4.2% |
| Self-Employed (Not Incorporated) | 348 | 5.5% |
| Not-for-profit Organizations | 542 | 8.6% |
| Local Government Employees | 532 | 8.5% |
| State Government Employees | 175 | 2.8% |
| Federal Government Employees | 311 | 4.9% |
| Unpaid Family Workers | 6 | 0.1% |
| Total | 6,294 | 100.0% |
Employment Status by Age in Lakeland
According to the labor force statistics for Lakeland, out of the total population over 16 years of age (10,404), 62.9% or 6,544 individuals are in the labor force, with 3.1% or 203 of them unemployed. The age group with the highest labor force participation rate is 25 to 29 years, with 92.2% or 506 individuals in the labor force. Within the labor force, the 16 to 19 years age range has the highest percentage of unemployed individuals, with 19.2% or 55 of them being unemployed.
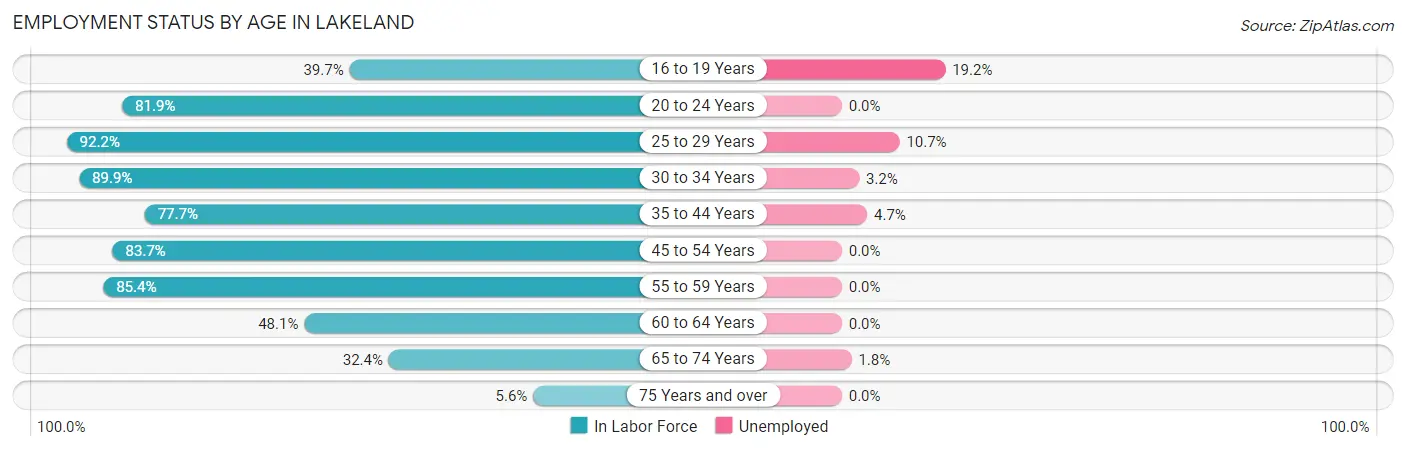
| Age Bracket | In Labor Force | Unemployed |
| 16 to 19 Years | 286 (39.7%) | 55 (19.2%) |
| 20 to 24 Years | 426 (81.9%) | 0 (0.0%) |
| 25 to 29 Years | 506 (92.2%) | 54 (10.7%) |
| 30 to 34 Years | 373 (89.9%) | 12 (3.2%) |
| 35 to 44 Years | 1,541 (77.7%) | 72 (4.7%) |
| 45 to 54 Years | 1,912 (83.7%) | 0 (0.0%) |
| 55 to 59 Years | 526 (85.4%) | 0 (0.0%) |
| 60 to 64 Years | 422 (48.1%) | 0 (0.0%) |
| 65 to 74 Years | 508 (32.4%) | 9 (1.8%) |
| 75 Years and over | 49 (5.6%) | 0 (0.0%) |
| Total | 6,544 (62.9%) | 203 (3.1%) |
Employment Status by Educational Attainment in Lakeland
According to labor force statistics for Lakeland, 78.5% of individuals (5,278) out of the total population between 25 and 64 years of age (6,724) are in the labor force, with 2.6% or 137 of them being unemployed. The group with the highest labor force participation rate are those with the educational attainment of bachelor's degree or higher, with 82.8% or 3,073 individuals in the labor force. Within the labor force, individuals with high school diploma education have the highest percentage of unemployment, with 9.8% or 47 of them being unemployed.
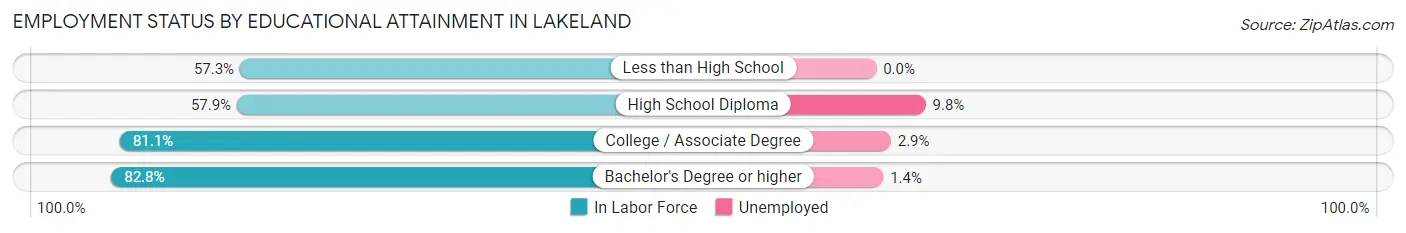
| Educational Attainment | In Labor Force | Unemployed |
| Less than High School | 110 (57.3%) | 0 (0.0%) |
| High School Diploma | 480 (57.9%) | 81 (9.8%) |
| College / Associate Degree | 1,616 (81.1%) | 58 (2.9%) |
| Bachelor's Degree or higher | 3,073 (82.8%) | 52 (1.4%) |
| Total | 5,278 (78.5%) | 175 (2.6%) |
Employment Occupations by Sex in Lakeland
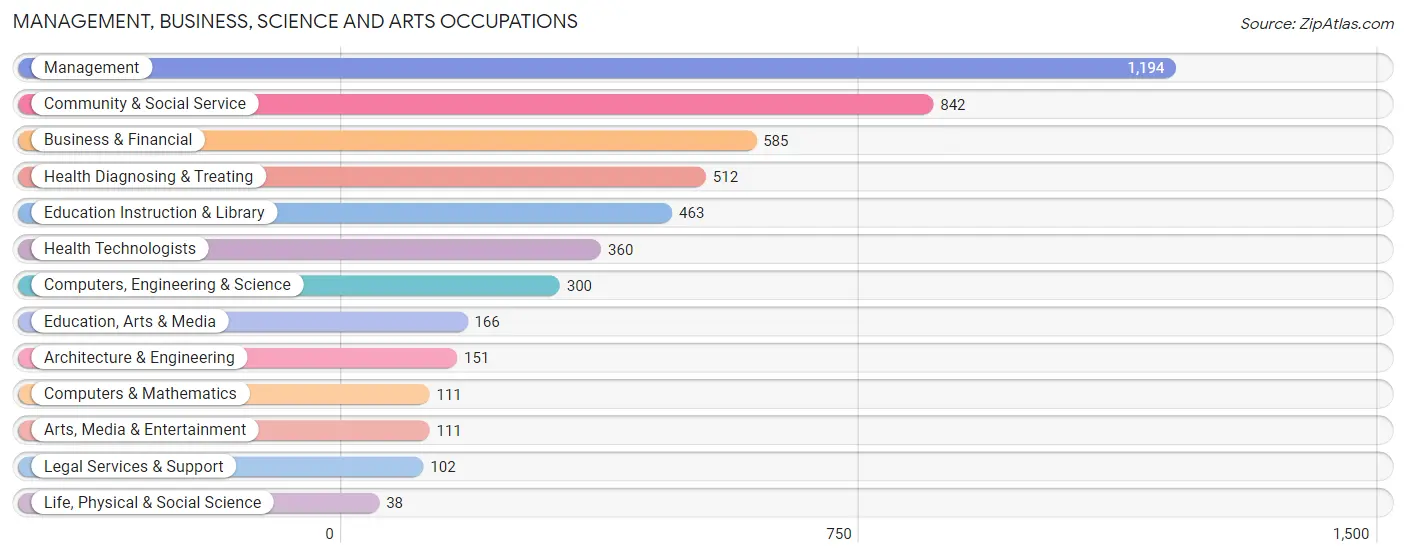
Management, Business, Science and Arts Occupations
The most common Management, Business, Science and Arts occupations in Lakeland are Management (1,194 | 19.0%), Community & Social Service (842 | 13.4%), Business & Financial (585 | 9.3%), Health Diagnosing & Treating (512 | 8.1%), and Education Instruction & Library (463 | 7.3%).
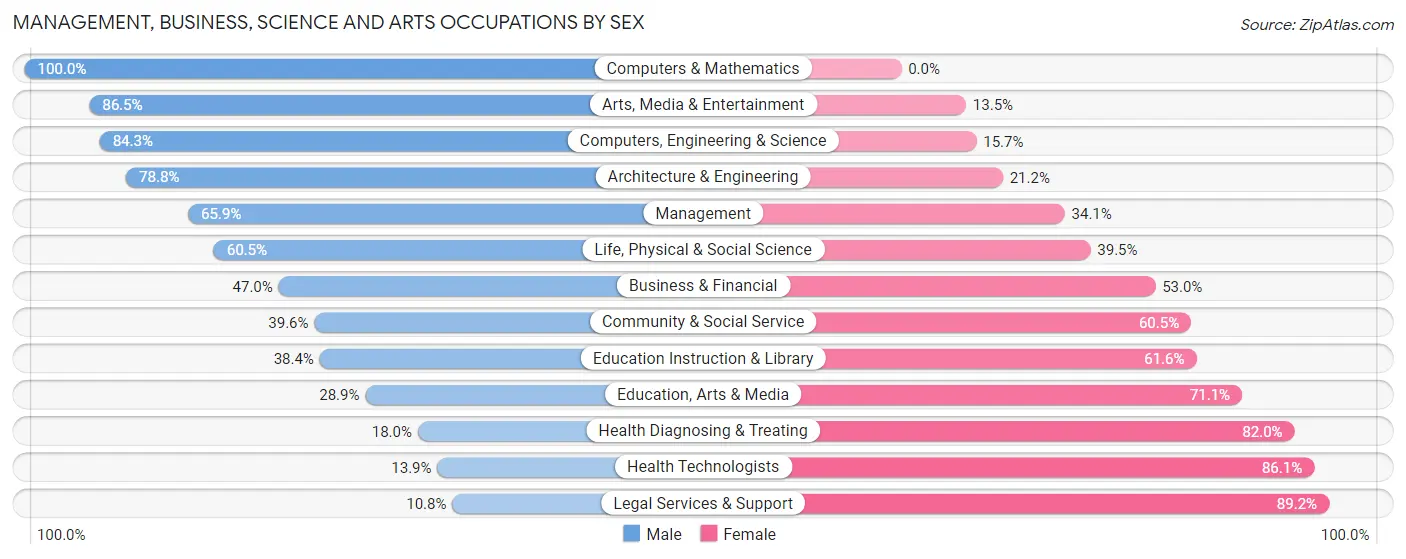
Management, Business, Science and Arts Occupations by Sex
Within the Management, Business, Science and Arts occupations in Lakeland, the most male-oriented occupations are Computers & Mathematics (100.0%), Arts, Media & Entertainment (86.5%), and Computers, Engineering & Science (84.3%), while the most female-oriented occupations are Legal Services & Support (89.2%), Health Technologists (86.1%), and Health Diagnosing & Treating (82.0%).
| Occupation | Male | Female |
| Management | 787 (65.9%) | 407 (34.1%) |
| Business & Financial | 275 (47.0%) | 310 (53.0%) |
| Computers, Engineering & Science | 253 (84.3%) | 47 (15.7%) |
| Computers & Mathematics | 111 (100.0%) | 0 (0.0%) |
| Architecture & Engineering | 119 (78.8%) | 32 (21.2%) |
| Life, Physical & Social Science | 23 (60.5%) | 15 (39.5%) |
| Community & Social Service | 333 (39.6%) | 509 (60.5%) |
| Education, Arts & Media | 48 (28.9%) | 118 (71.1%) |
| Legal Services & Support | 11 (10.8%) | 91 (89.2%) |
| Education Instruction & Library | 178 (38.4%) | 285 (61.6%) |
| Arts, Media & Entertainment | 96 (86.5%) | 15 (13.5%) |
| Health Diagnosing & Treating | 92 (18.0%) | 420 (82.0%) |
| Health Technologists | 50 (13.9%) | 310 (86.1%) |
| Total (Category) | 1,740 (50.7%) | 1,693 (49.3%) |
| Total (Overall) | 3,621 (57.5%) | 2,676 (42.5%) |
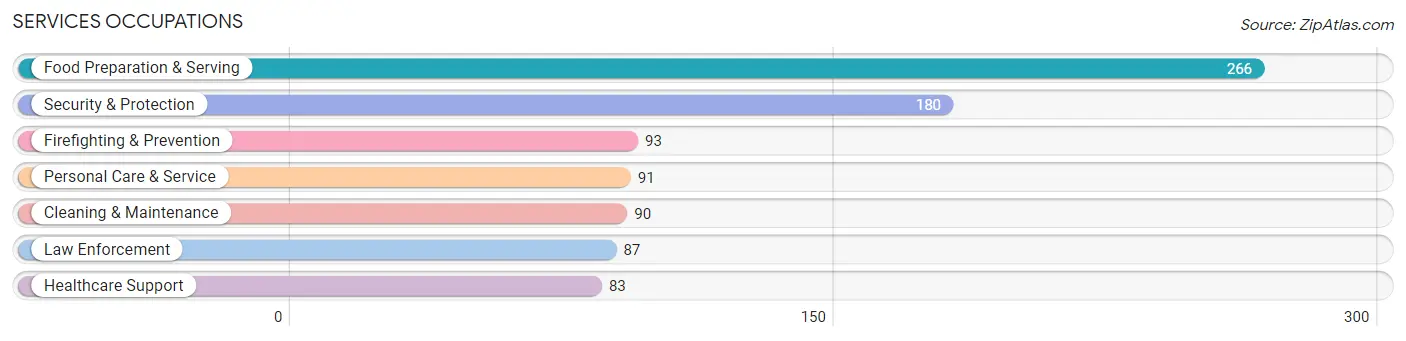
Services Occupations
The most common Services occupations in Lakeland are Food Preparation & Serving (266 | 4.2%), Security & Protection (180 | 2.9%), Firefighting & Prevention (93 | 1.5%), Personal Care & Service (91 | 1.5%), and Cleaning & Maintenance (90 | 1.4%).
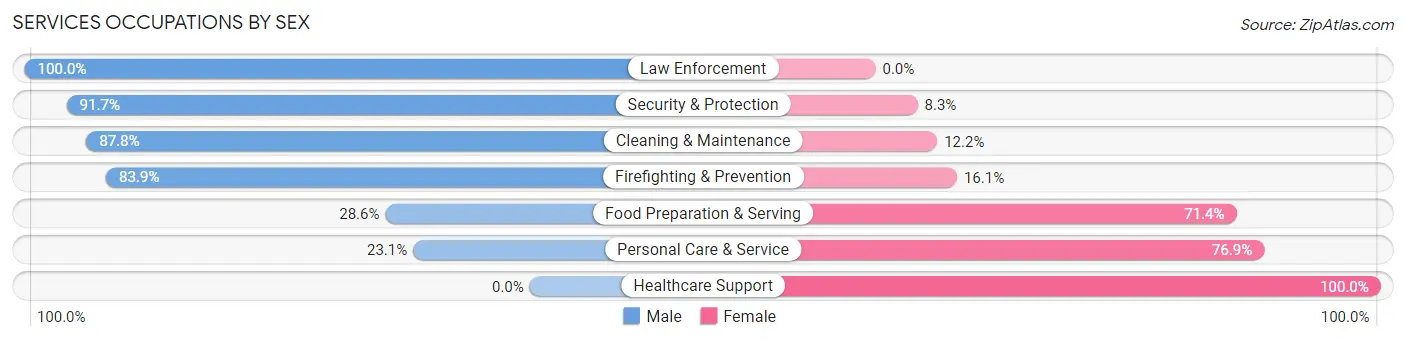
Services Occupations by Sex
Within the Services occupations in Lakeland, the most male-oriented occupations are Law Enforcement (100.0%), Security & Protection (91.7%), and Cleaning & Maintenance (87.8%), while the most female-oriented occupations are Healthcare Support (100.0%), Personal Care & Service (76.9%), and Food Preparation & Serving (71.4%).
| Occupation | Male | Female |
| Healthcare Support | 0 (0.0%) | 83 (100.0%) |
| Security & Protection | 165 (91.7%) | 15 (8.3%) |
| Firefighting & Prevention | 78 (83.9%) | 15 (16.1%) |
| Law Enforcement | 87 (100.0%) | 0 (0.0%) |
| Food Preparation & Serving | 76 (28.6%) | 190 (71.4%) |
| Cleaning & Maintenance | 79 (87.8%) | 11 (12.2%) |
| Personal Care & Service | 21 (23.1%) | 70 (76.9%) |
| Total (Category) | 341 (48.0%) | 369 (52.0%) |
| Total (Overall) | 3,621 (57.5%) | 2,676 (42.5%) |
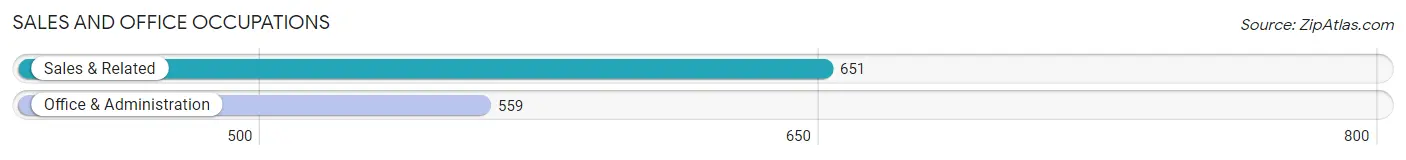
Sales and Office Occupations
The most common Sales and Office occupations in Lakeland are Sales & Related (651 | 10.3%), and Office & Administration (559 | 8.9%).
Sales and Office Occupations by Sex
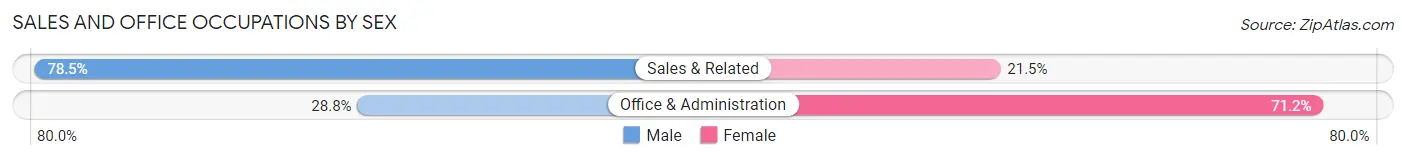
| Occupation | Male | Female |
| Sales & Related | 511 (78.5%) | 140 (21.5%) |
| Office & Administration | 161 (28.8%) | 398 (71.2%) |
| Total (Category) | 672 (55.5%) | 538 (44.5%) |
| Total (Overall) | 3,621 (57.5%) | 2,676 (42.5%) |
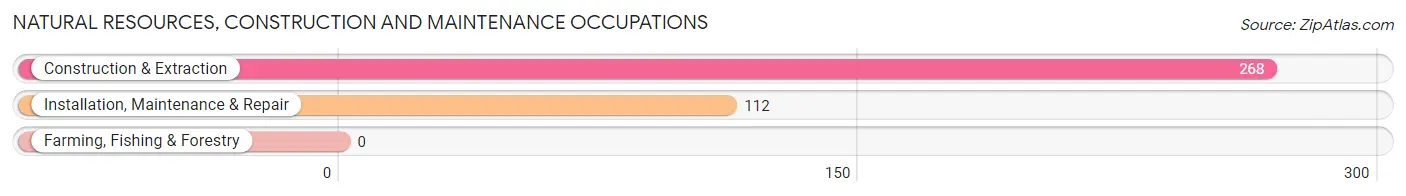
Natural Resources, Construction and Maintenance Occupations
The most common Natural Resources, Construction and Maintenance occupations in Lakeland are Construction & Extraction (268 | 4.3%), and Installation, Maintenance & Repair (112 | 1.8%).
Natural Resources, Construction and Maintenance Occupations by Sex
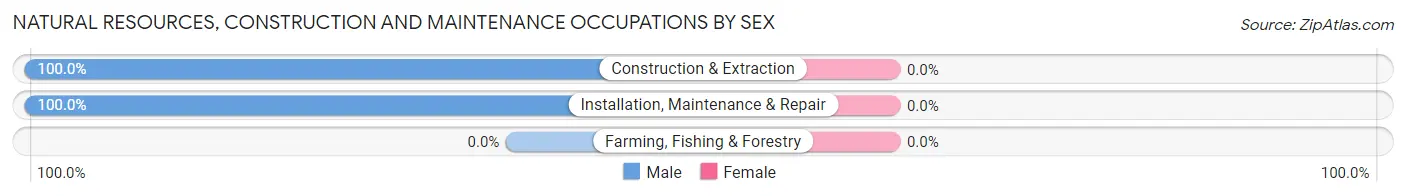
| Occupation | Male | Female |
| Farming, Fishing & Forestry | 0 (0.0%) | 0 (0.0%) |
| Construction & Extraction | 268 (100.0%) | 0 (0.0%) |
| Installation, Maintenance & Repair | 112 (100.0%) | 0 (0.0%) |
| Total (Category) | 380 (100.0%) | 0 (0.0%) |
| Total (Overall) | 3,621 (57.5%) | 2,676 (42.5%) |
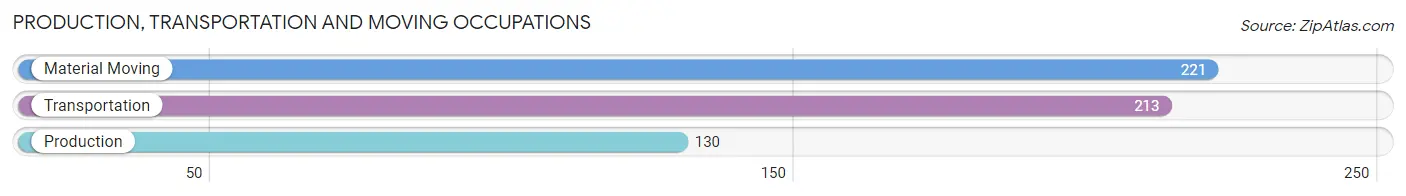
Production, Transportation and Moving Occupations
The most common Production, Transportation and Moving occupations in Lakeland are Material Moving (221 | 3.5%), Transportation (213 | 3.4%), and Production (130 | 2.1%).
Production, Transportation and Moving Occupations by Sex
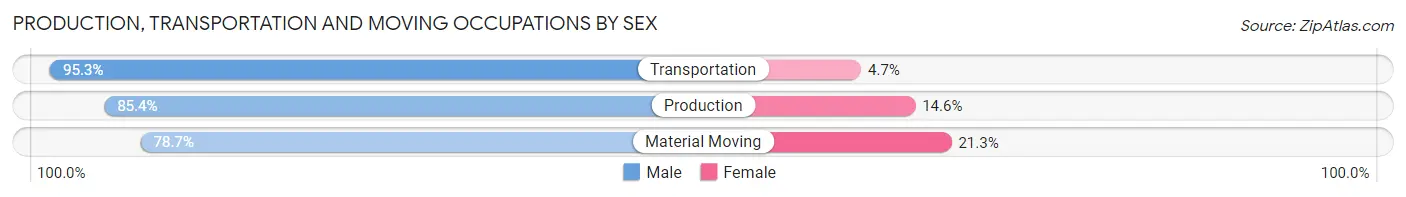
| Occupation | Male | Female |
| Production | 111 (85.4%) | 19 (14.6%) |
| Transportation | 203 (95.3%) | 10 (4.7%) |
| Material Moving | 174 (78.7%) | 47 (21.3%) |
| Total (Category) | 488 (86.5%) | 76 (13.5%) |
| Total (Overall) | 3,621 (57.5%) | 2,676 (42.5%) |
Employment Industries by Sex in Lakeland
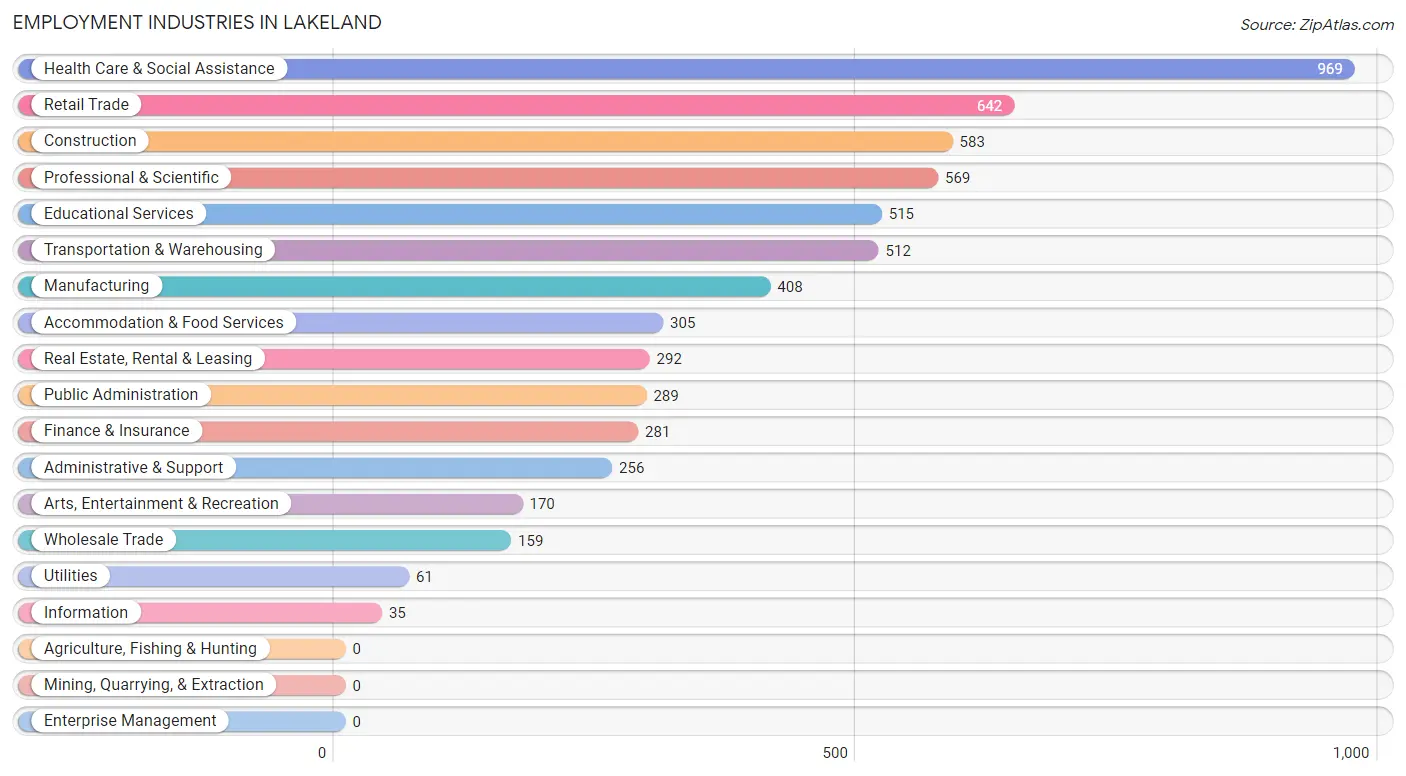
Employment Industries in Lakeland
The major employment industries in Lakeland include Health Care & Social Assistance (969 | 15.4%), Retail Trade (642 | 10.2%), Construction (583 | 9.3%), Professional & Scientific (569 | 9.0%), and Educational Services (515 | 8.2%).
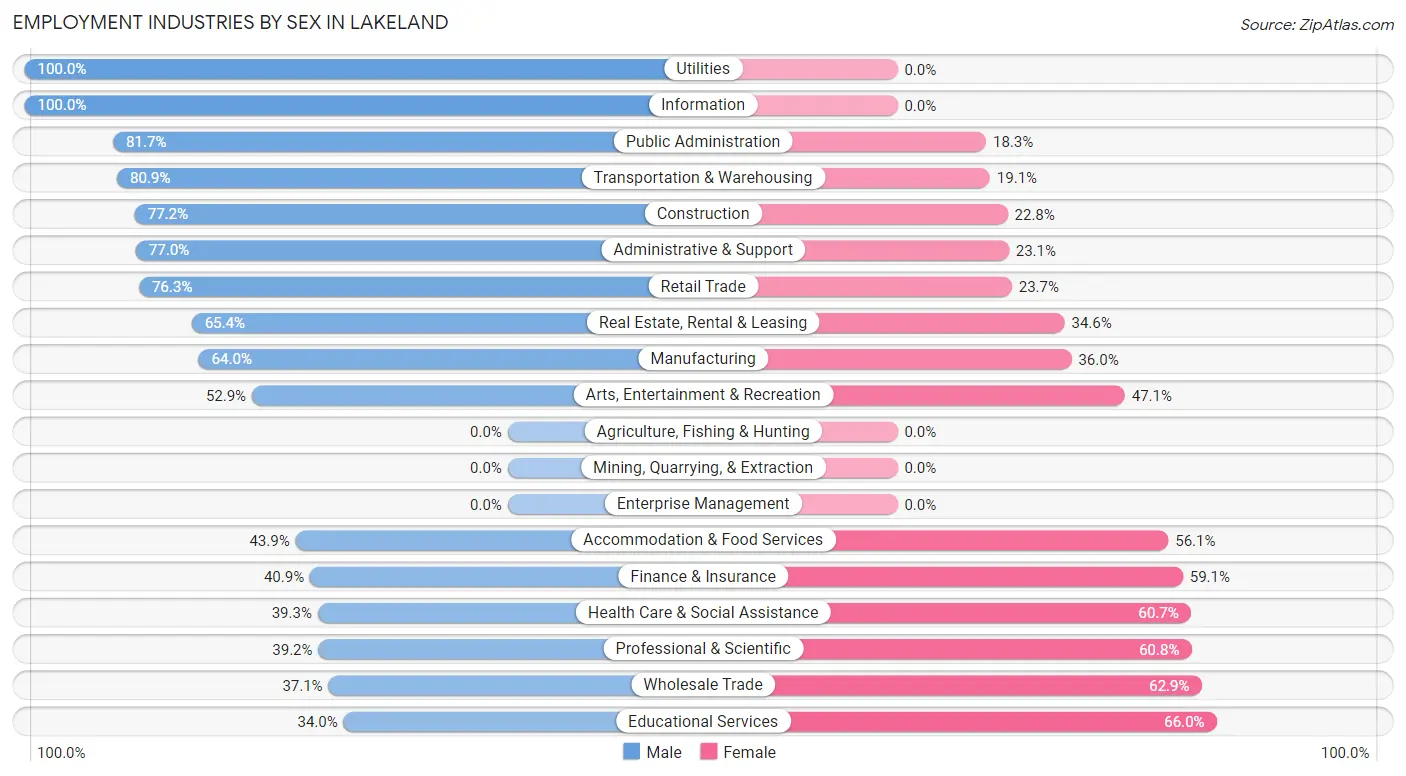
Employment Industries by Sex in Lakeland
The Lakeland industries that see more men than women are Utilities (100.0%), Information (100.0%), and Public Administration (81.7%), whereas the industries that tend to have a higher number of women are Educational Services (66.0%), Wholesale Trade (62.9%), and Professional & Scientific (60.8%).
| Industry | Male | Female |
| Agriculture, Fishing & Hunting | 0 (0.0%) | 0 (0.0%) |
| Mining, Quarrying, & Extraction | 0 (0.0%) | 0 (0.0%) |
| Construction | 450 (77.2%) | 133 (22.8%) |
| Manufacturing | 261 (64.0%) | 147 (36.0%) |
| Wholesale Trade | 59 (37.1%) | 100 (62.9%) |
| Retail Trade | 490 (76.3%) | 152 (23.7%) |
| Transportation & Warehousing | 414 (80.9%) | 98 (19.1%) |
| Utilities | 61 (100.0%) | 0 (0.0%) |
| Information | 35 (100.0%) | 0 (0.0%) |
| Finance & Insurance | 115 (40.9%) | 166 (59.1%) |
| Real Estate, Rental & Leasing | 191 (65.4%) | 101 (34.6%) |
| Professional & Scientific | 223 (39.2%) | 346 (60.8%) |
| Enterprise Management | 0 (0.0%) | 0 (0.0%) |
| Administrative & Support | 197 (76.9%) | 59 (23.1%) |
| Educational Services | 175 (34.0%) | 340 (66.0%) |
| Health Care & Social Assistance | 381 (39.3%) | 588 (60.7%) |
| Arts, Entertainment & Recreation | 90 (52.9%) | 80 (47.1%) |
| Accommodation & Food Services | 134 (43.9%) | 171 (56.1%) |
| Public Administration | 236 (81.7%) | 53 (18.3%) |
| Total | 3,621 (57.5%) | 2,676 (42.5%) |
Education in Lakeland
School Enrollment in Lakeland
The most common levels of schooling among the 3,953 students in Lakeland are middle school (1,052 | 26.6%), high school (914 | 23.1%), and elementary school (880 | 22.3%).
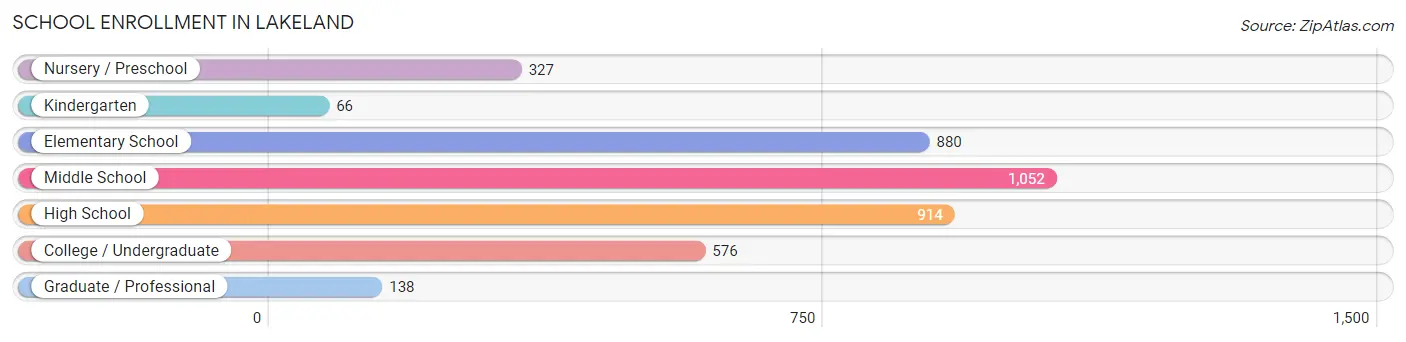
| School Level | # Students | % Students |
| Nursery / Preschool | 327 | 8.3% |
| Kindergarten | 66 | 1.7% |
| Elementary School | 880 | 22.3% |
| Middle School | 1,052 | 26.6% |
| High School | 914 | 23.1% |
| College / Undergraduate | 576 | 14.6% |
| Graduate / Professional | 138 | 3.5% |
| Total | 3,953 | 100.0% |
School Enrollment by Age by Funding Source in Lakeland
Out of a total of 3,953 students who are enrolled in schools in Lakeland, 672 (17.0%) attend a private institution, while the remaining 3,281 (83.0%) are enrolled in public schools. The age group of 35 years and over has the highest likelihood of being enrolled in private schools, with 85 (61.6% in the age bracket) enrolled. Conversely, the age group of 10 to 14 year olds has the lowest likelihood of being enrolled in a private school, with 1,232 (95.1% in the age bracket) attending a public institution.
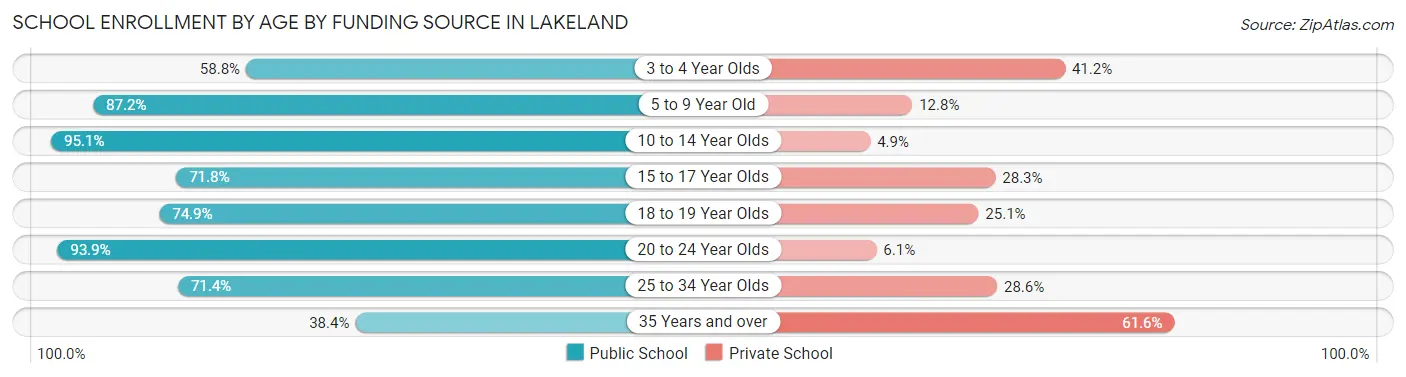
| Age Bracket | Public School | Private School |
| 3 to 4 Year Olds | 164 (58.8%) | 115 (41.2%) |
| 5 to 9 Year Old | 799 (87.2%) | 117 (12.8%) |
| 10 to 14 Year Olds | 1,232 (95.1%) | 64 (4.9%) |
| 15 to 17 Year Olds | 447 (71.8%) | 176 (28.2%) |
| 18 to 19 Year Olds | 194 (74.9%) | 65 (25.1%) |
| 20 to 24 Year Olds | 323 (93.9%) | 21 (6.1%) |
| 25 to 34 Year Olds | 70 (71.4%) | 28 (28.6%) |
| 35 Years and over | 53 (38.4%) | 85 (61.6%) |
| Total | 3,281 (83.0%) | 672 (17.0%) |
Educational Attainment by Field of Study in Lakeland
Business (1,550 | 30.2%), science & technology (561 | 10.9%), arts & humanities (505 | 9.9%), education (447 | 8.7%), and bio, nature & agricultural (350 | 6.8%) are the most common fields of study among 5,127 individuals in Lakeland who have obtained a bachelor's degree or higher.
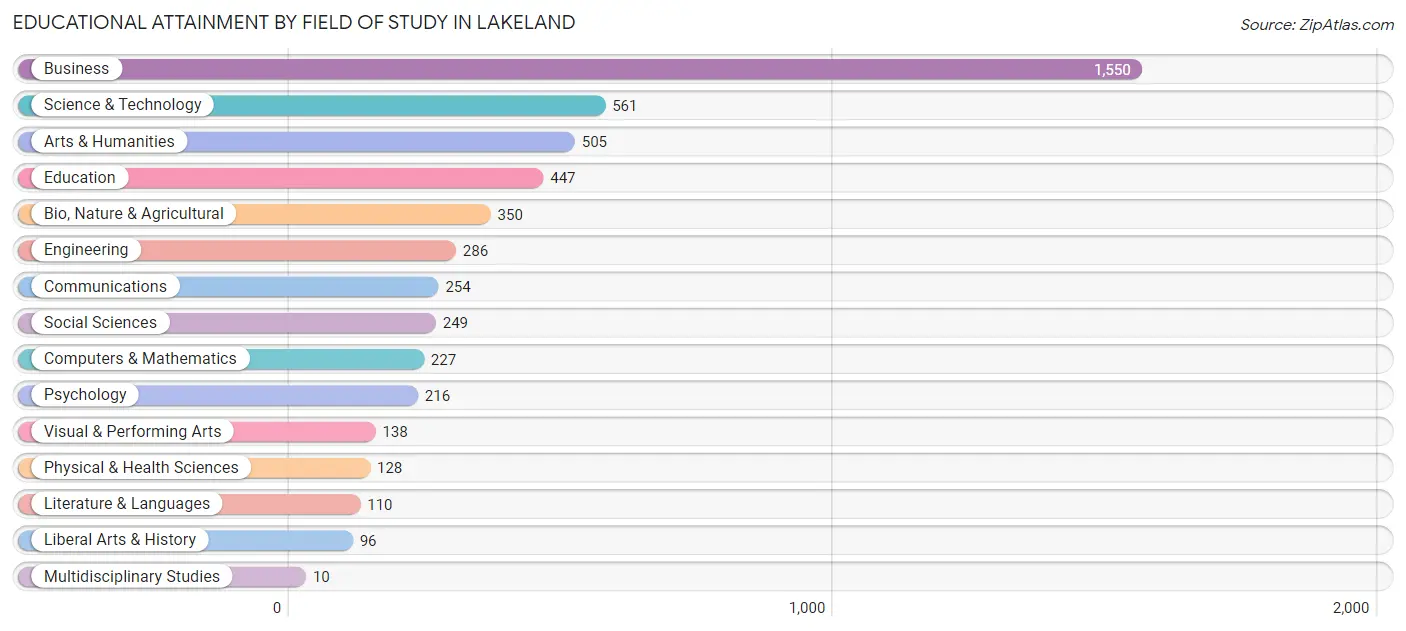
| Field of Study | # Graduates | % Graduates |
| Computers & Mathematics | 227 | 4.4% |
| Bio, Nature & Agricultural | 350 | 6.8% |
| Physical & Health Sciences | 128 | 2.5% |
| Psychology | 216 | 4.2% |
| Social Sciences | 249 | 4.9% |
| Engineering | 286 | 5.6% |
| Multidisciplinary Studies | 10 | 0.2% |
| Science & Technology | 561 | 10.9% |
| Business | 1,550 | 30.2% |
| Education | 447 | 8.7% |
| Literature & Languages | 110 | 2.1% |
| Liberal Arts & History | 96 | 1.9% |
| Visual & Performing Arts | 138 | 2.7% |
| Communications | 254 | 5.0% |
| Arts & Humanities | 505 | 9.9% |
| Total | 5,127 | 100.0% |
Transportation & Commute in Lakeland
Vehicle Availability by Sex in Lakeland
The most prevalent vehicle ownership categories in Lakeland are males with 2 vehicles (1,725, accounting for 47.7%) and females with 2 vehicles (1,339, making up 64.5%).
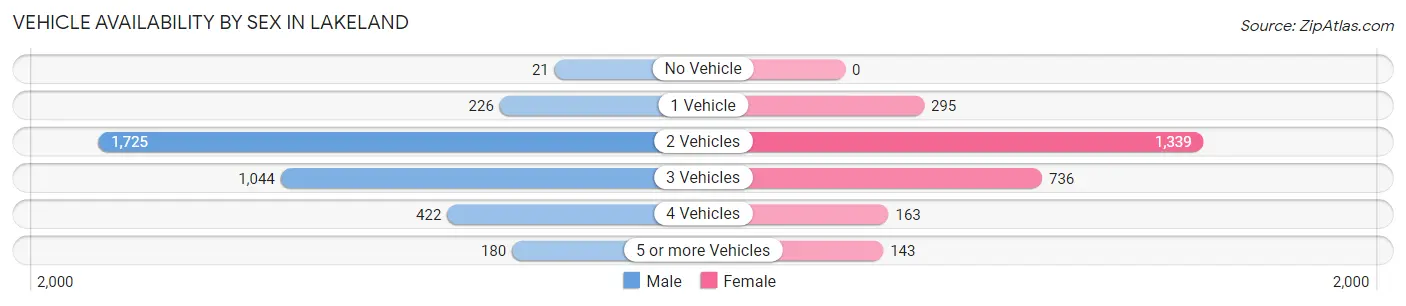
| Vehicles Available | Male | Female |
| No Vehicle | 21 (0.6%) | 0 (0.0%) |
| 1 Vehicle | 226 (6.2%) | 295 (11.0%) |
| 2 Vehicles | 1,725 (47.7%) | 1,339 (50.0%) |
| 3 Vehicles | 1,044 (28.9%) | 736 (27.5%) |
| 4 Vehicles | 422 (11.7%) | 163 (6.1%) |
| 5 or more Vehicles | 180 (5.0%) | 143 (5.3%) |
| Total | 3,618 (100.0%) | 2,676 (100.0%) |
Commute Time in Lakeland
The most frequently occuring commute durations in Lakeland are 20 to 24 minutes (1,281 commuters, 23.4%), 30 to 34 minutes (1,153 commuters, 21.1%), and 15 to 19 minutes (647 commuters, 11.8%).
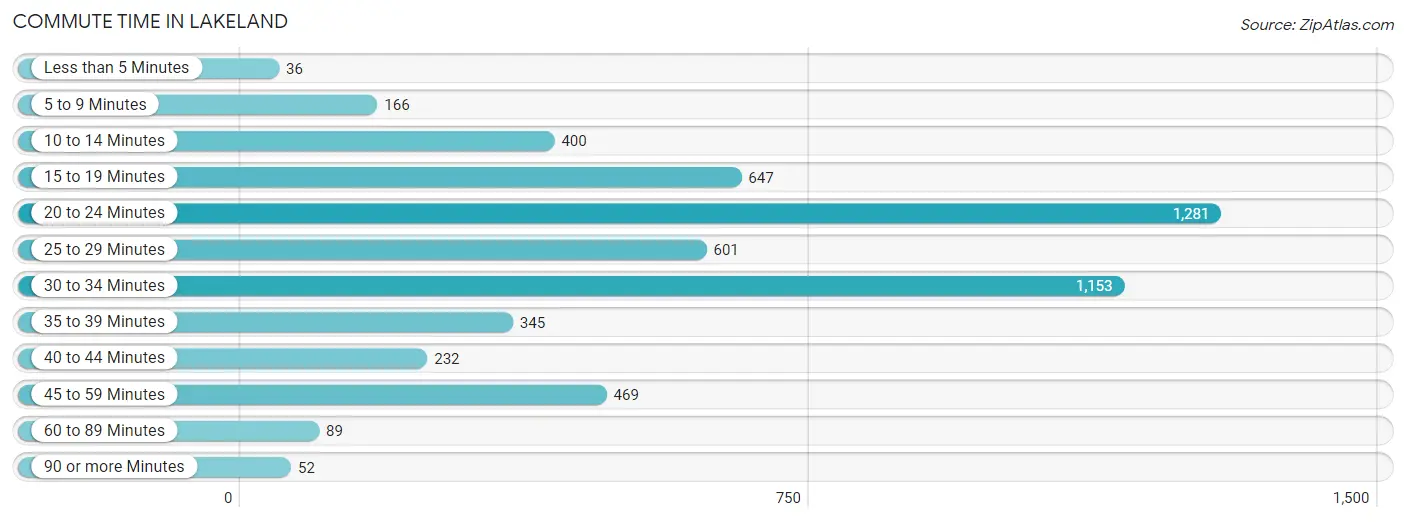
| Commute Time | # Commuters | % Commuters |
| Less than 5 Minutes | 36 | 0.7% |
| 5 to 9 Minutes | 166 | 3.0% |
| 10 to 14 Minutes | 400 | 7.3% |
| 15 to 19 Minutes | 647 | 11.8% |
| 20 to 24 Minutes | 1,281 | 23.4% |
| 25 to 29 Minutes | 601 | 11.0% |
| 30 to 34 Minutes | 1,153 | 21.1% |
| 35 to 39 Minutes | 345 | 6.3% |
| 40 to 44 Minutes | 232 | 4.2% |
| 45 to 59 Minutes | 469 | 8.6% |
| 60 to 89 Minutes | 89 | 1.6% |
| 90 or more Minutes | 52 | 0.9% |
Commute Time by Sex in Lakeland
The most common commute times in Lakeland are 30 to 34 minutes (796 commuters, 25.5%) for males and 20 to 24 minutes (532 commuters, 22.7%) for females.
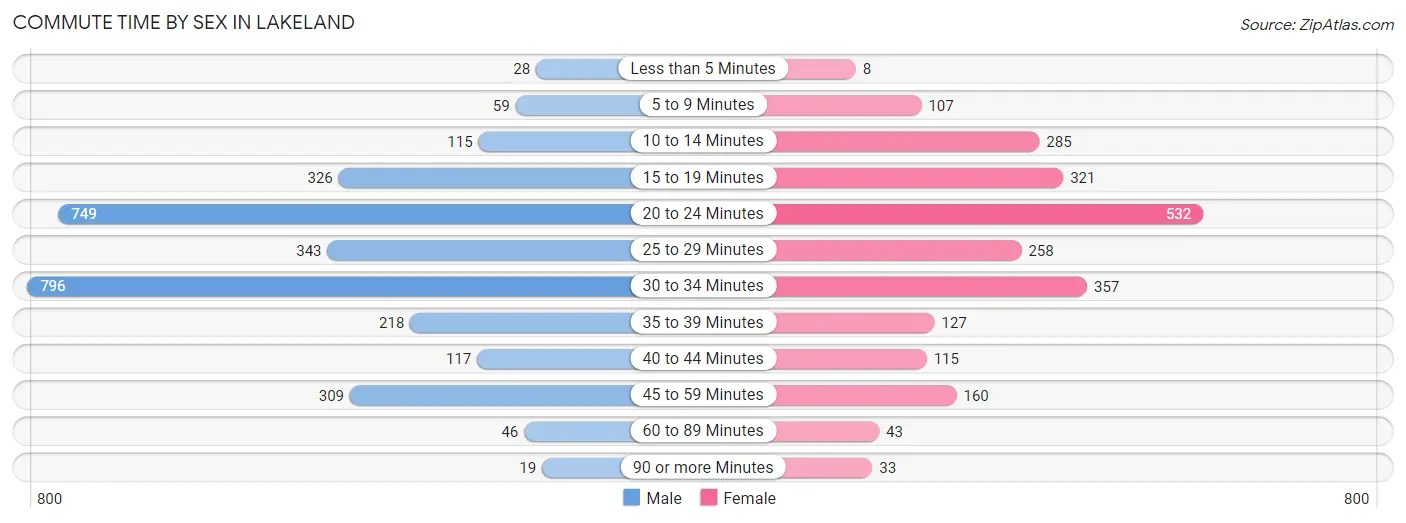
| Commute Time | Male | Female |
| Less than 5 Minutes | 28 (0.9%) | 8 (0.3%) |
| 5 to 9 Minutes | 59 (1.9%) | 107 (4.6%) |
| 10 to 14 Minutes | 115 (3.7%) | 285 (12.1%) |
| 15 to 19 Minutes | 326 (10.4%) | 321 (13.7%) |
| 20 to 24 Minutes | 749 (24.0%) | 532 (22.7%) |
| 25 to 29 Minutes | 343 (11.0%) | 258 (11.0%) |
| 30 to 34 Minutes | 796 (25.5%) | 357 (15.2%) |
| 35 to 39 Minutes | 218 (7.0%) | 127 (5.4%) |
| 40 to 44 Minutes | 117 (3.7%) | 115 (4.9%) |
| 45 to 59 Minutes | 309 (9.9%) | 160 (6.8%) |
| 60 to 89 Minutes | 46 (1.5%) | 43 (1.8%) |
| 90 or more Minutes | 19 (0.6%) | 33 (1.4%) |
Time of Departure to Work by Sex in Lakeland
The most frequent times of departure to work in Lakeland are 6:00 AM to 6:29 AM (580, 18.6%) for males and 7:30 AM to 7:59 AM (377, 16.1%) for females.
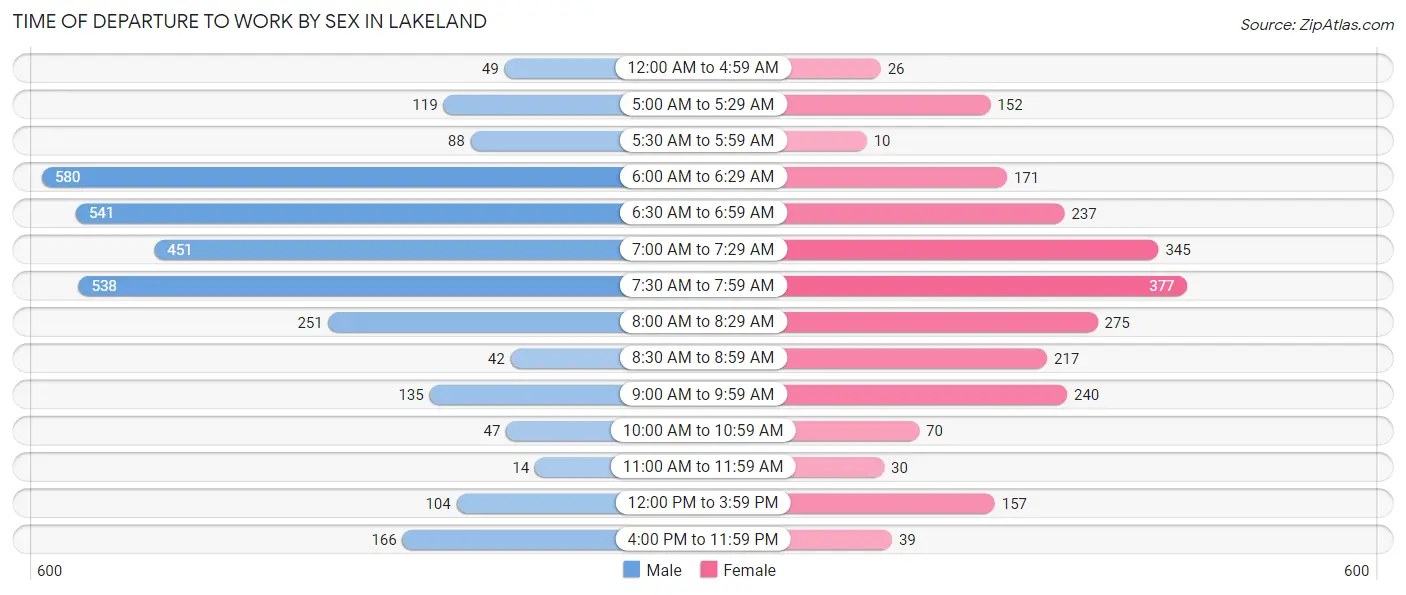
| Time of Departure | Male | Female |
| 12:00 AM to 4:59 AM | 49 (1.6%) | 26 (1.1%) |
| 5:00 AM to 5:29 AM | 119 (3.8%) | 152 (6.5%) |
| 5:30 AM to 5:59 AM | 88 (2.8%) | 10 (0.4%) |
| 6:00 AM to 6:29 AM | 580 (18.6%) | 171 (7.3%) |
| 6:30 AM to 6:59 AM | 541 (17.3%) | 237 (10.1%) |
| 7:00 AM to 7:29 AM | 451 (14.4%) | 345 (14.7%) |
| 7:30 AM to 7:59 AM | 538 (17.2%) | 377 (16.1%) |
| 8:00 AM to 8:29 AM | 251 (8.0%) | 275 (11.7%) |
| 8:30 AM to 8:59 AM | 42 (1.3%) | 217 (9.2%) |
| 9:00 AM to 9:59 AM | 135 (4.3%) | 240 (10.2%) |
| 10:00 AM to 10:59 AM | 47 (1.5%) | 70 (3.0%) |
| 11:00 AM to 11:59 AM | 14 (0.4%) | 30 (1.3%) |
| 12:00 PM to 3:59 PM | 104 (3.3%) | 157 (6.7%) |
| 4:00 PM to 11:59 PM | 166 (5.3%) | 39 (1.7%) |
| Total | 3,125 (100.0%) | 2,346 (100.0%) |
Housing Occupancy in Lakeland
Occupancy by Ownership in Lakeland
Of the total 5,148 dwellings in Lakeland, owner-occupied units account for 4,157 (80.7%), while renter-occupied units make up 991 (19.3%).
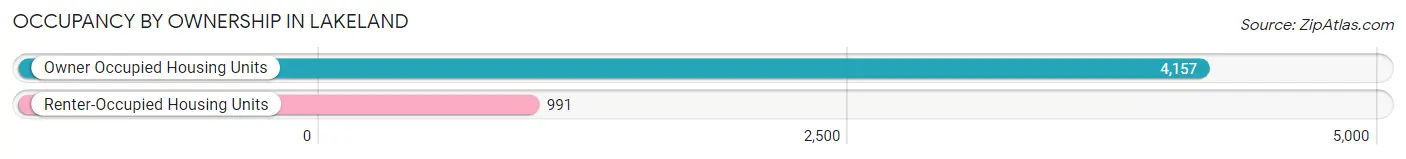
| Occupancy | # Housing Units | % Housing Units |
| Owner Occupied Housing Units | 4,157 | 80.7% |
| Renter-Occupied Housing Units | 991 | 19.3% |
| Total Occupied Housing Units | 5,148 | 100.0% |
Occupancy by Household Size in Lakeland
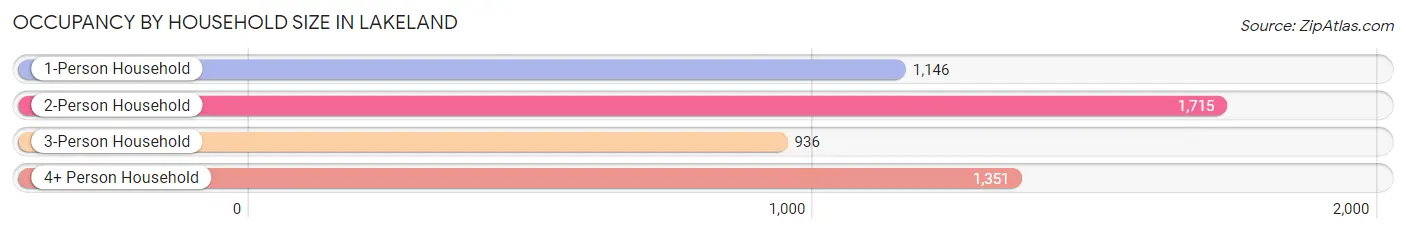
| Household Size | # Housing Units | % Housing Units |
| 1-Person Household | 1,146 | 22.3% |
| 2-Person Household | 1,715 | 33.3% |
| 3-Person Household | 936 | 18.2% |
| 4+ Person Household | 1,351 | 26.2% |
| Total Housing Units | 5,148 | 100.0% |
Occupancy by Ownership by Household Size in Lakeland
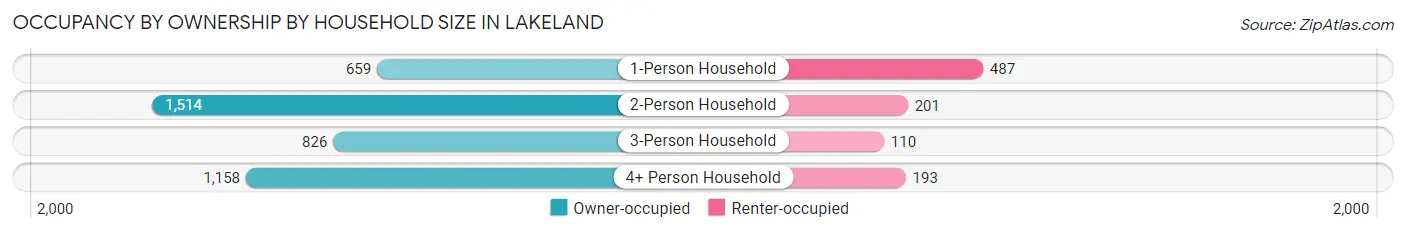
| Household Size | Owner-occupied | Renter-occupied |
| 1-Person Household | 659 (57.5%) | 487 (42.5%) |
| 2-Person Household | 1,514 (88.3%) | 201 (11.7%) |
| 3-Person Household | 826 (88.2%) | 110 (11.7%) |
| 4+ Person Household | 1,158 (85.7%) | 193 (14.3%) |
| Total Housing Units | 4,157 (80.7%) | 991 (19.3%) |
Occupancy by Educational Attainment in Lakeland
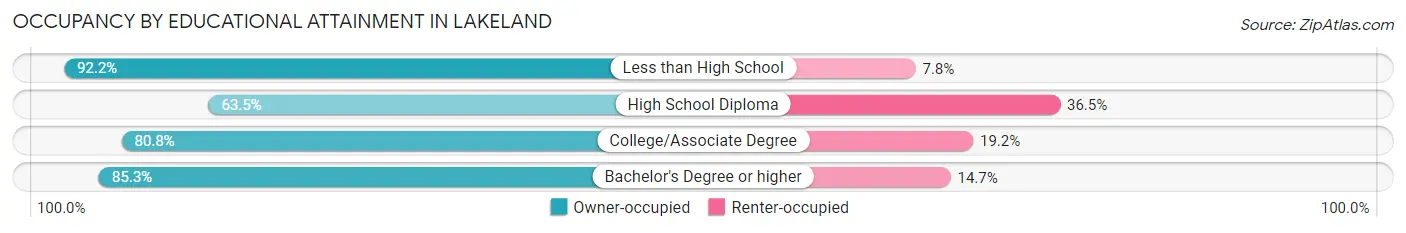
| Household Size | Owner-occupied | Renter-occupied |
| Less than High School | 118 (92.2%) | 10 (7.8%) |
| High School Diploma | 514 (63.5%) | 295 (36.5%) |
| College/Associate Degree | 1,182 (80.8%) | 281 (19.2%) |
| Bachelor's Degree or higher | 2,343 (85.3%) | 405 (14.7%) |
Occupancy by Age of Householder in Lakeland
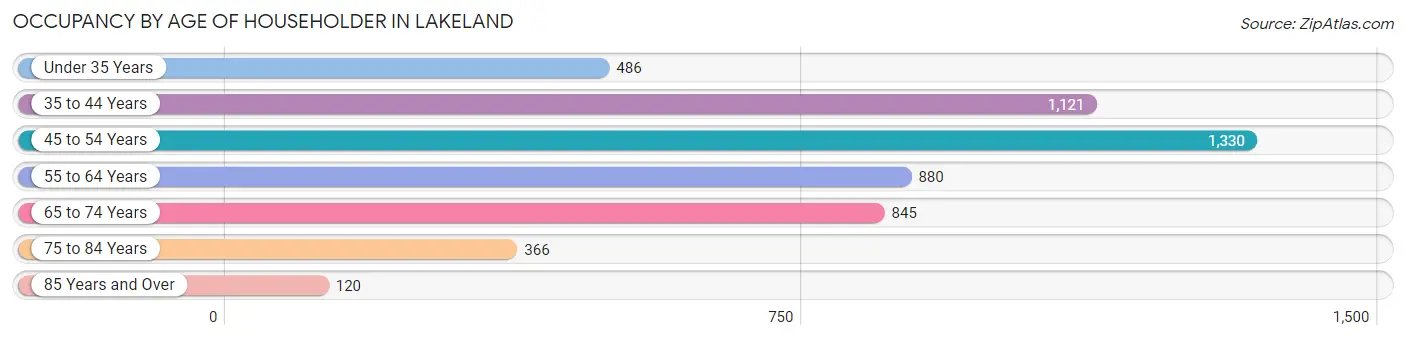
| Age Bracket | # Households | % Households |
| Under 35 Years | 486 | 9.4% |
| 35 to 44 Years | 1,121 | 21.8% |
| 45 to 54 Years | 1,330 | 25.8% |
| 55 to 64 Years | 880 | 17.1% |
| 65 to 74 Years | 845 | 16.4% |
| 75 to 84 Years | 366 | 7.1% |
| 85 Years and Over | 120 | 2.3% |
| Total | 5,148 | 100.0% |
Housing Finances in Lakeland
Median Income by Occupancy in Lakeland
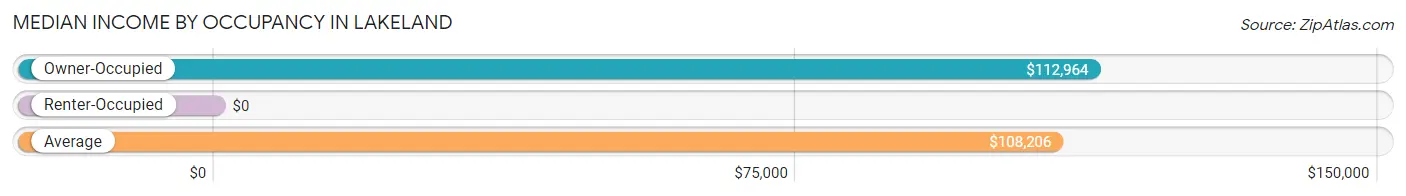
| Occupancy Type | # Households | Median Income |
| Owner-Occupied | 4,157 (80.7%) | $112,964 |
| Renter-Occupied | 991 (19.3%) | $0 |
| Average | 5,148 (100.0%) | $108,206 |
Occupancy by Householder Income Bracket in Lakeland
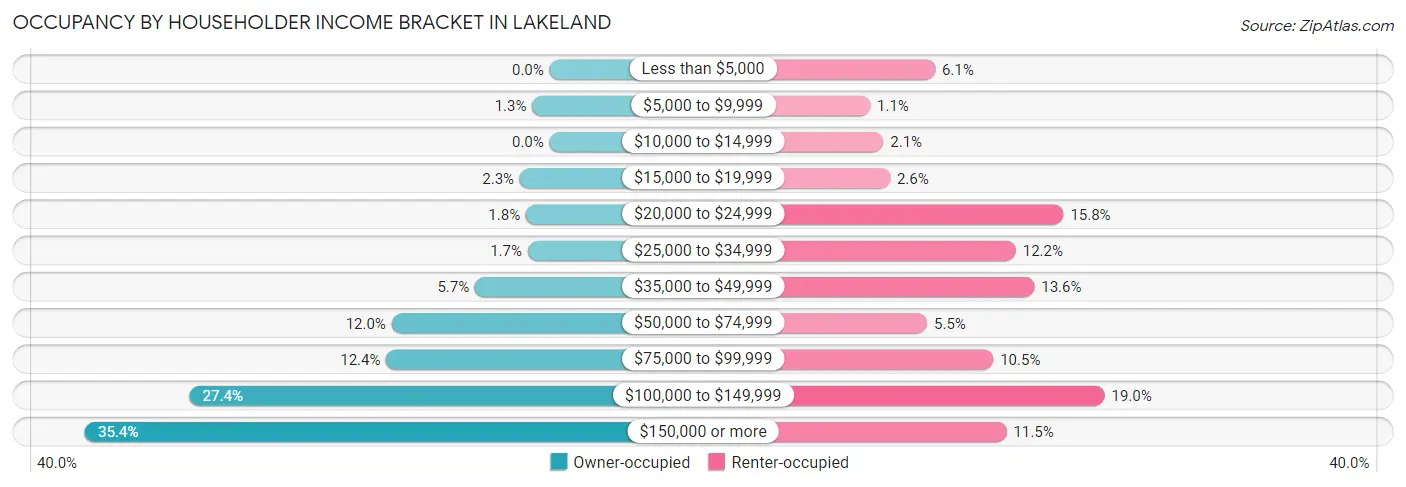
| Income Bracket | Owner-occupied | Renter-occupied |
| Less than $5,000 | 0 (0.0%) | 60 (6.0%) |
| $5,000 to $9,999 | 55 (1.3%) | 11 (1.1%) |
| $10,000 to $14,999 | 0 (0.0%) | 21 (2.1%) |
| $15,000 to $19,999 | 94 (2.3%) | 26 (2.6%) |
| $20,000 to $24,999 | 75 (1.8%) | 157 (15.8%) |
| $25,000 to $34,999 | 69 (1.7%) | 121 (12.2%) |
| $35,000 to $49,999 | 236 (5.7%) | 135 (13.6%) |
| $50,000 to $74,999 | 500 (12.0%) | 54 (5.4%) |
| $75,000 to $99,999 | 517 (12.4%) | 104 (10.5%) |
| $100,000 to $149,999 | 1,140 (27.4%) | 188 (19.0%) |
| $150,000 or more | 1,471 (35.4%) | 114 (11.5%) |
| Total | 4,157 (100.0%) | 991 (100.0%) |
Monthly Housing Cost Tiers in Lakeland
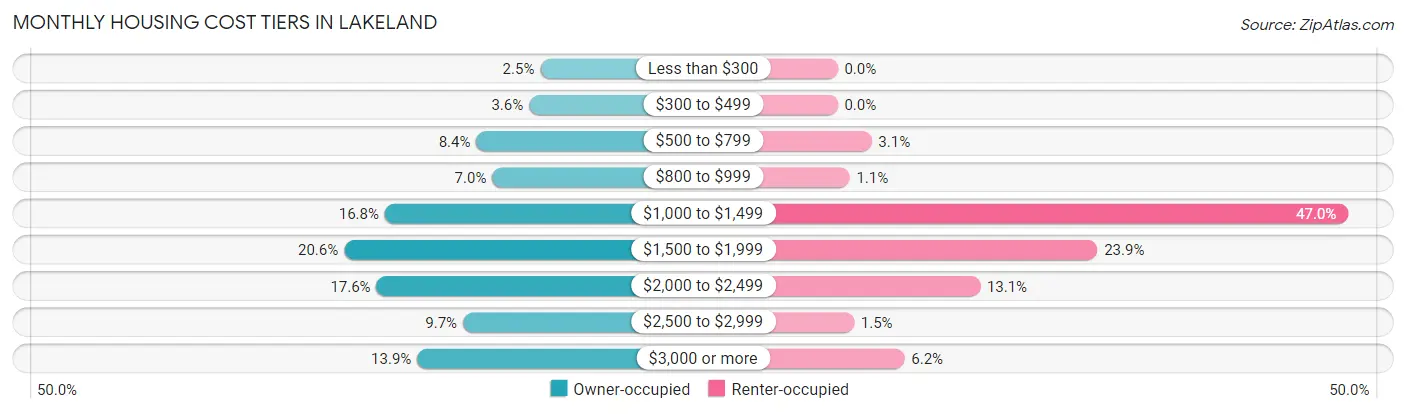
| Monthly Cost | Owner-occupied | Renter-occupied |
| Less than $300 | 105 (2.5%) | 0 (0.0%) |
| $300 to $499 | 148 (3.6%) | 0 (0.0%) |
| $500 to $799 | 350 (8.4%) | 31 (3.1%) |
| $800 to $999 | 289 (7.0%) | 11 (1.1%) |
| $1,000 to $1,499 | 700 (16.8%) | 466 (47.0%) |
| $1,500 to $1,999 | 856 (20.6%) | 237 (23.9%) |
| $2,000 to $2,499 | 732 (17.6%) | 130 (13.1%) |
| $2,500 to $2,999 | 401 (9.7%) | 15 (1.5%) |
| $3,000 or more | 576 (13.9%) | 61 (6.2%) |
| Total | 4,157 (100.0%) | 991 (100.0%) |
Physical Housing Characteristics in Lakeland
Housing Structures in Lakeland
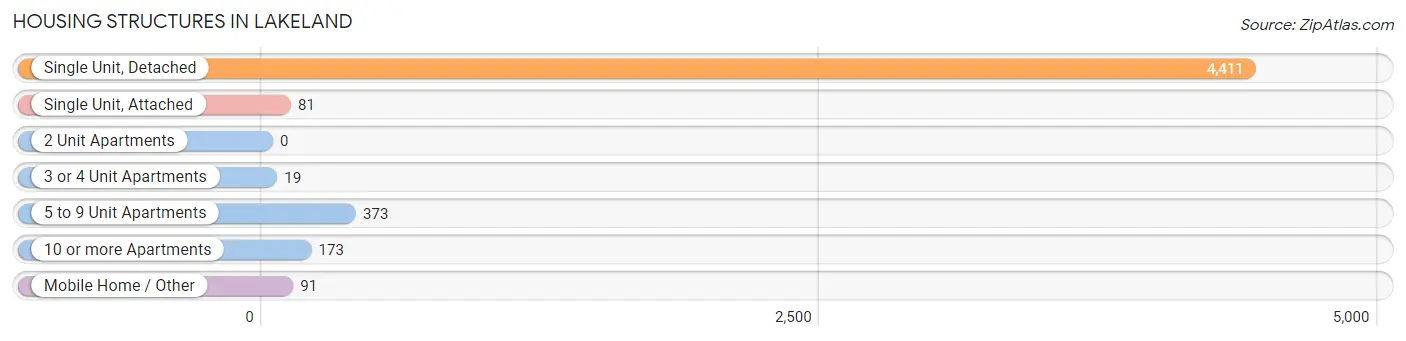
| Structure Type | # Housing Units | % Housing Units |
| Single Unit, Detached | 4,411 | 85.7% |
| Single Unit, Attached | 81 | 1.6% |
| 2 Unit Apartments | 0 | 0.0% |
| 3 or 4 Unit Apartments | 19 | 0.4% |
| 5 to 9 Unit Apartments | 373 | 7.2% |
| 10 or more Apartments | 173 | 3.4% |
| Mobile Home / Other | 91 | 1.8% |
| Total | 5,148 | 100.0% |
Housing Structures by Occupancy in Lakeland
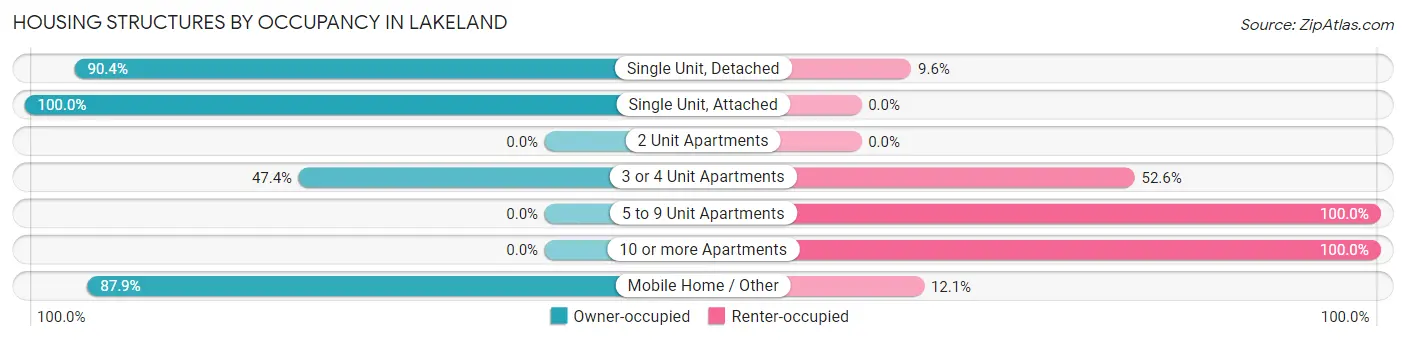
| Structure Type | Owner-occupied | Renter-occupied |
| Single Unit, Detached | 3,987 (90.4%) | 424 (9.6%) |
| Single Unit, Attached | 81 (100.0%) | 0 (0.0%) |
| 2 Unit Apartments | 0 (0.0%) | 0 (0.0%) |
| 3 or 4 Unit Apartments | 9 (47.4%) | 10 (52.6%) |
| 5 to 9 Unit Apartments | 0 (0.0%) | 373 (100.0%) |
| 10 or more Apartments | 0 (0.0%) | 173 (100.0%) |
| Mobile Home / Other | 80 (87.9%) | 11 (12.1%) |
| Total | 4,157 (80.7%) | 991 (19.3%) |
Housing Structures by Number of Rooms in Lakeland
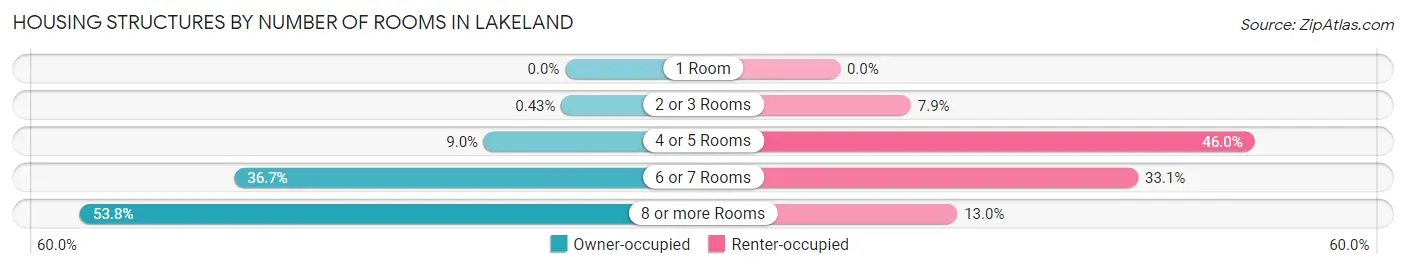
| Number of Rooms | Owner-occupied | Renter-occupied |
| 1 Room | 0 (0.0%) | 0 (0.0%) |
| 2 or 3 Rooms | 18 (0.4%) | 78 (7.9%) |
| 4 or 5 Rooms | 375 (9.0%) | 456 (46.0%) |
| 6 or 7 Rooms | 1,526 (36.7%) | 328 (33.1%) |
| 8 or more Rooms | 2,238 (53.8%) | 129 (13.0%) |
| Total | 4,157 (100.0%) | 991 (100.0%) |
Housing Structure by Heating Type in Lakeland
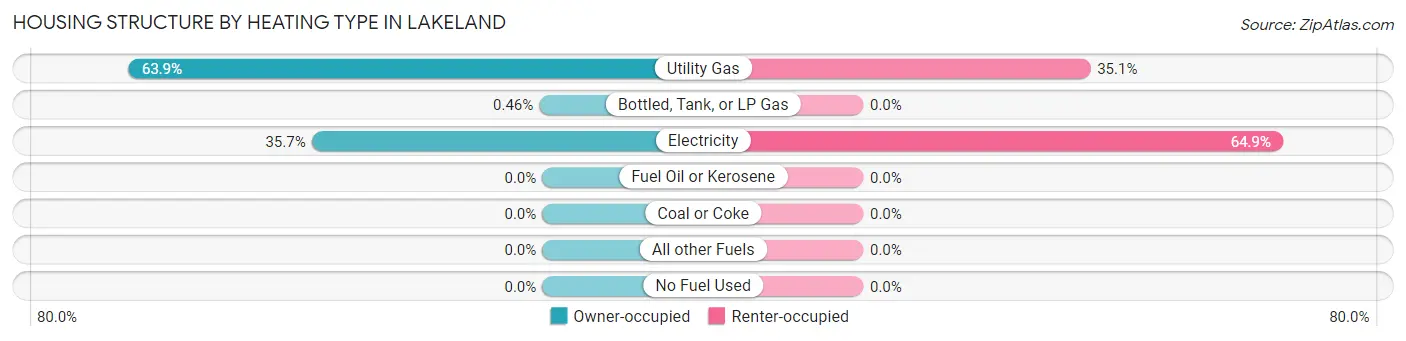
| Heating Type | Owner-occupied | Renter-occupied |
| Utility Gas | 2,656 (63.9%) | 348 (35.1%) |
| Bottled, Tank, or LP Gas | 19 (0.5%) | 0 (0.0%) |
| Electricity | 1,482 (35.6%) | 643 (64.9%) |
| Fuel Oil or Kerosene | 0 (0.0%) | 0 (0.0%) |
| Coal or Coke | 0 (0.0%) | 0 (0.0%) |
| All other Fuels | 0 (0.0%) | 0 (0.0%) |
| No Fuel Used | 0 (0.0%) | 0 (0.0%) |
| Total | 4,157 (100.0%) | 991 (100.0%) |
Household Vehicle Usage in Lakeland
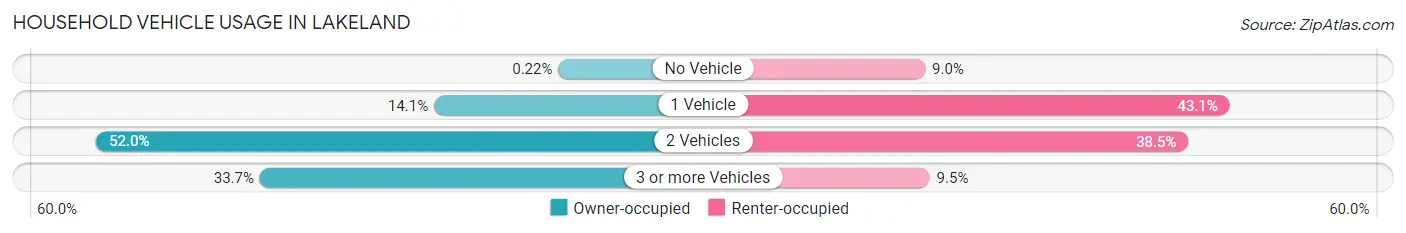
| Vehicles per Household | Owner-occupied | Renter-occupied |
| No Vehicle | 9 (0.2%) | 89 (9.0%) |
| 1 Vehicle | 588 (14.1%) | 427 (43.1%) |
| 2 Vehicles | 2,161 (52.0%) | 381 (38.5%) |
| 3 or more Vehicles | 1,399 (33.7%) | 94 (9.5%) |
| Total | 4,157 (100.0%) | 991 (100.0%) |
Real Estate & Mortgages in Lakeland
Real Estate and Mortgage Overview in Lakeland
| Characteristic | Without Mortgage | With Mortgage |
| Housing Units | 1,193 | 2,964 |
| Median Property Value | $322,100 | $363,400 |
| Median Household Income | $90,417 | $1,126 |
| Monthly Housing Costs | $796 | $576 |
| Real Estate Taxes | $3,609 | $178 |
Property Value by Mortgage Status in Lakeland
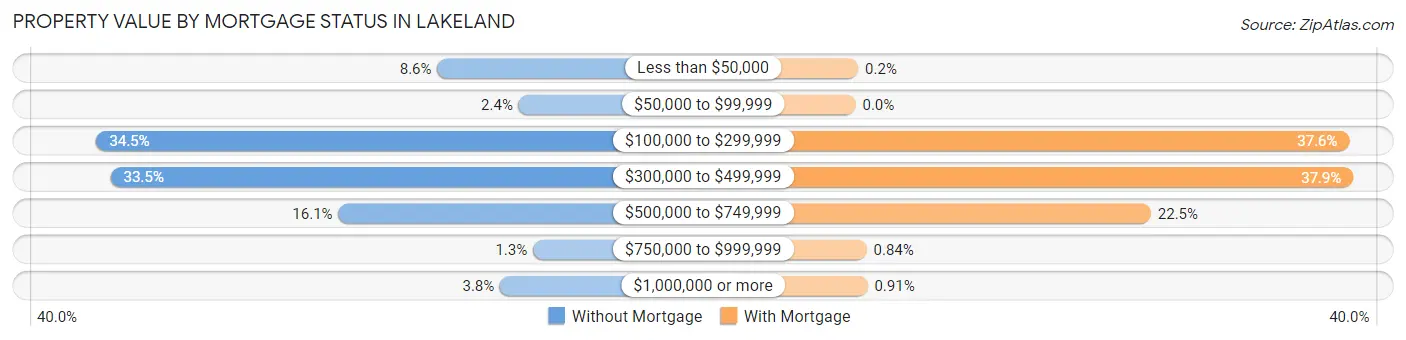
| Property Value | Without Mortgage | With Mortgage |
| Less than $50,000 | 102 (8.6%) | 6 (0.2%) |
| $50,000 to $99,999 | 28 (2.4%) | 0 (0.0%) |
| $100,000 to $299,999 | 412 (34.5%) | 1,115 (37.6%) |
| $300,000 to $499,999 | 399 (33.5%) | 1,124 (37.9%) |
| $500,000 to $749,999 | 192 (16.1%) | 667 (22.5%) |
| $750,000 to $999,999 | 15 (1.3%) | 25 (0.8%) |
| $1,000,000 or more | 45 (3.8%) | 27 (0.9%) |
| Total | 1,193 (100.0%) | 2,964 (100.0%) |
Household Income by Mortgage Status in Lakeland
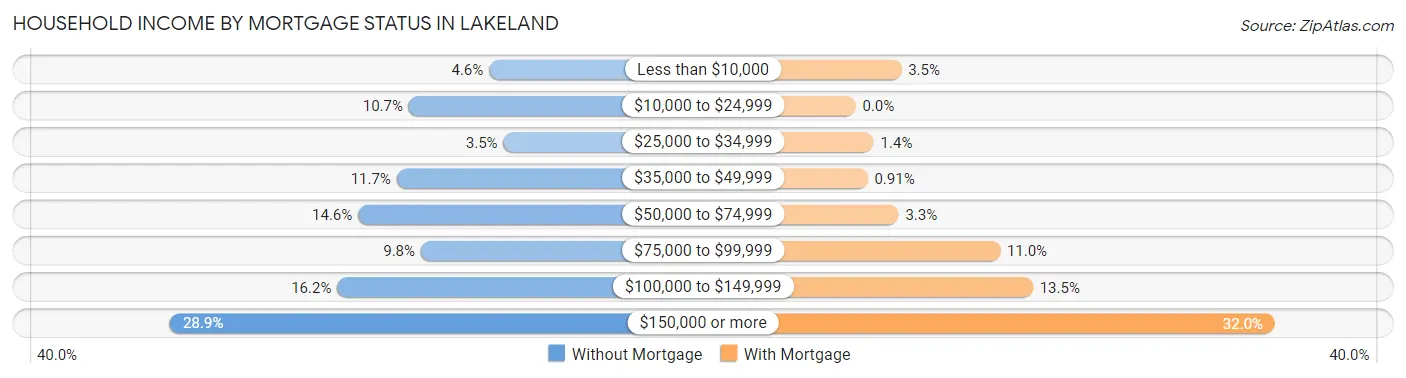
| Household Income | Without Mortgage | With Mortgage |
| Less than $10,000 | 55 (4.6%) | 103 (3.5%) |
| $10,000 to $24,999 | 128 (10.7%) | 0 (0.0%) |
| $25,000 to $34,999 | 42 (3.5%) | 41 (1.4%) |
| $35,000 to $49,999 | 139 (11.7%) | 27 (0.9%) |
| $50,000 to $74,999 | 174 (14.6%) | 97 (3.3%) |
| $75,000 to $99,999 | 117 (9.8%) | 326 (11.0%) |
| $100,000 to $149,999 | 193 (16.2%) | 400 (13.5%) |
| $150,000 or more | 345 (28.9%) | 947 (32.0%) |
| Total | 1,193 (100.0%) | 2,964 (100.0%) |
Property Value to Household Income Ratio in Lakeland
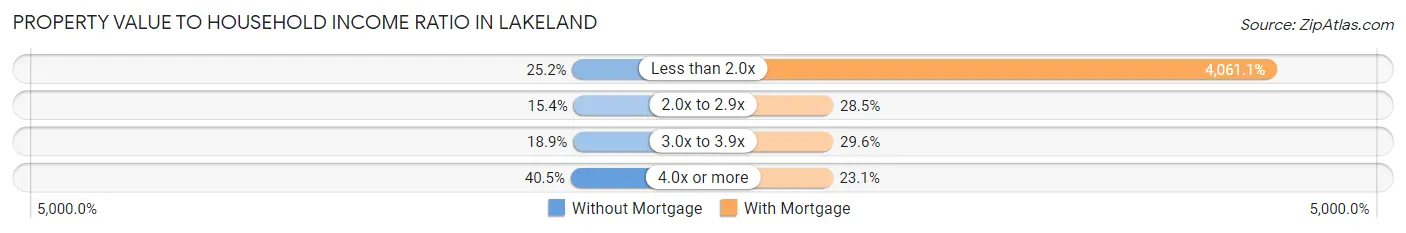
| Value-to-Income Ratio | Without Mortgage | With Mortgage |
| Less than 2.0x | 300 (25.2%) | 120,372 (4,061.1%) |
| 2.0x to 2.9x | 184 (15.4%) | 844 (28.5%) |
| 3.0x to 3.9x | 226 (18.9%) | 876 (29.5%) |
| 4.0x or more | 483 (40.5%) | 684 (23.1%) |
| Total | 1,193 (100.0%) | 2,964 (100.0%) |
Real Estate Taxes by Mortgage Status in Lakeland
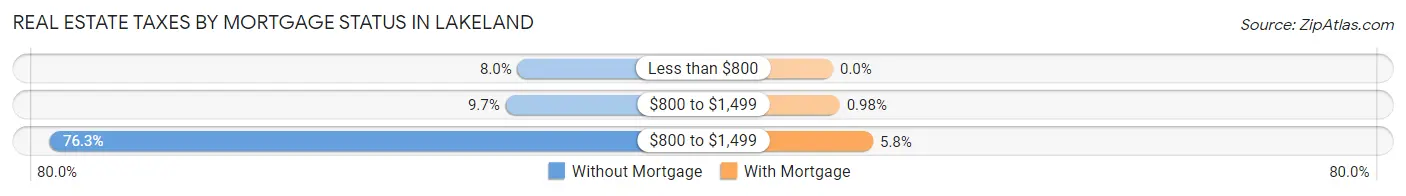
| Property Taxes | Without Mortgage | With Mortgage |
| Less than $800 | 95 (8.0%) | 0 (0.0%) |
| $800 to $1,499 | 116 (9.7%) | 29 (1.0%) |
| $800 to $1,499 | 910 (76.3%) | 173 (5.8%) |
| Total | 1,193 (100.0%) | 2,964 (100.0%) |
Health & Disability in Lakeland
Health Insurance Coverage by Age in Lakeland
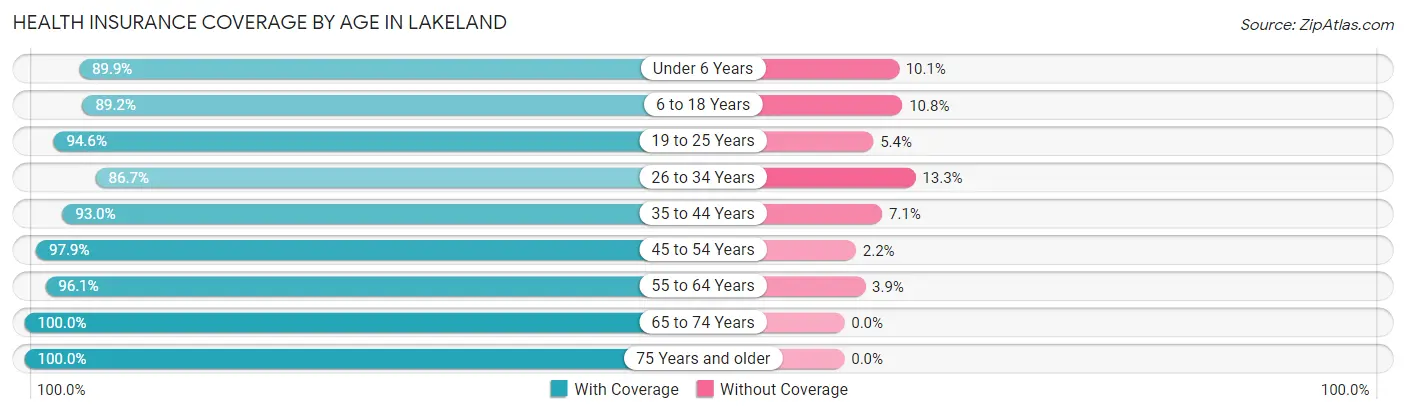
| Age Bracket | With Coverage | Without Coverage |
| Under 6 Years | 930 (89.9%) | 105 (10.1%) |
| 6 to 18 Years | 2,593 (89.2%) | 314 (10.8%) |
| 19 to 25 Years | 788 (94.6%) | 45 (5.4%) |
| 26 to 34 Years | 726 (86.7%) | 111 (13.3%) |
| 35 to 44 Years | 1,805 (92.9%) | 137 (7.0%) |
| 45 to 54 Years | 2,225 (97.9%) | 49 (2.1%) |
| 55 to 64 Years | 1,435 (96.1%) | 58 (3.9%) |
| 65 to 74 Years | 1,568 (100.0%) | 0 (0.0%) |
| 75 Years and older | 871 (100.0%) | 0 (0.0%) |
| Total | 12,941 (94.1%) | 819 (5.9%) |
Health Insurance Coverage by Citizenship Status in Lakeland
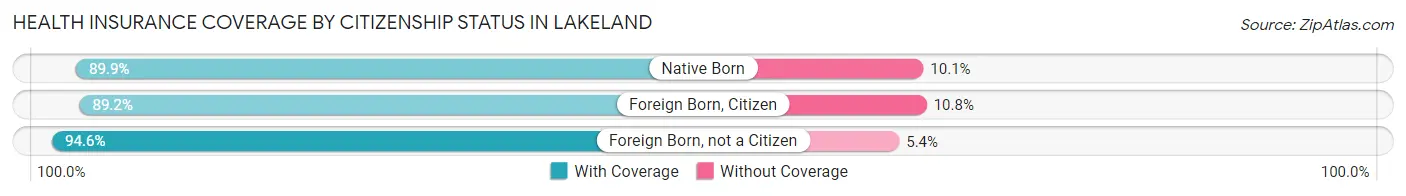
| Citizenship Status | With Coverage | Without Coverage |
| Native Born | 930 (89.9%) | 105 (10.1%) |
| Foreign Born, Citizen | 2,593 (89.2%) | 314 (10.8%) |
| Foreign Born, not a Citizen | 788 (94.6%) | 45 (5.4%) |
Health Insurance Coverage by Household Income in Lakeland
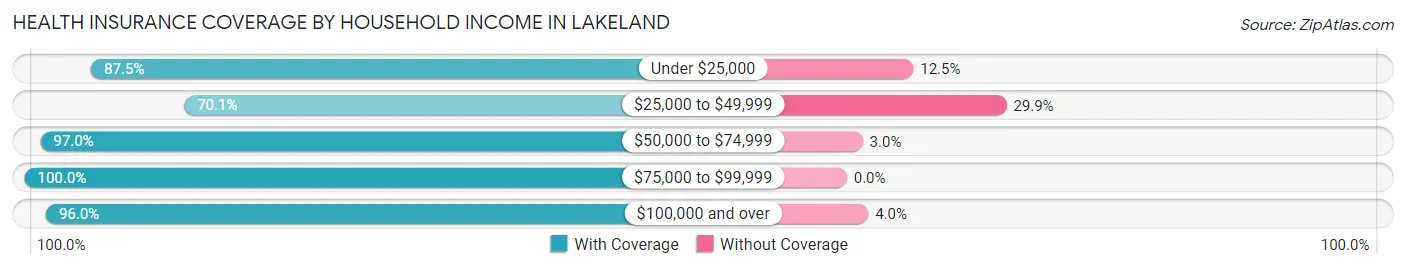
| Household Income | With Coverage | Without Coverage |
| Under $25,000 | 569 (87.5%) | 81 (12.5%) |
| $25,000 to $49,999 | 778 (70.1%) | 332 (29.9%) |
| $50,000 to $74,999 | 1,370 (97.0%) | 42 (3.0%) |
| $75,000 to $99,999 | 1,510 (100.0%) | 0 (0.0%) |
| $100,000 and over | 8,714 (96.0%) | 364 (4.0%) |
Public vs Private Health Insurance Coverage by Age in Lakeland
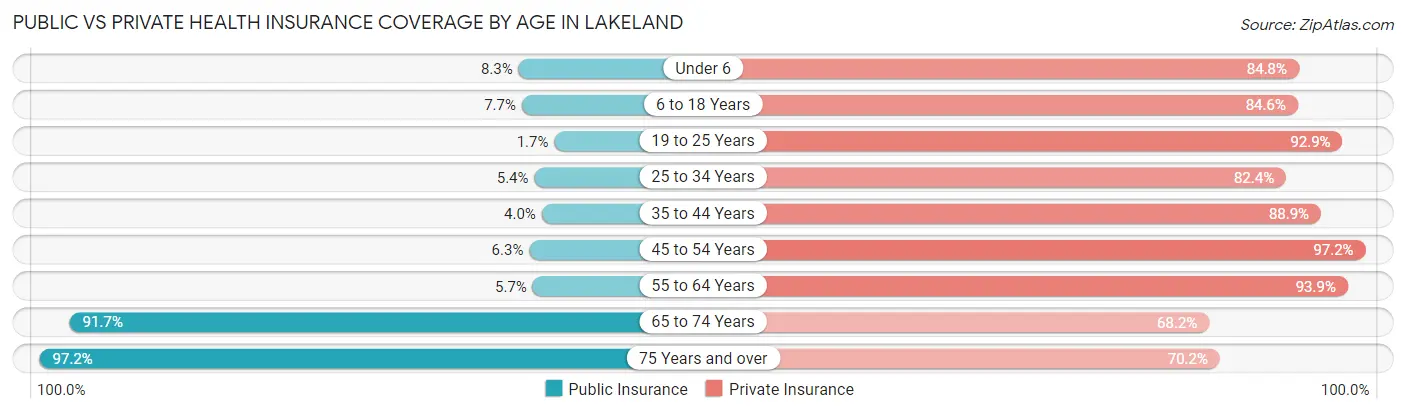
| Age Bracket | Public Insurance | Private Insurance |
| Under 6 | 86 (8.3%) | 878 (84.8%) |
| 6 to 18 Years | 224 (7.7%) | 2,460 (84.6%) |
| 19 to 25 Years | 14 (1.7%) | 774 (92.9%) |
| 25 to 34 Years | 45 (5.4%) | 690 (82.4%) |
| 35 to 44 Years | 78 (4.0%) | 1,727 (88.9%) |
| 45 to 54 Years | 144 (6.3%) | 2,210 (97.2%) |
| 55 to 64 Years | 85 (5.7%) | 1,402 (93.9%) |
| 65 to 74 Years | 1,437 (91.6%) | 1,069 (68.2%) |
| 75 Years and over | 847 (97.2%) | 611 (70.2%) |
| Total | 2,960 (21.5%) | 11,821 (85.9%) |
Disability Status by Sex by Age in Lakeland
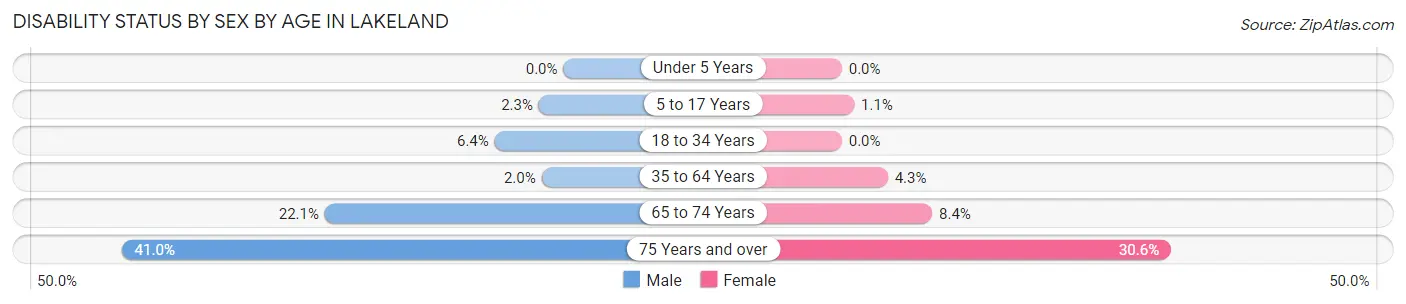
| Age Bracket | Male | Female |
| Under 5 Years | 0 (0.0%) | 0 (0.0%) |
| 5 to 17 Years | 35 (2.3%) | 16 (1.1%) |
| 18 to 34 Years | 61 (6.4%) | 0 (0.0%) |
| 35 to 64 Years | 58 (2.0%) | 121 (4.3%) |
| 65 to 74 Years | 186 (22.1%) | 61 (8.4%) |
| 75 Years and over | 141 (41.0%) | 161 (30.5%) |
Disability Class by Sex by Age in Lakeland
Disability Class: Hearing Difficulty
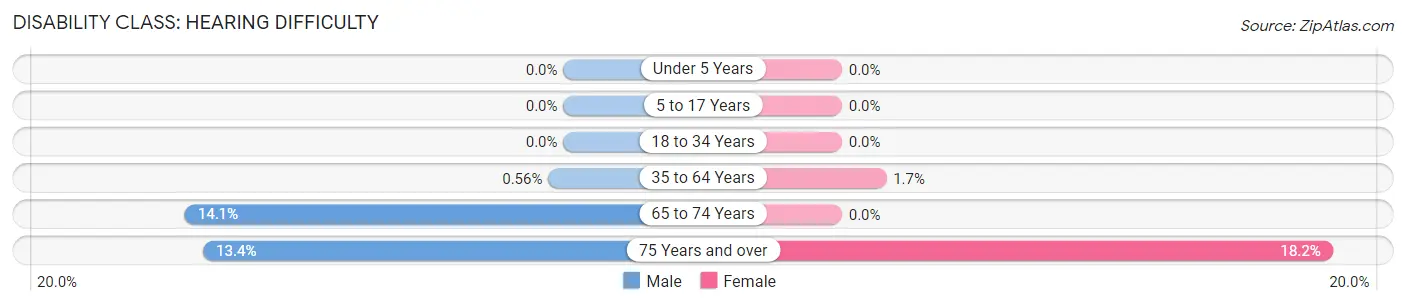
| Age Bracket | Male | Female |
| Under 5 Years | 0 (0.0%) | 0 (0.0%) |
| 5 to 17 Years | 0 (0.0%) | 0 (0.0%) |
| 18 to 34 Years | 0 (0.0%) | 0 (0.0%) |
| 35 to 64 Years | 16 (0.6%) | 47 (1.7%) |
| 65 to 74 Years | 118 (14.1%) | 0 (0.0%) |
| 75 Years and over | 46 (13.4%) | 96 (18.2%) |
Disability Class: Vision Difficulty
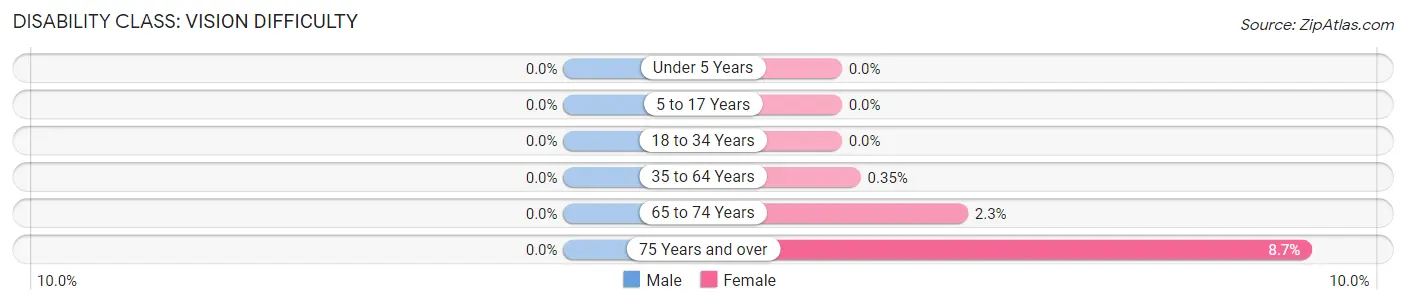
| Age Bracket | Male | Female |
| Under 5 Years | 0 (0.0%) | 0 (0.0%) |
| 5 to 17 Years | 0 (0.0%) | 0 (0.0%) |
| 18 to 34 Years | 0 (0.0%) | 0 (0.0%) |
| 35 to 64 Years | 0 (0.0%) | 10 (0.4%) |
| 65 to 74 Years | 0 (0.0%) | 17 (2.3%) |
| 75 Years and over | 0 (0.0%) | 46 (8.7%) |
Disability Class: Cognitive Difficulty
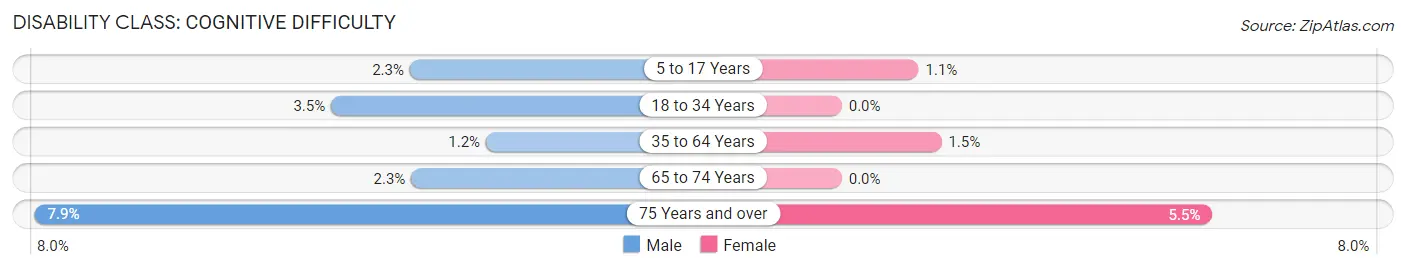
| Age Bracket | Male | Female |
| 5 to 17 Years | 35 (2.3%) | 16 (1.1%) |
| 18 to 34 Years | 33 (3.5%) | 0 (0.0%) |
| 35 to 64 Years | 33 (1.1%) | 42 (1.5%) |
| 65 to 74 Years | 19 (2.3%) | 0 (0.0%) |
| 75 Years and over | 27 (7.9%) | 29 (5.5%) |
Disability Class: Ambulatory Difficulty
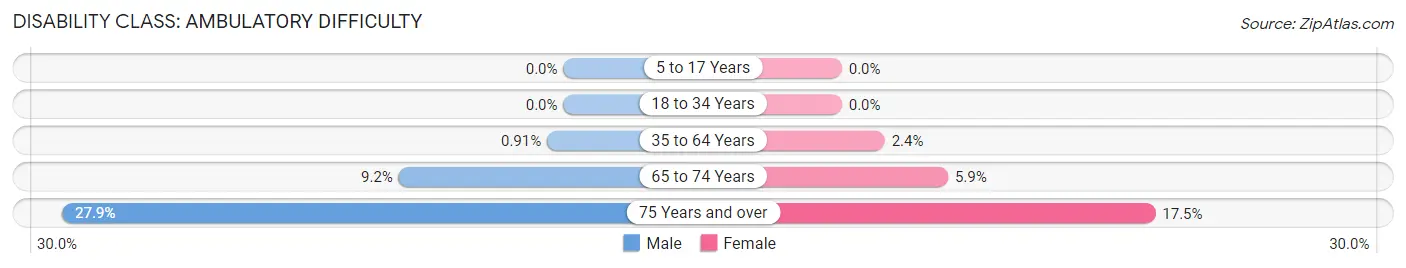
| Age Bracket | Male | Female |
| 5 to 17 Years | 0 (0.0%) | 0 (0.0%) |
| 18 to 34 Years | 0 (0.0%) | 0 (0.0%) |
| 35 to 64 Years | 26 (0.9%) | 68 (2.4%) |
| 65 to 74 Years | 77 (9.2%) | 43 (5.9%) |
| 75 Years and over | 96 (27.9%) | 92 (17.5%) |
Disability Class: Self-Care Difficulty
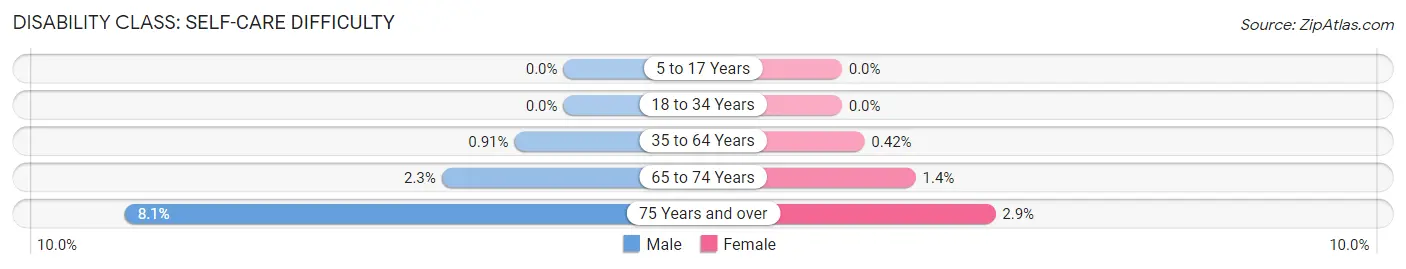
| Age Bracket | Male | Female |
| 5 to 17 Years | 0 (0.0%) | 0 (0.0%) |
| 18 to 34 Years | 0 (0.0%) | 0 (0.0%) |
| 35 to 64 Years | 26 (0.9%) | 12 (0.4%) |
| 65 to 74 Years | 19 (2.3%) | 10 (1.4%) |
| 75 Years and over | 28 (8.1%) | 15 (2.9%) |
Technology Access in Lakeland
Computing Device Access in Lakeland
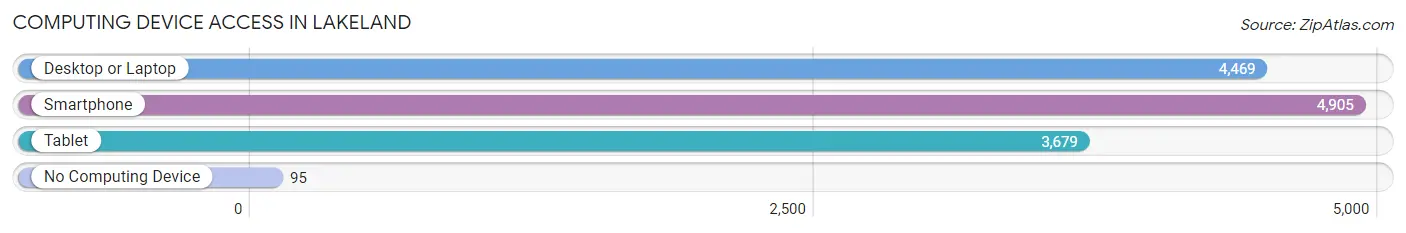
| Device Type | # Households | % Households |
| Desktop or Laptop | 4,469 | 86.8% |
| Smartphone | 4,905 | 95.3% |
| Tablet | 3,679 | 71.5% |
| No Computing Device | 95 | 1.8% |
| Total | 5,148 | 100.0% |
Internet Access in Lakeland
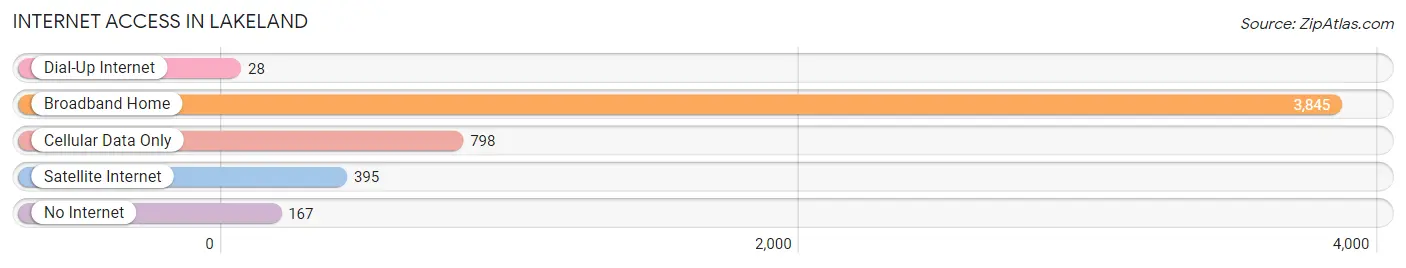
| Internet Type | # Households | % Households |
| Dial-Up Internet | 28 | 0.5% |
| Broadband Home | 3,845 | 74.7% |
| Cellular Data Only | 798 | 15.5% |
| Satellite Internet | 395 | 7.7% |
| No Internet | 167 | 3.2% |
| Total | 5,148 | 100.0% |
Lakeland Summary
Lakeland is a city located in Shelby County, Tennessee, United States. It is a suburb of Memphis, located approximately 20 miles east of the city. The population was 12,430 at the 2010 census.
History
The area that is now Lakeland was first settled in the early 1800s. The first settlers were mostly farmers who grew cotton and other crops. The area was known as "Hickory Hill" until the late 1800s when the name was changed to Lakeland. The name was chosen because of the many lakes in the area.
In the early 1900s, the area began to grow rapidly. The population increased from just over 500 in 1900 to over 1,000 by 1910. The city was officially incorporated in 1951.
Geography
Lakeland is located in the southeastern corner of Shelby County, Tennessee. It is bordered by the cities of Bartlett to the north, Germantown to the east, and Arlington to the south. The city is located approximately 20 miles east of Memphis.
The city has a total area of 8.3 square miles, of which 8.2 square miles is land and 0.1 square miles is water. The city is located in the Memphis metropolitan area.
Economy
The economy of Lakeland is largely based on retail and services. The city is home to several large retail stores, including Walmart, Target, and Home Depot. There are also several restaurants and other businesses in the city.
The city is also home to several industrial and manufacturing companies, including a large distribution center for FedEx.
Demographics
As of the 2010 census, there were 12,430 people, 4,845 households, and 3,541 families residing in the city. The population density was 1,510.3 people per square mile. The racial makeup of the city was 68.2% White, 25.3% African American, 0.3% Native American, 2.2% Asian, 0.1% Pacific Islander, 1.7% from other races, and 2.4% from two or more races. Hispanic or Latino of any race were 4.3% of the population.
The median income for a household in the city was $60,945, and the median income for a family was $71,945. The per capita income for the city was $27,945. About 5.2% of families and 7.2% of the population were below the poverty line, including 8.7% of those under age 18 and 5.2% of those age 65 or over.
Common Questions
What is Per Capita Income in Lakeland?
Per Capita income in Lakeland is $48,883.
What is the Median Family Income in Lakeland?
Median Family Income in Lakeland is $121,867.
What is the Median Household income in Lakeland?
Median Household Income in Lakeland is $108,206.
What is Income or Wage Gap in Lakeland?
Income or Wage Gap in Lakeland is 29.7%.
Women in Lakeland earn 70.3 cents for every dollar earned by a man.
What is Inequality or Gini Index in Lakeland?
Inequality or Gini Index in Lakeland is 0.40.
What is the Total Population of Lakeland?
Total Population of Lakeland is 13,811.
What is the Total Male Population of Lakeland?
Total Male Population of Lakeland is 7,248.
What is the Total Female Population of Lakeland?
Total Female Population of Lakeland is 6,563.
What is the Ratio of Males per 100 Females in Lakeland?
There are 110.44 Males per 100 Females in Lakeland.
What is the Ratio of Females per 100 Males in Lakeland?
There are 90.55 Females per 100 Males in Lakeland.
What is the Median Population Age in Lakeland?
Median Population Age in Lakeland is 42.0 Years.
What is the Average Family Size in Lakeland
Average Family Size in Lakeland is 3.2 People.
What is the Average Household Size in Lakeland
Average Household Size in Lakeland is 2.7 People.
How Large is the Labor Force in Lakeland?
There are 6,544 People in the Labor Forcein in Lakeland.
What is the Percentage of People in the Labor Force in Lakeland?
62.9% of People are in the Labor Force in Lakeland.
What is the Unemployment Rate in Lakeland?
Unemployment Rate in Lakeland is 3.1%.