Shackle Island, TN Map & Demographics
Shackle Island Map
Shackle Island Overview
$49,899
PER CAPITA INCOME
$126,071
AVG FAMILY INCOME
$110,944
AVG HOUSEHOLD INCOME
44.4%
WAGE / INCOME GAP [ % ]
55.6¢/ $1
WAGE / INCOME GAP [ $ ]
0.36
INEQUALITY / GINI INDEX
4,375
TOTAL POPULATION
2,179
MALE POPULATION
2,196
FEMALE POPULATION
99.23
MALES / 100 FEMALES
100.78
FEMALES / 100 MALES
44.2
MEDIAN AGE
2.9
AVG FAMILY SIZE
2.9
AVG HOUSEHOLD SIZE
2,687
LABOR FORCE [ PEOPLE ]
76.5%
PERCENT IN LABOR FORCE
6.1%
UNEMPLOYMENT RATE
Income in Shackle Island
Income Overview in Shackle Island
Per Capita Income in Shackle Island is $49,899, while median incomes of families and households are $126,071 and $110,944 respectively.
| Characteristic | Number | Measure |
| Per Capita Income | 4,375 | $49,899 |
| Median Family Income | 1,350 | $126,071 |
| Mean Family Income | 1,350 | $139,887 |
| Median Household Income | 1,528 | $110,944 |
| Mean Household Income | 1,528 | $138,786 |
| Income Deficit | 1,350 | $0 |
| Wage / Income Gap (%) | 4,375 | 44.40% |
| Wage / Income Gap ($) | 4,375 | 55.60¢ per $1 |
| Gini / Inequality Index | 4,375 | 0.36 |
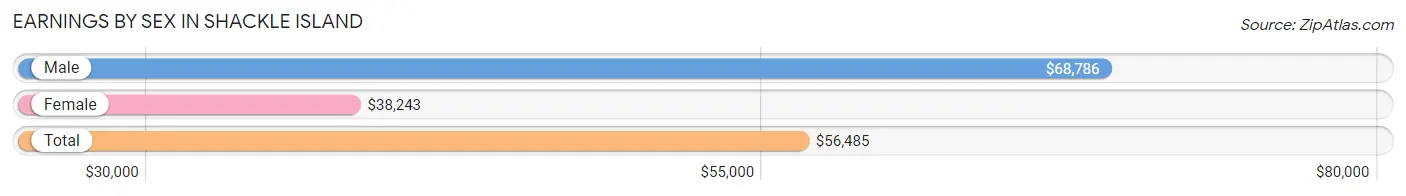
Earnings by Sex in Shackle Island
Average Earnings in Shackle Island are $56,485, $68,786 for men and $38,243 for women, a difference of 44.4%.
| Sex | Number | Average Earnings |
| Male | 1,312 (49.6%) | $68,786 |
| Female | 1,332 (50.4%) | $38,243 |
| Total | 2,644 (100.0%) | $56,485 |
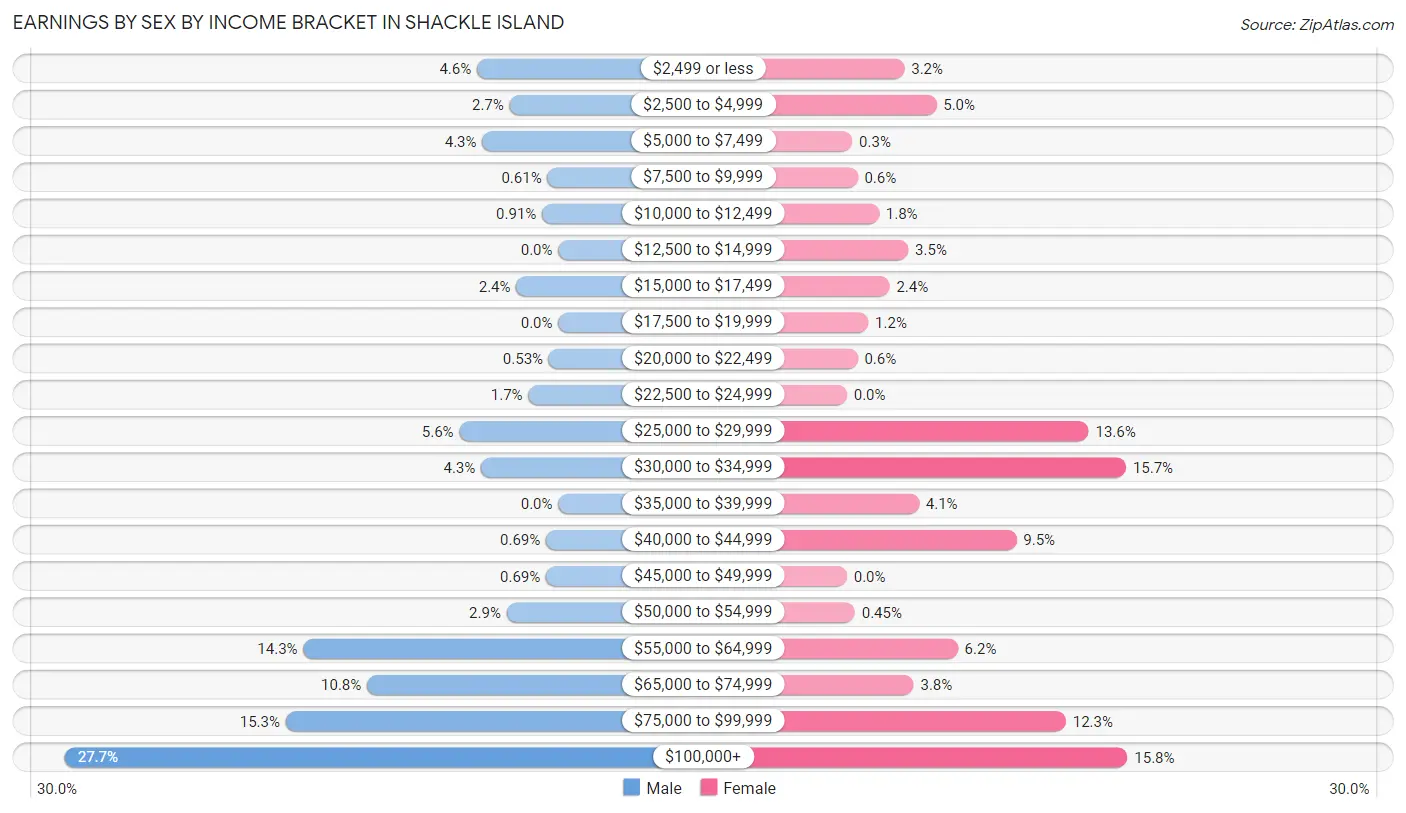
Earnings by Sex by Income Bracket in Shackle Island
The most common earnings brackets in Shackle Island are $100,000+ for men (364 | 27.7%) and $100,000+ for women (210 | 15.8%).
| Income | Male | Female |
| $2,499 or less | 60 (4.6%) | 43 (3.2%) |
| $2,500 to $4,999 | 36 (2.7%) | 67 (5.0%) |
| $5,000 to $7,499 | 56 (4.3%) | 4 (0.3%) |
| $7,500 to $9,999 | 8 (0.6%) | 8 (0.6%) |
| $10,000 to $12,499 | 12 (0.9%) | 24 (1.8%) |
| $12,500 to $14,999 | 0 (0.0%) | 46 (3.5%) |
| $15,000 to $17,499 | 31 (2.4%) | 32 (2.4%) |
| $17,500 to $19,999 | 0 (0.0%) | 16 (1.2%) |
| $20,000 to $22,499 | 7 (0.5%) | 8 (0.6%) |
| $22,500 to $24,999 | 22 (1.7%) | 0 (0.0%) |
| $25,000 to $29,999 | 73 (5.6%) | 181 (13.6%) |
| $30,000 to $34,999 | 57 (4.3%) | 209 (15.7%) |
| $35,000 to $39,999 | 0 (0.0%) | 54 (4.1%) |
| $40,000 to $44,999 | 9 (0.7%) | 127 (9.5%) |
| $45,000 to $49,999 | 9 (0.7%) | 0 (0.0%) |
| $50,000 to $54,999 | 38 (2.9%) | 6 (0.4%) |
| $55,000 to $64,999 | 188 (14.3%) | 83 (6.2%) |
| $65,000 to $74,999 | 141 (10.7%) | 50 (3.7%) |
| $75,000 to $99,999 | 201 (15.3%) | 164 (12.3%) |
| $100,000+ | 364 (27.7%) | 210 (15.8%) |
| Total | 1,312 (100.0%) | 1,332 (100.0%) |
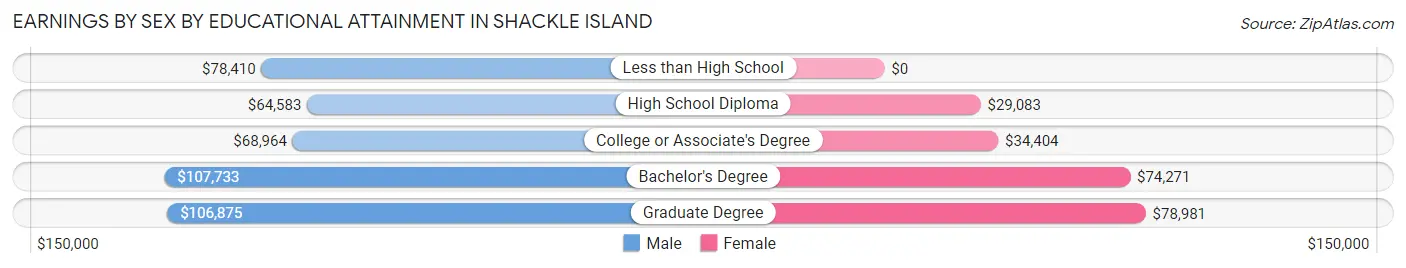
Earnings by Sex by Educational Attainment in Shackle Island
Average earnings in Shackle Island are $77,932 for men and $42,650 for women, a difference of 45.3%. Men with an educational attainment of bachelor's degree enjoy the highest average annual earnings of $107,733, while those with high school diploma education earn the least with $64,583. Women with an educational attainment of graduate degree earn the most with the average annual earnings of $78,981, while those with high school diploma education have the smallest earnings of $29,083.
| Educational Attainment | Male Income | Female Income |
| Less than High School | $78,410 | $0 |
| High School Diploma | $64,583 | $29,083 |
| College or Associate's Degree | $68,964 | $34,404 |
| Bachelor's Degree | $107,733 | $74,271 |
| Graduate Degree | $106,875 | $78,981 |
| Total | $77,932 | $42,650 |
Family Income in Shackle Island
Family Income Brackets in Shackle Island
According to the Shackle Island family income data, there are 460 families falling into the $100,000 to $149,999 income range, which is the most common income bracket and makes up 34.1% of all families.
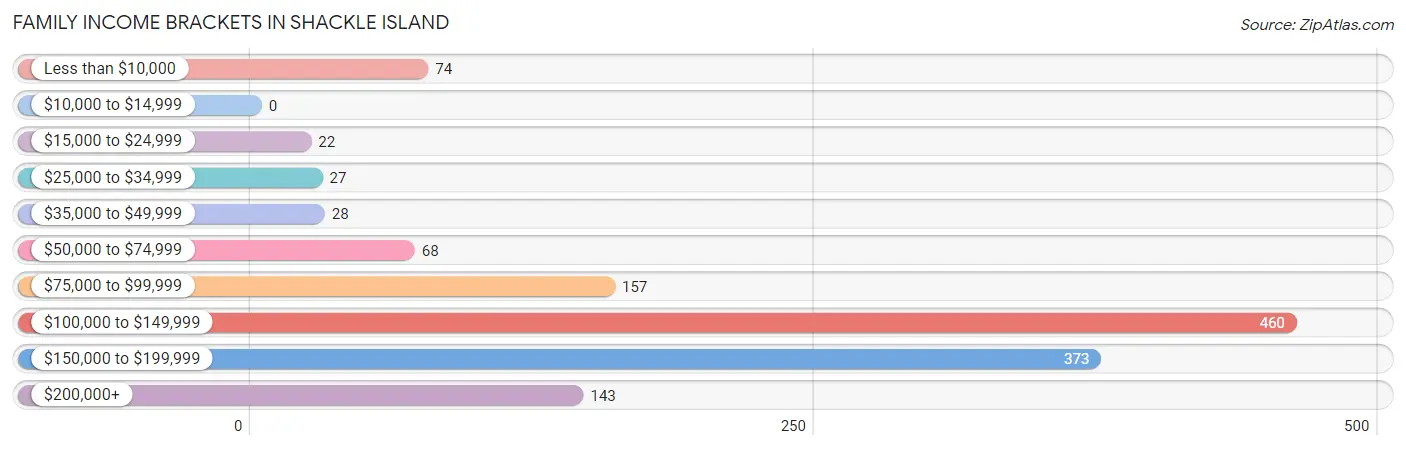
| Income Bracket | # Families | % Families |
| Less than $10,000 | 74 | 5.5% |
| $10,000 to $14,999 | 0 | 0.0% |
| $15,000 to $24,999 | 22 | 1.6% |
| $25,000 to $34,999 | 27 | 2.0% |
| $35,000 to $49,999 | 28 | 2.1% |
| $50,000 to $74,999 | 68 | 5.0% |
| $75,000 to $99,999 | 157 | 11.6% |
| $100,000 to $149,999 | 460 | 34.1% |
| $150,000 to $199,999 | 373 | 27.6% |
| $200,000+ | 143 | 10.6% |
Family Income by Famaliy Size in Shackle Island
5-person families (32 | 2.4%) account for the highest median family income in Shackle Island with $157,250 per family, while 2-person families (636 | 47.1%) have the highest median income of $53,032 per family member.
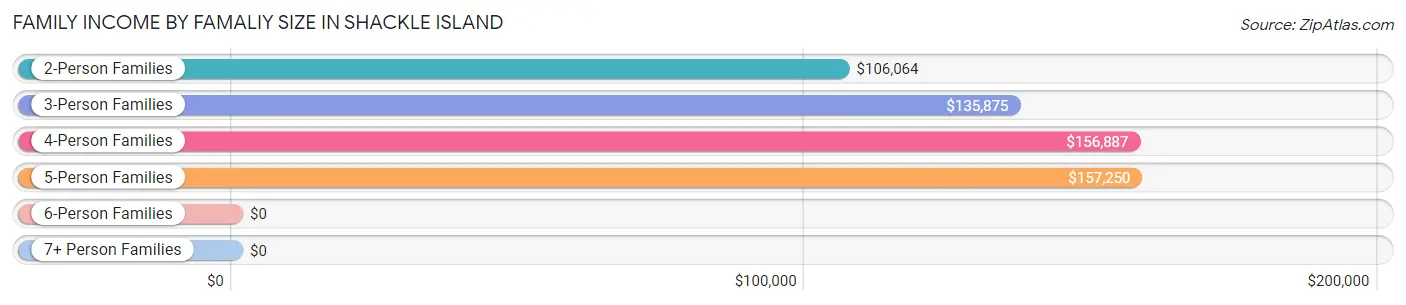
| Income Bracket | # Families | Median Income |
| 2-Person Families | 636 (47.1%) | $106,064 |
| 3-Person Families | 343 (25.4%) | $135,875 |
| 4-Person Families | 316 (23.4%) | $156,887 |
| 5-Person Families | 32 (2.4%) | $157,250 |
| 6-Person Families | 23 (1.7%) | $0 |
| 7+ Person Families | 0 (0.0%) | $0 |
| Total | 1,350 (100.0%) | $126,071 |
Family Income by Number of Earners in Shackle Island
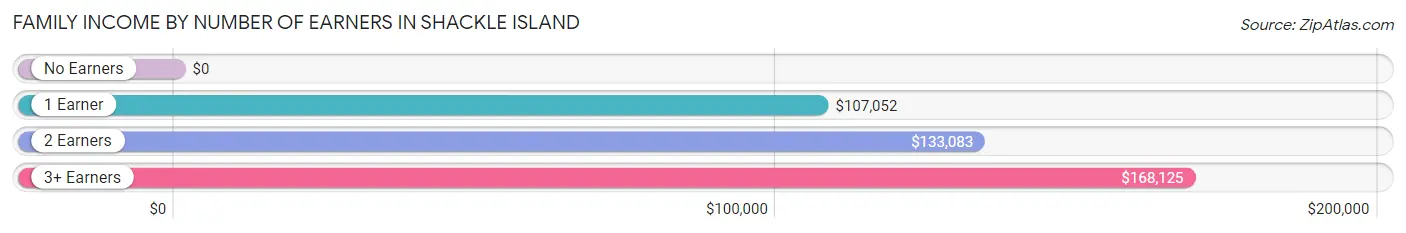
| Number of Earners | # Families | Median Income |
| No Earners | 140 (10.4%) | $0 |
| 1 Earner | 231 (17.1%) | $107,052 |
| 2 Earners | 787 (58.3%) | $133,083 |
| 3+ Earners | 192 (14.2%) | $168,125 |
| Total | 1,350 (100.0%) | $126,071 |
Household Income in Shackle Island
Household Income Brackets in Shackle Island
With 452 households falling in the category, the $100,000 to $149,999 income range is the most frequent in Shackle Island, accounting for 29.6% of all households. In contrast, only 24 households (1.6%) fall into the less than $10,000 income bracket, making it the least populous group.
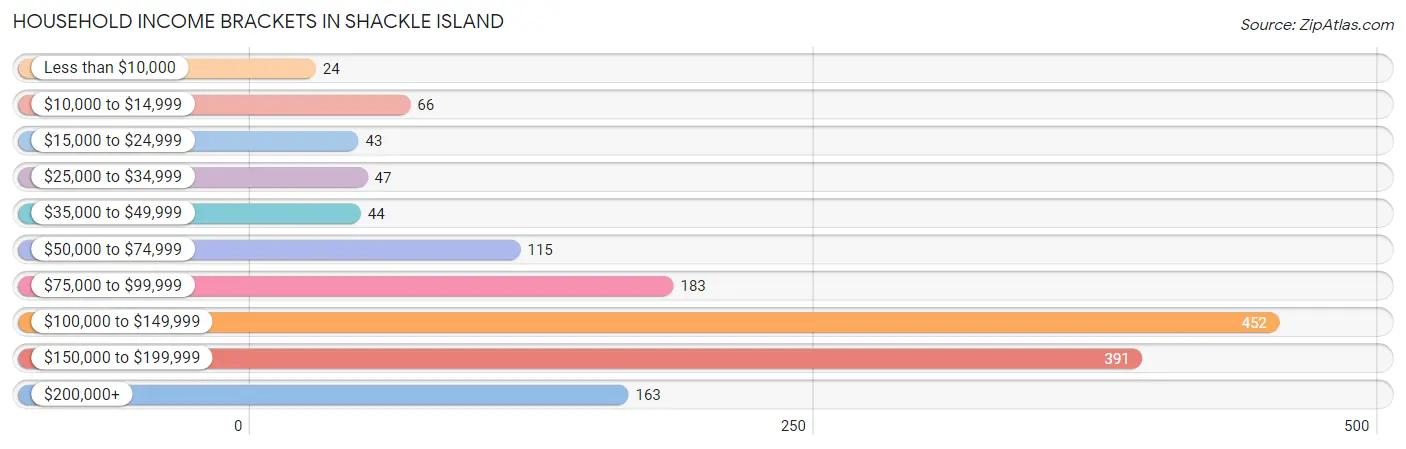
| Income Bracket | # Households | % Households |
| Less than $10,000 | 24 | 1.6% |
| $10,000 to $14,999 | 66 | 4.3% |
| $15,000 to $24,999 | 43 | 2.8% |
| $25,000 to $34,999 | 47 | 3.1% |
| $35,000 to $49,999 | 44 | 2.9% |
| $50,000 to $74,999 | 115 | 7.5% |
| $75,000 to $99,999 | 183 | 12.0% |
| $100,000 to $149,999 | 452 | 29.6% |
| $150,000 to $199,999 | 391 | 25.6% |
| $200,000+ | 163 | 10.7% |
Household Income by Householder Age in Shackle Island
The median household income in Shackle Island is $110,944, with the highest median household income of $135,625 found in the 25 to 44 years age bracket for the primary householder. A total of 436 households (28.5%) fall into this category.
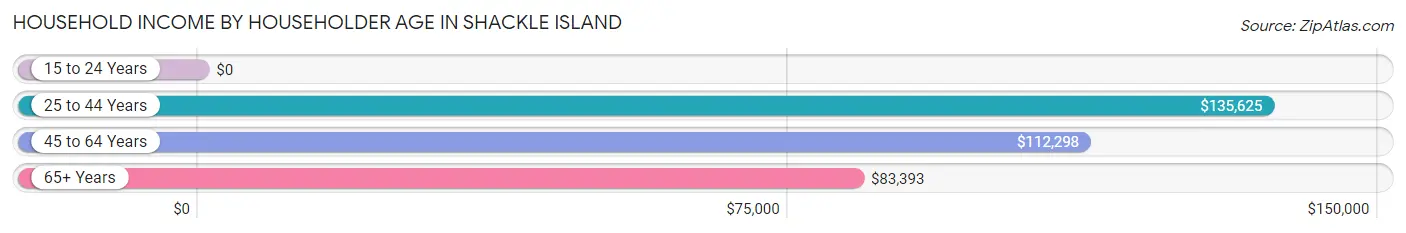
| Income Bracket | # Households | Median Income |
| 15 to 24 Years | 0 (0.0%) | $0 |
| 25 to 44 Years | 436 (28.5%) | $135,625 |
| 45 to 64 Years | 783 (51.2%) | $112,298 |
| 65+ Years | 309 (20.2%) | $83,393 |
| Total | 1,528 (100.0%) | $110,944 |
Poverty in Shackle Island
Income Below Poverty by Sex and Age in Shackle Island
With 8.9% poverty level for males and 7.1% for females among the residents of Shackle Island, 15 year old males and 65 to 74 year old females are the most vulnerable to poverty, with 15 males (68.2%) and 31 females (23.8%) in their respective age groups living below the poverty level.
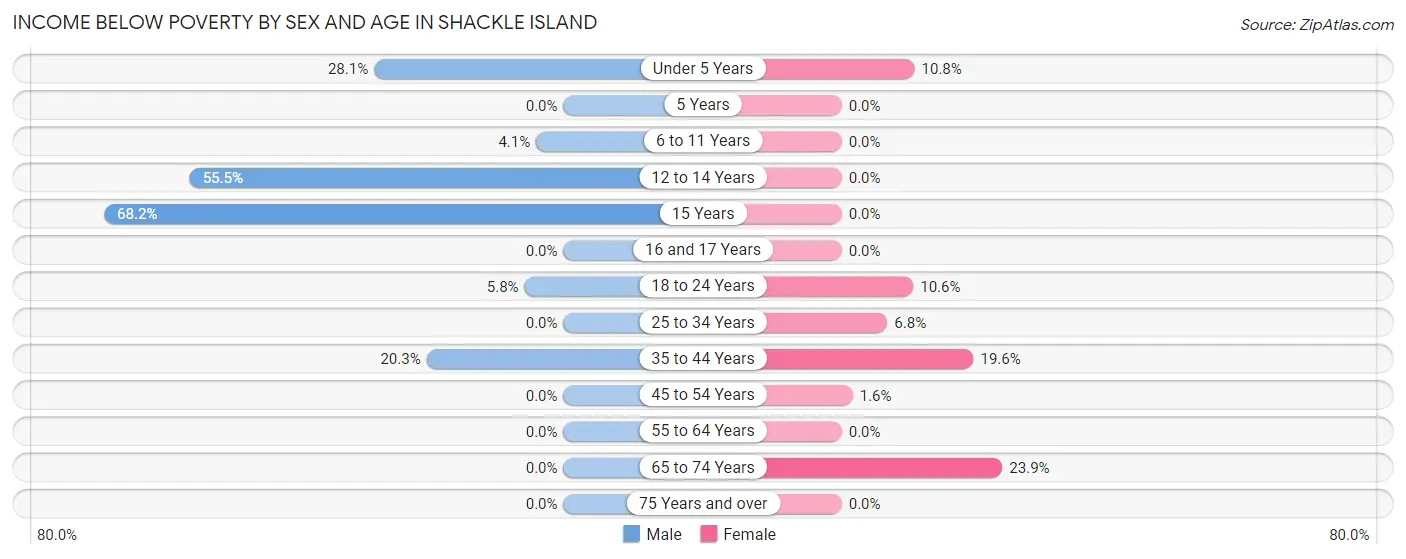
| Age Bracket | Male | Female |
| Under 5 Years | 9 (28.1%) | 8 (10.8%) |
| 5 Years | 0 (0.0%) | 0 (0.0%) |
| 6 to 11 Years | 8 (4.1%) | 0 (0.0%) |
| 12 to 14 Years | 71 (55.5%) | 0 (0.0%) |
| 15 Years | 15 (68.2%) | 0 (0.0%) |
| 16 and 17 Years | 0 (0.0%) | 0 (0.0%) |
| 18 to 24 Years | 10 (5.8%) | 12 (10.6%) |
| 25 to 34 Years | 0 (0.0%) | 9 (6.8%) |
| 35 to 44 Years | 77 (20.3%) | 81 (19.6%) |
| 45 to 54 Years | 0 (0.0%) | 10 (1.6%) |
| 55 to 64 Years | 0 (0.0%) | 0 (0.0%) |
| 65 to 74 Years | 0 (0.0%) | 31 (23.8%) |
| 75 Years and over | 0 (0.0%) | 0 (0.0%) |
| Total | 190 (8.9%) | 151 (7.1%) |
Income Above Poverty by Sex and Age in Shackle Island
According to the poverty statistics in Shackle Island, males aged 5 years and females aged 5 years are the age groups that are most secure financially, with 100.0% of males and 100.0% of females in these age groups living above the poverty line.
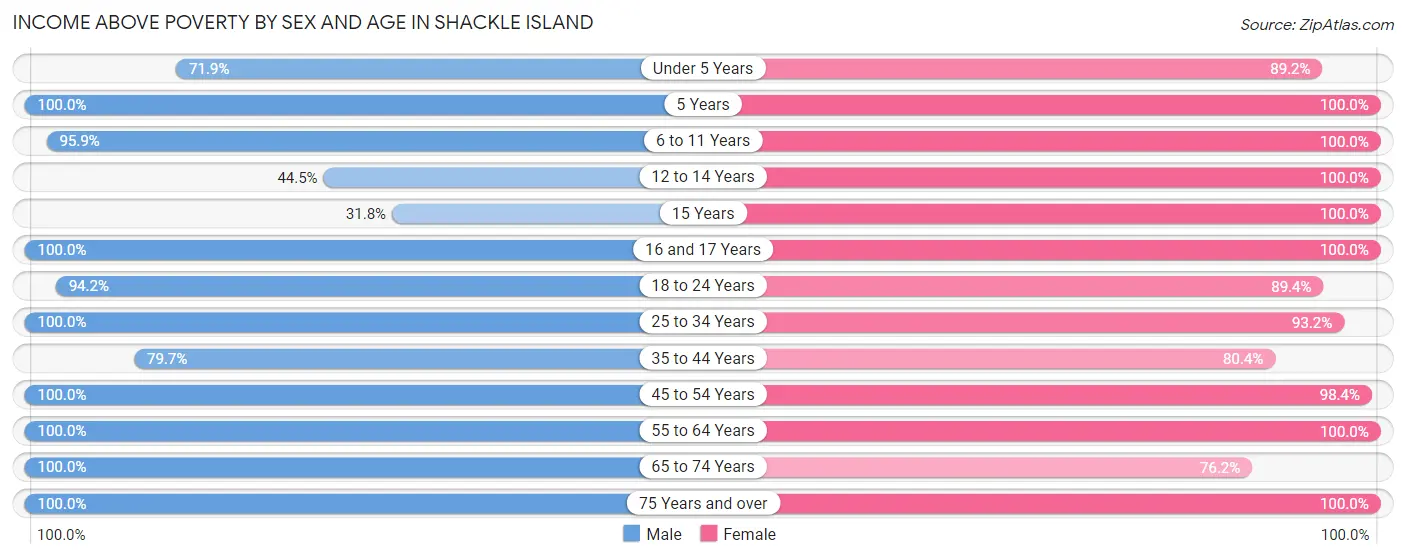
| Age Bracket | Male | Female |
| Under 5 Years | 23 (71.9%) | 66 (89.2%) |
| 5 Years | 14 (100.0%) | 78 (100.0%) |
| 6 to 11 Years | 189 (95.9%) | 63 (100.0%) |
| 12 to 14 Years | 57 (44.5%) | 112 (100.0%) |
| 15 Years | 7 (31.8%) | 28 (100.0%) |
| 16 and 17 Years | 67 (100.0%) | 20 (100.0%) |
| 18 to 24 Years | 163 (94.2%) | 101 (89.4%) |
| 25 to 34 Years | 137 (100.0%) | 124 (93.2%) |
| 35 to 44 Years | 302 (79.7%) | 333 (80.4%) |
| 45 to 54 Years | 448 (100.0%) | 605 (98.4%) |
| 55 to 64 Years | 291 (100.0%) | 224 (100.0%) |
| 65 to 74 Years | 107 (100.0%) | 99 (76.1%) |
| 75 Years and over | 131 (100.0%) | 131 (100.0%) |
| Total | 1,936 (91.1%) | 1,984 (92.9%) |
Income Below Poverty Among Married-Couple Families in Shackle Island
The poverty statistics for married-couple families in Shackle Island show that 1.4% or 16 of the total 1,161 families live below the poverty line. Families with 1 or 2 children have the highest poverty rate of 4.1%, comprising of 16 families. On the other hand, families with no children have the lowest poverty rate of 0.0%, which includes 0 families.
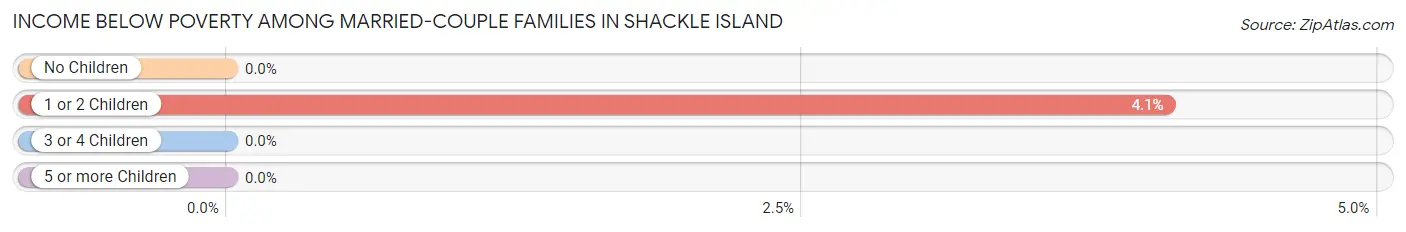
| Children | Above Poverty | Below Poverty |
| No Children | 728 (100.0%) | 0 (0.0%) |
| 1 or 2 Children | 376 (95.9%) | 16 (4.1%) |
| 3 or 4 Children | 41 (100.0%) | 0 (0.0%) |
| 5 or more Children | 0 (0.0%) | 0 (0.0%) |
| Total | 1,145 (98.6%) | 16 (1.4%) |
Income Below Poverty Among Single-Parent Households in Shackle Island
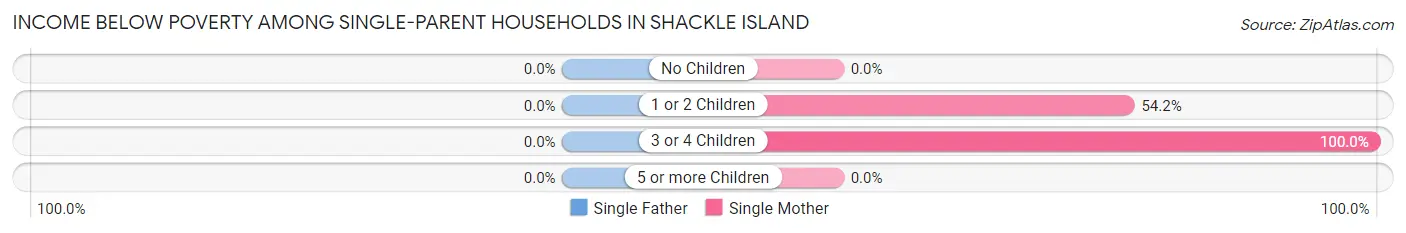
| Children | Single Father | Single Mother |
| No Children | 0 (0.0%) | 0 (0.0%) |
| 1 or 2 Children | 0 (0.0%) | 65 (54.2%) |
| 3 or 4 Children | 0 (0.0%) | 9 (100.0%) |
| 5 or more Children | 0 (0.0%) | 0 (0.0%) |
| Total | 0 (0.0%) | 74 (52.1%) |
Income Below Poverty Among Married-Couple vs Single-Parent Households in Shackle Island
The poverty data for Shackle Island shows that 16 of the married-couple family households (1.4%) and 74 of the single-parent households (39.2%) are living below the poverty level. Within the married-couple family households, those with 1 or 2 children have the highest poverty rate, with 16 households (4.1%) falling below the poverty line. Among the single-parent households, those with 3 or 4 children have the highest poverty rate, with 9 household (100.0%) living below poverty.
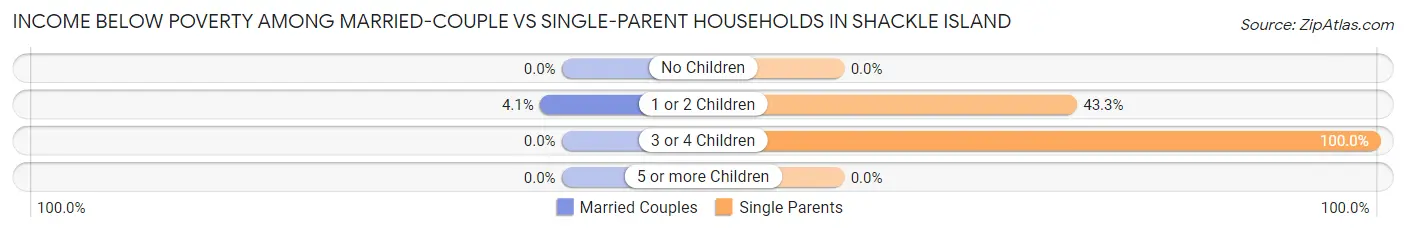
| Children | Married-Couple Families | Single-Parent Households |
| No Children | 0 (0.0%) | 0 (0.0%) |
| 1 or 2 Children | 16 (4.1%) | 65 (43.3%) |
| 3 or 4 Children | 0 (0.0%) | 9 (100.0%) |
| 5 or more Children | 0 (0.0%) | 0 (0.0%) |
| Total | 16 (1.4%) | 74 (39.2%) |
Race in Shackle Island
The most populous races in Shackle Island are White / Caucasian (3,937 | 90.0%), Black / African American (280 | 6.4%), and Hispanic or Latino (162 | 3.7%).
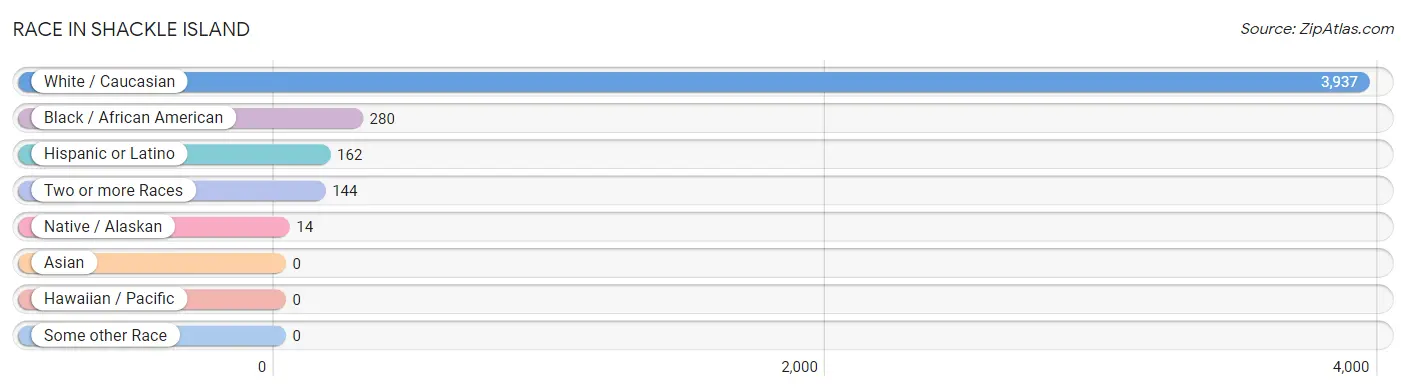
| Race | # Population | % Population |
| Asian | 0 | 0.0% |
| Black / African American | 280 | 6.4% |
| Hawaiian / Pacific | 0 | 0.0% |
| Hispanic or Latino | 162 | 3.7% |
| Native / Alaskan | 14 | 0.3% |
| White / Caucasian | 3,937 | 90.0% |
| Two or more Races | 144 | 3.3% |
| Some other Race | 0 | 0.0% |
| Total | 4,375 | 100.0% |
Ancestry in Shackle Island
The most populous ancestries reported in Shackle Island are American (943 | 21.5%), English (941 | 21.5%), Irish (516 | 11.8%), German (407 | 9.3%), and Scotch-Irish (143 | 3.3%), together accounting for 67.4% of all Shackle Island residents.
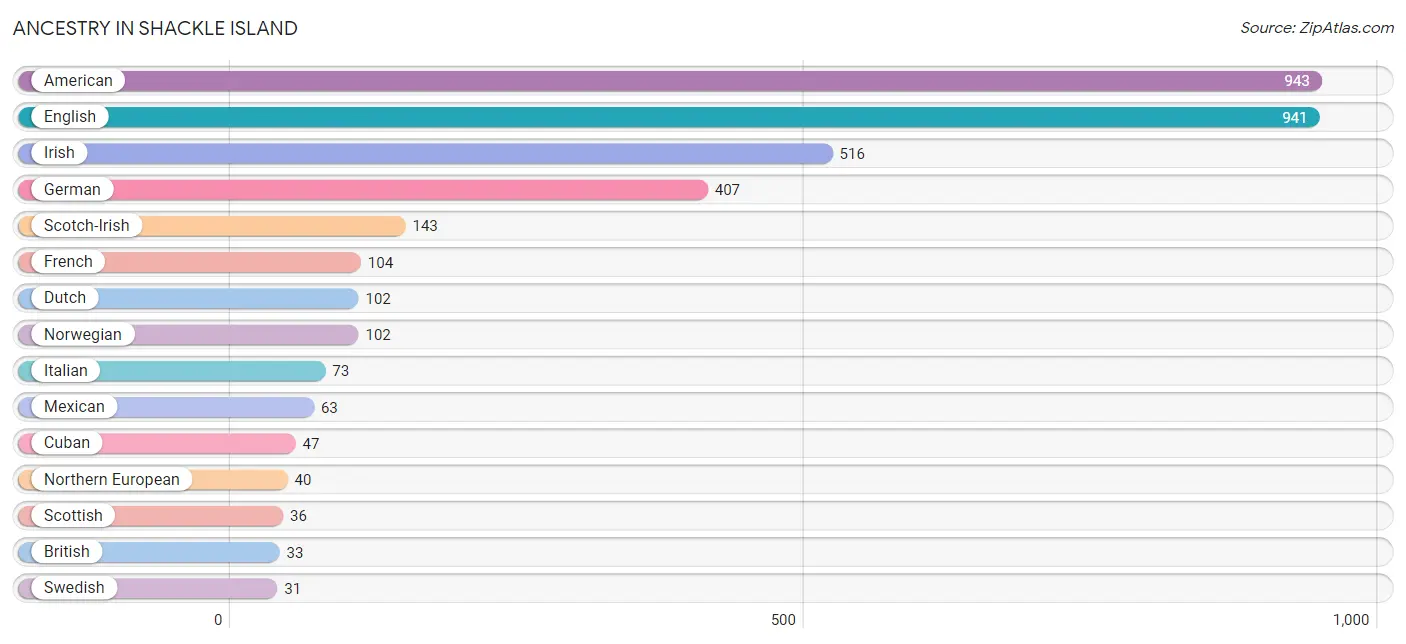
| Ancestry | # Population | % Population |
| American | 943 | 21.5% |
| Arab | 12 | 0.3% |
| British | 33 | 0.7% |
| Burmese | 17 | 0.4% |
| Canadian | 9 | 0.2% |
| Central American | 3 | 0.1% |
| Central American Indian | 11 | 0.3% |
| Cherokee | 21 | 0.5% |
| Chilean | 3 | 0.1% |
| Colombian | 5 | 0.1% |
| Croatian | 15 | 0.3% |
| Cuban | 47 | 1.1% |
| Danish | 11 | 0.3% |
| Dutch | 102 | 2.3% |
| Eastern European | 28 | 0.6% |
| English | 941 | 21.5% |
| European | 21 | 0.5% |
| French | 104 | 2.4% |
| French Canadian | 8 | 0.2% |
| German | 407 | 9.3% |
| Greek | 15 | 0.3% |
| Irish | 516 | 11.8% |
| Italian | 73 | 1.7% |
| Lebanese | 12 | 0.3% |
| Mexican | 63 | 1.4% |
| Northern European | 40 | 0.9% |
| Norwegian | 102 | 2.3% |
| Puerto Rican | 16 | 0.4% |
| Russian | 8 | 0.2% |
| Salvadoran | 3 | 0.1% |
| Scandinavian | 10 | 0.2% |
| Scotch-Irish | 143 | 3.3% |
| Scottish | 36 | 0.8% |
| South American | 8 | 0.2% |
| Spanish | 25 | 0.6% |
| Swedish | 31 | 0.7% |
| Swiss | 24 | 0.5% |
| Ukrainian | 28 | 0.6% |
| Welsh | 4 | 0.1% | View All 39 Rows |
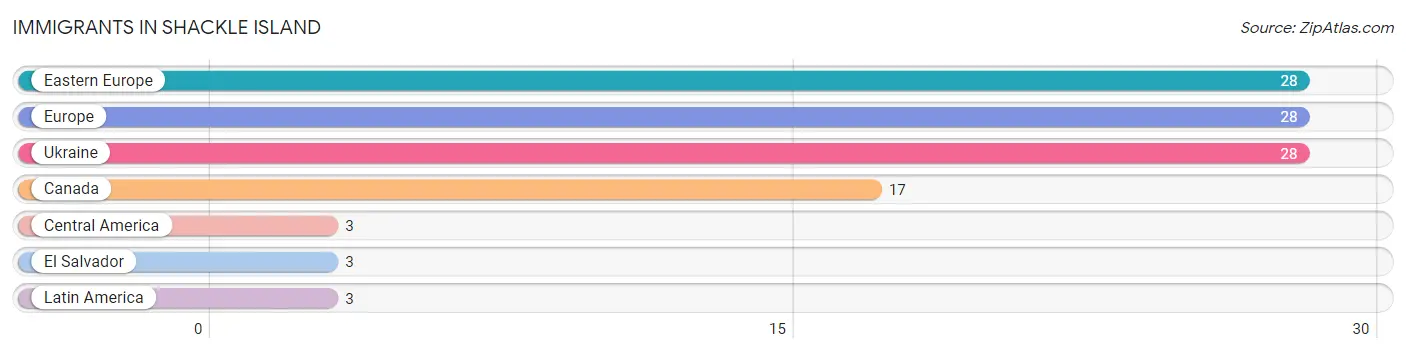
Immigrants in Shackle Island
The most numerous immigrant groups reported in Shackle Island came from Eastern Europe (28 | 0.6%), Europe (28 | 0.6%), Ukraine (28 | 0.6%), Canada (17 | 0.4%), and Central America (3 | 0.1%), together accounting for 2.4% of all Shackle Island residents.
| Immigration Origin | # Population | % Population |
| Canada | 17 | 0.4% |
| Central America | 3 | 0.1% |
| Eastern Europe | 28 | 0.6% |
| El Salvador | 3 | 0.1% |
| Europe | 28 | 0.6% |
| Latin America | 3 | 0.1% |
| Ukraine | 28 | 0.6% | View All 7 Rows |
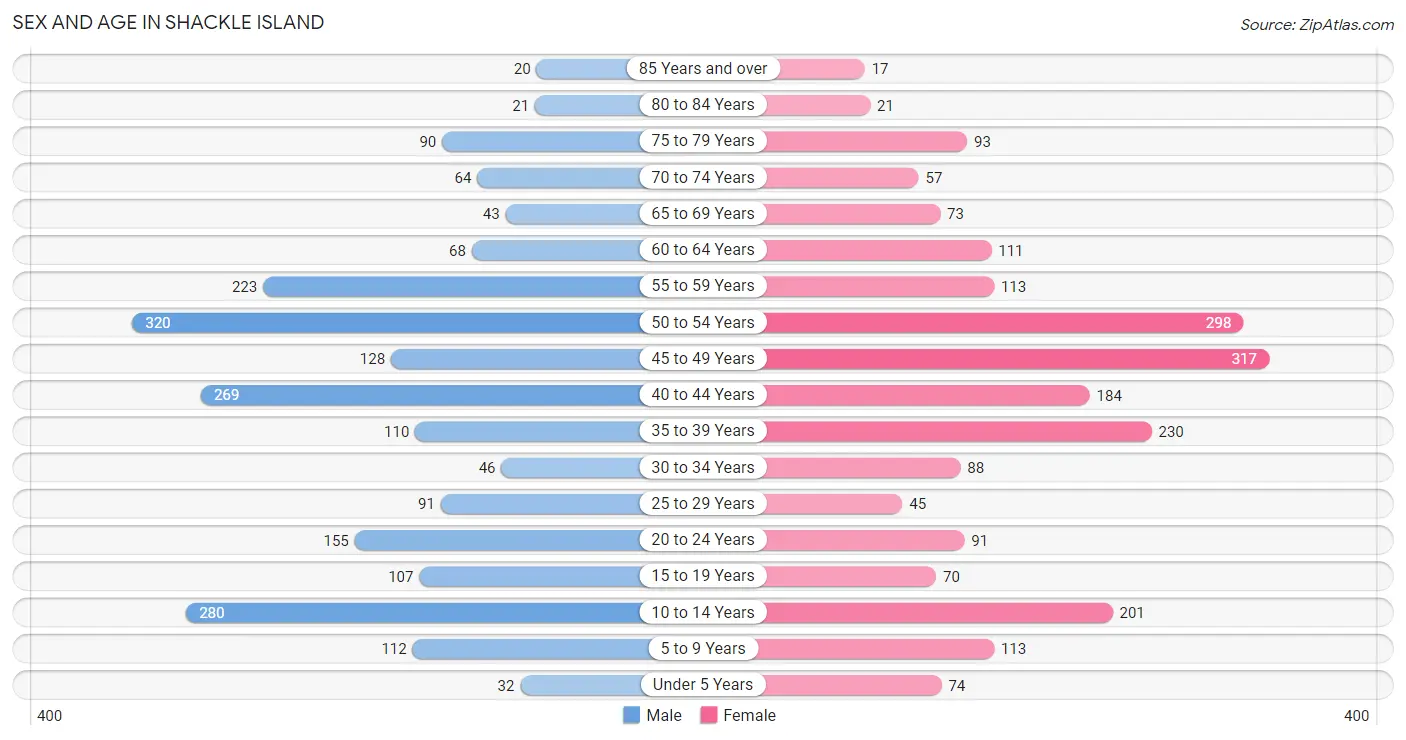
Sex and Age in Shackle Island
Sex and Age in Shackle Island
The most populous age groups in Shackle Island are 50 to 54 Years (320 | 14.7%) for men and 45 to 49 Years (317 | 14.4%) for women.
| Age Bracket | Male | Female |
| Under 5 Years | 32 (1.5%) | 74 (3.4%) |
| 5 to 9 Years | 112 (5.1%) | 113 (5.1%) |
| 10 to 14 Years | 280 (12.9%) | 201 (9.1%) |
| 15 to 19 Years | 107 (4.9%) | 70 (3.2%) |
| 20 to 24 Years | 155 (7.1%) | 91 (4.1%) |
| 25 to 29 Years | 91 (4.2%) | 45 (2.1%) |
| 30 to 34 Years | 46 (2.1%) | 88 (4.0%) |
| 35 to 39 Years | 110 (5.1%) | 230 (10.5%) |
| 40 to 44 Years | 269 (12.3%) | 184 (8.4%) |
| 45 to 49 Years | 128 (5.9%) | 317 (14.4%) |
| 50 to 54 Years | 320 (14.7%) | 298 (13.6%) |
| 55 to 59 Years | 223 (10.2%) | 113 (5.1%) |
| 60 to 64 Years | 68 (3.1%) | 111 (5.1%) |
| 65 to 69 Years | 43 (2.0%) | 73 (3.3%) |
| 70 to 74 Years | 64 (2.9%) | 57 (2.6%) |
| 75 to 79 Years | 90 (4.1%) | 93 (4.2%) |
| 80 to 84 Years | 21 (1.0%) | 21 (1.0%) |
| 85 Years and over | 20 (0.9%) | 17 (0.8%) |
| Total | 2,179 (100.0%) | 2,196 (100.0%) |
Families and Households in Shackle Island
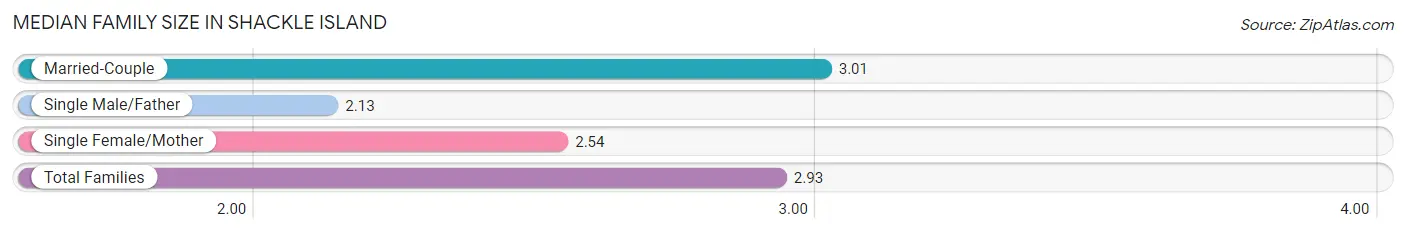
Median Family Size in Shackle Island
The median family size in Shackle Island is 2.93 persons per family, with married-couple families (1,161 | 86.0%) accounting for the largest median family size of 3.01 persons per family. On the other hand, single male/father families (47 | 3.5%) represent the smallest median family size with 2.13 persons per family.
| Family Type | # Families | Family Size |
| Married-Couple | 1,161 (86.0%) | 3.01 |
| Single Male/Father | 47 (3.5%) | 2.13 |
| Single Female/Mother | 142 (10.5%) | 2.54 |
| Total Families | 1,350 (100.0%) | 2.93 |
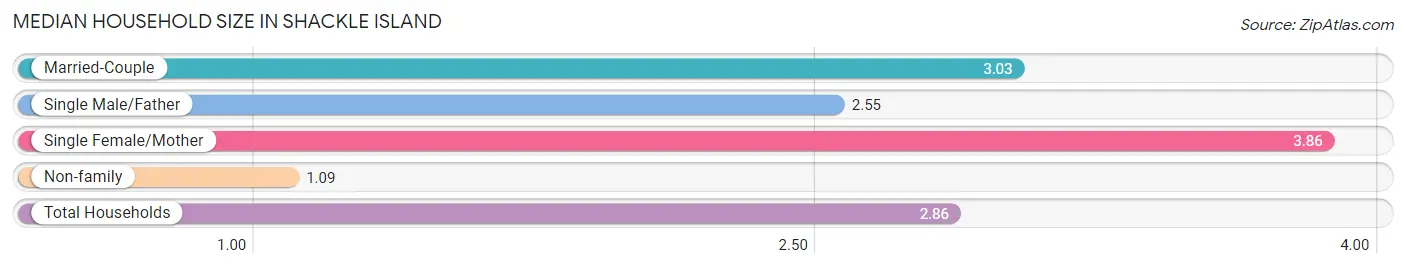
Median Household Size in Shackle Island
The median household size in Shackle Island is 2.86 persons per household, with single female/mother households (142 | 9.3%) accounting for the largest median household size of 3.86 persons per household. non-family households (178 | 11.7%) represent the smallest median household size with 1.09 persons per household.
| Household Type | # Households | Household Size |
| Married-Couple | 1,161 (76.0%) | 3.03 |
| Single Male/Father | 47 (3.1%) | 2.55 |
| Single Female/Mother | 142 (9.3%) | 3.86 |
| Non-family | 178 (11.7%) | 1.09 |
| Total Households | 1,528 (100.0%) | 2.86 |
Household Size by Marriage Status in Shackle Island
Out of a total of 1,528 households in Shackle Island, 1,350 (88.3%) are family households, while 178 (11.7%) are nonfamily households. The most numerous type of family households are 2-person households, comprising 560, and the most common type of nonfamily households are 1-person households, comprising 163.
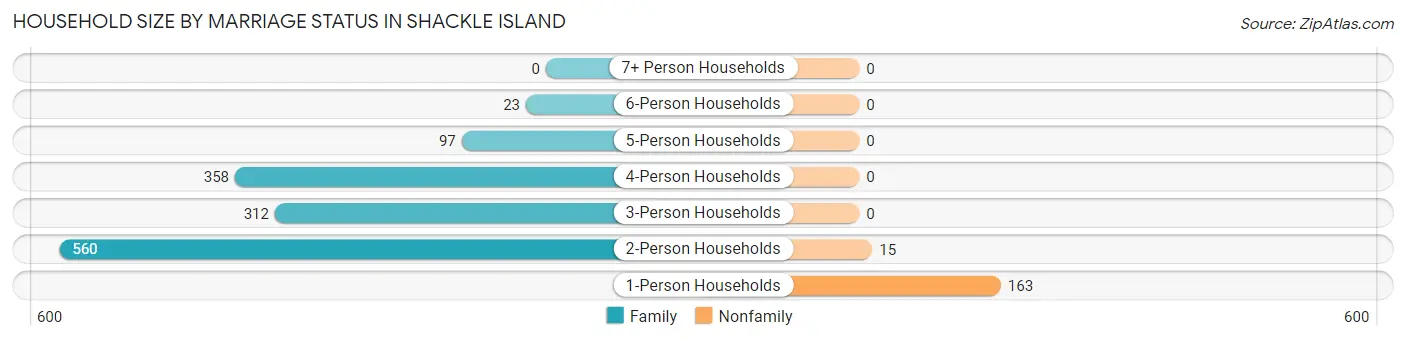
| Household Size | Family Households | Nonfamily Households |
| 1-Person Households | - | 163 (10.7%) |
| 2-Person Households | 560 (36.6%) | 15 (1.0%) |
| 3-Person Households | 312 (20.4%) | 0 (0.0%) |
| 4-Person Households | 358 (23.4%) | 0 (0.0%) |
| 5-Person Households | 97 (6.4%) | 0 (0.0%) |
| 6-Person Households | 23 (1.5%) | 0 (0.0%) |
| 7+ Person Households | 0 (0.0%) | 0 (0.0%) |
| Total | 1,350 (88.3%) | 178 (11.7%) |
Female Fertility in Shackle Island
Fertility by Age in Shackle Island
| Age Bracket | Women with Births | Births / 1,000 Women |
| 15 to 19 years | 0 (0.0%) | 0.0 |
| 20 to 34 years | 0 (0.0%) | 0.0 |
| 35 to 50 years | 0 (0.0%) | 0.0 |
| Total | 0 (0.0%) | 0.0 |
Fertility by Age by Marriage Status in Shackle Island
| Age Bracket | Married | Unmarried |
| 15 to 19 years | 0 (0.0%) | 0 (0.0%) |
| 20 to 34 years | 0 (0.0%) | 0 (0.0%) |
| 35 to 50 years | 0 (0.0%) | 0 (0.0%) |
| Total | 0 (0.0%) | 0 (0.0%) |
Fertility by Education in Shackle Island
| Educational Attainment | Women with Births | Births / 1,000 Women |
| Less than High School | 0 (0.0%) | 0.0 |
| High School Diploma | 0 (0.0%) | 0.0 |
| College or Associate's Degree | 0 (0.0%) | 0.0 |
| Bachelor's Degree | 0 (0.0%) | 0.0 |
| Graduate Degree | 0 (0.0%) | 0.0 |
| Total | 0 (0.0%) | 0.0 |
Fertility by Education by Marriage Status in Shackle Island

| Educational Attainment | Married | Unmarried |
| Less than High School | 0 (0.0%) | 0 (0.0%) |
| High School Diploma | 0 (0.0%) | 0 (0.0%) |
| College or Associate's Degree | 0 (0.0%) | 0 (0.0%) |
| Bachelor's Degree | 0 (0.0%) | 0 (0.0%) |
| Graduate Degree | 0 (0.0%) | 0 (0.0%) |
| Total | 0 (0.0%) | 0 (0.0%) |
Employment Characteristics in Shackle Island
Employment by Class of Employer in Shackle Island
Among the 2,523 employed individuals in Shackle Island, private company employees (1,755 | 69.6%), not-for-profit organizations (283 | 11.2%), and self-employed (not incorporated) (188 | 7.4%) make up the most common classes of employment.
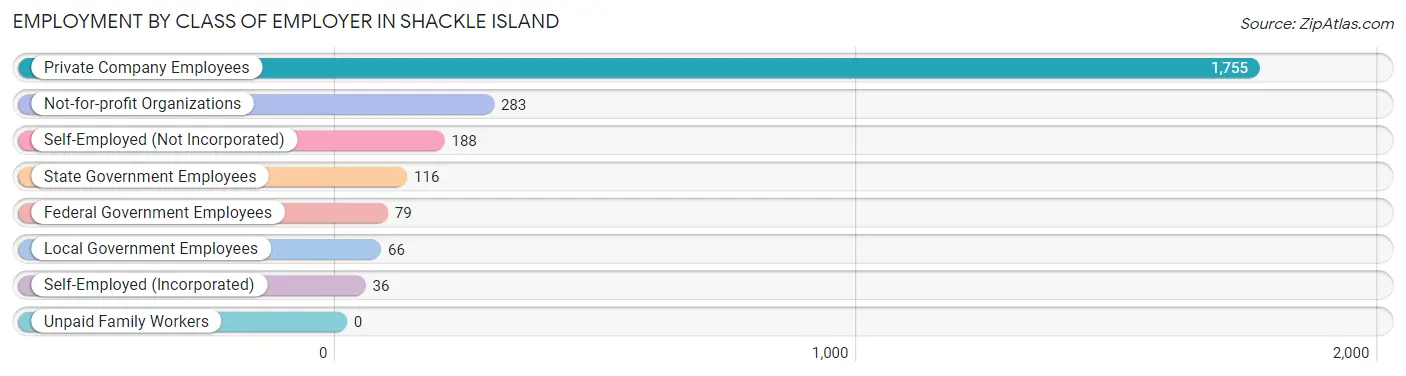
| Employer Class | # Employees | % Employees |
| Private Company Employees | 1,755 | 69.6% |
| Self-Employed (Incorporated) | 36 | 1.4% |
| Self-Employed (Not Incorporated) | 188 | 7.4% |
| Not-for-profit Organizations | 283 | 11.2% |
| Local Government Employees | 66 | 2.6% |
| State Government Employees | 116 | 4.6% |
| Federal Government Employees | 79 | 3.1% |
| Unpaid Family Workers | 0 | 0.0% |
| Total | 2,523 | 100.0% |
Employment Status by Age in Shackle Island
According to the labor force statistics for Shackle Island, out of the total population over 16 years of age (3,513), 76.5% or 2,687 individuals are in the labor force, with 6.1% or 164 of them unemployed. The age group with the highest labor force participation rate is 30 to 34 years, with 100.0% or 134 individuals in the labor force. Within the labor force, the 20 to 24 years age range has the highest percentage of unemployed individuals, with 19.3% or 43 of them being unemployed.
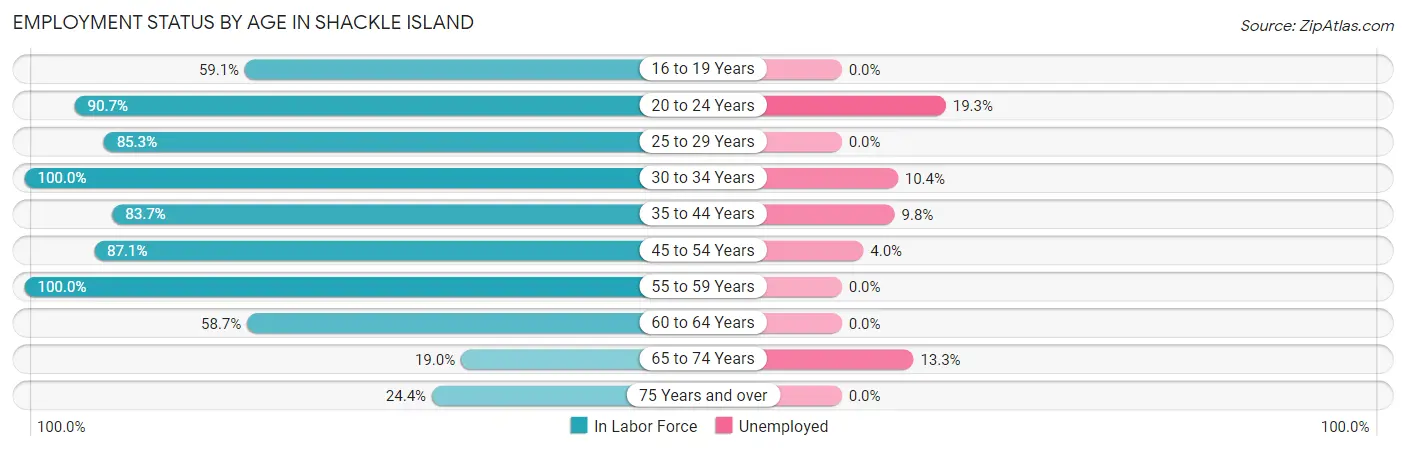
| Age Bracket | In Labor Force | Unemployed |
| 16 to 19 Years | 75 (59.1%) | 0 (0.0%) |
| 20 to 24 Years | 223 (90.7%) | 43 (19.3%) |
| 25 to 29 Years | 116 (85.3%) | 0 (0.0%) |
| 30 to 34 Years | 134 (100.0%) | 14 (10.4%) |
| 35 to 44 Years | 664 (83.7%) | 65 (9.8%) |
| 45 to 54 Years | 926 (87.1%) | 37 (4.0%) |
| 55 to 59 Years | 336 (100.0%) | 0 (0.0%) |
| 60 to 64 Years | 105 (58.7%) | 0 (0.0%) |
| 65 to 74 Years | 45 (19.0%) | 6 (13.3%) |
| 75 Years and over | 64 (24.4%) | 0 (0.0%) |
| Total | 2,687 (76.5%) | 164 (6.1%) |
Employment Status by Educational Attainment in Shackle Island
According to labor force statistics for Shackle Island, 86.4% of individuals (2,282) out of the total population between 25 and 64 years of age (2,641) are in the labor force, with 5.1% or 116 of them being unemployed. The group with the highest labor force participation rate are those with the educational attainment of bachelor's degree or higher, with 95.1% or 890 individuals in the labor force. Within the labor force, individuals with college / associate degree education have the highest percentage of unemployment, with 11.2% or 79 of them being unemployed.
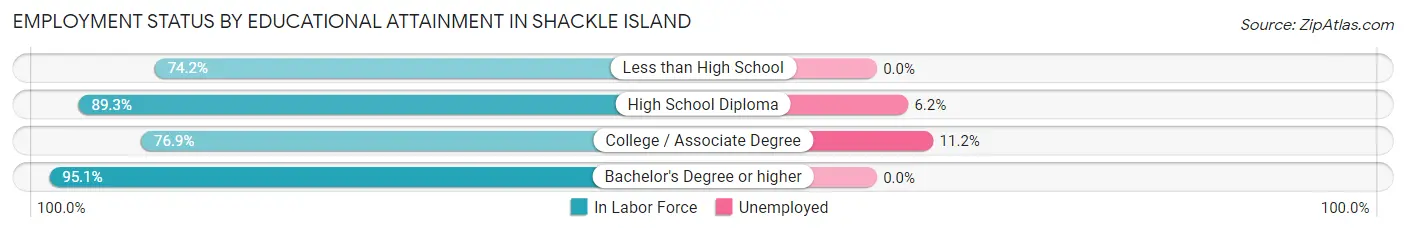
| Educational Attainment | In Labor Force | Unemployed |
| Less than High School | 92 (74.2%) | 0 (0.0%) |
| High School Diploma | 595 (89.3%) | 41 (6.2%) |
| College / Associate Degree | 704 (76.9%) | 102 (11.2%) |
| Bachelor's Degree or higher | 890 (95.1%) | 0 (0.0%) |
| Total | 2,282 (86.4%) | 135 (5.1%) |
Employment Occupations by Sex in Shackle Island
Management, Business, Science and Arts Occupations
The most common Management, Business, Science and Arts occupations in Shackle Island are Community & Social Service (324 | 12.8%), Business & Financial (316 | 12.5%), Management (282 | 11.2%), Health Diagnosing & Treating (248 | 9.8%), and Health Technologists (217 | 8.6%).
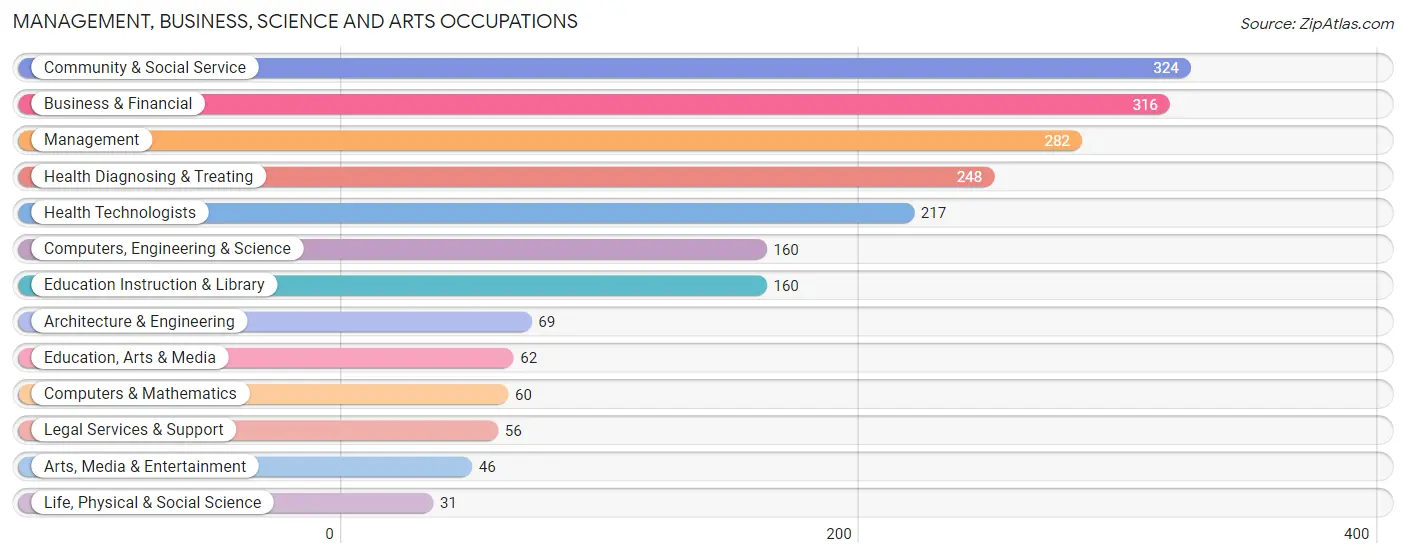
Management, Business, Science and Arts Occupations by Sex
Within the Management, Business, Science and Arts occupations in Shackle Island, the most male-oriented occupations are Architecture & Engineering (100.0%), Arts, Media & Entertainment (100.0%), and Education, Arts & Media (85.5%), while the most female-oriented occupations are Life, Physical & Social Science (100.0%), Health Diagnosing & Treating (63.3%), and Education Instruction & Library (62.5%).
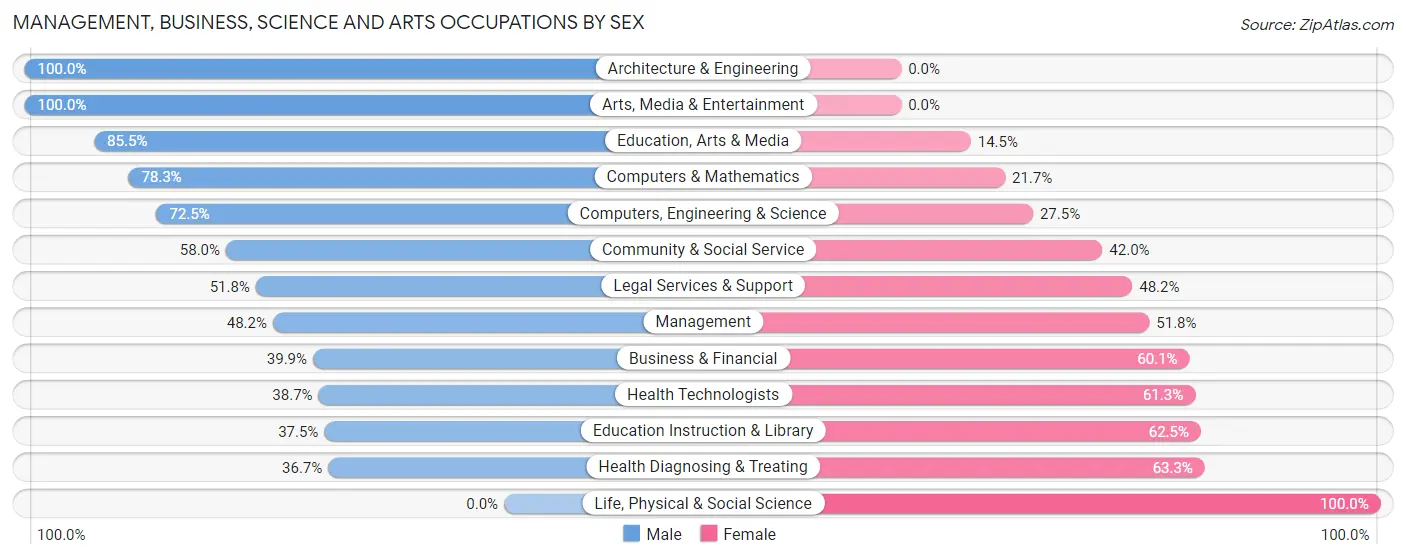
| Occupation | Male | Female |
| Management | 136 (48.2%) | 146 (51.8%) |
| Business & Financial | 126 (39.9%) | 190 (60.1%) |
| Computers, Engineering & Science | 116 (72.5%) | 44 (27.5%) |
| Computers & Mathematics | 47 (78.3%) | 13 (21.7%) |
| Architecture & Engineering | 69 (100.0%) | 0 (0.0%) |
| Life, Physical & Social Science | 0 (0.0%) | 31 (100.0%) |
| Community & Social Service | 188 (58.0%) | 136 (42.0%) |
| Education, Arts & Media | 53 (85.5%) | 9 (14.5%) |
| Legal Services & Support | 29 (51.8%) | 27 (48.2%) |
| Education Instruction & Library | 60 (37.5%) | 100 (62.5%) |
| Arts, Media & Entertainment | 46 (100.0%) | 0 (0.0%) |
| Health Diagnosing & Treating | 91 (36.7%) | 157 (63.3%) |
| Health Technologists | 84 (38.7%) | 133 (61.3%) |
| Total (Category) | 657 (49.4%) | 673 (50.6%) |
| Total (Overall) | 1,240 (49.1%) | 1,283 (50.8%) |
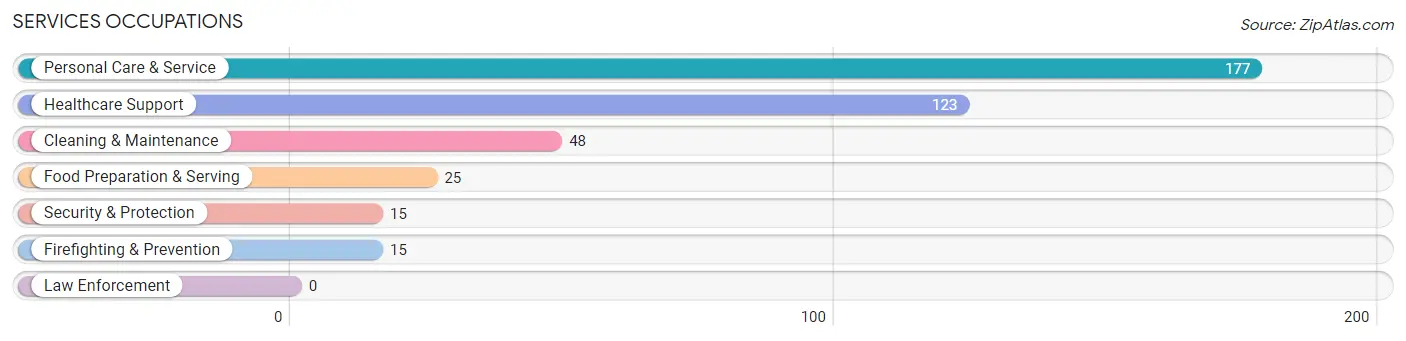
Services Occupations
The most common Services occupations in Shackle Island are Personal Care & Service (177 | 7.0%), Healthcare Support (123 | 4.9%), Cleaning & Maintenance (48 | 1.9%), Food Preparation & Serving (25 | 1.0%), and Security & Protection (15 | 0.6%).
Services Occupations by Sex
Within the Services occupations in Shackle Island, the most male-oriented occupations are Security & Protection (100.0%), Firefighting & Prevention (100.0%), and Food Preparation & Serving (100.0%), while the most female-oriented occupations are Personal Care & Service (100.0%), Healthcare Support (88.6%), and Cleaning & Maintenance (43.8%).
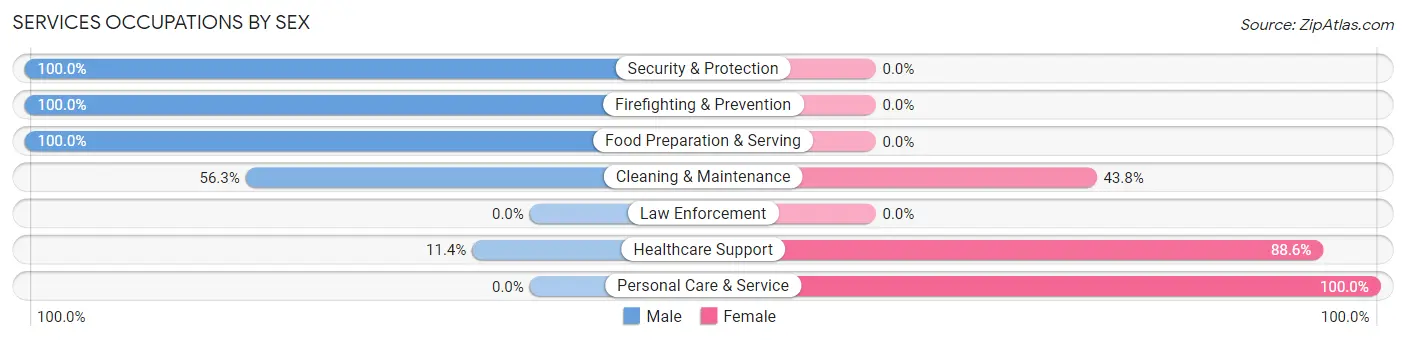
| Occupation | Male | Female |
| Healthcare Support | 14 (11.4%) | 109 (88.6%) |
| Security & Protection | 15 (100.0%) | 0 (0.0%) |
| Firefighting & Prevention | 15 (100.0%) | 0 (0.0%) |
| Law Enforcement | 0 (0.0%) | 0 (0.0%) |
| Food Preparation & Serving | 25 (100.0%) | 0 (0.0%) |
| Cleaning & Maintenance | 27 (56.2%) | 21 (43.8%) |
| Personal Care & Service | 0 (0.0%) | 177 (100.0%) |
| Total (Category) | 81 (20.9%) | 307 (79.1%) |
| Total (Overall) | 1,240 (49.1%) | 1,283 (50.8%) |
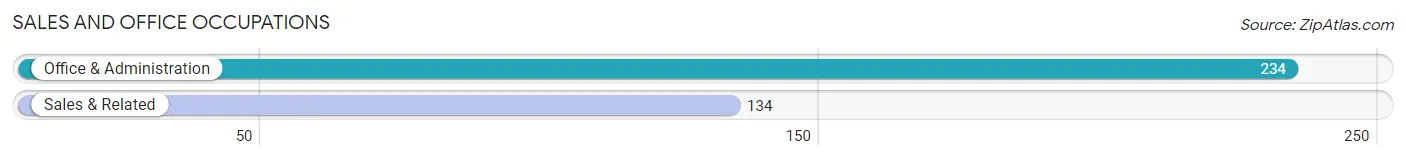
Sales and Office Occupations
The most common Sales and Office occupations in Shackle Island are Office & Administration (234 | 9.3%), and Sales & Related (134 | 5.3%).
Sales and Office Occupations by Sex
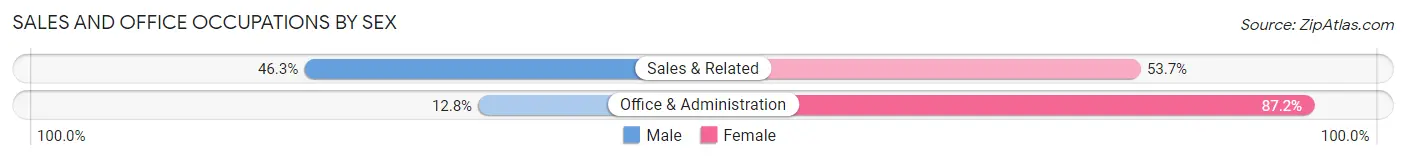
| Occupation | Male | Female |
| Sales & Related | 62 (46.3%) | 72 (53.7%) |
| Office & Administration | 30 (12.8%) | 204 (87.2%) |
| Total (Category) | 92 (25.0%) | 276 (75.0%) |
| Total (Overall) | 1,240 (49.1%) | 1,283 (50.8%) |
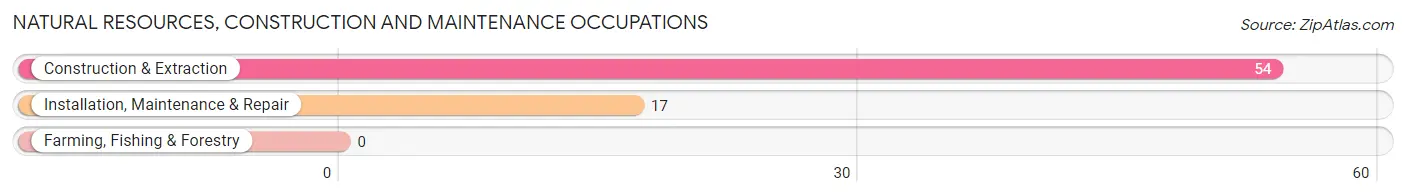
Natural Resources, Construction and Maintenance Occupations
The most common Natural Resources, Construction and Maintenance occupations in Shackle Island are Construction & Extraction (54 | 2.1%), and Installation, Maintenance & Repair (17 | 0.7%).
Natural Resources, Construction and Maintenance Occupations by Sex
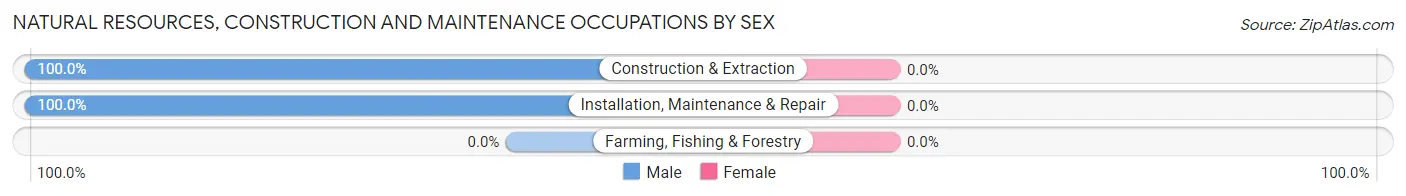
| Occupation | Male | Female |
| Farming, Fishing & Forestry | 0 (0.0%) | 0 (0.0%) |
| Construction & Extraction | 54 (100.0%) | 0 (0.0%) |
| Installation, Maintenance & Repair | 17 (100.0%) | 0 (0.0%) |
| Total (Category) | 71 (100.0%) | 0 (0.0%) |
| Total (Overall) | 1,240 (49.1%) | 1,283 (50.8%) |
Production, Transportation and Moving Occupations
The most common Production, Transportation and Moving occupations in Shackle Island are Production (181 | 7.2%), Material Moving (99 | 3.9%), and Transportation (86 | 3.4%).
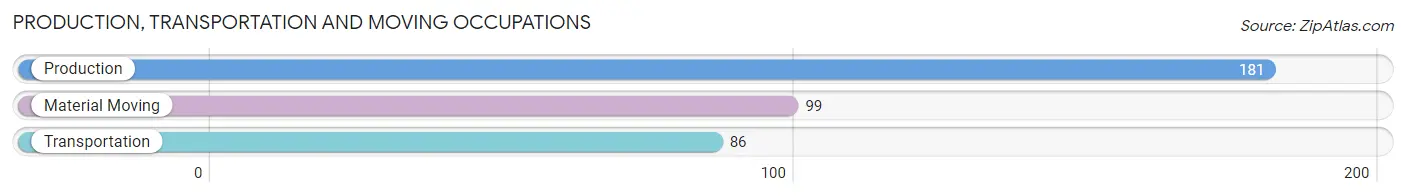
Production, Transportation and Moving Occupations by Sex
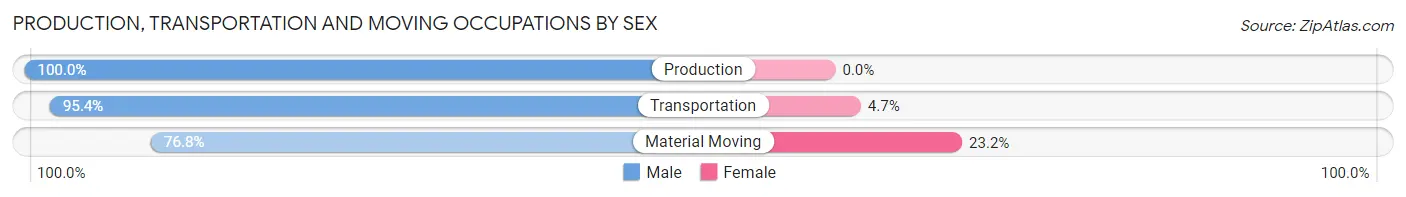
| Occupation | Male | Female |
| Production | 181 (100.0%) | 0 (0.0%) |
| Transportation | 82 (95.4%) | 4 (4.6%) |
| Material Moving | 76 (76.8%) | 23 (23.2%) |
| Total (Category) | 339 (92.6%) | 27 (7.4%) |
| Total (Overall) | 1,240 (49.1%) | 1,283 (50.8%) |
Employment Industries by Sex in Shackle Island
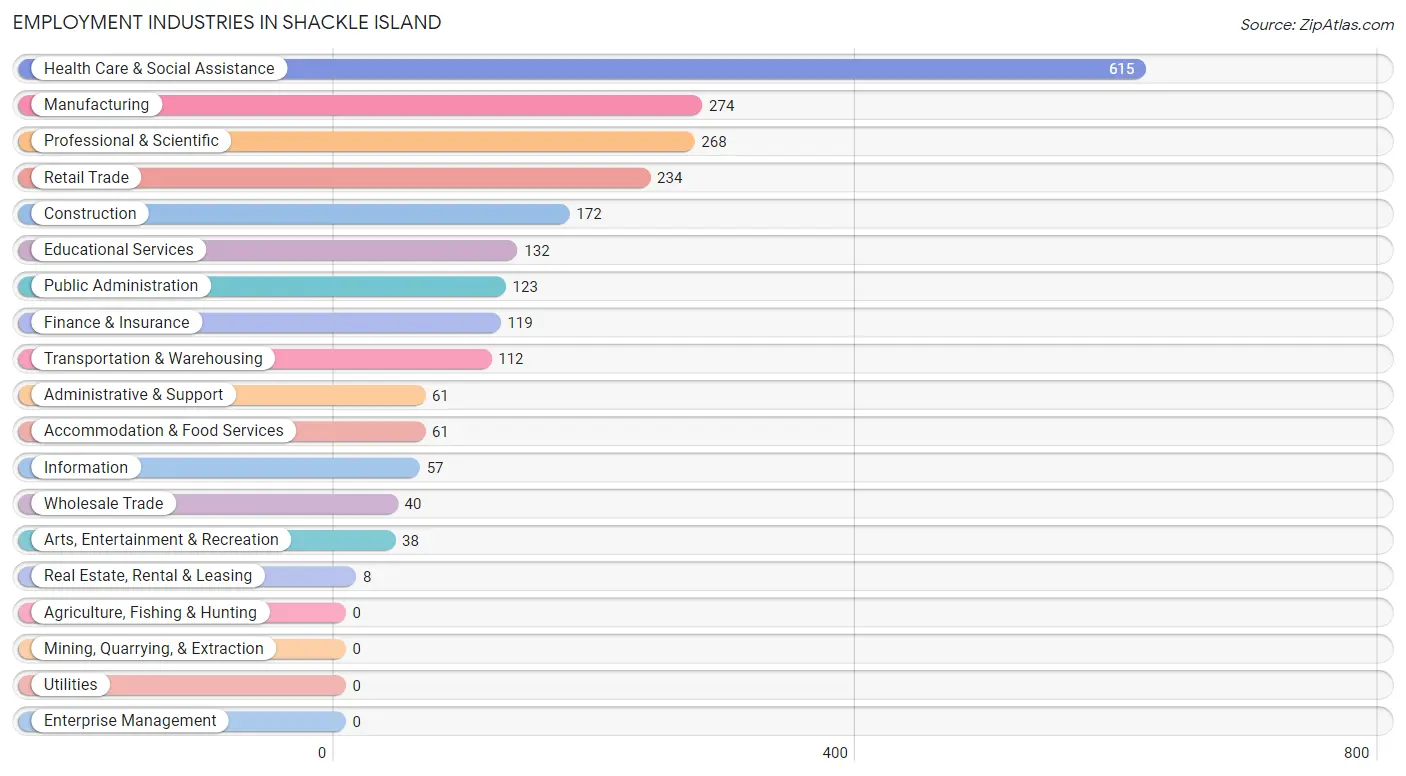
Employment Industries in Shackle Island
The major employment industries in Shackle Island include Health Care & Social Assistance (615 | 24.4%), Manufacturing (274 | 10.9%), Professional & Scientific (268 | 10.6%), Retail Trade (234 | 9.3%), and Construction (172 | 6.8%).
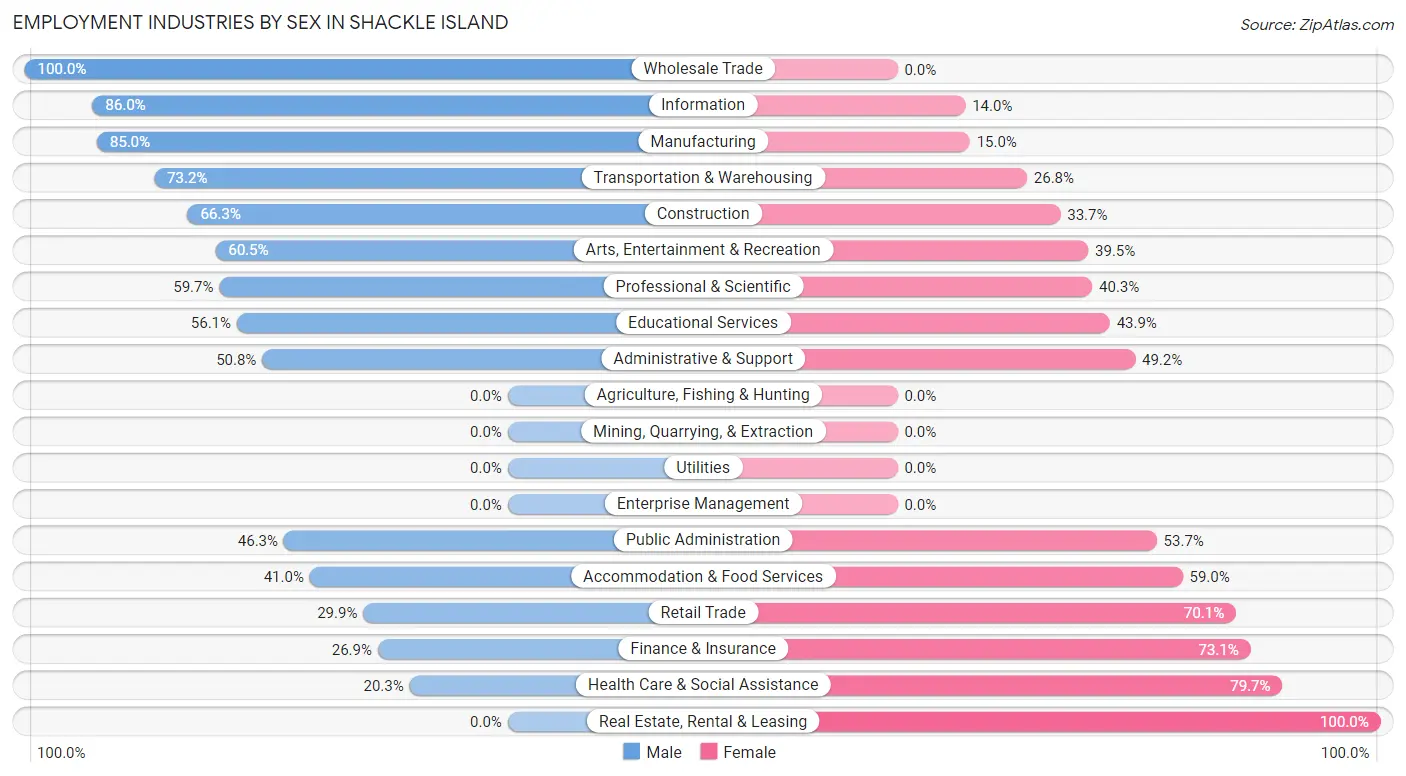
Employment Industries by Sex in Shackle Island
The Shackle Island industries that see more men than women are Wholesale Trade (100.0%), Information (86.0%), and Manufacturing (85.0%), whereas the industries that tend to have a higher number of women are Real Estate, Rental & Leasing (100.0%), Health Care & Social Assistance (79.7%), and Finance & Insurance (73.1%).
| Industry | Male | Female |
| Agriculture, Fishing & Hunting | 0 (0.0%) | 0 (0.0%) |
| Mining, Quarrying, & Extraction | 0 (0.0%) | 0 (0.0%) |
| Construction | 114 (66.3%) | 58 (33.7%) |
| Manufacturing | 233 (85.0%) | 41 (15.0%) |
| Wholesale Trade | 40 (100.0%) | 0 (0.0%) |
| Retail Trade | 70 (29.9%) | 164 (70.1%) |
| Transportation & Warehousing | 82 (73.2%) | 30 (26.8%) |
| Utilities | 0 (0.0%) | 0 (0.0%) |
| Information | 49 (86.0%) | 8 (14.0%) |
| Finance & Insurance | 32 (26.9%) | 87 (73.1%) |
| Real Estate, Rental & Leasing | 0 (0.0%) | 8 (100.0%) |
| Professional & Scientific | 160 (59.7%) | 108 (40.3%) |
| Enterprise Management | 0 (0.0%) | 0 (0.0%) |
| Administrative & Support | 31 (50.8%) | 30 (49.2%) |
| Educational Services | 74 (56.1%) | 58 (43.9%) |
| Health Care & Social Assistance | 125 (20.3%) | 490 (79.7%) |
| Arts, Entertainment & Recreation | 23 (60.5%) | 15 (39.5%) |
| Accommodation & Food Services | 25 (41.0%) | 36 (59.0%) |
| Public Administration | 57 (46.3%) | 66 (53.7%) |
| Total | 1,240 (49.1%) | 1,283 (50.8%) |
Education in Shackle Island
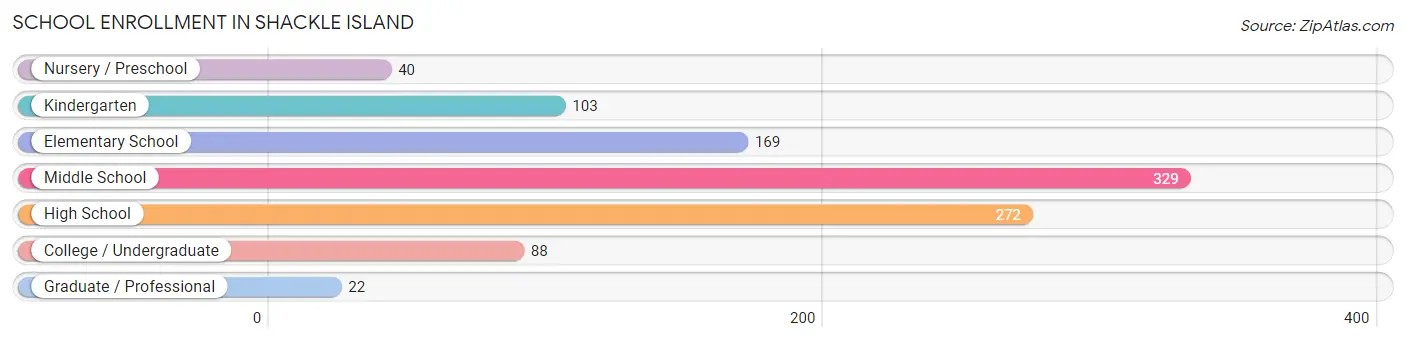
School Enrollment in Shackle Island
The most common levels of schooling among the 1,023 students in Shackle Island are middle school (329 | 32.2%), high school (272 | 26.6%), and elementary school (169 | 16.5%).
| School Level | # Students | % Students |
| Nursery / Preschool | 40 | 3.9% |
| Kindergarten | 103 | 10.1% |
| Elementary School | 169 | 16.5% |
| Middle School | 329 | 32.2% |
| High School | 272 | 26.6% |
| College / Undergraduate | 88 | 8.6% |
| Graduate / Professional | 22 | 2.1% |
| Total | 1,023 | 100.0% |
School Enrollment by Age by Funding Source in Shackle Island
Out of a total of 1,023 students who are enrolled in schools in Shackle Island, 112 (10.9%) attend a private institution, while the remaining 911 (89.1%) are enrolled in public schools. The age group of 3 to 4 year olds has the highest likelihood of being enrolled in private schools, with 14 (58.3% in the age bracket) enrolled. Conversely, the age group of 18 to 19 year olds has the lowest likelihood of being enrolled in a private school, with 40 (100.0% in the age bracket) attending a public institution.

| Age Bracket | Public School | Private School |
| 3 to 4 Year Olds | 10 (41.7%) | 14 (58.3%) |
| 5 to 9 Year Old | 195 (92.4%) | 16 (7.6%) |
| 10 to 14 Year Olds | 454 (94.4%) | 27 (5.6%) |
| 15 to 17 Year Olds | 123 (89.8%) | 14 (10.2%) |
| 18 to 19 Year Olds | 40 (100.0%) | 0 (0.0%) |
| 20 to 24 Year Olds | 70 (68.0%) | 33 (32.0%) |
| 25 to 34 Year Olds | 9 (100.0%) | 0 (0.0%) |
| 35 Years and over | 10 (55.6%) | 8 (44.4%) |
| Total | 911 (89.1%) | 112 (10.9%) |
Educational Attainment by Field of Study in Shackle Island
Business (391 | 32.6%), science & technology (279 | 23.2%), education (180 | 15.0%), psychology (59 | 4.9%), and social sciences (56 | 4.7%) are the most common fields of study among 1,201 individuals in Shackle Island who have obtained a bachelor's degree or higher.
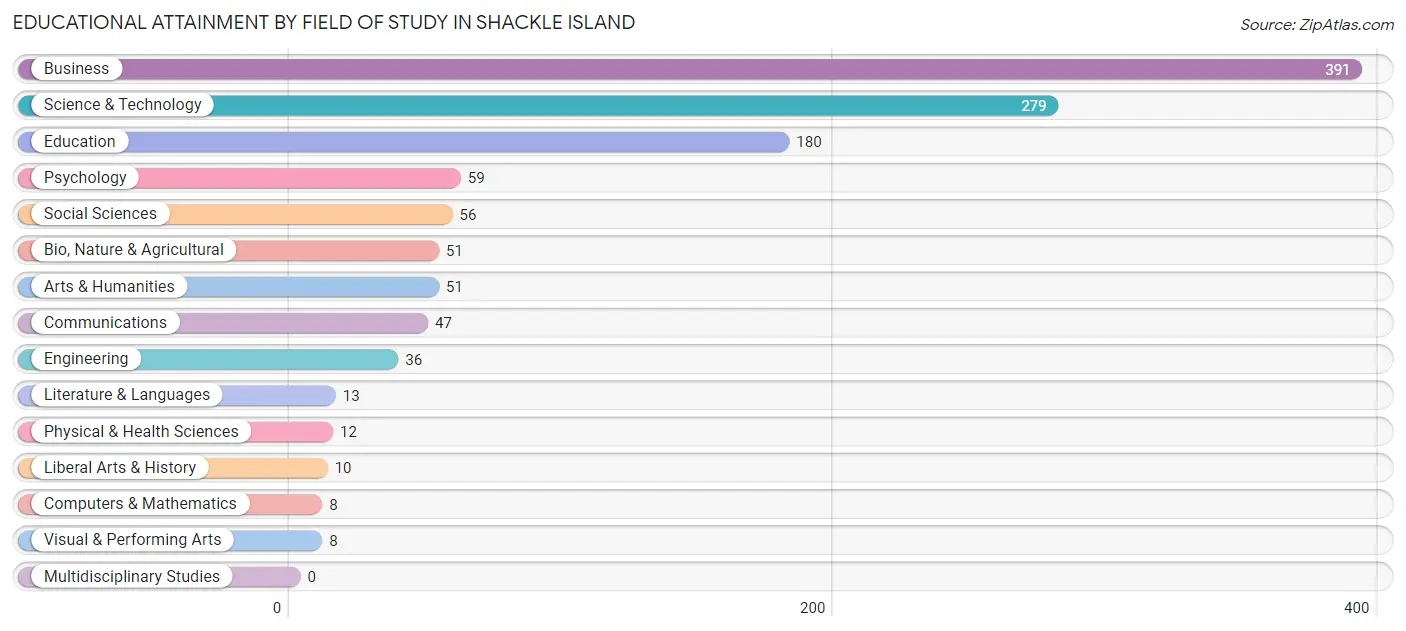
| Field of Study | # Graduates | % Graduates |
| Computers & Mathematics | 8 | 0.7% |
| Bio, Nature & Agricultural | 51 | 4.3% |
| Physical & Health Sciences | 12 | 1.0% |
| Psychology | 59 | 4.9% |
| Social Sciences | 56 | 4.7% |
| Engineering | 36 | 3.0% |
| Multidisciplinary Studies | 0 | 0.0% |
| Science & Technology | 279 | 23.2% |
| Business | 391 | 32.6% |
| Education | 180 | 15.0% |
| Literature & Languages | 13 | 1.1% |
| Liberal Arts & History | 10 | 0.8% |
| Visual & Performing Arts | 8 | 0.7% |
| Communications | 47 | 3.9% |
| Arts & Humanities | 51 | 4.3% |
| Total | 1,201 | 100.0% |
Transportation & Commute in Shackle Island
Vehicle Availability by Sex in Shackle Island
The most prevalent vehicle ownership categories in Shackle Island are males with 3 vehicles (450, accounting for 36.3%) and females with 3 vehicles (521, making up 35.1%).
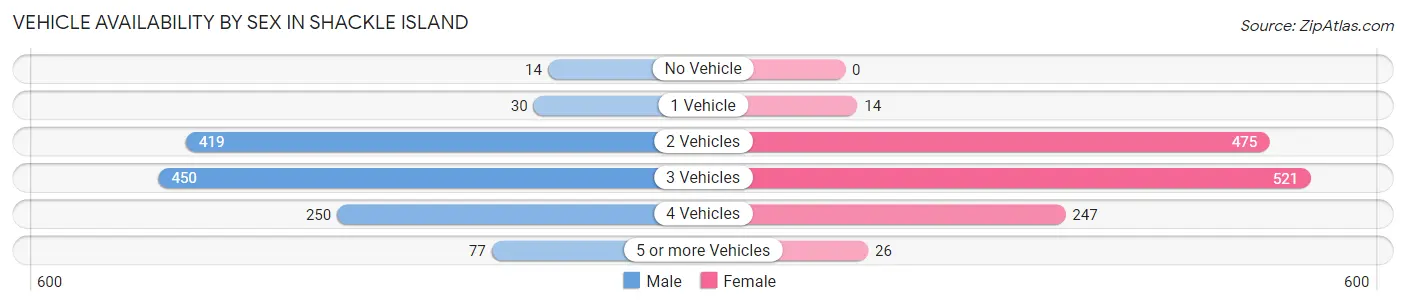
| Vehicles Available | Male | Female |
| No Vehicle | 14 (1.1%) | 0 (0.0%) |
| 1 Vehicle | 30 (2.4%) | 14 (1.1%) |
| 2 Vehicles | 419 (33.8%) | 475 (37.0%) |
| 3 Vehicles | 450 (36.3%) | 521 (40.6%) |
| 4 Vehicles | 250 (20.2%) | 247 (19.3%) |
| 5 or more Vehicles | 77 (6.2%) | 26 (2.0%) |
| Total | 1,240 (100.0%) | 1,283 (100.0%) |
Commute Time in Shackle Island
The most frequently occuring commute durations in Shackle Island are 30 to 34 minutes (523 commuters, 23.7%), 45 to 59 minutes (249 commuters, 11.3%), and 20 to 24 minutes (246 commuters, 11.2%).
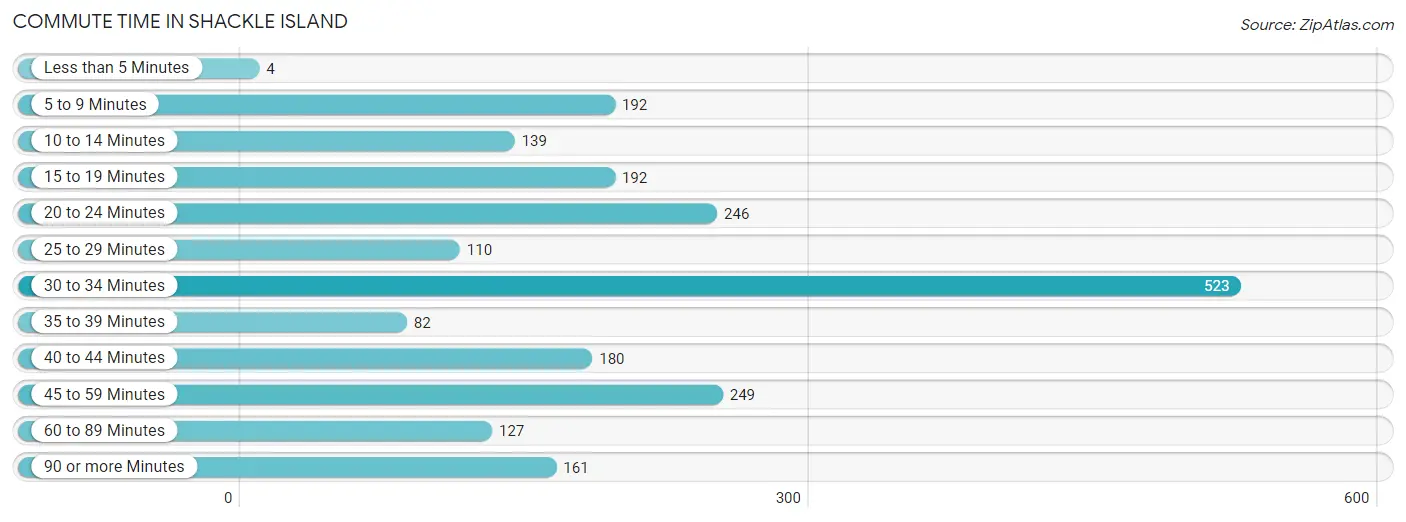
| Commute Time | # Commuters | % Commuters |
| Less than 5 Minutes | 4 | 0.2% |
| 5 to 9 Minutes | 192 | 8.7% |
| 10 to 14 Minutes | 139 | 6.3% |
| 15 to 19 Minutes | 192 | 8.7% |
| 20 to 24 Minutes | 246 | 11.2% |
| 25 to 29 Minutes | 110 | 5.0% |
| 30 to 34 Minutes | 523 | 23.7% |
| 35 to 39 Minutes | 82 | 3.7% |
| 40 to 44 Minutes | 180 | 8.2% |
| 45 to 59 Minutes | 249 | 11.3% |
| 60 to 89 Minutes | 127 | 5.8% |
| 90 or more Minutes | 161 | 7.3% |
Commute Time by Sex in Shackle Island
The most common commute times in Shackle Island are 30 to 34 minutes (219 commuters, 19.8%) for males and 30 to 34 minutes (304 commuters, 27.6%) for females.
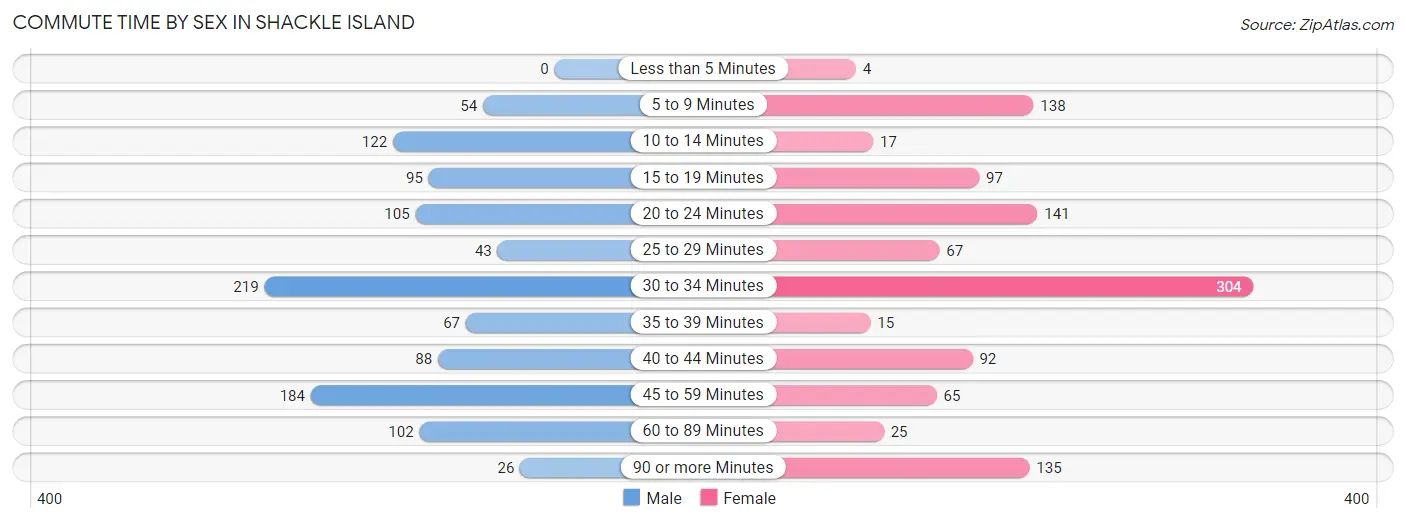
| Commute Time | Male | Female |
| Less than 5 Minutes | 0 (0.0%) | 4 (0.4%) |
| 5 to 9 Minutes | 54 (4.9%) | 138 (12.6%) |
| 10 to 14 Minutes | 122 (11.0%) | 17 (1.5%) |
| 15 to 19 Minutes | 95 (8.6%) | 97 (8.8%) |
| 20 to 24 Minutes | 105 (9.5%) | 141 (12.8%) |
| 25 to 29 Minutes | 43 (3.9%) | 67 (6.1%) |
| 30 to 34 Minutes | 219 (19.8%) | 304 (27.6%) |
| 35 to 39 Minutes | 67 (6.1%) | 15 (1.4%) |
| 40 to 44 Minutes | 88 (8.0%) | 92 (8.4%) |
| 45 to 59 Minutes | 184 (16.7%) | 65 (5.9%) |
| 60 to 89 Minutes | 102 (9.2%) | 25 (2.3%) |
| 90 or more Minutes | 26 (2.4%) | 135 (12.3%) |
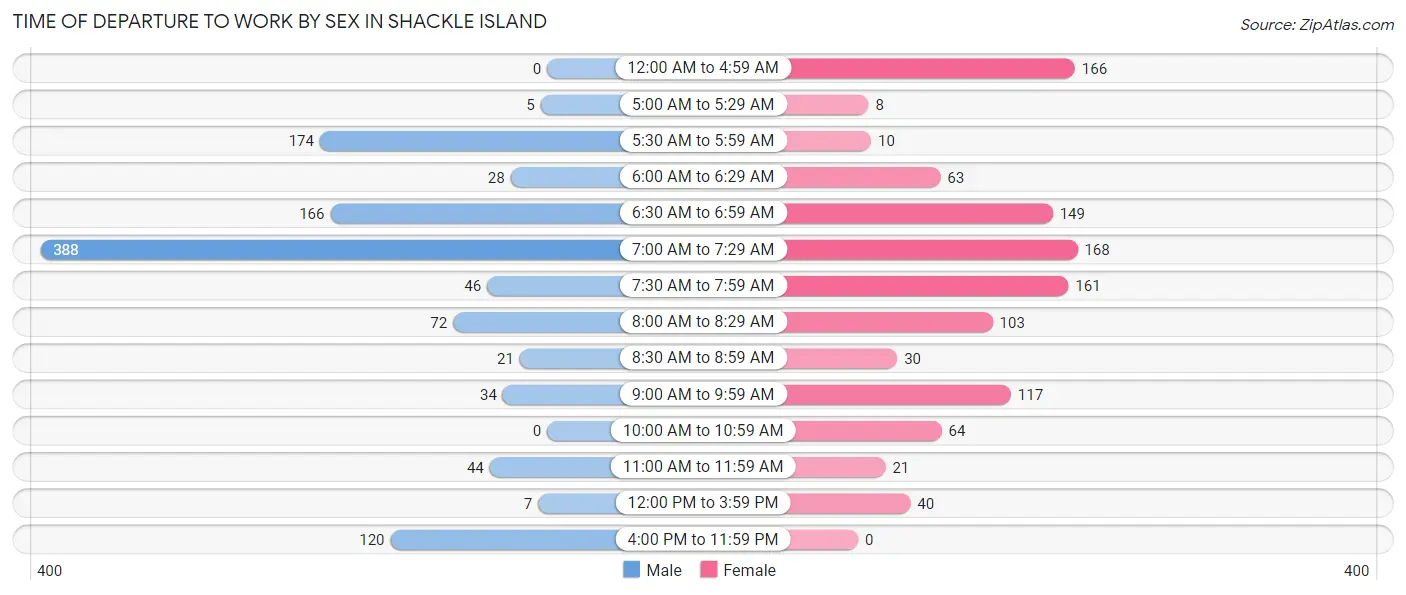
Time of Departure to Work by Sex in Shackle Island
The most frequent times of departure to work in Shackle Island are 7:00 AM to 7:29 AM (388, 35.1%) for males and 7:00 AM to 7:29 AM (168, 15.3%) for females.
| Time of Departure | Male | Female |
| 12:00 AM to 4:59 AM | 0 (0.0%) | 166 (15.1%) |
| 5:00 AM to 5:29 AM | 5 (0.4%) | 8 (0.7%) |
| 5:30 AM to 5:59 AM | 174 (15.8%) | 10 (0.9%) |
| 6:00 AM to 6:29 AM | 28 (2.5%) | 63 (5.7%) |
| 6:30 AM to 6:59 AM | 166 (15.0%) | 149 (13.6%) |
| 7:00 AM to 7:29 AM | 388 (35.1%) | 168 (15.3%) |
| 7:30 AM to 7:59 AM | 46 (4.2%) | 161 (14.6%) |
| 8:00 AM to 8:29 AM | 72 (6.5%) | 103 (9.4%) |
| 8:30 AM to 8:59 AM | 21 (1.9%) | 30 (2.7%) |
| 9:00 AM to 9:59 AM | 34 (3.1%) | 117 (10.6%) |
| 10:00 AM to 10:59 AM | 0 (0.0%) | 64 (5.8%) |
| 11:00 AM to 11:59 AM | 44 (4.0%) | 21 (1.9%) |
| 12:00 PM to 3:59 PM | 7 (0.6%) | 40 (3.6%) |
| 4:00 PM to 11:59 PM | 120 (10.9%) | 0 (0.0%) |
| Total | 1,105 (100.0%) | 1,100 (100.0%) |
Housing Occupancy in Shackle Island
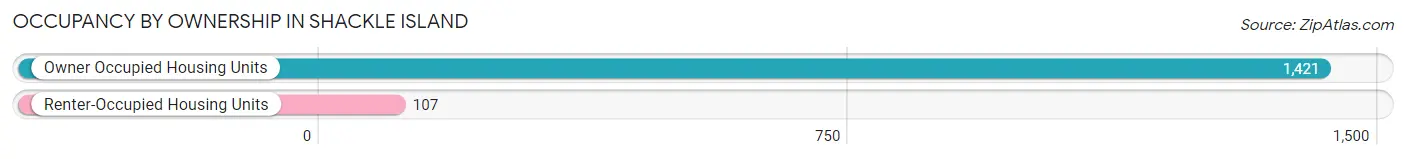
Occupancy by Ownership in Shackle Island
Of the total 1,528 dwellings in Shackle Island, owner-occupied units account for 1,421 (93.0%), while renter-occupied units make up 107 (7.0%).
| Occupancy | # Housing Units | % Housing Units |
| Owner Occupied Housing Units | 1,421 | 93.0% |
| Renter-Occupied Housing Units | 107 | 7.0% |
| Total Occupied Housing Units | 1,528 | 100.0% |
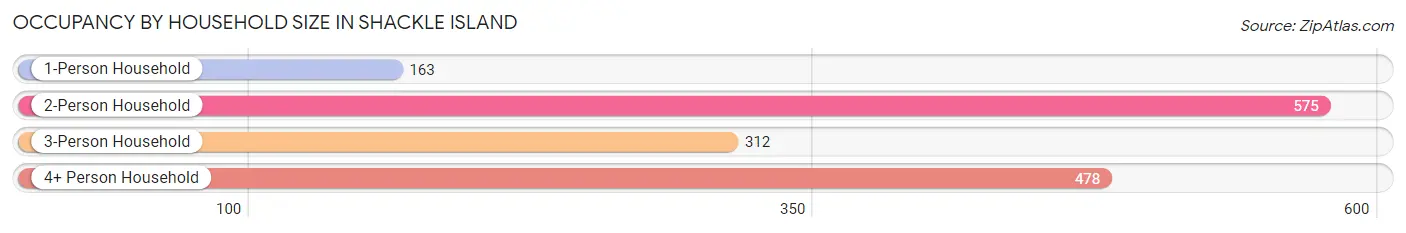
Occupancy by Household Size in Shackle Island
| Household Size | # Housing Units | % Housing Units |
| 1-Person Household | 163 | 10.7% |
| 2-Person Household | 575 | 37.6% |
| 3-Person Household | 312 | 20.4% |
| 4+ Person Household | 478 | 31.3% |
| Total Housing Units | 1,528 | 100.0% |
Occupancy by Ownership by Household Size in Shackle Island
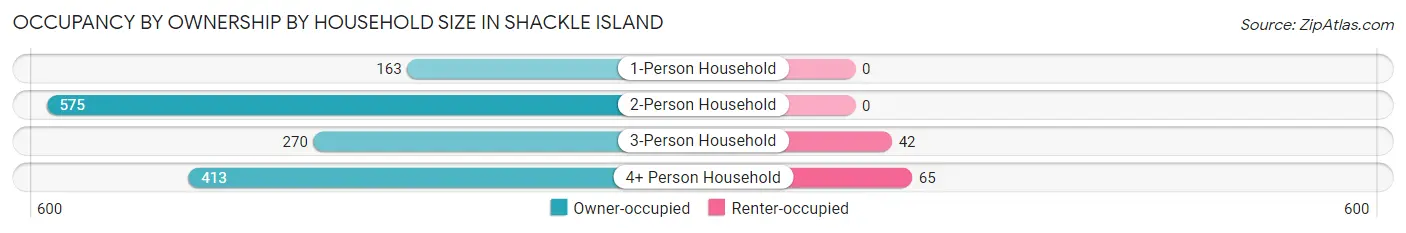
| Household Size | Owner-occupied | Renter-occupied |
| 1-Person Household | 163 (100.0%) | 0 (0.0%) |
| 2-Person Household | 575 (100.0%) | 0 (0.0%) |
| 3-Person Household | 270 (86.5%) | 42 (13.5%) |
| 4+ Person Household | 413 (86.4%) | 65 (13.6%) |
| Total Housing Units | 1,421 (93.0%) | 107 (7.0%) |
Occupancy by Educational Attainment in Shackle Island
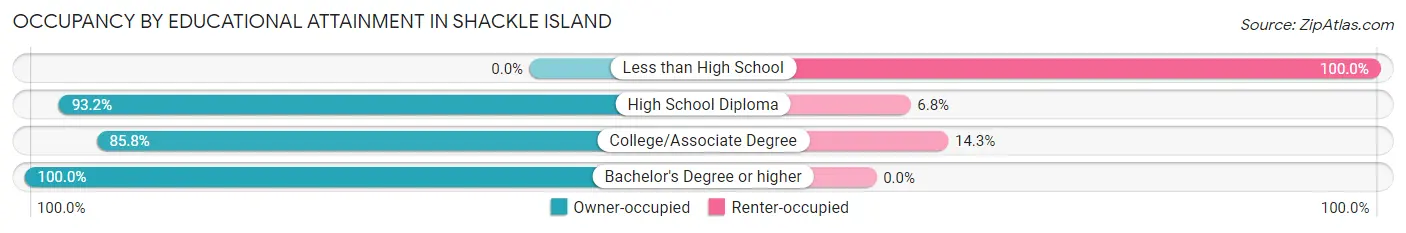
| Household Size | Owner-occupied | Renter-occupied |
| Less than High School | 0 (0.0%) | 11 (100.0%) |
| High School Diploma | 426 (93.2%) | 31 (6.8%) |
| College/Associate Degree | 391 (85.8%) | 65 (14.2%) |
| Bachelor's Degree or higher | 604 (100.0%) | 0 (0.0%) |
Occupancy by Age of Householder in Shackle Island
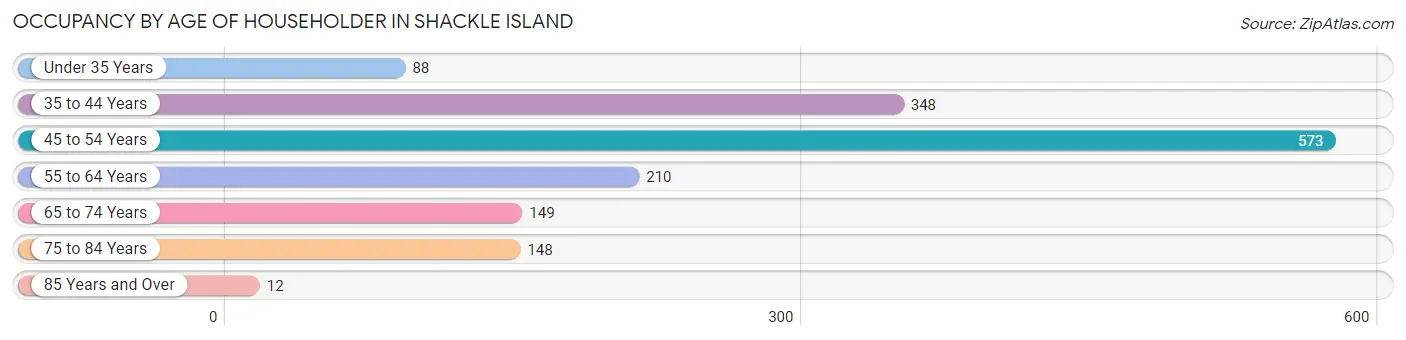
| Age Bracket | # Households | % Households |
| Under 35 Years | 88 | 5.8% |
| 35 to 44 Years | 348 | 22.8% |
| 45 to 54 Years | 573 | 37.5% |
| 55 to 64 Years | 210 | 13.7% |
| 65 to 74 Years | 149 | 9.8% |
| 75 to 84 Years | 148 | 9.7% |
| 85 Years and Over | 12 | 0.8% |
| Total | 1,528 | 100.0% |
Housing Finances in Shackle Island
Median Income by Occupancy in Shackle Island
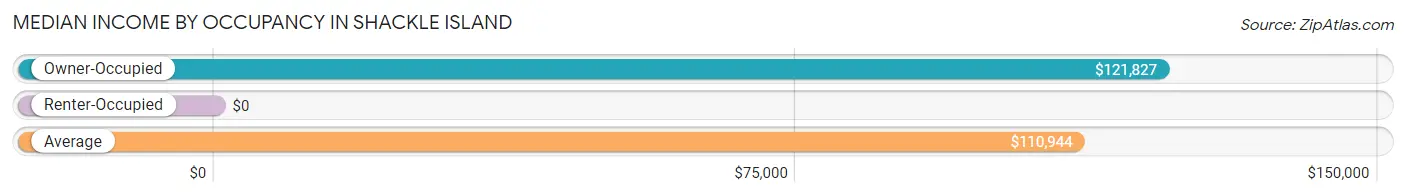
| Occupancy Type | # Households | Median Income |
| Owner-Occupied | 1,421 (93.0%) | $121,827 |
| Renter-Occupied | 107 (7.0%) | $0 |
| Average | 1,528 (100.0%) | $110,944 |
Occupancy by Householder Income Bracket in Shackle Island
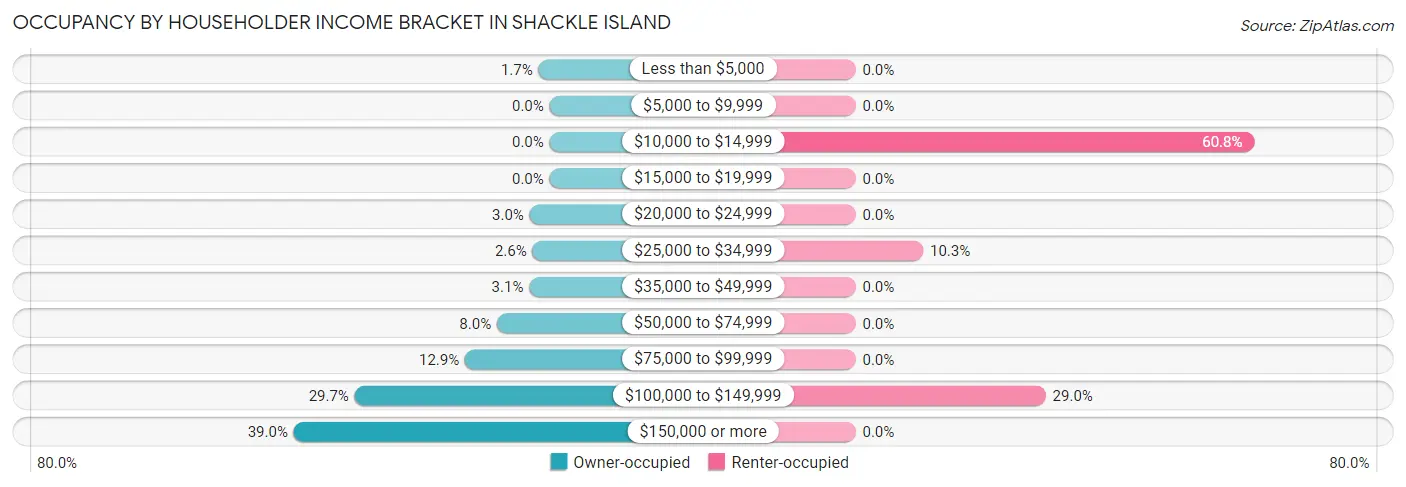
| Income Bracket | Owner-occupied | Renter-occupied |
| Less than $5,000 | 24 (1.7%) | 0 (0.0%) |
| $5,000 to $9,999 | 0 (0.0%) | 0 (0.0%) |
| $10,000 to $14,999 | 0 (0.0%) | 65 (60.8%) |
| $15,000 to $19,999 | 0 (0.0%) | 0 (0.0%) |
| $20,000 to $24,999 | 43 (3.0%) | 0 (0.0%) |
| $25,000 to $34,999 | 37 (2.6%) | 11 (10.3%) |
| $35,000 to $49,999 | 44 (3.1%) | 0 (0.0%) |
| $50,000 to $74,999 | 114 (8.0%) | 0 (0.0%) |
| $75,000 to $99,999 | 183 (12.9%) | 0 (0.0%) |
| $100,000 to $149,999 | 422 (29.7%) | 31 (29.0%) |
| $150,000 or more | 554 (39.0%) | 0 (0.0%) |
| Total | 1,421 (100.0%) | 107 (100.0%) |
Monthly Housing Cost Tiers in Shackle Island
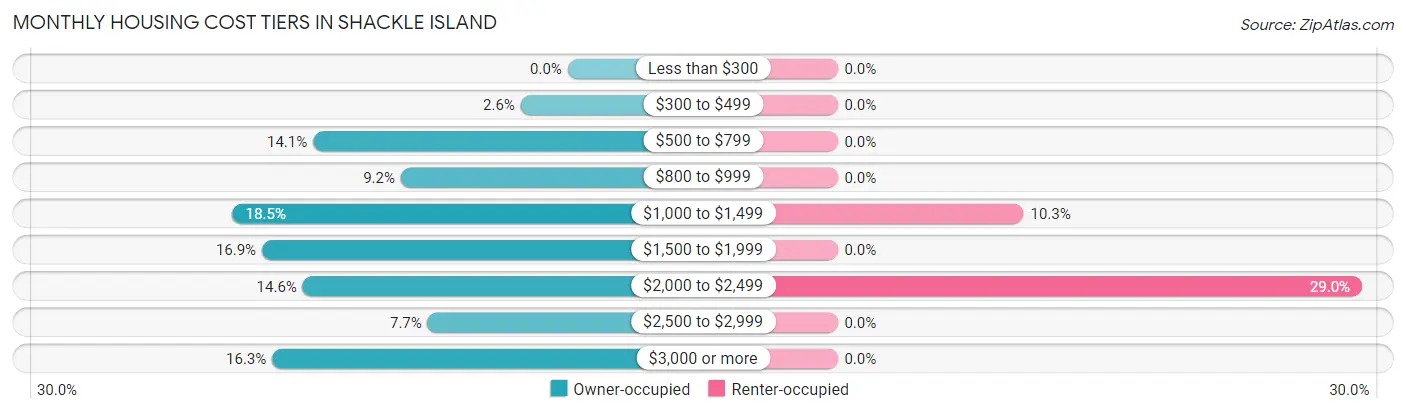
| Monthly Cost | Owner-occupied | Renter-occupied |
| Less than $300 | 0 (0.0%) | 0 (0.0%) |
| $300 to $499 | 37 (2.6%) | 0 (0.0%) |
| $500 to $799 | 200 (14.1%) | 0 (0.0%) |
| $800 to $999 | 131 (9.2%) | 0 (0.0%) |
| $1,000 to $1,499 | 263 (18.5%) | 11 (10.3%) |
| $1,500 to $1,999 | 240 (16.9%) | 0 (0.0%) |
| $2,000 to $2,499 | 208 (14.6%) | 31 (29.0%) |
| $2,500 to $2,999 | 110 (7.7%) | 0 (0.0%) |
| $3,000 or more | 232 (16.3%) | 0 (0.0%) |
| Total | 1,421 (100.0%) | 107 (100.0%) |
Physical Housing Characteristics in Shackle Island
Housing Structures in Shackle Island
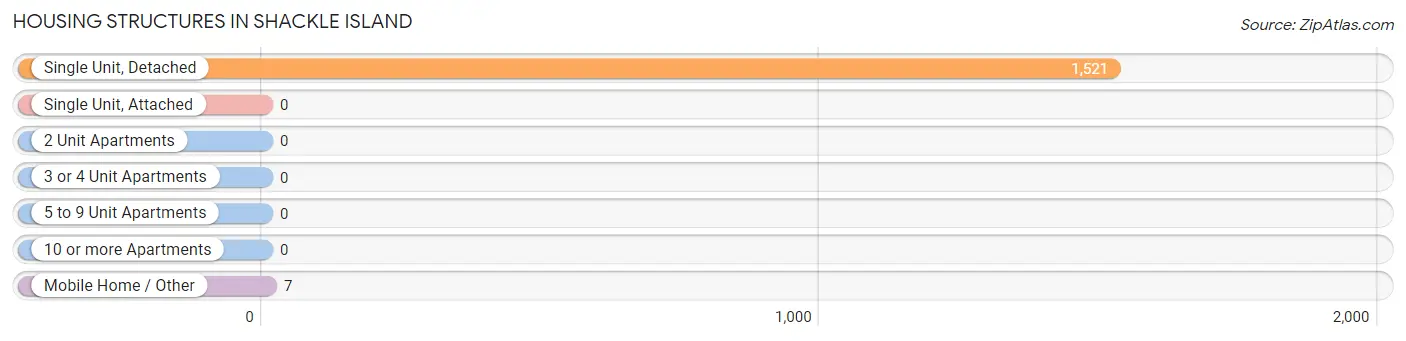
| Structure Type | # Housing Units | % Housing Units |
| Single Unit, Detached | 1,521 | 99.5% |
| Single Unit, Attached | 0 | 0.0% |
| 2 Unit Apartments | 0 | 0.0% |
| 3 or 4 Unit Apartments | 0 | 0.0% |
| 5 to 9 Unit Apartments | 0 | 0.0% |
| 10 or more Apartments | 0 | 0.0% |
| Mobile Home / Other | 7 | 0.5% |
| Total | 1,528 | 100.0% |
Housing Structures by Occupancy in Shackle Island
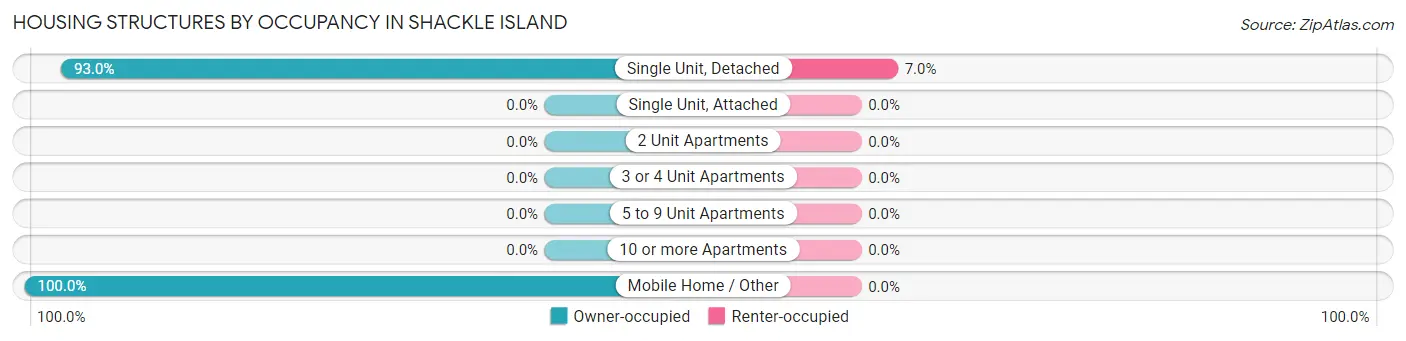
| Structure Type | Owner-occupied | Renter-occupied |
| Single Unit, Detached | 1,414 (93.0%) | 107 (7.0%) |
| Single Unit, Attached | 0 (0.0%) | 0 (0.0%) |
| 2 Unit Apartments | 0 (0.0%) | 0 (0.0%) |
| 3 or 4 Unit Apartments | 0 (0.0%) | 0 (0.0%) |
| 5 to 9 Unit Apartments | 0 (0.0%) | 0 (0.0%) |
| 10 or more Apartments | 0 (0.0%) | 0 (0.0%) |
| Mobile Home / Other | 7 (100.0%) | 0 (0.0%) |
| Total | 1,421 (93.0%) | 107 (7.0%) |
Housing Structures by Number of Rooms in Shackle Island
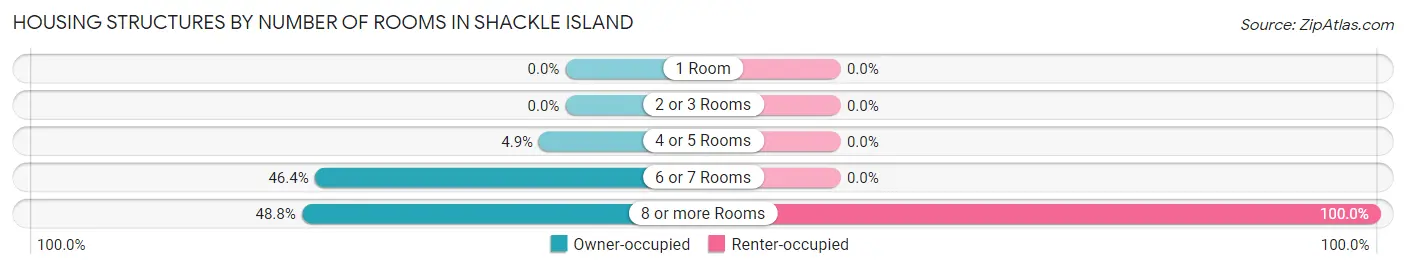
| Number of Rooms | Owner-occupied | Renter-occupied |
| 1 Room | 0 (0.0%) | 0 (0.0%) |
| 2 or 3 Rooms | 0 (0.0%) | 0 (0.0%) |
| 4 or 5 Rooms | 69 (4.9%) | 0 (0.0%) |
| 6 or 7 Rooms | 659 (46.4%) | 0 (0.0%) |
| 8 or more Rooms | 693 (48.8%) | 107 (100.0%) |
| Total | 1,421 (100.0%) | 107 (100.0%) |
Housing Structure by Heating Type in Shackle Island
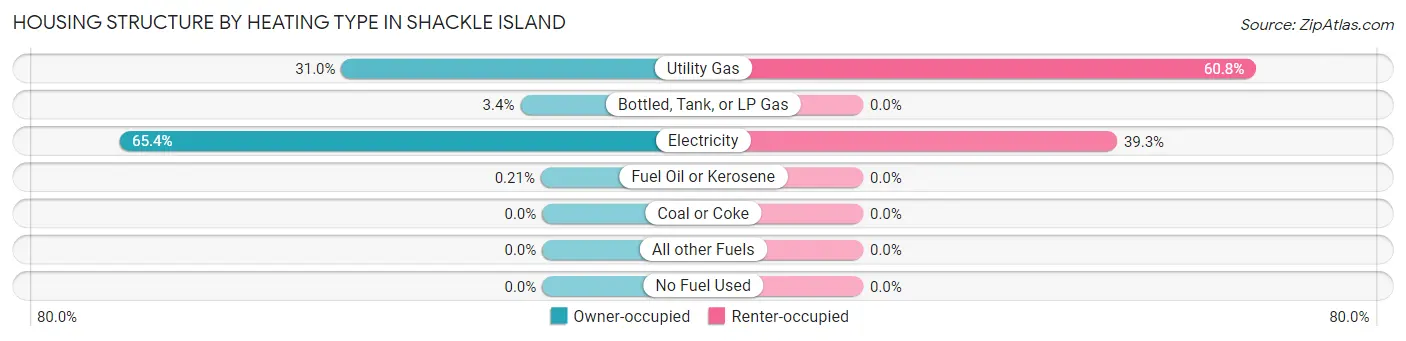
| Heating Type | Owner-occupied | Renter-occupied |
| Utility Gas | 441 (31.0%) | 65 (60.8%) |
| Bottled, Tank, or LP Gas | 48 (3.4%) | 0 (0.0%) |
| Electricity | 929 (65.4%) | 42 (39.3%) |
| Fuel Oil or Kerosene | 3 (0.2%) | 0 (0.0%) |
| Coal or Coke | 0 (0.0%) | 0 (0.0%) |
| All other Fuels | 0 (0.0%) | 0 (0.0%) |
| No Fuel Used | 0 (0.0%) | 0 (0.0%) |
| Total | 1,421 (100.0%) | 107 (100.0%) |
Household Vehicle Usage in Shackle Island
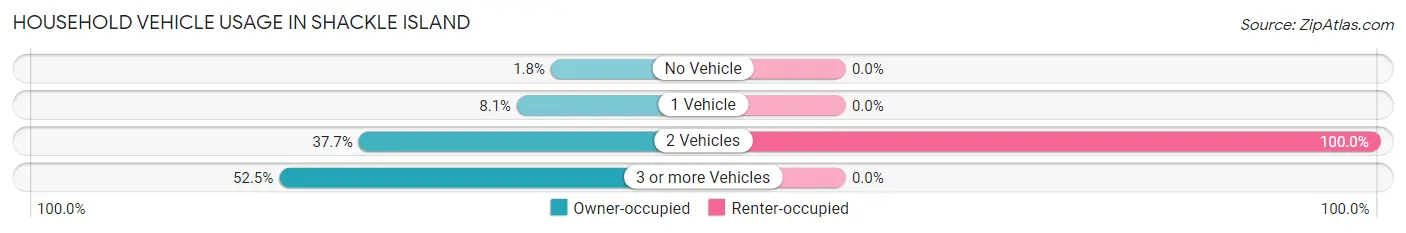
| Vehicles per Household | Owner-occupied | Renter-occupied |
| No Vehicle | 25 (1.8%) | 0 (0.0%) |
| 1 Vehicle | 115 (8.1%) | 0 (0.0%) |
| 2 Vehicles | 535 (37.7%) | 107 (100.0%) |
| 3 or more Vehicles | 746 (52.5%) | 0 (0.0%) |
| Total | 1,421 (100.0%) | 107 (100.0%) |
Real Estate & Mortgages in Shackle Island
Real Estate and Mortgage Overview in Shackle Island
| Characteristic | Without Mortgage | With Mortgage |
| Housing Units | 349 | 1,072 |
| Median Property Value | $467,300 | $412,300 |
| Median Household Income | $125,536 | $396 |
| Monthly Housing Costs | $647 | $232 |
| Real Estate Taxes | $2,005 | $0 |
Property Value by Mortgage Status in Shackle Island
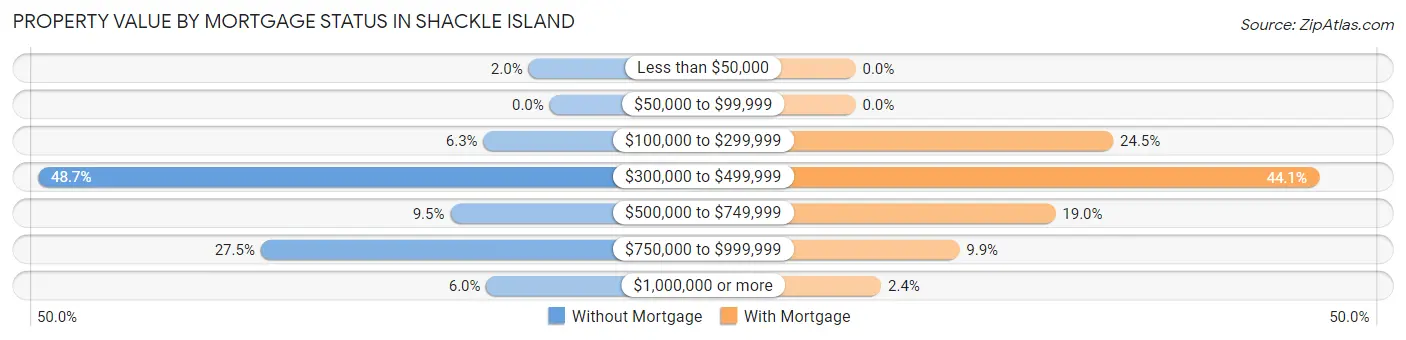
| Property Value | Without Mortgage | With Mortgage |
| Less than $50,000 | 7 (2.0%) | 0 (0.0%) |
| $50,000 to $99,999 | 0 (0.0%) | 0 (0.0%) |
| $100,000 to $299,999 | 22 (6.3%) | 263 (24.5%) |
| $300,000 to $499,999 | 170 (48.7%) | 473 (44.1%) |
| $500,000 to $749,999 | 33 (9.5%) | 204 (19.0%) |
| $750,000 to $999,999 | 96 (27.5%) | 106 (9.9%) |
| $1,000,000 or more | 21 (6.0%) | 26 (2.4%) |
| Total | 349 (100.0%) | 1,072 (100.0%) |
Household Income by Mortgage Status in Shackle Island
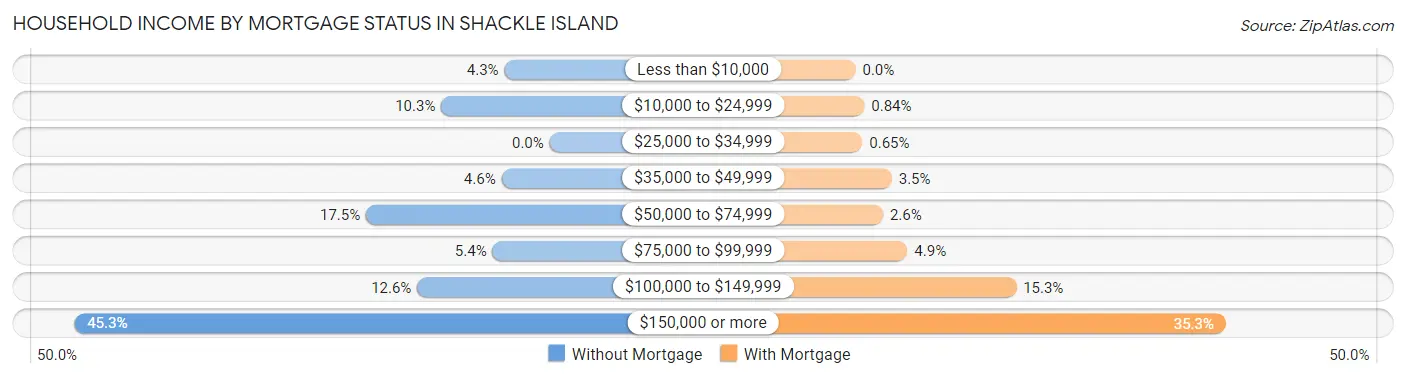
| Household Income | Without Mortgage | With Mortgage |
| Less than $10,000 | 15 (4.3%) | 0 (0.0%) |
| $10,000 to $24,999 | 36 (10.3%) | 9 (0.8%) |
| $25,000 to $34,999 | 0 (0.0%) | 7 (0.6%) |
| $35,000 to $49,999 | 16 (4.6%) | 37 (3.5%) |
| $50,000 to $74,999 | 61 (17.5%) | 28 (2.6%) |
| $75,000 to $99,999 | 19 (5.4%) | 53 (4.9%) |
| $100,000 to $149,999 | 44 (12.6%) | 164 (15.3%) |
| $150,000 or more | 158 (45.3%) | 378 (35.3%) |
| Total | 349 (100.0%) | 1,072 (100.0%) |
Property Value to Household Income Ratio in Shackle Island
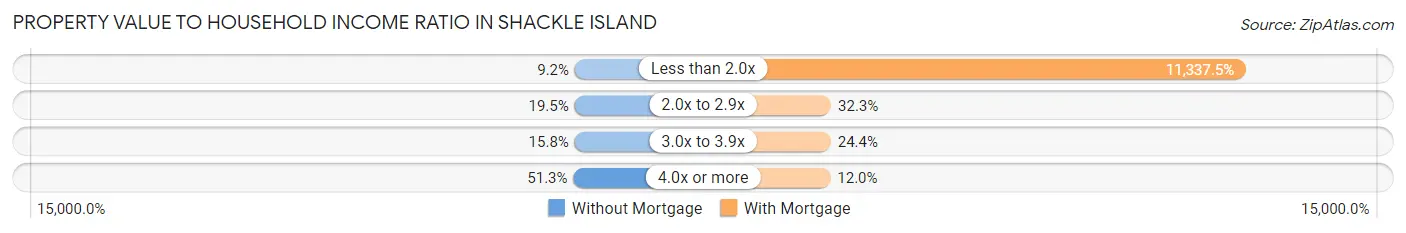
| Value-to-Income Ratio | Without Mortgage | With Mortgage |
| Less than 2.0x | 32 (9.2%) | 121,538 (11,337.5%) |
| 2.0x to 2.9x | 68 (19.5%) | 346 (32.3%) |
| 3.0x to 3.9x | 55 (15.8%) | 261 (24.3%) |
| 4.0x or more | 179 (51.3%) | 129 (12.0%) |
| Total | 349 (100.0%) | 1,072 (100.0%) |
Real Estate Taxes by Mortgage Status in Shackle Island
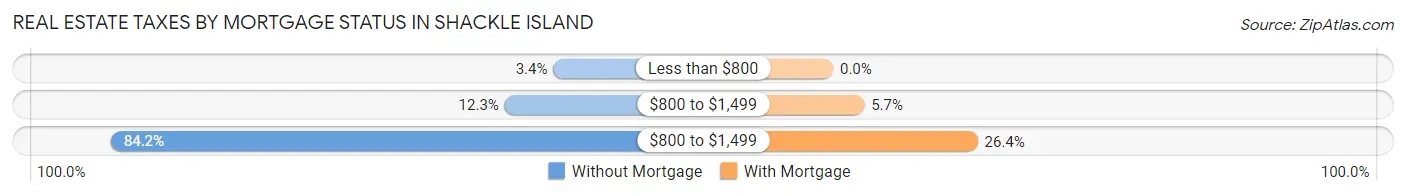
| Property Taxes | Without Mortgage | With Mortgage |
| Less than $800 | 12 (3.4%) | 0 (0.0%) |
| $800 to $1,499 | 43 (12.3%) | 61 (5.7%) |
| $800 to $1,499 | 294 (84.2%) | 283 (26.4%) |
| Total | 349 (100.0%) | 1,072 (100.0%) |
Health & Disability in Shackle Island
Health Insurance Coverage by Age in Shackle Island
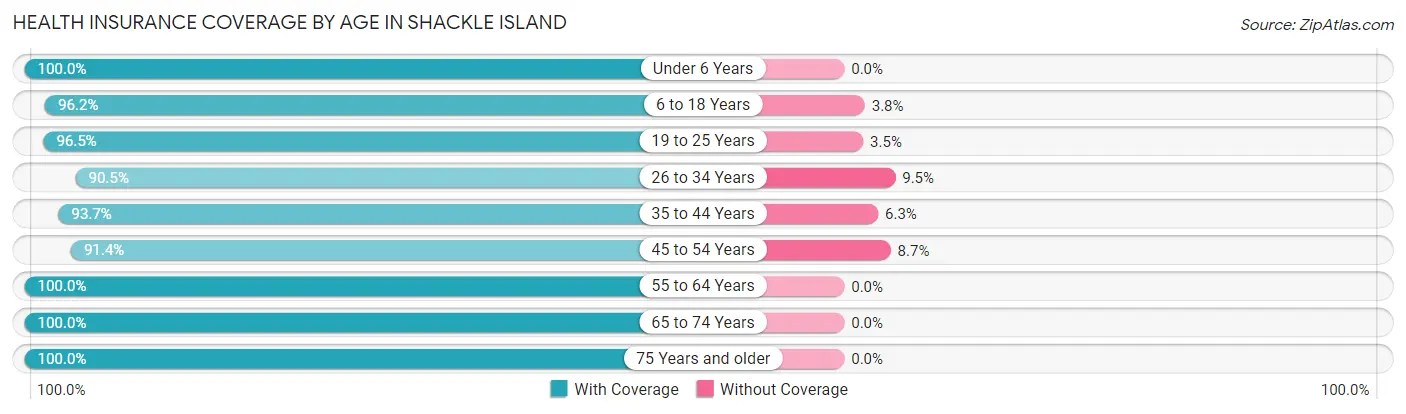
| Age Bracket | With Coverage | Without Coverage |
| Under 6 Years | 198 (100.0%) | 0 (0.0%) |
| 6 to 18 Years | 731 (96.2%) | 29 (3.8%) |
| 19 to 25 Years | 274 (96.5%) | 10 (3.5%) |
| 26 to 34 Years | 238 (90.5%) | 25 (9.5%) |
| 35 to 44 Years | 743 (93.7%) | 50 (6.3%) |
| 45 to 54 Years | 971 (91.3%) | 92 (8.6%) |
| 55 to 64 Years | 515 (100.0%) | 0 (0.0%) |
| 65 to 74 Years | 237 (100.0%) | 0 (0.0%) |
| 75 Years and older | 262 (100.0%) | 0 (0.0%) |
| Total | 4,169 (95.3%) | 206 (4.7%) |
Health Insurance Coverage by Citizenship Status in Shackle Island
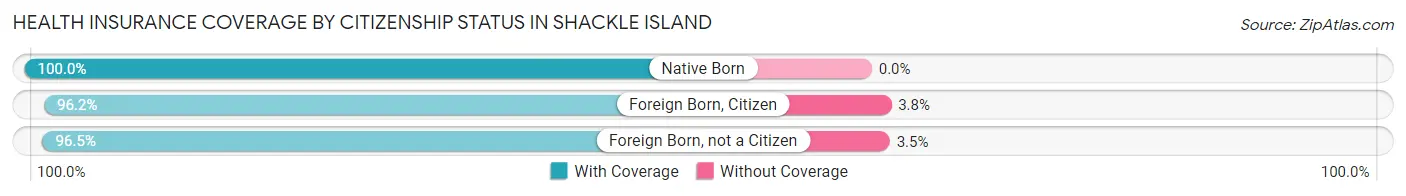
| Citizenship Status | With Coverage | Without Coverage |
| Native Born | 198 (100.0%) | 0 (0.0%) |
| Foreign Born, Citizen | 731 (96.2%) | 29 (3.8%) |
| Foreign Born, not a Citizen | 274 (96.5%) | 10 (3.5%) |
Health Insurance Coverage by Household Income in Shackle Island
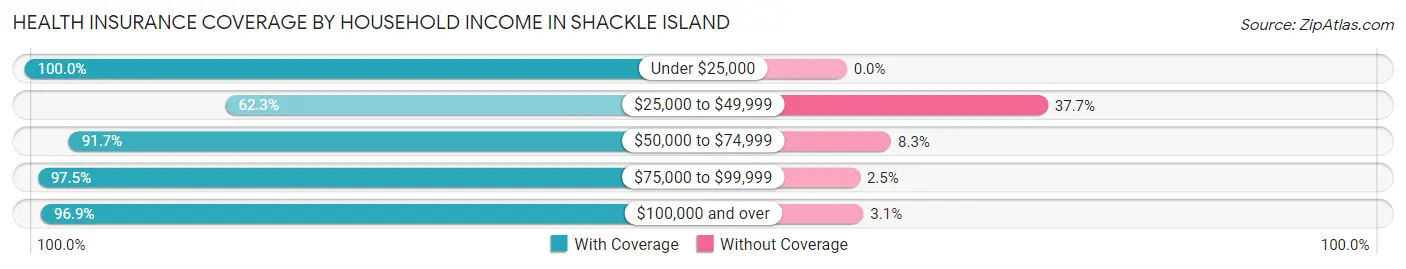
| Household Income | With Coverage | Without Coverage |
| Under $25,000 | 427 (100.0%) | 0 (0.0%) |
| $25,000 to $49,999 | 134 (62.3%) | 81 (37.7%) |
| $50,000 to $74,999 | 210 (91.7%) | 19 (8.3%) |
| $75,000 to $99,999 | 435 (97.5%) | 11 (2.5%) |
| $100,000 and over | 2,963 (96.9%) | 95 (3.1%) |
Public vs Private Health Insurance Coverage by Age in Shackle Island
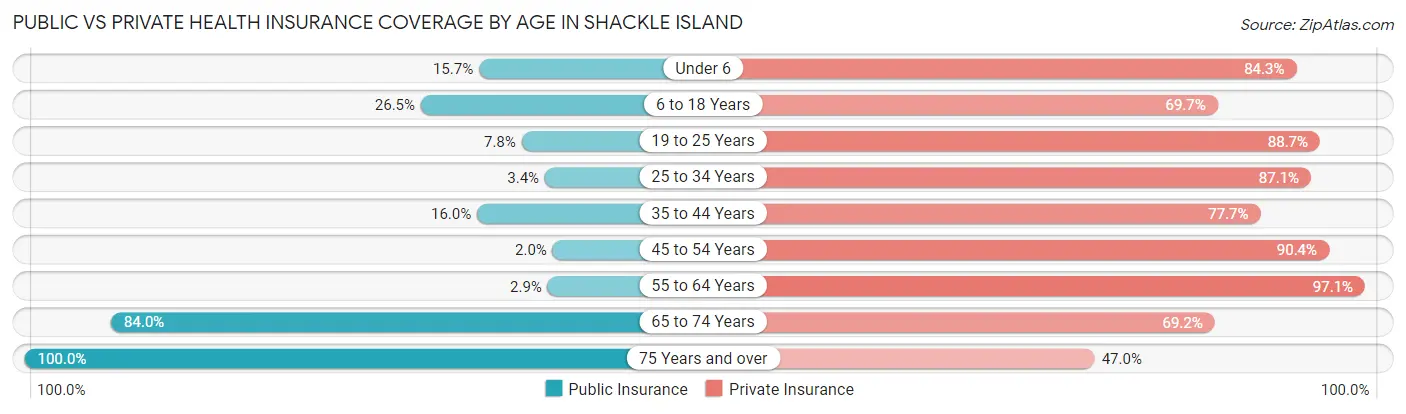
| Age Bracket | Public Insurance | Private Insurance |
| Under 6 | 31 (15.7%) | 167 (84.3%) |
| 6 to 18 Years | 201 (26.5%) | 530 (69.7%) |
| 19 to 25 Years | 22 (7.7%) | 252 (88.7%) |
| 25 to 34 Years | 9 (3.4%) | 229 (87.1%) |
| 35 to 44 Years | 127 (16.0%) | 616 (77.7%) |
| 45 to 54 Years | 21 (2.0%) | 961 (90.4%) |
| 55 to 64 Years | 15 (2.9%) | 500 (97.1%) |
| 65 to 74 Years | 199 (84.0%) | 164 (69.2%) |
| 75 Years and over | 262 (100.0%) | 123 (46.9%) |
| Total | 887 (20.3%) | 3,542 (81.0%) |
Disability Status by Sex by Age in Shackle Island
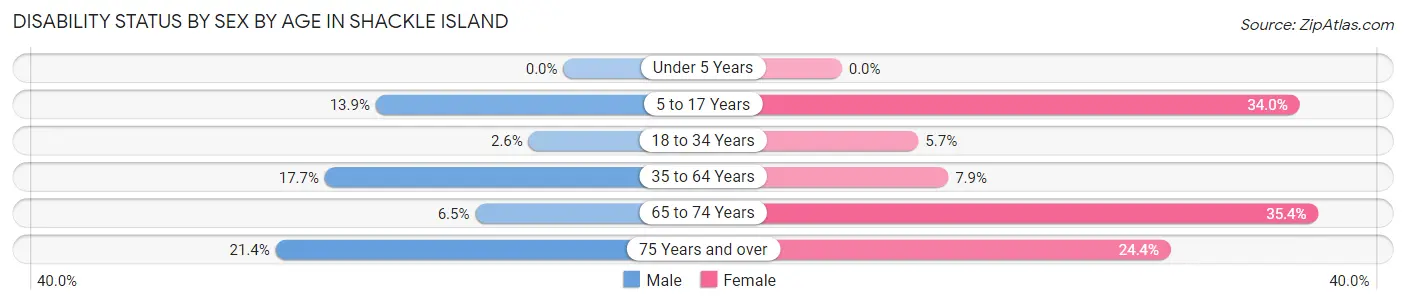
| Age Bracket | Male | Female |
| Under 5 Years | 0 (0.0%) | 0 (0.0%) |
| 5 to 17 Years | 67 (13.9%) | 123 (34.0%) |
| 18 to 34 Years | 8 (2.6%) | 14 (5.7%) |
| 35 to 64 Years | 198 (17.7%) | 99 (7.9%) |
| 65 to 74 Years | 7 (6.5%) | 46 (35.4%) |
| 75 Years and over | 28 (21.4%) | 32 (24.4%) |
Disability Class by Sex by Age in Shackle Island
Disability Class: Hearing Difficulty
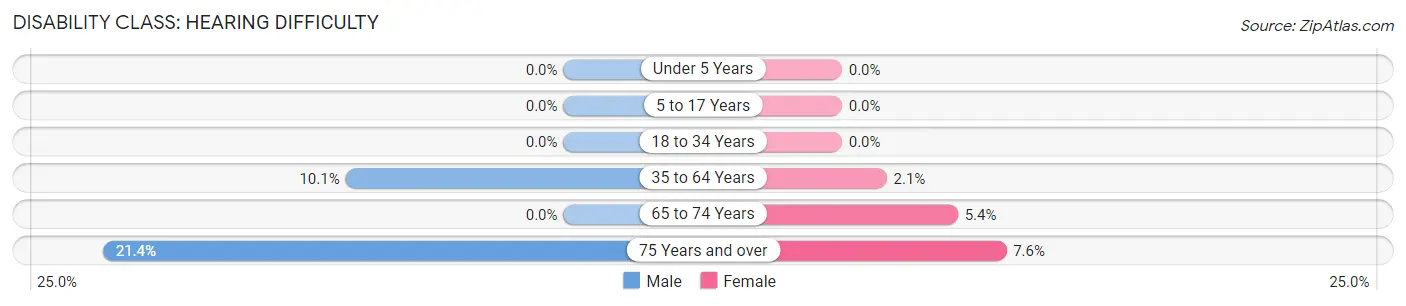
| Age Bracket | Male | Female |
| Under 5 Years | 0 (0.0%) | 0 (0.0%) |
| 5 to 17 Years | 0 (0.0%) | 0 (0.0%) |
| 18 to 34 Years | 0 (0.0%) | 0 (0.0%) |
| 35 to 64 Years | 113 (10.1%) | 26 (2.1%) |
| 65 to 74 Years | 0 (0.0%) | 7 (5.4%) |
| 75 Years and over | 28 (21.4%) | 10 (7.6%) |
Disability Class: Vision Difficulty
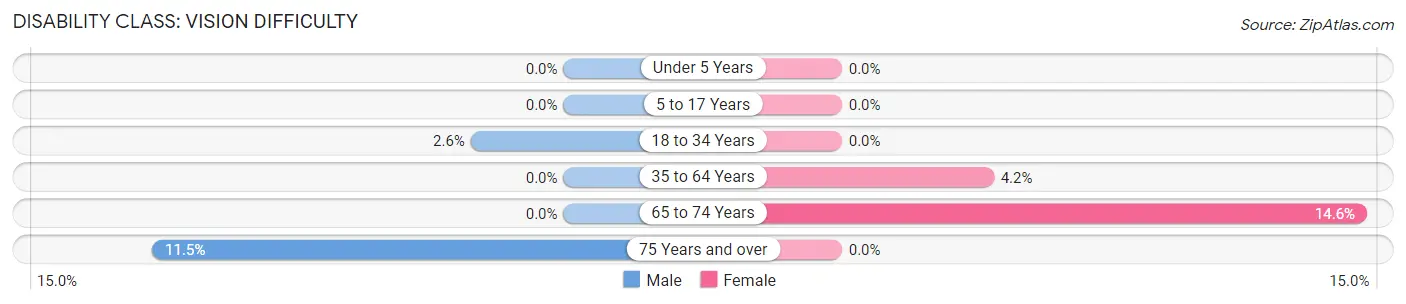
| Age Bracket | Male | Female |
| Under 5 Years | 0 (0.0%) | 0 (0.0%) |
| 5 to 17 Years | 0 (0.0%) | 0 (0.0%) |
| 18 to 34 Years | 8 (2.6%) | 0 (0.0%) |
| 35 to 64 Years | 0 (0.0%) | 53 (4.2%) |
| 65 to 74 Years | 0 (0.0%) | 19 (14.6%) |
| 75 Years and over | 15 (11.5%) | 0 (0.0%) |
Disability Class: Cognitive Difficulty
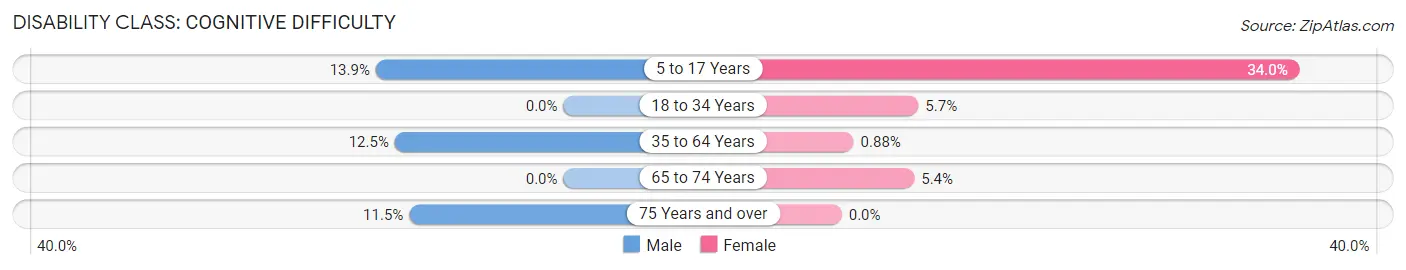
| Age Bracket | Male | Female |
| 5 to 17 Years | 67 (13.9%) | 123 (34.0%) |
| 18 to 34 Years | 0 (0.0%) | 14 (5.7%) |
| 35 to 64 Years | 140 (12.5%) | 11 (0.9%) |
| 65 to 74 Years | 0 (0.0%) | 7 (5.4%) |
| 75 Years and over | 15 (11.5%) | 0 (0.0%) |
Disability Class: Ambulatory Difficulty
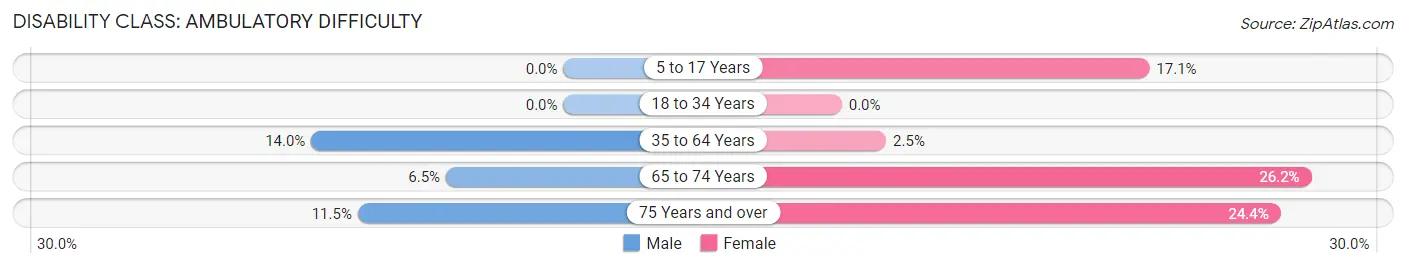
| Age Bracket | Male | Female |
| 5 to 17 Years | 0 (0.0%) | 62 (17.1%) |
| 18 to 34 Years | 0 (0.0%) | 0 (0.0%) |
| 35 to 64 Years | 157 (14.0%) | 31 (2.5%) |
| 65 to 74 Years | 7 (6.5%) | 34 (26.2%) |
| 75 Years and over | 15 (11.5%) | 32 (24.4%) |
Disability Class: Self-Care Difficulty
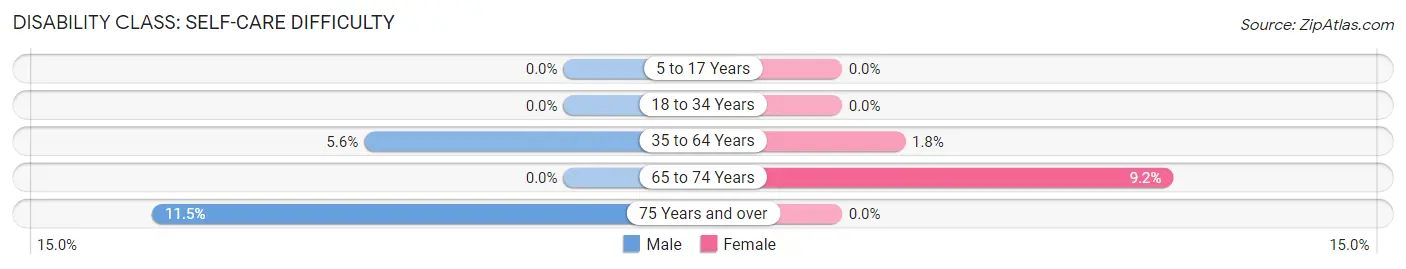
| Age Bracket | Male | Female |
| 5 to 17 Years | 0 (0.0%) | 0 (0.0%) |
| 18 to 34 Years | 0 (0.0%) | 0 (0.0%) |
| 35 to 64 Years | 62 (5.6%) | 22 (1.8%) |
| 65 to 74 Years | 0 (0.0%) | 12 (9.2%) |
| 75 Years and over | 15 (11.5%) | 0 (0.0%) |
Technology Access in Shackle Island
Computing Device Access in Shackle Island
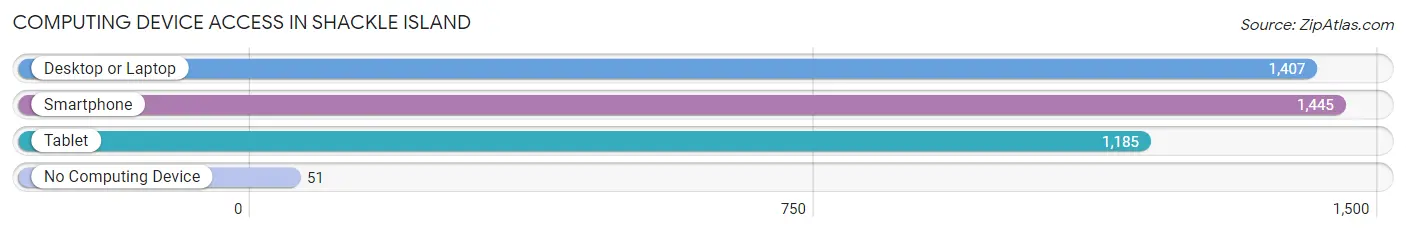
| Device Type | # Households | % Households |
| Desktop or Laptop | 1,407 | 92.1% |
| Smartphone | 1,445 | 94.6% |
| Tablet | 1,185 | 77.5% |
| No Computing Device | 51 | 3.3% |
| Total | 1,528 | 100.0% |
Internet Access in Shackle Island
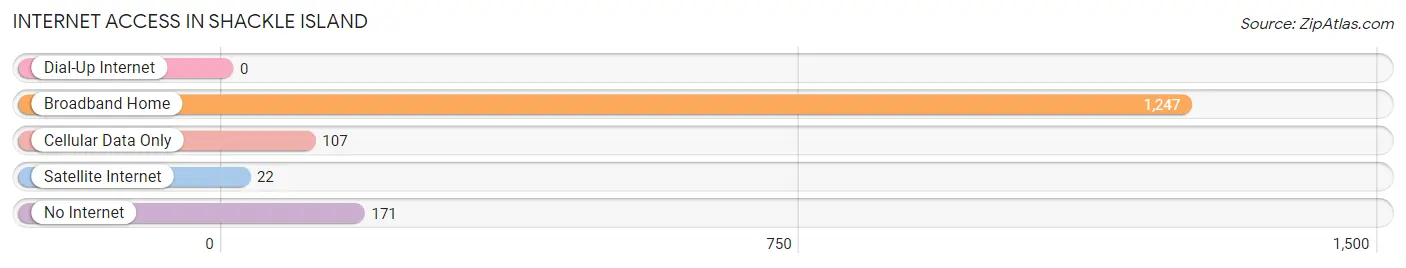
| Internet Type | # Households | % Households |
| Dial-Up Internet | 0 | 0.0% |
| Broadband Home | 1,247 | 81.6% |
| Cellular Data Only | 107 | 7.0% |
| Satellite Internet | 22 | 1.4% |
| No Internet | 171 | 11.2% |
| Total | 1,528 | 100.0% |
Shackle Island Summary
Shackle Island is a small unincorporated community located in Sumner County, Tennessee. It is situated along the Cumberland River, approximately 20 miles northeast of Nashville. The community is named after a nearby island in the river, which was once used as a place of confinement for criminals.
History
The area that is now Shackle Island was first settled in the early 1800s by a group of settlers from North Carolina. The settlers were attracted to the area due to its fertile soil and abundant wildlife. The community was originally known as “Shackle’s Island”, named after the nearby island in the Cumberland River. The island was used as a place of confinement for criminals, and the name was eventually shortened to “Shackle Island”.
In the late 1800s, the community began to grow and develop. A post office was established in 1891, and a school was built in 1895. The community also had a general store, a blacksmith shop, and a grist mill.
Geography
Shackle Island is located in Sumner County, Tennessee, approximately 20 miles northeast of Nashville. The community is situated along the Cumberland River, and is bordered by the towns of Gallatin and Hendersonville. The area is mostly rural, with rolling hills and farmland. The climate is humid subtropical, with hot summers and mild winters.
Economy
The economy of Shackle Island is largely based on agriculture. The area is home to several farms, which produce a variety of crops, including corn, soybeans, and hay. The community also has a few small businesses, including a general store, a gas station, and a restaurant.
Demographics
As of the 2010 census, the population of Shackle Island was 1,845. The racial makeup of the community was 97.3% White, 0.9% African American, 0.3% Native American, 0.2% Asian, and 1.3% from other races. The median household income was $45,938, and the median home value was $179,000.
Conclusion
Shackle Island is a small unincorporated community located in Sumner County, Tennessee. It is situated along the Cumberland River, and is home to a population of 1,845 people. The economy of the community is largely based on agriculture, and the area is known for its rolling hills and farmland. The community has a rich history, and is a great place to live and work.
Common Questions
What is Per Capita Income in Shackle Island?
Per Capita income in Shackle Island is $49,899.
What is the Median Family Income in Shackle Island?
Median Family Income in Shackle Island is $126,071.
What is the Median Household income in Shackle Island?
Median Household Income in Shackle Island is $110,944.
What is Income or Wage Gap in Shackle Island?
Income or Wage Gap in Shackle Island is 44.4%.
Women in Shackle Island earn 55.6 cents for every dollar earned by a man.
What is Inequality or Gini Index in Shackle Island?
Inequality or Gini Index in Shackle Island is 0.36.
What is the Total Population of Shackle Island?
Total Population of Shackle Island is 4,375.
What is the Total Male Population of Shackle Island?
Total Male Population of Shackle Island is 2,179.
What is the Total Female Population of Shackle Island?
Total Female Population of Shackle Island is 2,196.
What is the Ratio of Males per 100 Females in Shackle Island?
There are 99.23 Males per 100 Females in Shackle Island.
What is the Ratio of Females per 100 Males in Shackle Island?
There are 100.78 Females per 100 Males in Shackle Island.
What is the Median Population Age in Shackle Island?
Median Population Age in Shackle Island is 44.2 Years.
What is the Average Family Size in Shackle Island
Average Family Size in Shackle Island is 2.9 People.
What is the Average Household Size in Shackle Island
Average Household Size in Shackle Island is 2.9 People.
How Large is the Labor Force in Shackle Island?
There are 2,687 People in the Labor Forcein in Shackle Island.
What is the Percentage of People in the Labor Force in Shackle Island?
76.5% of People are in the Labor Force in Shackle Island.
What is the Unemployment Rate in Shackle Island?
Unemployment Rate in Shackle Island is 6.1%.