Alcoa, TN Map & Demographics
Alcoa Map
Alcoa Overview
$33,389
PER CAPITA INCOME
$76,484
AVG FAMILY INCOME
$63,580
AVG HOUSEHOLD INCOME
27.3%
WAGE / INCOME GAP [ % ]
72.7¢/ $1
WAGE / INCOME GAP [ $ ]
0.40
INEQUALITY / GINI INDEX
11,095
TOTAL POPULATION
5,553
MALE POPULATION
5,542
FEMALE POPULATION
100.20
MALES / 100 FEMALES
99.80
FEMALES / 100 MALES
36.3
MEDIAN AGE
3.2
AVG FAMILY SIZE
2.5
AVG HOUSEHOLD SIZE
5,945
LABOR FORCE [ PEOPLE ]
68.8%
PERCENT IN LABOR FORCE
4.0%
UNEMPLOYMENT RATE
Alcoa Zip Codes
Alcoa Area Codes
Income in Alcoa
Income Overview in Alcoa
Per Capita Income in Alcoa is $33,389, while median incomes of families and households are $76,484 and $63,580 respectively.
| Characteristic | Number | Measure |
| Per Capita Income | 11,095 | $33,389 |
| Median Family Income | 2,703 | $76,484 |
| Mean Family Income | 2,703 | $94,487 |
| Median Household Income | 4,458 | $63,580 |
| Mean Household Income | 4,458 | $78,761 |
| Income Deficit | 2,703 | $0 |
| Wage / Income Gap (%) | 11,095 | 27.28% |
| Wage / Income Gap ($) | 11,095 | 72.72¢ per $1 |
| Gini / Inequality Index | 11,095 | 0.40 |
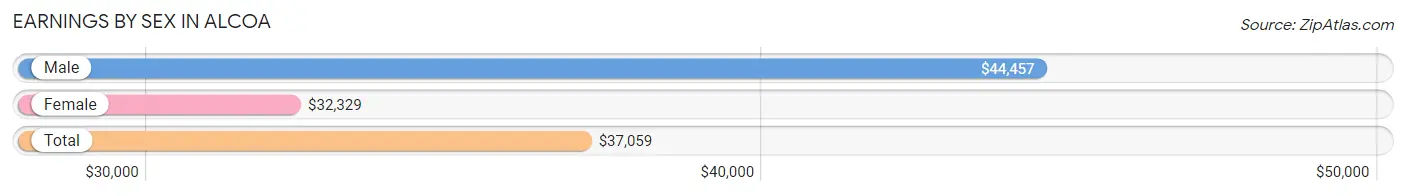
Earnings by Sex in Alcoa
Average Earnings in Alcoa are $37,059, $44,457 for men and $32,329 for women, a difference of 27.3%.
| Sex | Number | Average Earnings |
| Male | 3,380 (56.4%) | $44,457 |
| Female | 2,610 (43.6%) | $32,329 |
| Total | 5,990 (100.0%) | $37,059 |
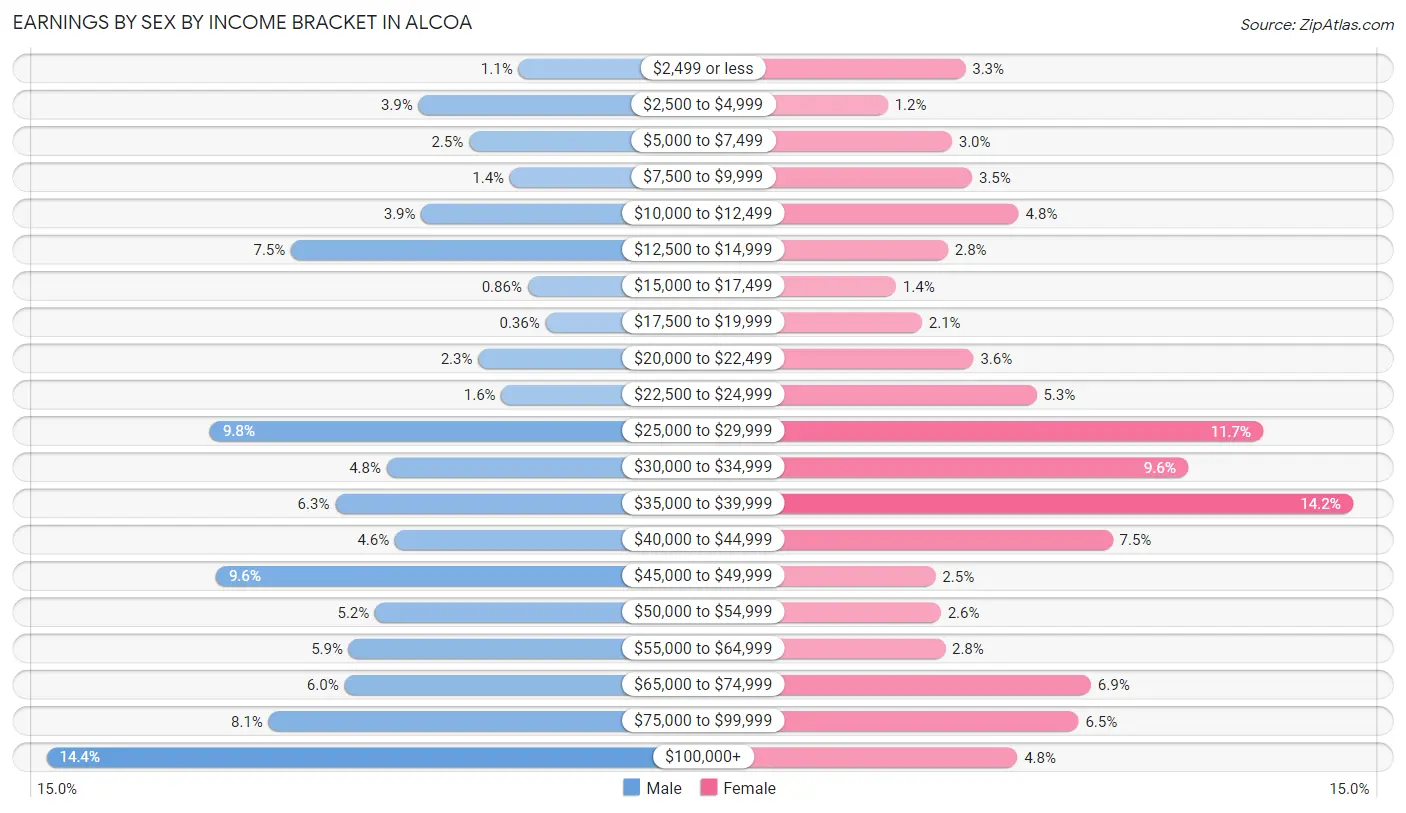
Earnings by Sex by Income Bracket in Alcoa
The most common earnings brackets in Alcoa are $100,000+ for men (486 | 14.4%) and $35,000 to $39,999 for women (371 | 14.2%).
| Income | Male | Female |
| $2,499 or less | 38 (1.1%) | 87 (3.3%) |
| $2,500 to $4,999 | 133 (3.9%) | 30 (1.1%) |
| $5,000 to $7,499 | 85 (2.5%) | 77 (2.9%) |
| $7,500 to $9,999 | 46 (1.4%) | 92 (3.5%) |
| $10,000 to $12,499 | 130 (3.8%) | 126 (4.8%) |
| $12,500 to $14,999 | 254 (7.5%) | 74 (2.8%) |
| $15,000 to $17,499 | 29 (0.9%) | 36 (1.4%) |
| $17,500 to $19,999 | 12 (0.4%) | 55 (2.1%) |
| $20,000 to $22,499 | 76 (2.2%) | 93 (3.6%) |
| $22,500 to $24,999 | 54 (1.6%) | 139 (5.3%) |
| $25,000 to $29,999 | 331 (9.8%) | 305 (11.7%) |
| $30,000 to $34,999 | 163 (4.8%) | 250 (9.6%) |
| $35,000 to $39,999 | 212 (6.3%) | 371 (14.2%) |
| $40,000 to $44,999 | 155 (4.6%) | 195 (7.5%) |
| $45,000 to $49,999 | 325 (9.6%) | 65 (2.5%) |
| $50,000 to $54,999 | 174 (5.1%) | 69 (2.6%) |
| $55,000 to $64,999 | 199 (5.9%) | 72 (2.8%) |
| $65,000 to $74,999 | 203 (6.0%) | 179 (6.9%) |
| $75,000 to $99,999 | 275 (8.1%) | 170 (6.5%) |
| $100,000+ | 486 (14.4%) | 125 (4.8%) |
| Total | 3,380 (100.0%) | 2,610 (100.0%) |
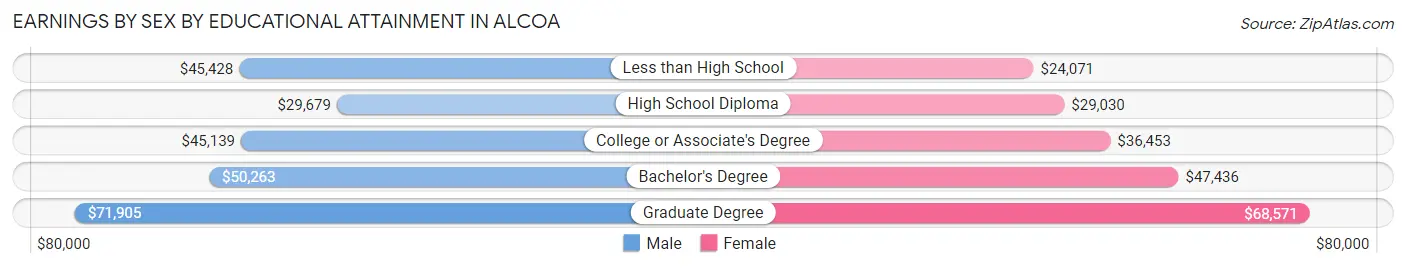
Earnings by Sex by Educational Attainment in Alcoa
Average earnings in Alcoa are $45,730 for men and $35,301 for women, a difference of 22.8%. Men with an educational attainment of graduate degree enjoy the highest average annual earnings of $71,905, while those with high school diploma education earn the least with $29,679. Women with an educational attainment of graduate degree earn the most with the average annual earnings of $68,571, while those with less than high school education have the smallest earnings of $24,071.
| Educational Attainment | Male Income | Female Income |
| Less than High School | $45,428 | $24,071 |
| High School Diploma | $29,679 | $29,030 |
| College or Associate's Degree | $45,139 | $36,453 |
| Bachelor's Degree | $50,263 | $47,436 |
| Graduate Degree | $71,905 | $68,571 |
| Total | $45,730 | $35,301 |
Family Income in Alcoa
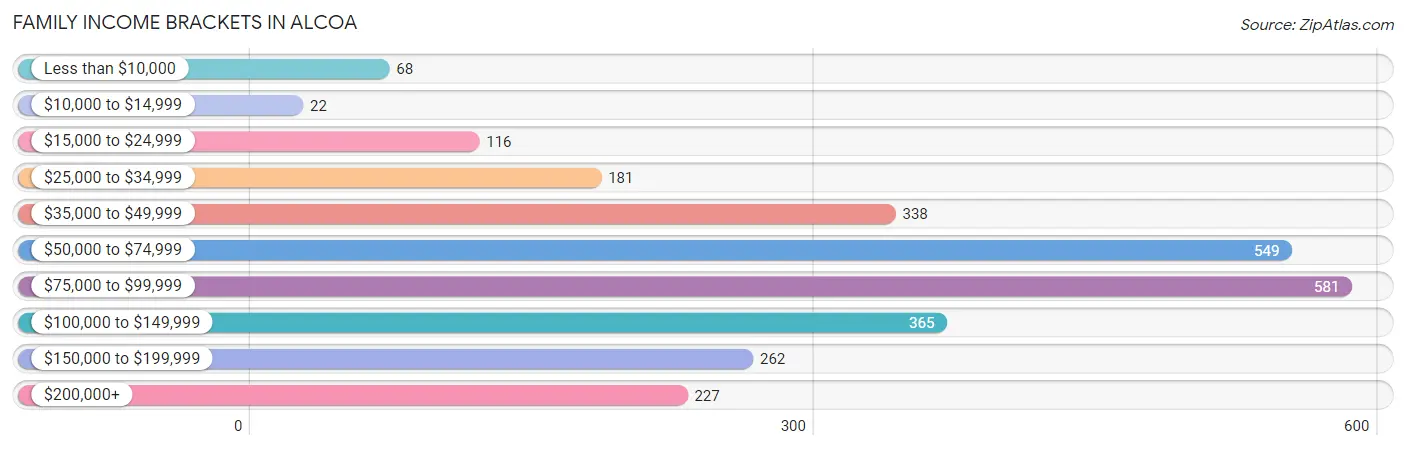
Family Income Brackets in Alcoa
According to the Alcoa family income data, there are 581 families falling into the $75,000 to $99,999 income range, which is the most common income bracket and makes up 21.5% of all families. Conversely, the $10,000 to $14,999 income bracket is the least frequent group with only 22 families (0.8%) belonging to this category.
| Income Bracket | # Families | % Families |
| Less than $10,000 | 68 | 2.5% |
| $10,000 to $14,999 | 22 | 0.8% |
| $15,000 to $24,999 | 116 | 4.3% |
| $25,000 to $34,999 | 181 | 6.7% |
| $35,000 to $49,999 | 338 | 12.5% |
| $50,000 to $74,999 | 549 | 20.3% |
| $75,000 to $99,999 | 581 | 21.5% |
| $100,000 to $149,999 | 365 | 13.5% |
| $150,000 to $199,999 | 262 | 9.7% |
| $200,000+ | 227 | 8.4% |
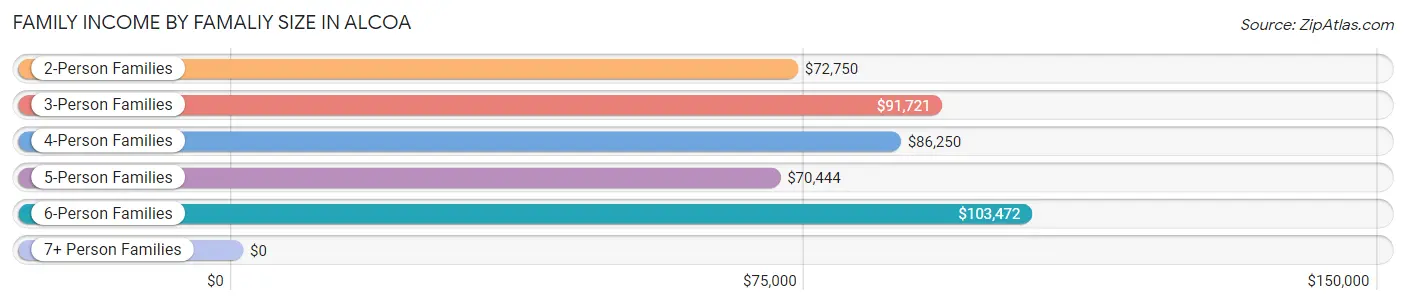
Family Income by Famaliy Size in Alcoa
6-person families (224 | 8.3%) account for the highest median family income in Alcoa with $103,472 per family, while 2-person families (1,597 | 59.1%) have the highest median income of $36,375 per family member.
| Income Bracket | # Families | Median Income |
| 2-Person Families | 1,597 (59.1%) | $72,750 |
| 3-Person Families | 451 (16.7%) | $91,721 |
| 4-Person Families | 296 (11.0%) | $86,250 |
| 5-Person Families | 135 (5.0%) | $70,444 |
| 6-Person Families | 224 (8.3%) | $103,472 |
| 7+ Person Families | 0 (0.0%) | $0 |
| Total | 2,703 (100.0%) | $76,484 |
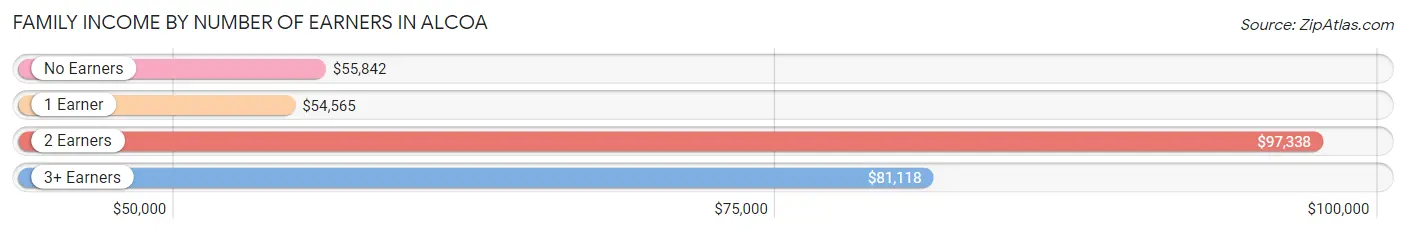
Family Income by Number of Earners in Alcoa
The median family income in Alcoa is $76,484, with families comprising 2 earners (1,184) having the highest median family income of $97,338, while families with 1 earner (872) have the lowest median family income of $54,565, accounting for 43.8% and 32.3% of families, respectively.
| Number of Earners | # Families | Median Income |
| No Earners | 502 (18.6%) | $55,842 |
| 1 Earner | 872 (32.3%) | $54,565 |
| 2 Earners | 1,184 (43.8%) | $97,338 |
| 3+ Earners | 145 (5.4%) | $81,118 |
| Total | 2,703 (100.0%) | $76,484 |
Household Income in Alcoa
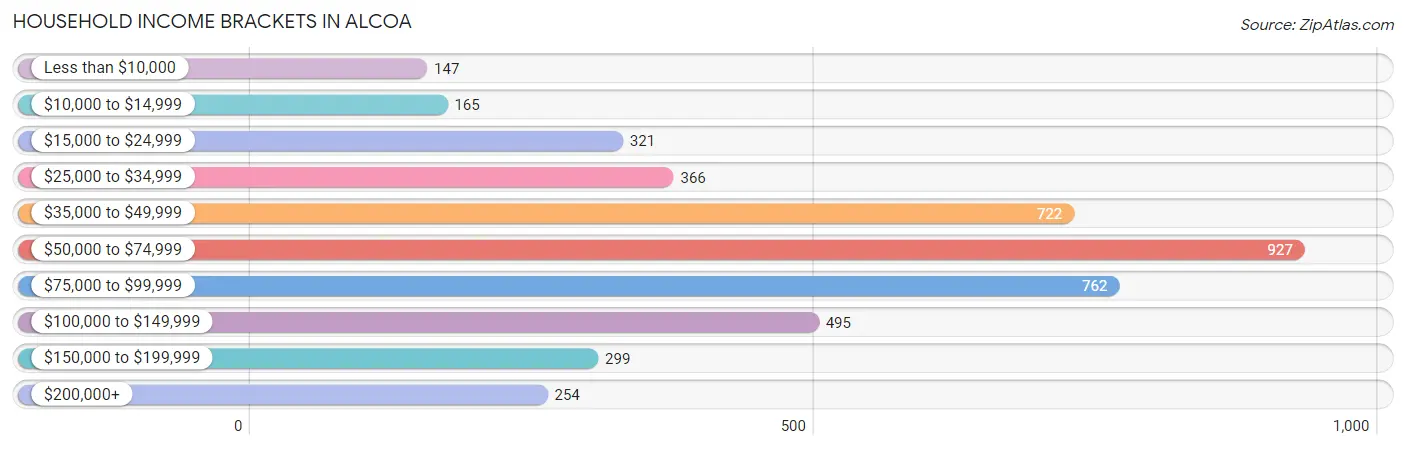
Household Income Brackets in Alcoa
With 927 households falling in the category, the $50,000 to $74,999 income range is the most frequent in Alcoa, accounting for 20.8% of all households. In contrast, only 147 households (3.3%) fall into the less than $10,000 income bracket, making it the least populous group.
| Income Bracket | # Households | % Households |
| Less than $10,000 | 147 | 3.3% |
| $10,000 to $14,999 | 165 | 3.7% |
| $15,000 to $24,999 | 321 | 7.2% |
| $25,000 to $34,999 | 366 | 8.2% |
| $35,000 to $49,999 | 722 | 16.2% |
| $50,000 to $74,999 | 927 | 20.8% |
| $75,000 to $99,999 | 762 | 17.1% |
| $100,000 to $149,999 | 495 | 11.1% |
| $150,000 to $199,999 | 299 | 6.7% |
| $200,000+ | 254 | 5.7% |
Household Income by Householder Age in Alcoa
The median household income in Alcoa is $63,580, with the highest median household income of $75,856 found in the 45 to 64 years age bracket for the primary householder. A total of 1,485 households (33.3%) fall into this category. Meanwhile, the 65+ years age bracket for the primary householder has the lowest median household income of $55,451, with 1,253 households (28.1%) in this group.
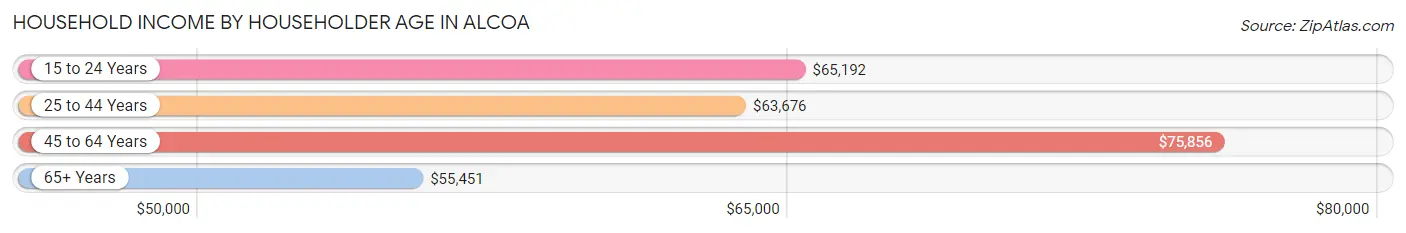
| Income Bracket | # Households | Median Income |
| 15 to 24 Years | 156 (3.5%) | $65,192 |
| 25 to 44 Years | 1,564 (35.1%) | $63,676 |
| 45 to 64 Years | 1,485 (33.3%) | $75,856 |
| 65+ Years | 1,253 (28.1%) | $55,451 |
| Total | 4,458 (100.0%) | $63,580 |
Poverty in Alcoa
Income Below Poverty by Sex and Age in Alcoa
With 9.4% poverty level for males and 14.0% for females among the residents of Alcoa, 16 and 17 year old males and 15 year old females are the most vulnerable to poverty, with 32 males (40.0%) and 27 females (50.9%) in their respective age groups living below the poverty level.
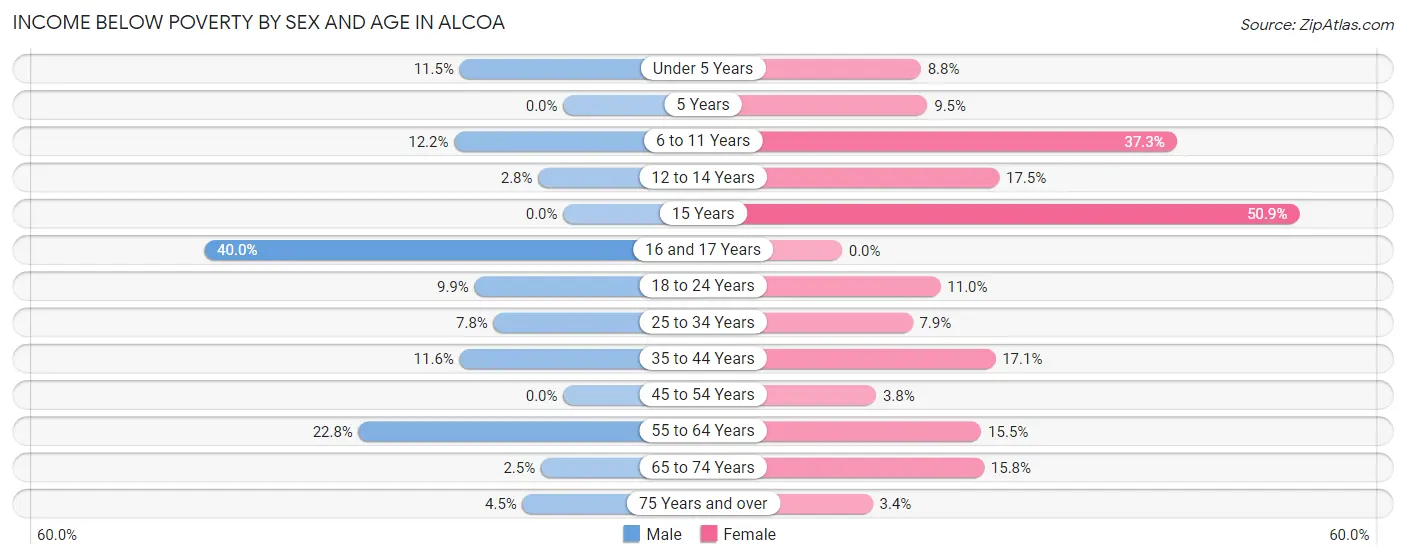
| Age Bracket | Male | Female |
| Under 5 Years | 33 (11.5%) | 32 (8.8%) |
| 5 Years | 0 (0.0%) | 8 (9.5%) |
| 6 to 11 Years | 70 (12.1%) | 230 (37.3%) |
| 12 to 14 Years | 5 (2.8%) | 38 (17.5%) |
| 15 Years | 0 (0.0%) | 27 (50.9%) |
| 16 and 17 Years | 32 (40.0%) | 0 (0.0%) |
| 18 to 24 Years | 34 (9.9%) | 28 (11.0%) |
| 25 to 34 Years | 89 (7.8%) | 73 (7.9%) |
| 35 to 44 Years | 84 (11.6%) | 100 (17.1%) |
| 45 to 54 Years | 0 (0.0%) | 23 (3.8%) |
| 55 to 64 Years | 139 (22.8%) | 106 (15.5%) |
| 65 to 74 Years | 9 (2.5%) | 90 (15.8%) |
| 75 Years and over | 24 (4.5%) | 18 (3.4%) |
| Total | 519 (9.4%) | 773 (14.0%) |
Income Above Poverty by Sex and Age in Alcoa
According to the poverty statistics in Alcoa, males aged 5 years and females aged 16 and 17 years are the age groups that are most secure financially, with 100.0% of males and 100.0% of females in these age groups living above the poverty line.
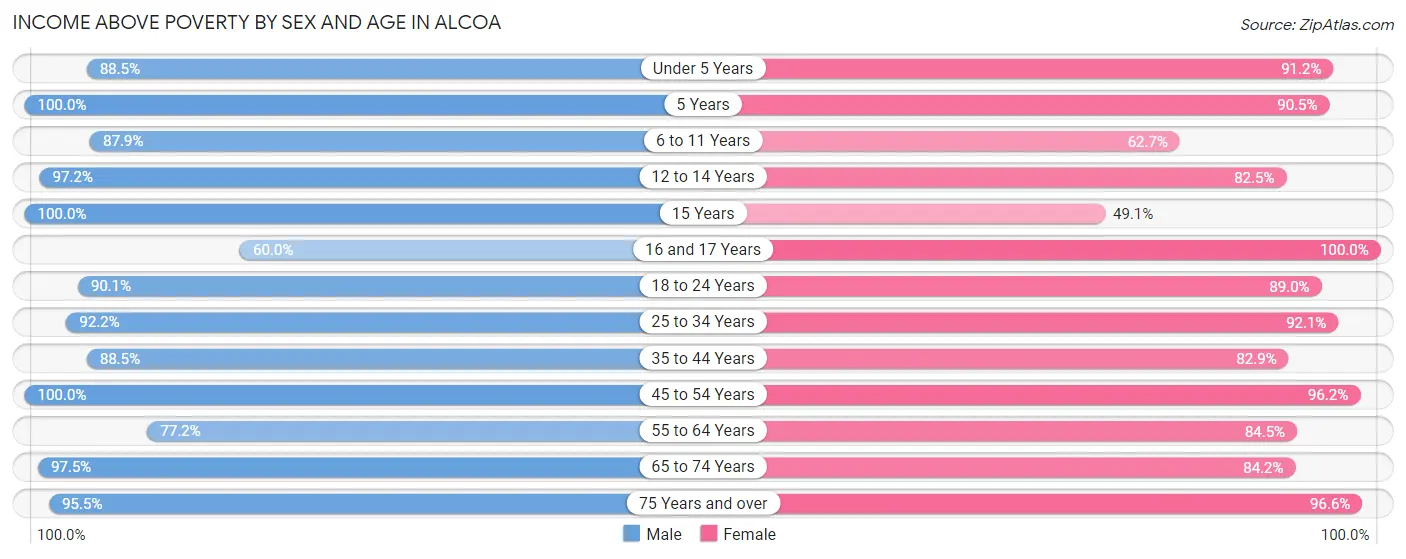
| Age Bracket | Male | Female |
| Under 5 Years | 253 (88.5%) | 332 (91.2%) |
| 5 Years | 34 (100.0%) | 76 (90.5%) |
| 6 to 11 Years | 506 (87.8%) | 387 (62.7%) |
| 12 to 14 Years | 175 (97.2%) | 179 (82.5%) |
| 15 Years | 31 (100.0%) | 26 (49.1%) |
| 16 and 17 Years | 48 (60.0%) | 58 (100.0%) |
| 18 to 24 Years | 310 (90.1%) | 227 (89.0%) |
| 25 to 34 Years | 1,058 (92.2%) | 854 (92.1%) |
| 35 to 44 Years | 643 (88.4%) | 485 (82.9%) |
| 45 to 54 Years | 618 (100.0%) | 581 (96.2%) |
| 55 to 64 Years | 471 (77.2%) | 577 (84.5%) |
| 65 to 74 Years | 354 (97.5%) | 479 (84.2%) |
| 75 Years and over | 506 (95.5%) | 508 (96.6%) |
| Total | 5,007 (90.6%) | 4,769 (86.1%) |
Income Below Poverty Among Married-Couple Families in Alcoa
The poverty statistics for married-couple families in Alcoa show that 2.9% or 52 of the total 1,812 families live below the poverty line. Families with 1 or 2 children have the highest poverty rate of 9.8%, comprising of 43 families. On the other hand, families with 3 or 4 children have the lowest poverty rate of 0.0%, which includes 0 families.
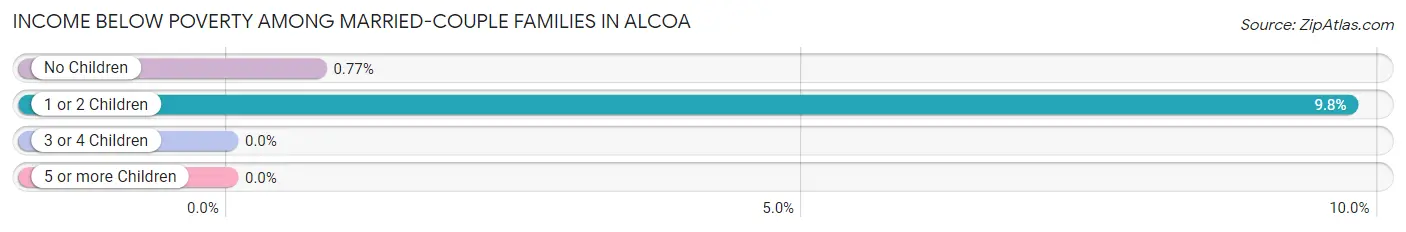
| Children | Above Poverty | Below Poverty |
| No Children | 1,164 (99.2%) | 9 (0.8%) |
| 1 or 2 Children | 398 (90.2%) | 43 (9.8%) |
| 3 or 4 Children | 198 (100.0%) | 0 (0.0%) |
| 5 or more Children | 0 (0.0%) | 0 (0.0%) |
| Total | 1,760 (97.1%) | 52 (2.9%) |
Income Below Poverty Among Single-Parent Households in Alcoa
According to the poverty data in Alcoa, 13.9% or 35 single-father households and 8.8% or 56 single-mother households are living below the poverty line. Among single-father households, those with 3 or 4 children have the highest poverty rate, with 16 households (29.1%) experiencing poverty. Likewise, among single-mother households, those with 3 or 4 children have the highest poverty rate, with 33 households (45.2%) falling below the poverty line.
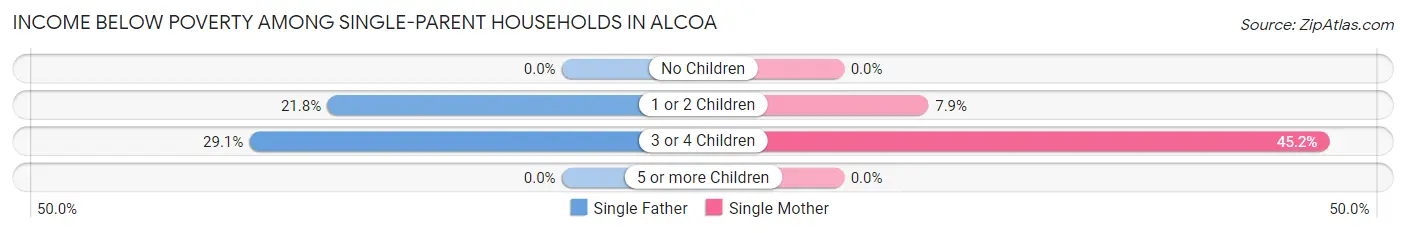
| Children | Single Father | Single Mother |
| No Children | 0 (0.0%) | 0 (0.0%) |
| 1 or 2 Children | 19 (21.8%) | 23 (7.9%) |
| 3 or 4 Children | 16 (29.1%) | 33 (45.2%) |
| 5 or more Children | 0 (0.0%) | 0 (0.0%) |
| Total | 35 (13.9%) | 56 (8.8%) |
Income Below Poverty Among Married-Couple vs Single-Parent Households in Alcoa
The poverty data for Alcoa shows that 52 of the married-couple family households (2.9%) and 91 of the single-parent households (10.2%) are living below the poverty level. Within the married-couple family households, those with 1 or 2 children have the highest poverty rate, with 43 households (9.8%) falling below the poverty line. Among the single-parent households, those with 3 or 4 children have the highest poverty rate, with 49 household (38.3%) living below poverty.
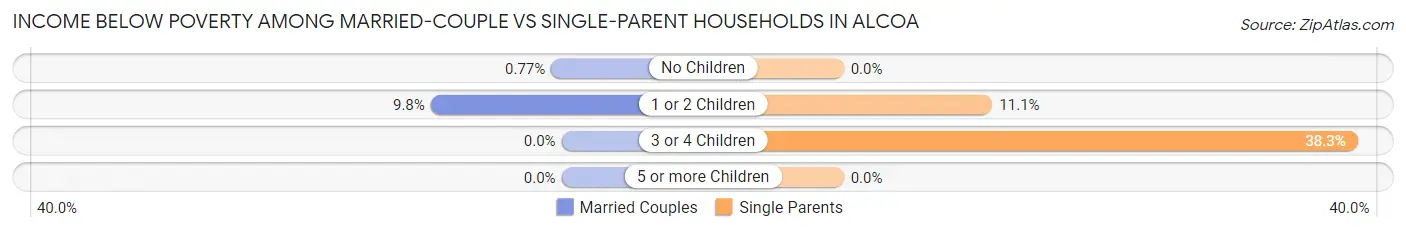
| Children | Married-Couple Families | Single-Parent Households |
| No Children | 9 (0.8%) | 0 (0.0%) |
| 1 or 2 Children | 43 (9.8%) | 42 (11.1%) |
| 3 or 4 Children | 0 (0.0%) | 49 (38.3%) |
| 5 or more Children | 0 (0.0%) | 0 (0.0%) |
| Total | 52 (2.9%) | 91 (10.2%) |
Race in Alcoa
The most populous races in Alcoa are White / Caucasian (8,524 | 76.8%), Black / African American (1,171 | 10.5%), and Two or more Races (1,103 | 9.9%).
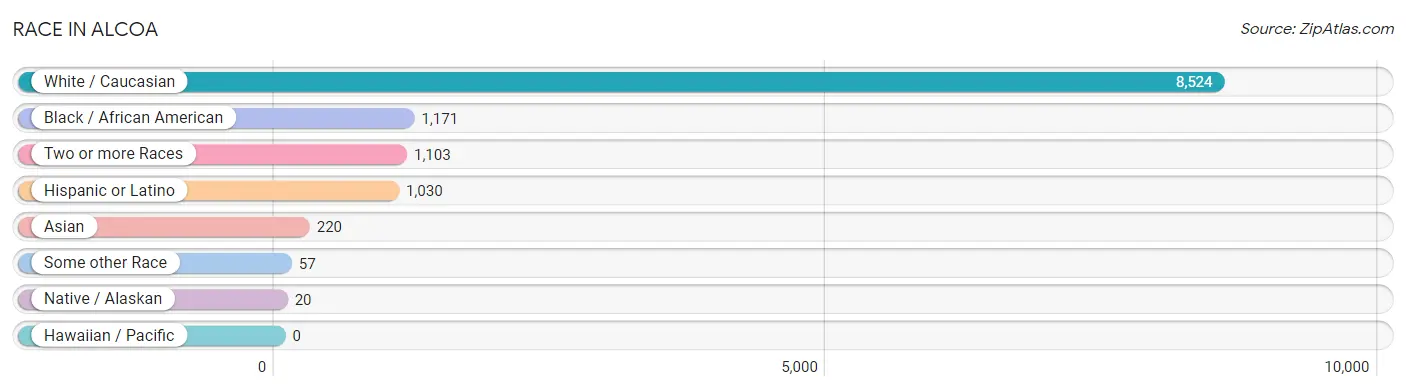
| Race | # Population | % Population |
| Asian | 220 | 2.0% |
| Black / African American | 1,171 | 10.5% |
| Hawaiian / Pacific | 0 | 0.0% |
| Hispanic or Latino | 1,030 | 9.3% |
| Native / Alaskan | 20 | 0.2% |
| White / Caucasian | 8,524 | 76.8% |
| Two or more Races | 1,103 | 9.9% |
| Some other Race | 57 | 0.5% |
| Total | 11,095 | 100.0% |
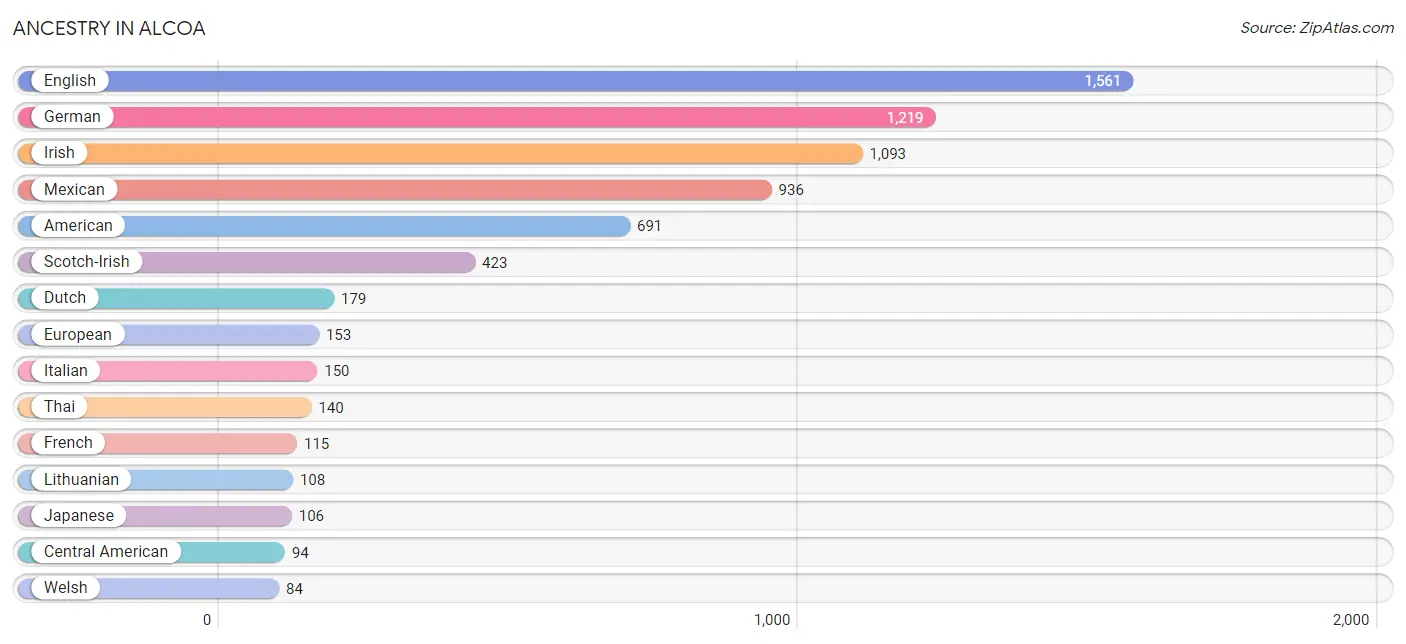
Ancestry in Alcoa
The most populous ancestries reported in Alcoa are English (1,561 | 14.1%), German (1,219 | 11.0%), Irish (1,093 | 9.9%), Mexican (936 | 8.4%), and American (691 | 6.2%), together accounting for 49.6% of all Alcoa residents.
| Ancestry | # Population | % Population |
| American | 691 | 6.2% |
| British | 48 | 0.4% |
| Burmese | 15 | 0.1% |
| Central American | 94 | 0.9% |
| Central American Indian | 19 | 0.2% |
| Cherokee | 52 | 0.5% |
| Dutch | 179 | 1.6% |
| English | 1,561 | 14.1% |
| European | 153 | 1.4% |
| French | 115 | 1.0% |
| German | 1,219 | 11.0% |
| Greek | 15 | 0.1% |
| Guatemalan | 23 | 0.2% |
| Indian (Asian) | 46 | 0.4% |
| Irish | 1,093 | 9.9% |
| Italian | 150 | 1.3% |
| Japanese | 106 | 1.0% |
| Lithuanian | 108 | 1.0% |
| Mexican | 936 | 8.4% |
| Mexican American Indian | 13 | 0.1% |
| Nicaraguan | 13 | 0.1% |
| Northern European | 11 | 0.1% |
| Norwegian | 59 | 0.5% |
| Polish | 66 | 0.6% |
| Romanian | 14 | 0.1% |
| Salvadoran | 58 | 0.5% |
| Scotch-Irish | 423 | 3.8% |
| Scottish | 81 | 0.7% |
| Swedish | 52 | 0.5% |
| Thai | 140 | 1.3% |
| Welsh | 84 | 0.8% | View All 31 Rows |
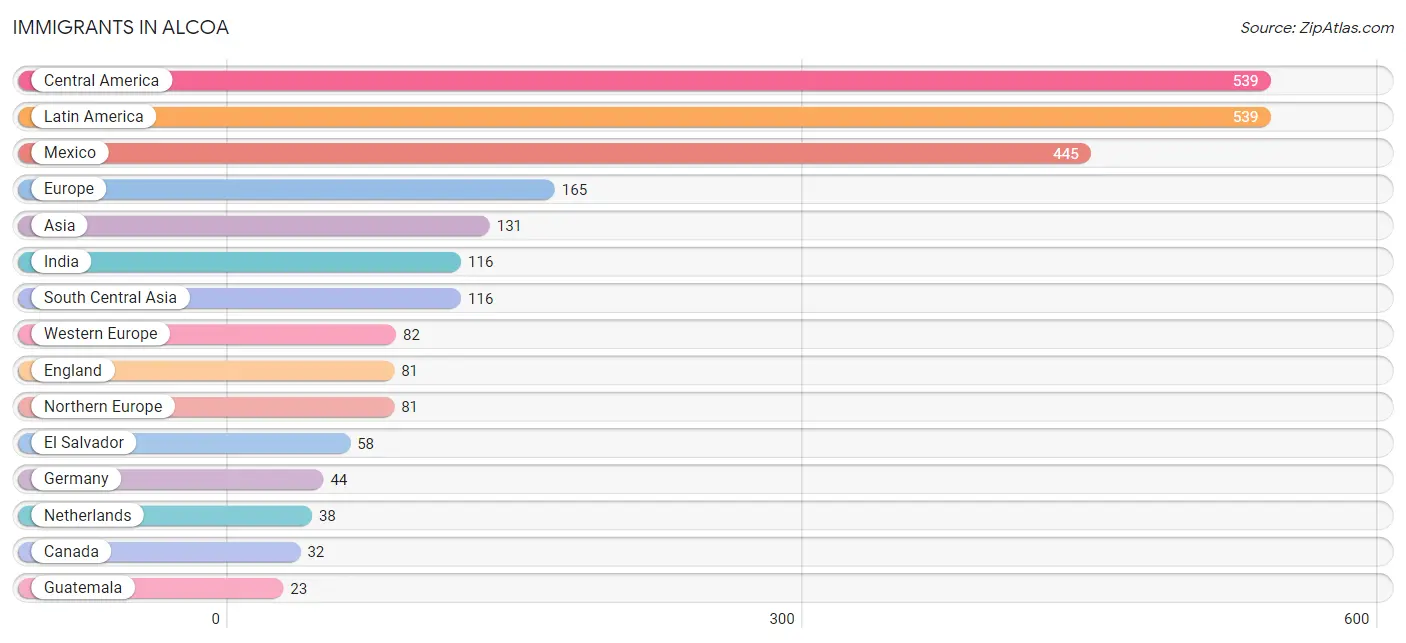
Immigrants in Alcoa
The most numerous immigrant groups reported in Alcoa came from Central America (539 | 4.9%), Latin America (539 | 4.9%), Mexico (445 | 4.0%), Europe (165 | 1.5%), and Asia (131 | 1.2%), together accounting for 16.4% of all Alcoa residents.
| Immigration Origin | # Population | % Population |
| Asia | 131 | 1.2% |
| Canada | 32 | 0.3% |
| Central America | 539 | 4.9% |
| Eastern Asia | 15 | 0.1% |
| Eastern Europe | 2 | 0.0% |
| El Salvador | 58 | 0.5% |
| England | 81 | 0.7% |
| Europe | 165 | 1.5% |
| Germany | 44 | 0.4% |
| Guatemala | 23 | 0.2% |
| India | 116 | 1.1% |
| Korea | 15 | 0.1% |
| Latin America | 539 | 4.9% |
| Mexico | 445 | 4.0% |
| Netherlands | 38 | 0.3% |
| Nicaragua | 13 | 0.1% |
| Northern Europe | 81 | 0.7% |
| Poland | 2 | 0.0% |
| South Central Asia | 116 | 1.1% |
| Western Europe | 82 | 0.7% | View All 20 Rows |
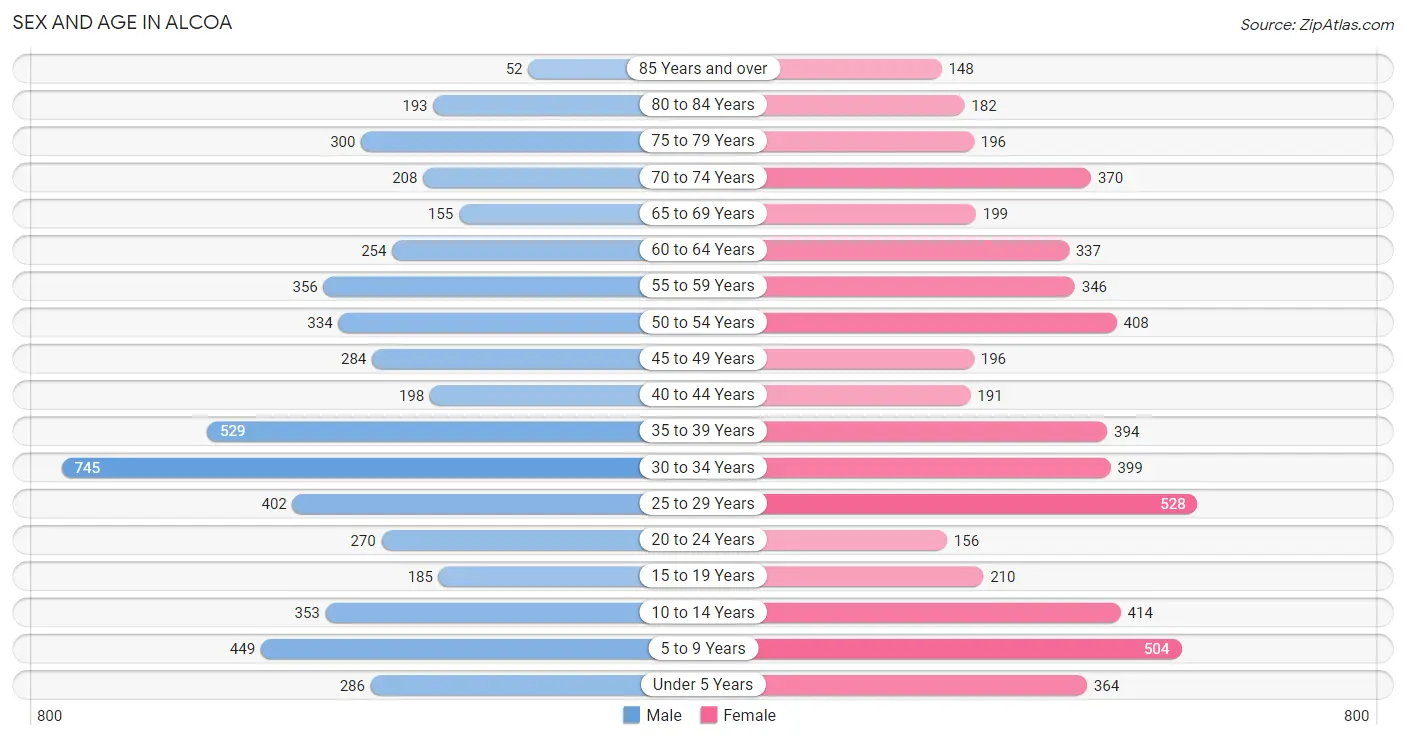
Sex and Age in Alcoa
Sex and Age in Alcoa
The most populous age groups in Alcoa are 30 to 34 Years (745 | 13.4%) for men and 25 to 29 Years (528 | 9.5%) for women.
| Age Bracket | Male | Female |
| Under 5 Years | 286 (5.1%) | 364 (6.6%) |
| 5 to 9 Years | 449 (8.1%) | 504 (9.1%) |
| 10 to 14 Years | 353 (6.4%) | 414 (7.5%) |
| 15 to 19 Years | 185 (3.3%) | 210 (3.8%) |
| 20 to 24 Years | 270 (4.9%) | 156 (2.8%) |
| 25 to 29 Years | 402 (7.2%) | 528 (9.5%) |
| 30 to 34 Years | 745 (13.4%) | 399 (7.2%) |
| 35 to 39 Years | 529 (9.5%) | 394 (7.1%) |
| 40 to 44 Years | 198 (3.6%) | 191 (3.5%) |
| 45 to 49 Years | 284 (5.1%) | 196 (3.5%) |
| 50 to 54 Years | 334 (6.0%) | 408 (7.4%) |
| 55 to 59 Years | 356 (6.4%) | 346 (6.2%) |
| 60 to 64 Years | 254 (4.6%) | 337 (6.1%) |
| 65 to 69 Years | 155 (2.8%) | 199 (3.6%) |
| 70 to 74 Years | 208 (3.7%) | 370 (6.7%) |
| 75 to 79 Years | 300 (5.4%) | 196 (3.5%) |
| 80 to 84 Years | 193 (3.5%) | 182 (3.3%) |
| 85 Years and over | 52 (0.9%) | 148 (2.7%) |
| Total | 5,553 (100.0%) | 5,542 (100.0%) |
Families and Households in Alcoa
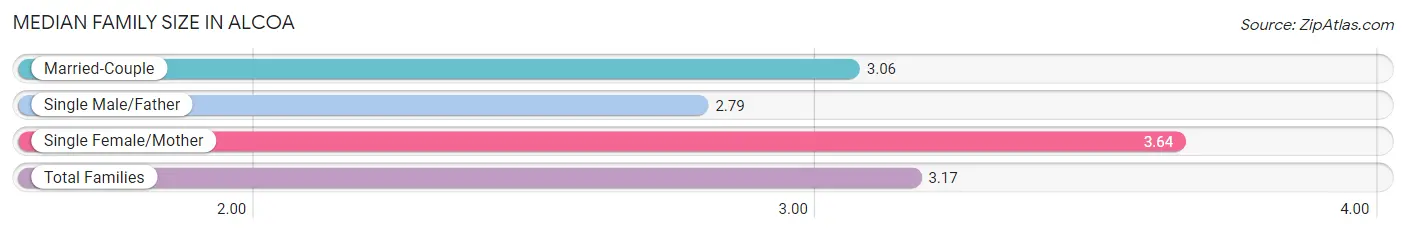
Median Family Size in Alcoa
The median family size in Alcoa is 3.17 persons per family, with single female/mother families (639 | 23.6%) accounting for the largest median family size of 3.64 persons per family. On the other hand, single male/father families (252 | 9.3%) represent the smallest median family size with 2.79 persons per family.
| Family Type | # Families | Family Size |
| Married-Couple | 1,812 (67.0%) | 3.06 |
| Single Male/Father | 252 (9.3%) | 2.79 |
| Single Female/Mother | 639 (23.6%) | 3.64 |
| Total Families | 2,703 (100.0%) | 3.17 |
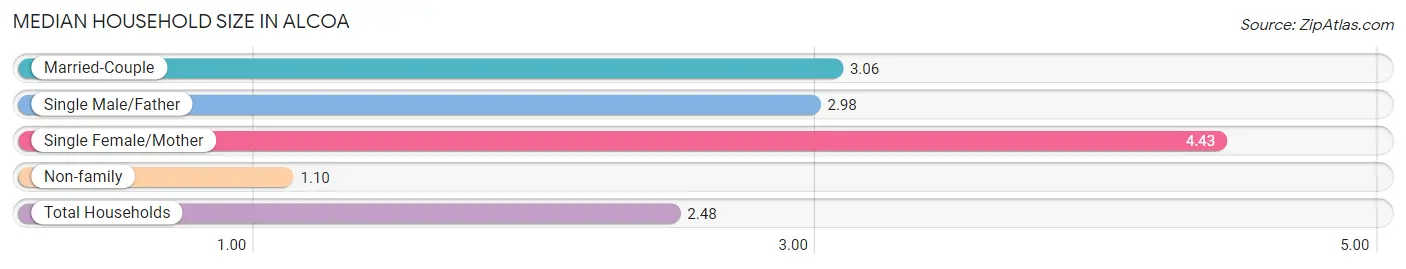
Median Household Size in Alcoa
The median household size in Alcoa is 2.48 persons per household, with single female/mother households (639 | 14.3%) accounting for the largest median household size of 4.43 persons per household. non-family households (1,755 | 39.4%) represent the smallest median household size with 1.10 persons per household.
| Household Type | # Households | Household Size |
| Married-Couple | 1,812 (40.6%) | 3.06 |
| Single Male/Father | 252 (5.7%) | 2.98 |
| Single Female/Mother | 639 (14.3%) | 4.43 |
| Non-family | 1,755 (39.4%) | 1.10 |
| Total Households | 4,458 (100.0%) | 2.48 |
Household Size by Marriage Status in Alcoa
Out of a total of 4,458 households in Alcoa, 2,703 (60.6%) are family households, while 1,755 (39.4%) are nonfamily households. The most numerous type of family households are 2-person households, comprising 1,437, and the most common type of nonfamily households are 1-person households, comprising 1,595.
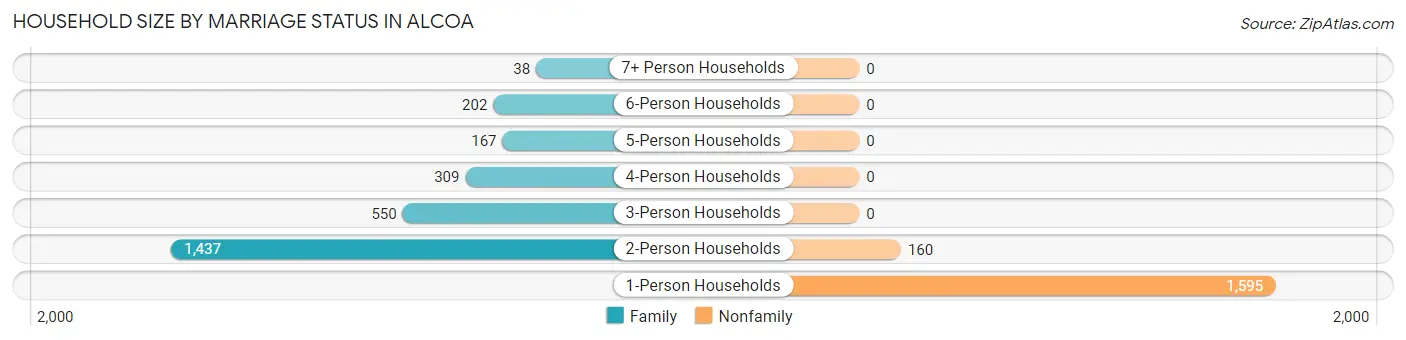
| Household Size | Family Households | Nonfamily Households |
| 1-Person Households | - | 1,595 (35.8%) |
| 2-Person Households | 1,437 (32.2%) | 160 (3.6%) |
| 3-Person Households | 550 (12.3%) | 0 (0.0%) |
| 4-Person Households | 309 (6.9%) | 0 (0.0%) |
| 5-Person Households | 167 (3.7%) | 0 (0.0%) |
| 6-Person Households | 202 (4.5%) | 0 (0.0%) |
| 7+ Person Households | 38 (0.9%) | 0 (0.0%) |
| Total | 2,703 (60.6%) | 1,755 (39.4%) |
Female Fertility in Alcoa
Fertility by Age in Alcoa
Average fertility rate in Alcoa is 56.0 births per 1,000 women. Women in the age bracket of 20 to 34 years have the highest fertility rate with 79.0 births per 1,000 women. Women in the age bracket of 20 to 34 years acount for 69.4% of all women with births.
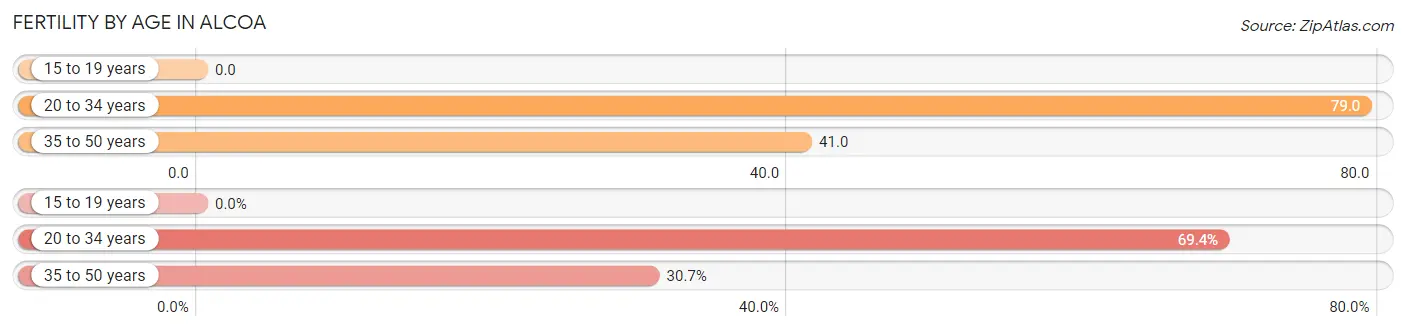
| Age Bracket | Women with Births | Births / 1,000 Women |
| 15 to 19 years | 0 (0.0%) | 0.0 |
| 20 to 34 years | 86 (69.4%) | 79.0 |
| 35 to 50 years | 38 (30.6%) | 41.0 |
| Total | 124 (100.0%) | 56.0 |
Fertility by Age by Marriage Status in Alcoa
87.9% of women with births (124) in Alcoa are married. The highest percentage of unmarried women with births falls into 20 to 34 years age bracket with 12.8% of them unmarried at the time of birth, while the lowest percentage of unmarried women with births belong to 35 to 50 years age bracket with 10.5% of them unmarried.
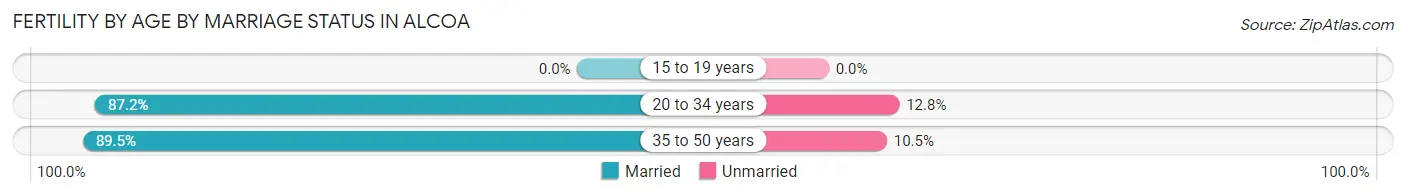
| Age Bracket | Married | Unmarried |
| 15 to 19 years | 0 (0.0%) | 0 (0.0%) |
| 20 to 34 years | 75 (87.2%) | 11 (12.8%) |
| 35 to 50 years | 34 (89.5%) | 4 (10.5%) |
| Total | 109 (87.9%) | 15 (12.1%) |
Fertility by Education in Alcoa
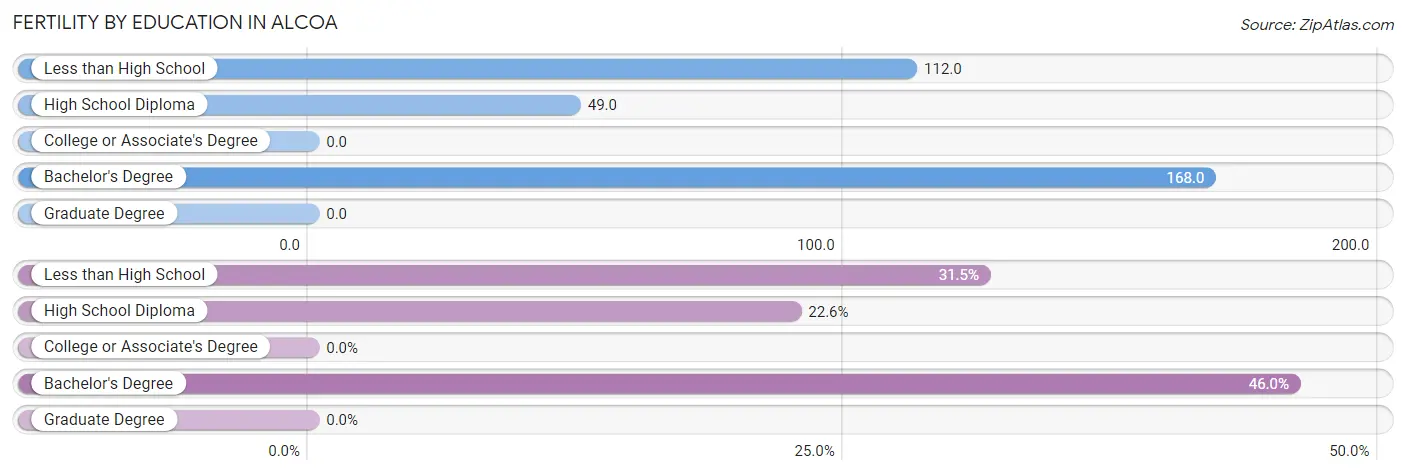
| Educational Attainment | Women with Births | Births / 1,000 Women |
| Less than High School | 39 (31.5%) | 112.0 |
| High School Diploma | 28 (22.6%) | 49.0 |
| College or Associate's Degree | 0 (0.0%) | 0.0 |
| Bachelor's Degree | 57 (46.0%) | 168.0 |
| Graduate Degree | 0 (0.0%) | 0.0 |
| Total | 124 (100.0%) | 56.0 |
Fertility by Education by Marriage Status in Alcoa
12.1% of women with births in Alcoa are unmarried. Women with the educational attainment of less than high school are most likely to be married with 100.0% of them married at childbirth, while women with the educational attainment of high school diploma are least likely to be married with 53.6% of them unmarried at childbirth.
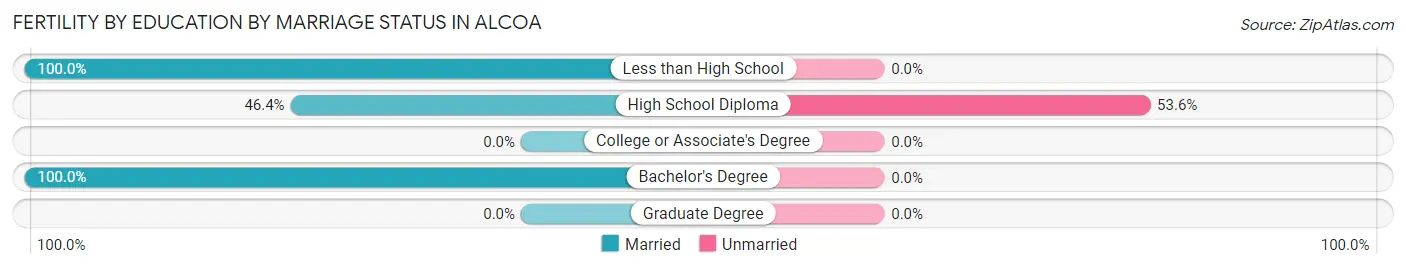
| Educational Attainment | Married | Unmarried |
| Less than High School | 39 (100.0%) | 0 (0.0%) |
| High School Diploma | 13 (46.4%) | 15 (53.6%) |
| College or Associate's Degree | 0 (0.0%) | 0 (0.0%) |
| Bachelor's Degree | 57 (100.0%) | 0 (0.0%) |
| Graduate Degree | 0 (0.0%) | 0 (0.0%) |
| Total | 109 (87.9%) | 15 (12.1%) |
Employment Characteristics in Alcoa
Employment by Class of Employer in Alcoa
Among the 5,681 employed individuals in Alcoa, private company employees (4,116 | 72.5%), not-for-profit organizations (625 | 11.0%), and local government employees (327 | 5.8%) make up the most common classes of employment.
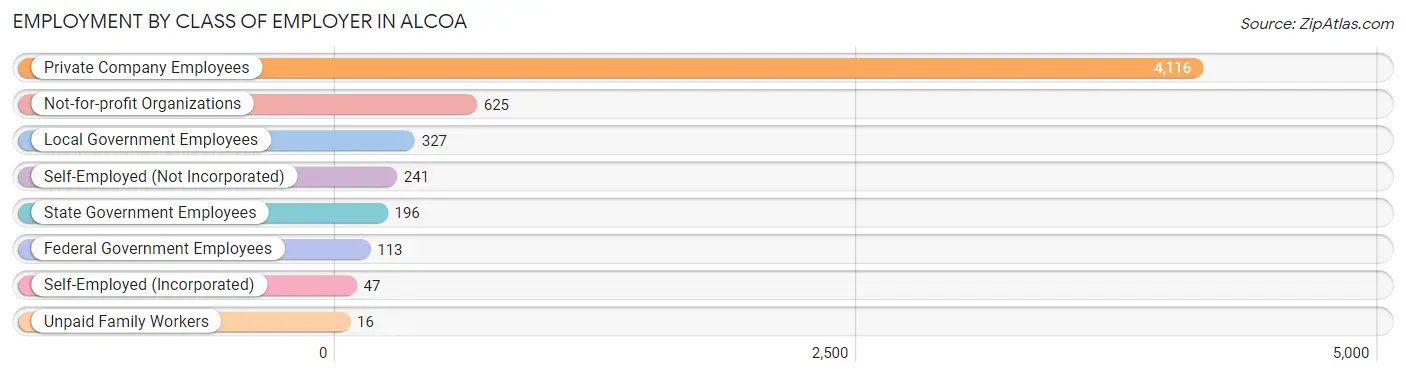
| Employer Class | # Employees | % Employees |
| Private Company Employees | 4,116 | 72.5% |
| Self-Employed (Incorporated) | 47 | 0.8% |
| Self-Employed (Not Incorporated) | 241 | 4.2% |
| Not-for-profit Organizations | 625 | 11.0% |
| Local Government Employees | 327 | 5.8% |
| State Government Employees | 196 | 3.5% |
| Federal Government Employees | 113 | 2.0% |
| Unpaid Family Workers | 16 | 0.3% |
| Total | 5,681 | 100.0% |
Employment Status by Age in Alcoa
According to the labor force statistics for Alcoa, out of the total population over 16 years of age (8,641), 68.8% or 5,945 individuals are in the labor force, with 4.0% or 238 of them unemployed. The age group with the highest labor force participation rate is 25 to 29 years, with 98.0% or 911 individuals in the labor force. Within the labor force, the 75 years and over age range has the highest percentage of unemployed individuals, with 12.3% or 15 of them being unemployed.
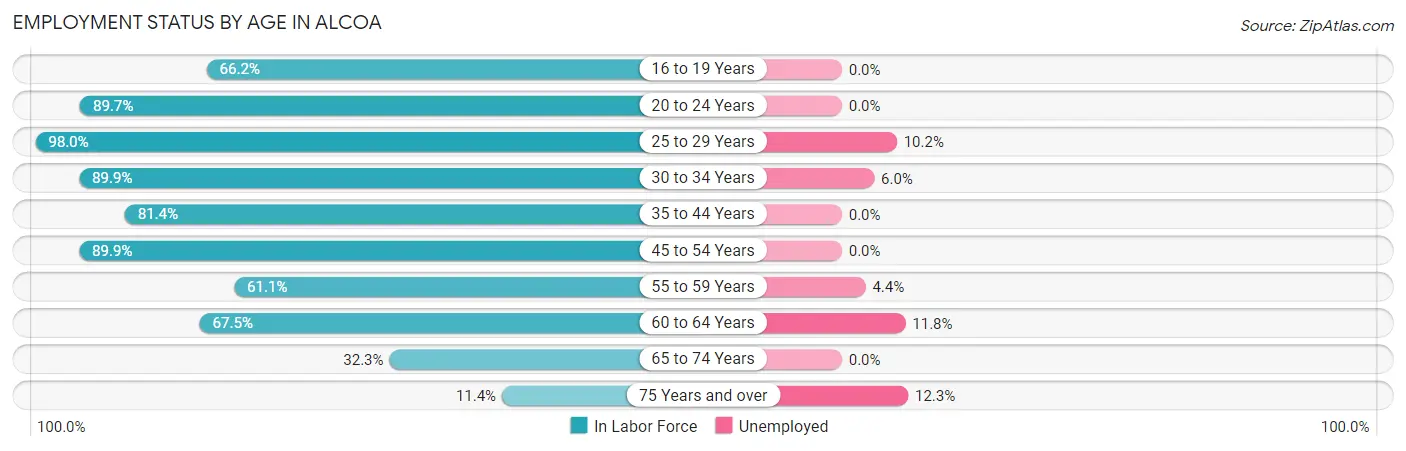
| Age Bracket | In Labor Force | Unemployed |
| 16 to 19 Years | 206 (66.2%) | 0 (0.0%) |
| 20 to 24 Years | 382 (89.7%) | 0 (0.0%) |
| 25 to 29 Years | 911 (98.0%) | 93 (10.2%) |
| 30 to 34 Years | 1,028 (89.9%) | 62 (6.0%) |
| 35 to 44 Years | 1,068 (81.4%) | 0 (0.0%) |
| 45 to 54 Years | 1,099 (89.9%) | 0 (0.0%) |
| 55 to 59 Years | 429 (61.1%) | 19 (4.4%) |
| 60 to 64 Years | 399 (67.5%) | 47 (11.8%) |
| 65 to 74 Years | 301 (32.3%) | 0 (0.0%) |
| 75 Years and over | 122 (11.4%) | 15 (12.3%) |
| Total | 5,945 (68.8%) | 238 (4.0%) |
Employment Status by Educational Attainment in Alcoa
According to labor force statistics for Alcoa, 83.6% of individuals (4,933) out of the total population between 25 and 64 years of age (5,901) are in the labor force, with 4.5% or 222 of them being unemployed. The group with the highest labor force participation rate are those with the educational attainment of bachelor's degree or higher, with 89.4% or 1,591 individuals in the labor force. Within the labor force, individuals with bachelor's degree or higher education have the highest percentage of unemployment, with 6.9% or 110 of them being unemployed.
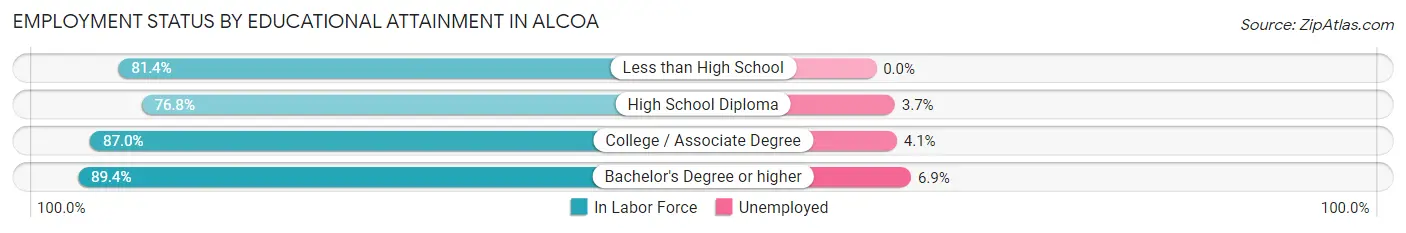
| Educational Attainment | In Labor Force | Unemployed |
| Less than High School | 498 (81.4%) | 0 (0.0%) |
| High School Diploma | 1,558 (76.8%) | 75 (3.7%) |
| College / Associate Degree | 1,288 (87.0%) | 61 (4.1%) |
| Bachelor's Degree or higher | 1,591 (89.4%) | 123 (6.9%) |
| Total | 4,933 (83.6%) | 266 (4.5%) |
Employment Occupations by Sex in Alcoa
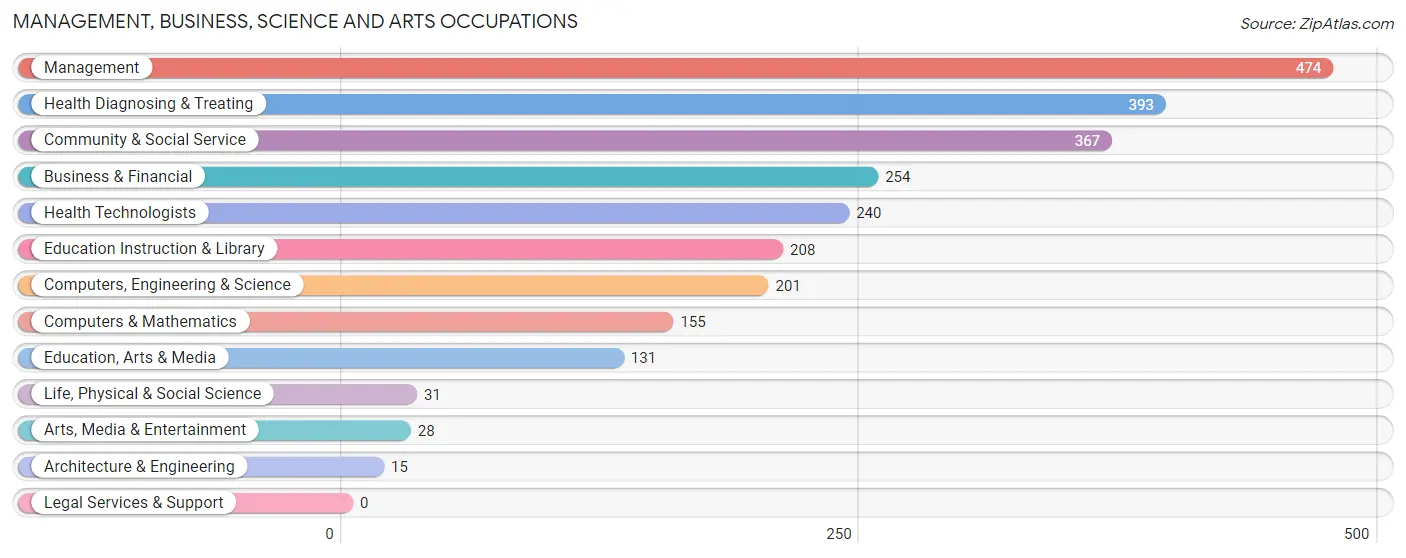
Management, Business, Science and Arts Occupations
The most common Management, Business, Science and Arts occupations in Alcoa are Management (474 | 8.3%), Health Diagnosing & Treating (393 | 6.9%), Community & Social Service (367 | 6.4%), Business & Financial (254 | 4.4%), and Health Technologists (240 | 4.2%).
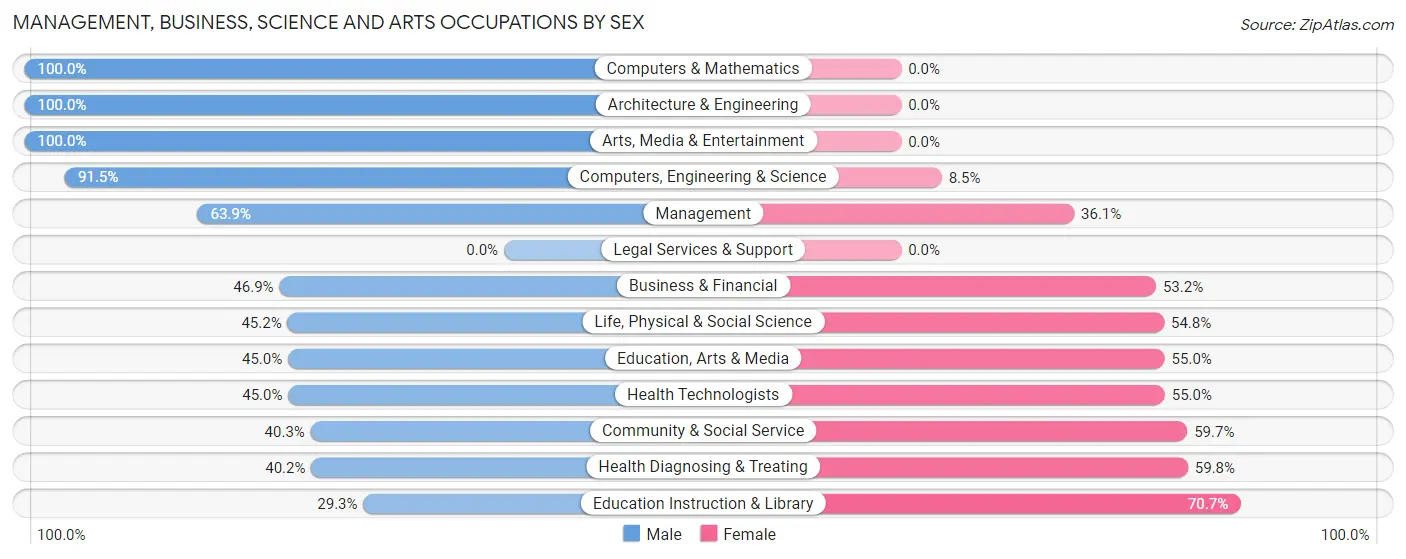
Management, Business, Science and Arts Occupations by Sex
Within the Management, Business, Science and Arts occupations in Alcoa, the most male-oriented occupations are Computers & Mathematics (100.0%), Architecture & Engineering (100.0%), and Arts, Media & Entertainment (100.0%), while the most female-oriented occupations are Education Instruction & Library (70.7%), Health Diagnosing & Treating (59.8%), and Community & Social Service (59.7%).
| Occupation | Male | Female |
| Management | 303 (63.9%) | 171 (36.1%) |
| Business & Financial | 119 (46.9%) | 135 (53.1%) |
| Computers, Engineering & Science | 184 (91.5%) | 17 (8.5%) |
| Computers & Mathematics | 155 (100.0%) | 0 (0.0%) |
| Architecture & Engineering | 15 (100.0%) | 0 (0.0%) |
| Life, Physical & Social Science | 14 (45.2%) | 17 (54.8%) |
| Community & Social Service | 148 (40.3%) | 219 (59.7%) |
| Education, Arts & Media | 59 (45.0%) | 72 (55.0%) |
| Legal Services & Support | 0 (0.0%) | 0 (0.0%) |
| Education Instruction & Library | 61 (29.3%) | 147 (70.7%) |
| Arts, Media & Entertainment | 28 (100.0%) | 0 (0.0%) |
| Health Diagnosing & Treating | 158 (40.2%) | 235 (59.8%) |
| Health Technologists | 108 (45.0%) | 132 (55.0%) |
| Total (Category) | 912 (54.0%) | 777 (46.0%) |
| Total (Overall) | 3,169 (55.5%) | 2,540 (44.5%) |
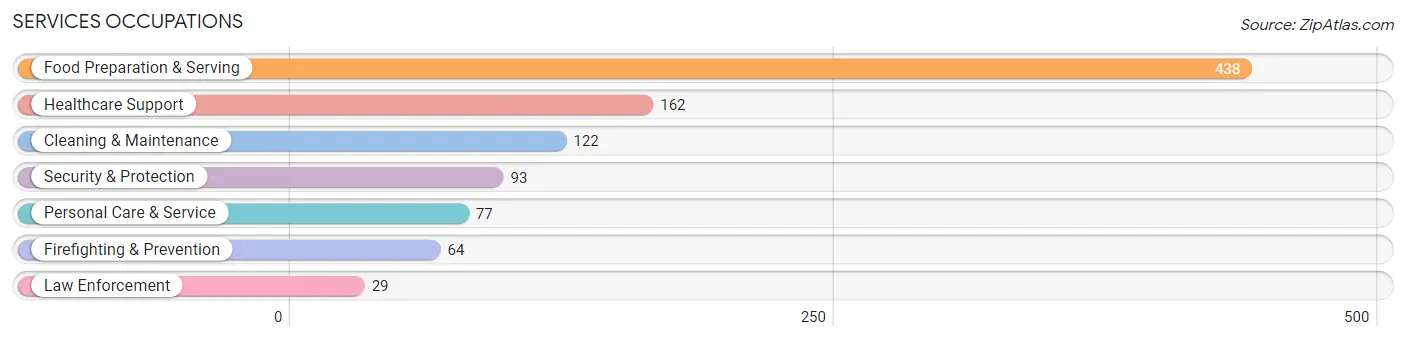
Services Occupations
The most common Services occupations in Alcoa are Food Preparation & Serving (438 | 7.7%), Healthcare Support (162 | 2.8%), Cleaning & Maintenance (122 | 2.1%), Security & Protection (93 | 1.6%), and Personal Care & Service (77 | 1.3%).
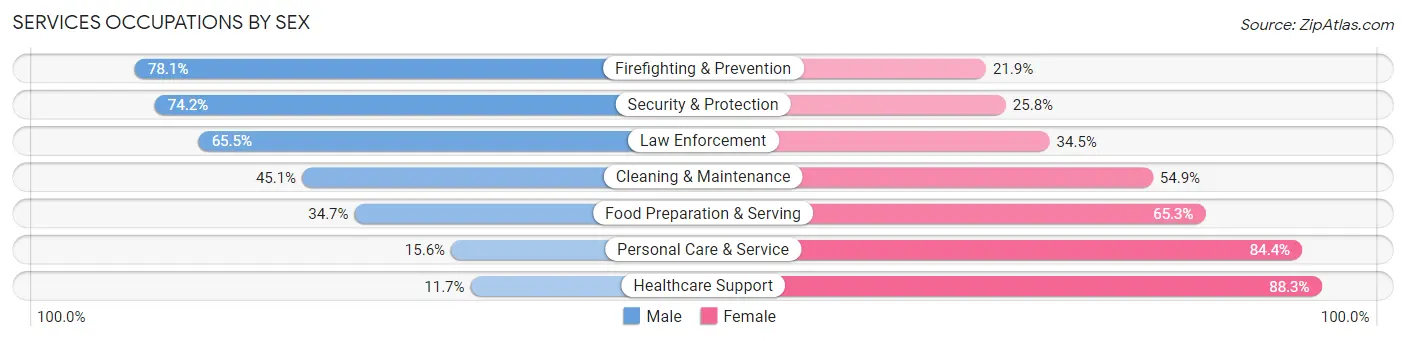
Services Occupations by Sex
Within the Services occupations in Alcoa, the most male-oriented occupations are Firefighting & Prevention (78.1%), Security & Protection (74.2%), and Law Enforcement (65.5%), while the most female-oriented occupations are Healthcare Support (88.3%), Personal Care & Service (84.4%), and Food Preparation & Serving (65.3%).
| Occupation | Male | Female |
| Healthcare Support | 19 (11.7%) | 143 (88.3%) |
| Security & Protection | 69 (74.2%) | 24 (25.8%) |
| Firefighting & Prevention | 50 (78.1%) | 14 (21.9%) |
| Law Enforcement | 19 (65.5%) | 10 (34.5%) |
| Food Preparation & Serving | 152 (34.7%) | 286 (65.3%) |
| Cleaning & Maintenance | 55 (45.1%) | 67 (54.9%) |
| Personal Care & Service | 12 (15.6%) | 65 (84.4%) |
| Total (Category) | 307 (34.4%) | 585 (65.6%) |
| Total (Overall) | 3,169 (55.5%) | 2,540 (44.5%) |
Sales and Office Occupations
The most common Sales and Office occupations in Alcoa are Office & Administration (734 | 12.9%), and Sales & Related (522 | 9.1%).

Sales and Office Occupations by Sex
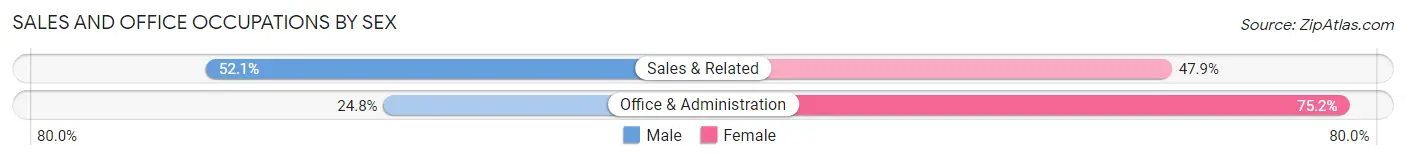
| Occupation | Male | Female |
| Sales & Related | 272 (52.1%) | 250 (47.9%) |
| Office & Administration | 182 (24.8%) | 552 (75.2%) |
| Total (Category) | 454 (36.1%) | 802 (63.8%) |
| Total (Overall) | 3,169 (55.5%) | 2,540 (44.5%) |
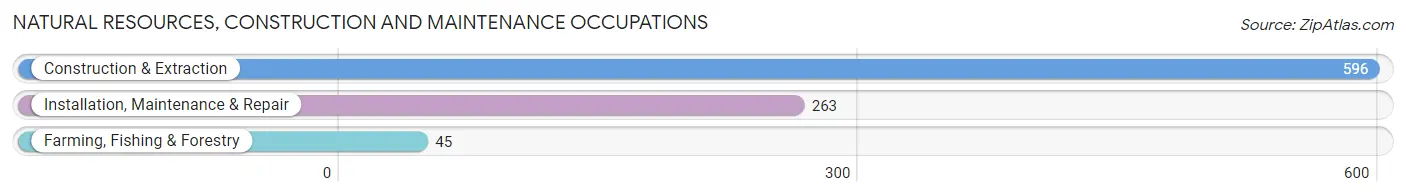
Natural Resources, Construction and Maintenance Occupations
The most common Natural Resources, Construction and Maintenance occupations in Alcoa are Construction & Extraction (596 | 10.4%), Installation, Maintenance & Repair (263 | 4.6%), and Farming, Fishing & Forestry (45 | 0.8%).
Natural Resources, Construction and Maintenance Occupations by Sex
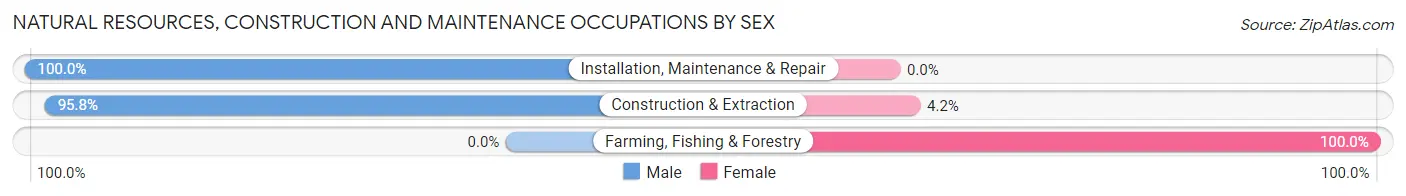
| Occupation | Male | Female |
| Farming, Fishing & Forestry | 0 (0.0%) | 45 (100.0%) |
| Construction & Extraction | 571 (95.8%) | 25 (4.2%) |
| Installation, Maintenance & Repair | 263 (100.0%) | 0 (0.0%) |
| Total (Category) | 834 (92.3%) | 70 (7.7%) |
| Total (Overall) | 3,169 (55.5%) | 2,540 (44.5%) |
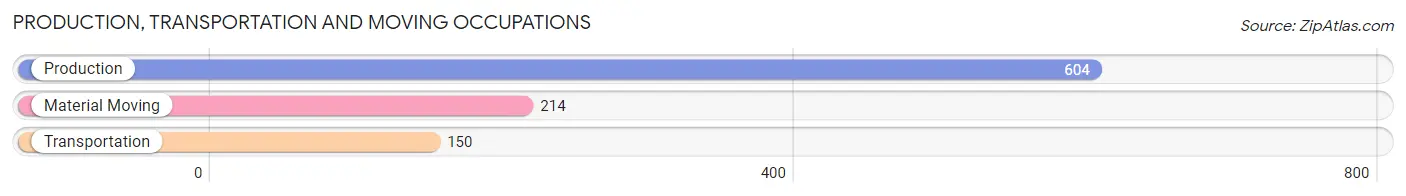
Production, Transportation and Moving Occupations
The most common Production, Transportation and Moving occupations in Alcoa are Production (604 | 10.6%), Material Moving (214 | 3.7%), and Transportation (150 | 2.6%).
Production, Transportation and Moving Occupations by Sex
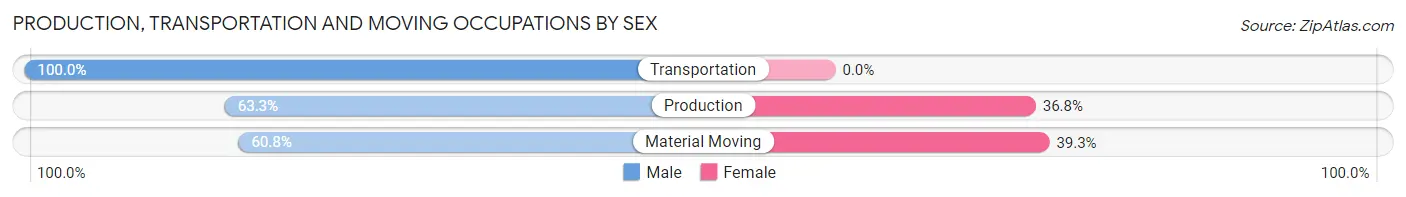
| Occupation | Male | Female |
| Production | 382 (63.2%) | 222 (36.7%) |
| Transportation | 150 (100.0%) | 0 (0.0%) |
| Material Moving | 130 (60.8%) | 84 (39.3%) |
| Total (Category) | 662 (68.4%) | 306 (31.6%) |
| Total (Overall) | 3,169 (55.5%) | 2,540 (44.5%) |
Employment Industries by Sex in Alcoa
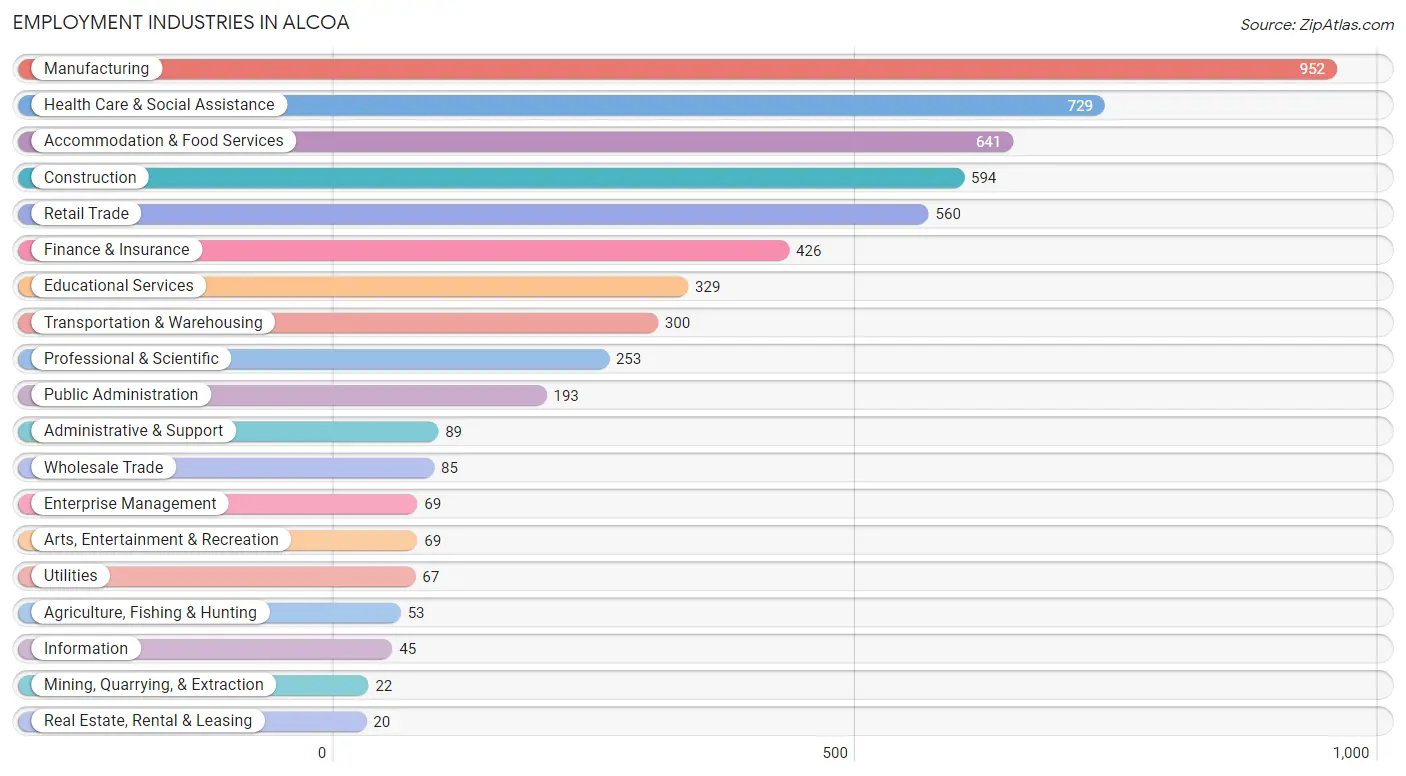
Employment Industries in Alcoa
The major employment industries in Alcoa include Manufacturing (952 | 16.7%), Health Care & Social Assistance (729 | 12.8%), Accommodation & Food Services (641 | 11.2%), Construction (594 | 10.4%), and Retail Trade (560 | 9.8%).
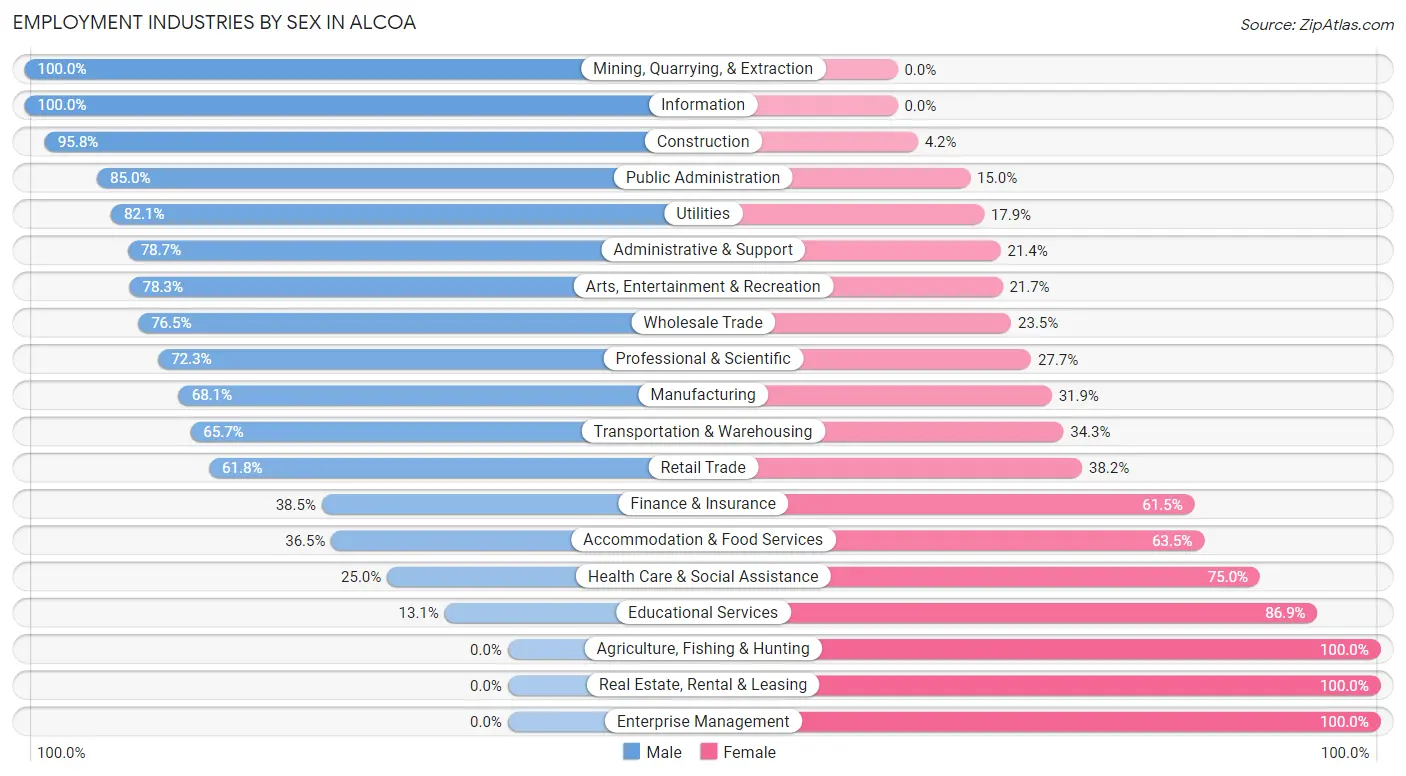
Employment Industries by Sex in Alcoa
The Alcoa industries that see more men than women are Mining, Quarrying, & Extraction (100.0%), Information (100.0%), and Construction (95.8%), whereas the industries that tend to have a higher number of women are Agriculture, Fishing & Hunting (100.0%), Real Estate, Rental & Leasing (100.0%), and Enterprise Management (100.0%).
| Industry | Male | Female |
| Agriculture, Fishing & Hunting | 0 (0.0%) | 53 (100.0%) |
| Mining, Quarrying, & Extraction | 22 (100.0%) | 0 (0.0%) |
| Construction | 569 (95.8%) | 25 (4.2%) |
| Manufacturing | 648 (68.1%) | 304 (31.9%) |
| Wholesale Trade | 65 (76.5%) | 20 (23.5%) |
| Retail Trade | 346 (61.8%) | 214 (38.2%) |
| Transportation & Warehousing | 197 (65.7%) | 103 (34.3%) |
| Utilities | 55 (82.1%) | 12 (17.9%) |
| Information | 45 (100.0%) | 0 (0.0%) |
| Finance & Insurance | 164 (38.5%) | 262 (61.5%) |
| Real Estate, Rental & Leasing | 0 (0.0%) | 20 (100.0%) |
| Professional & Scientific | 183 (72.3%) | 70 (27.7%) |
| Enterprise Management | 0 (0.0%) | 69 (100.0%) |
| Administrative & Support | 70 (78.6%) | 19 (21.3%) |
| Educational Services | 43 (13.1%) | 286 (86.9%) |
| Health Care & Social Assistance | 182 (25.0%) | 547 (75.0%) |
| Arts, Entertainment & Recreation | 54 (78.3%) | 15 (21.7%) |
| Accommodation & Food Services | 234 (36.5%) | 407 (63.5%) |
| Public Administration | 164 (85.0%) | 29 (15.0%) |
| Total | 3,169 (55.5%) | 2,540 (44.5%) |
Education in Alcoa
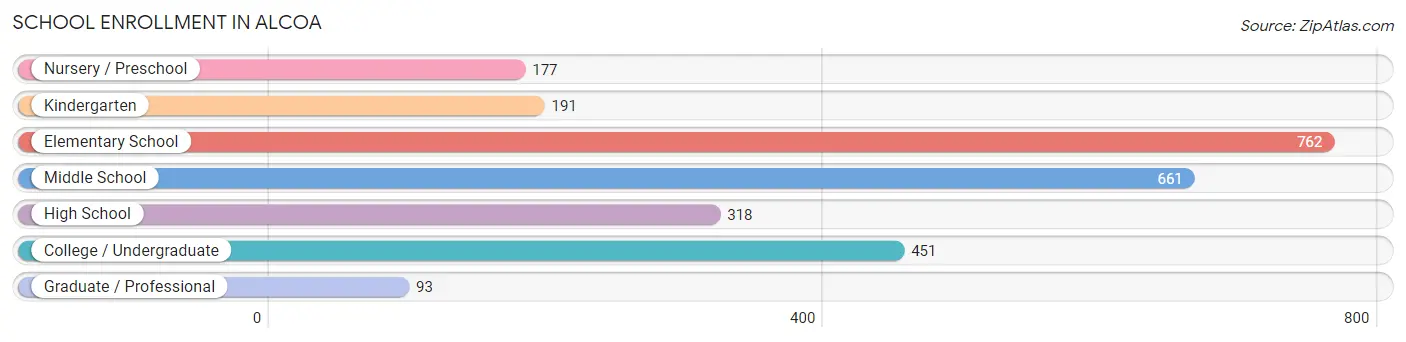
School Enrollment in Alcoa
The most common levels of schooling among the 2,653 students in Alcoa are elementary school (762 | 28.7%), middle school (661 | 24.9%), and college / undergraduate (451 | 17.0%).
| School Level | # Students | % Students |
| Nursery / Preschool | 177 | 6.7% |
| Kindergarten | 191 | 7.2% |
| Elementary School | 762 | 28.7% |
| Middle School | 661 | 24.9% |
| High School | 318 | 12.0% |
| College / Undergraduate | 451 | 17.0% |
| Graduate / Professional | 93 | 3.5% |
| Total | 2,653 | 100.0% |
School Enrollment by Age by Funding Source in Alcoa
Out of a total of 2,653 students who are enrolled in schools in Alcoa, 377 (14.2%) attend a private institution, while the remaining 2,276 (85.8%) are enrolled in public schools. The age group of 25 to 34 year olds has the highest likelihood of being enrolled in private schools, with 63 (46.7% in the age bracket) enrolled. Conversely, the age group of 10 to 14 year olds has the lowest likelihood of being enrolled in a private school, with 736 (96.0% in the age bracket) attending a public institution.
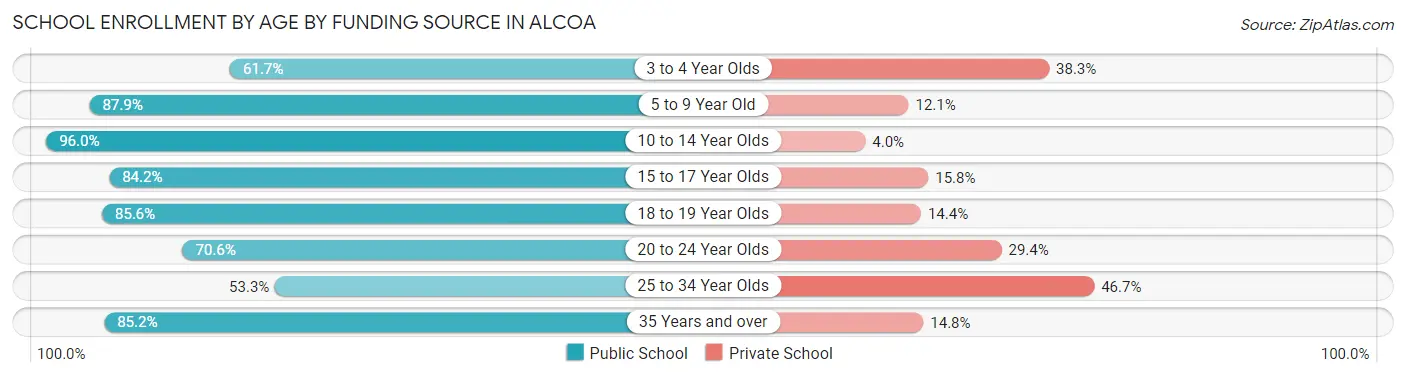
| Age Bracket | Public School | Private School |
| 3 to 4 Year Olds | 100 (61.7%) | 62 (38.3%) |
| 5 to 9 Year Old | 807 (87.9%) | 111 (12.1%) |
| 10 to 14 Year Olds | 736 (96.0%) | 31 (4.0%) |
| 15 to 17 Year Olds | 187 (84.2%) | 35 (15.8%) |
| 18 to 19 Year Olds | 107 (85.6%) | 18 (14.4%) |
| 20 to 24 Year Olds | 48 (70.6%) | 20 (29.4%) |
| 25 to 34 Year Olds | 72 (53.3%) | 63 (46.7%) |
| 35 Years and over | 218 (85.2%) | 38 (14.8%) |
| Total | 2,276 (85.8%) | 377 (14.2%) |
Educational Attainment by Field of Study in Alcoa
Education (473 | 18.4%), science & technology (453 | 17.6%), business (446 | 17.3%), liberal arts & history (210 | 8.2%), and psychology (196 | 7.6%) are the most common fields of study among 2,572 individuals in Alcoa who have obtained a bachelor's degree or higher.
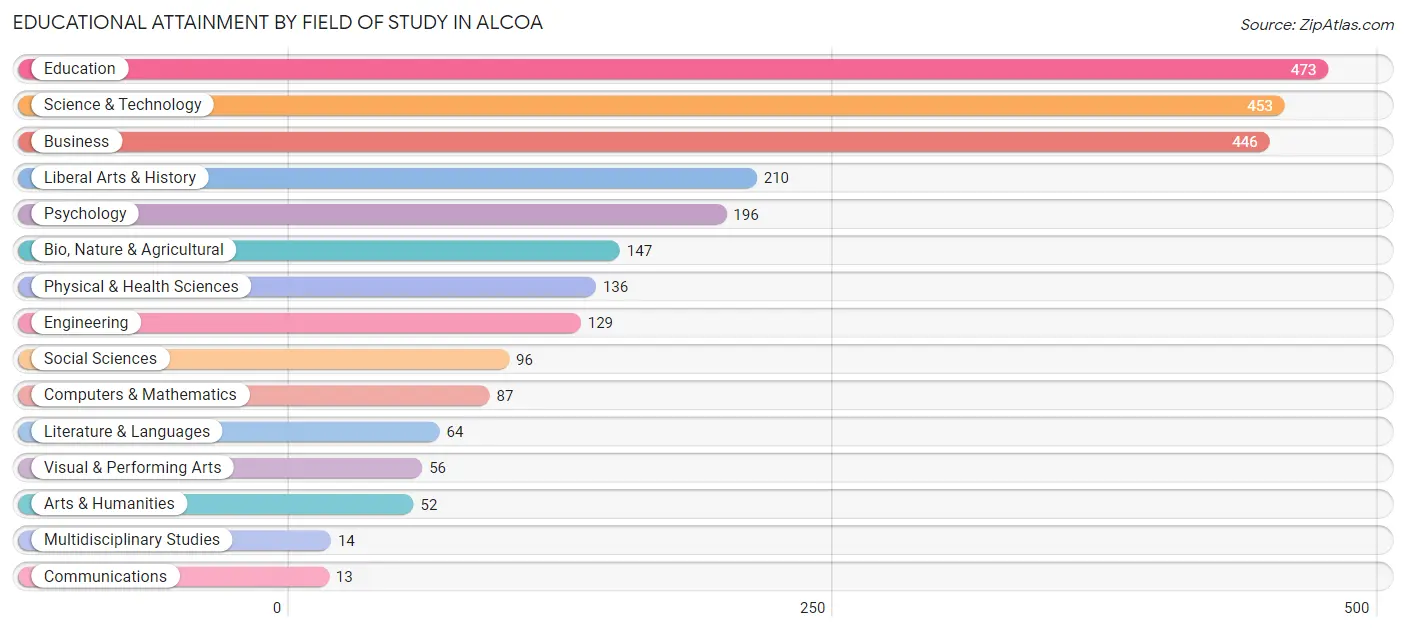
| Field of Study | # Graduates | % Graduates |
| Computers & Mathematics | 87 | 3.4% |
| Bio, Nature & Agricultural | 147 | 5.7% |
| Physical & Health Sciences | 136 | 5.3% |
| Psychology | 196 | 7.6% |
| Social Sciences | 96 | 3.7% |
| Engineering | 129 | 5.0% |
| Multidisciplinary Studies | 14 | 0.5% |
| Science & Technology | 453 | 17.6% |
| Business | 446 | 17.3% |
| Education | 473 | 18.4% |
| Literature & Languages | 64 | 2.5% |
| Liberal Arts & History | 210 | 8.2% |
| Visual & Performing Arts | 56 | 2.2% |
| Communications | 13 | 0.5% |
| Arts & Humanities | 52 | 2.0% |
| Total | 2,572 | 100.0% |
Transportation & Commute in Alcoa
Vehicle Availability by Sex in Alcoa
The most prevalent vehicle ownership categories in Alcoa are males with 2 vehicles (1,372, accounting for 43.4%) and females with 2 vehicles (931, making up 54.6%).
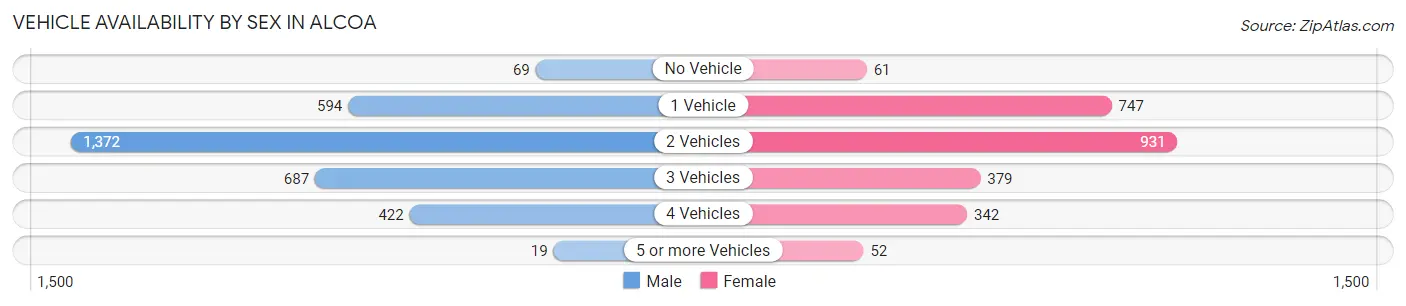
| Vehicles Available | Male | Female |
| No Vehicle | 69 (2.2%) | 61 (2.4%) |
| 1 Vehicle | 594 (18.8%) | 747 (29.7%) |
| 2 Vehicles | 1,372 (43.4%) | 931 (37.1%) |
| 3 Vehicles | 687 (21.7%) | 379 (15.1%) |
| 4 Vehicles | 422 (13.3%) | 342 (13.6%) |
| 5 or more Vehicles | 19 (0.6%) | 52 (2.1%) |
| Total | 3,163 (100.0%) | 2,512 (100.0%) |
Commute Time in Alcoa
The most frequently occuring commute durations in Alcoa are 10 to 14 minutes (979 commuters, 19.0%), 5 to 9 minutes (846 commuters, 16.4%), and 15 to 19 minutes (728 commuters, 14.1%).
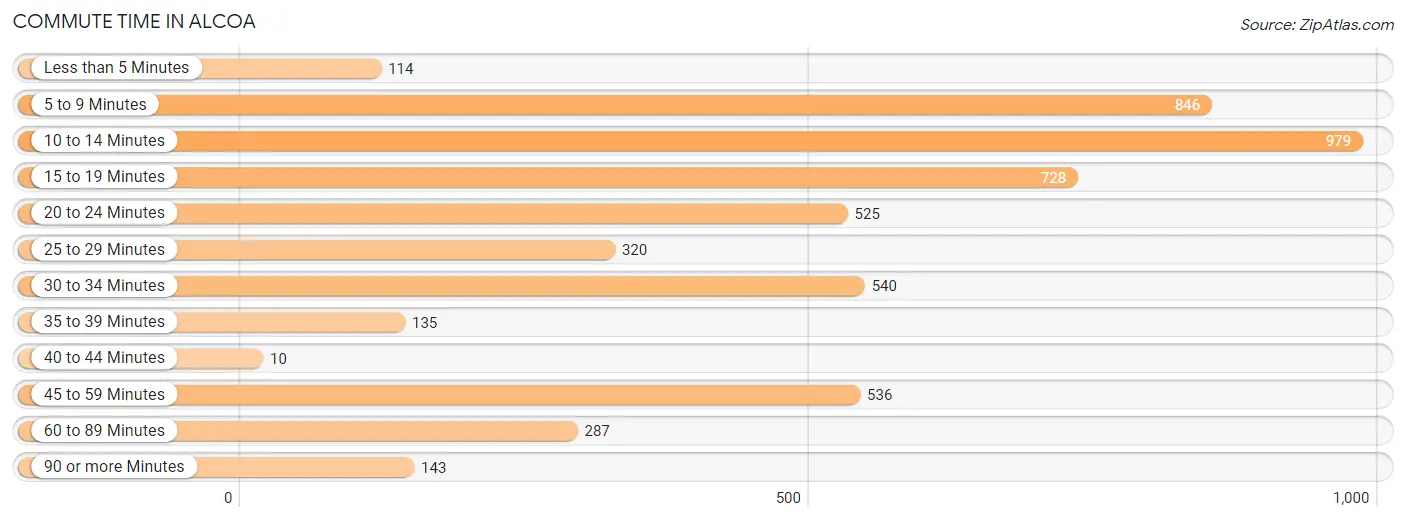
| Commute Time | # Commuters | % Commuters |
| Less than 5 Minutes | 114 | 2.2% |
| 5 to 9 Minutes | 846 | 16.4% |
| 10 to 14 Minutes | 979 | 19.0% |
| 15 to 19 Minutes | 728 | 14.1% |
| 20 to 24 Minutes | 525 | 10.2% |
| 25 to 29 Minutes | 320 | 6.2% |
| 30 to 34 Minutes | 540 | 10.5% |
| 35 to 39 Minutes | 135 | 2.6% |
| 40 to 44 Minutes | 10 | 0.2% |
| 45 to 59 Minutes | 536 | 10.4% |
| 60 to 89 Minutes | 287 | 5.6% |
| 90 or more Minutes | 143 | 2.8% |
Commute Time by Sex in Alcoa
The most common commute times in Alcoa are 10 to 14 minutes (495 commuters, 17.2%) for males and 10 to 14 minutes (484 commuters, 21.2%) for females.
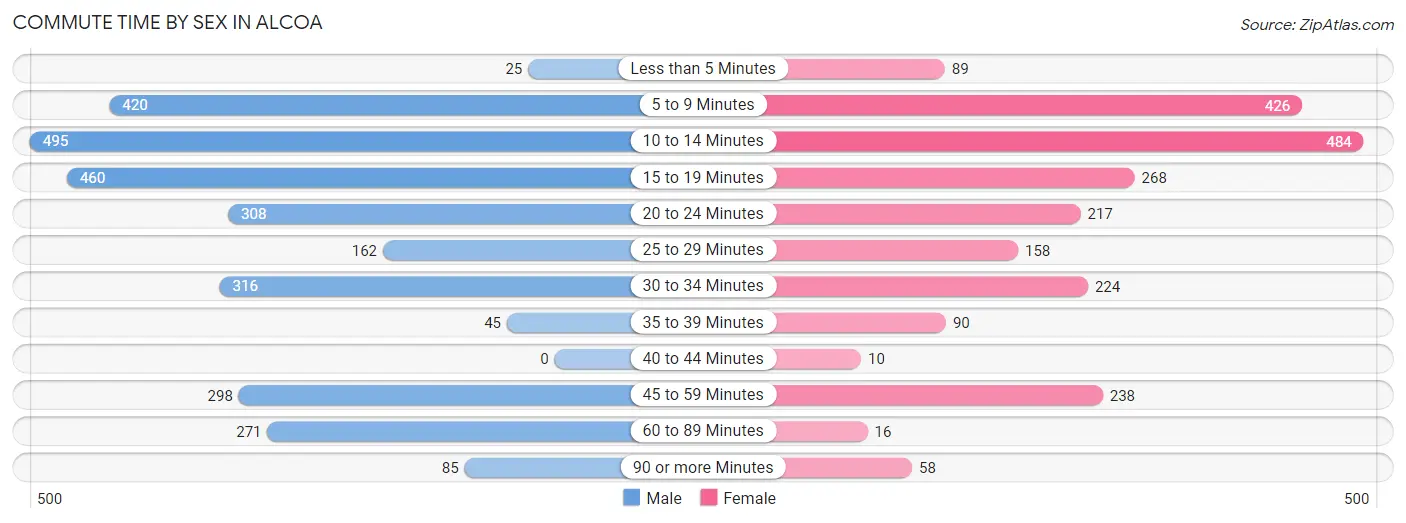
| Commute Time | Male | Female |
| Less than 5 Minutes | 25 (0.9%) | 89 (3.9%) |
| 5 to 9 Minutes | 420 (14.6%) | 426 (18.7%) |
| 10 to 14 Minutes | 495 (17.2%) | 484 (21.2%) |
| 15 to 19 Minutes | 460 (15.9%) | 268 (11.8%) |
| 20 to 24 Minutes | 308 (10.7%) | 217 (9.5%) |
| 25 to 29 Minutes | 162 (5.6%) | 158 (6.9%) |
| 30 to 34 Minutes | 316 (11.0%) | 224 (9.8%) |
| 35 to 39 Minutes | 45 (1.6%) | 90 (4.0%) |
| 40 to 44 Minutes | 0 (0.0%) | 10 (0.4%) |
| 45 to 59 Minutes | 298 (10.3%) | 238 (10.4%) |
| 60 to 89 Minutes | 271 (9.4%) | 16 (0.7%) |
| 90 or more Minutes | 85 (2.9%) | 58 (2.5%) |
Time of Departure to Work by Sex in Alcoa
The most frequent times of departure to work in Alcoa are 7:00 AM to 7:29 AM (429, 14.9%) for males and 6:30 AM to 6:59 AM (418, 18.3%) for females.
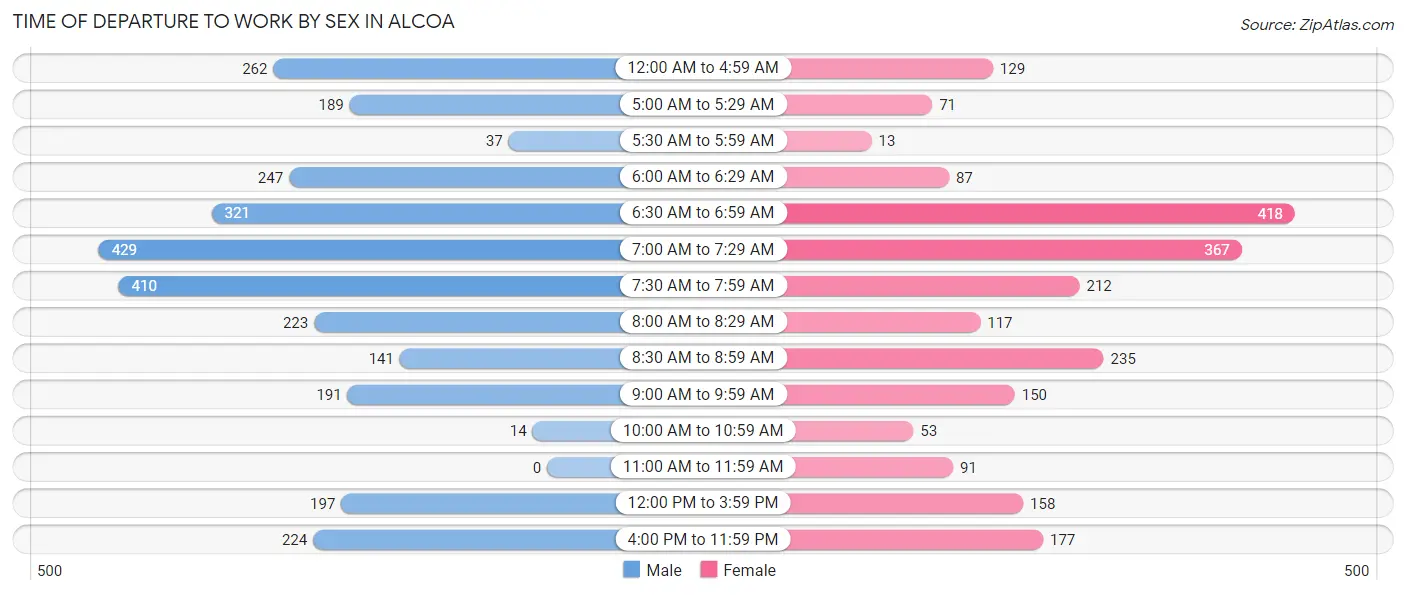
| Time of Departure | Male | Female |
| 12:00 AM to 4:59 AM | 262 (9.1%) | 129 (5.7%) |
| 5:00 AM to 5:29 AM | 189 (6.6%) | 71 (3.1%) |
| 5:30 AM to 5:59 AM | 37 (1.3%) | 13 (0.6%) |
| 6:00 AM to 6:29 AM | 247 (8.6%) | 87 (3.8%) |
| 6:30 AM to 6:59 AM | 321 (11.1%) | 418 (18.3%) |
| 7:00 AM to 7:29 AM | 429 (14.9%) | 367 (16.1%) |
| 7:30 AM to 7:59 AM | 410 (14.2%) | 212 (9.3%) |
| 8:00 AM to 8:29 AM | 223 (7.7%) | 117 (5.1%) |
| 8:30 AM to 8:59 AM | 141 (4.9%) | 235 (10.3%) |
| 9:00 AM to 9:59 AM | 191 (6.6%) | 150 (6.6%) |
| 10:00 AM to 10:59 AM | 14 (0.5%) | 53 (2.3%) |
| 11:00 AM to 11:59 AM | 0 (0.0%) | 91 (4.0%) |
| 12:00 PM to 3:59 PM | 197 (6.8%) | 158 (6.9%) |
| 4:00 PM to 11:59 PM | 224 (7.8%) | 177 (7.8%) |
| Total | 2,885 (100.0%) | 2,278 (100.0%) |
Housing Occupancy in Alcoa
Occupancy by Ownership in Alcoa
Of the total 4,458 dwellings in Alcoa, owner-occupied units account for 2,889 (64.8%), while renter-occupied units make up 1,569 (35.2%).
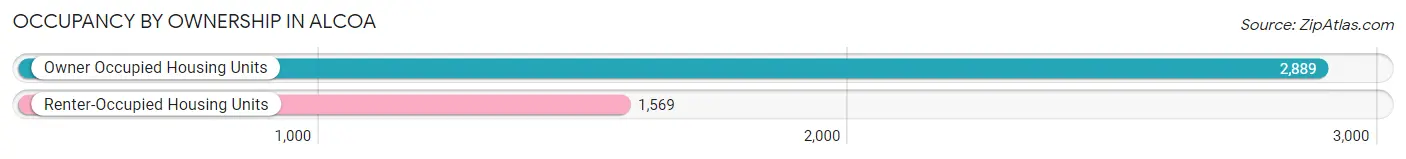
| Occupancy | # Housing Units | % Housing Units |
| Owner Occupied Housing Units | 2,889 | 64.8% |
| Renter-Occupied Housing Units | 1,569 | 35.2% |
| Total Occupied Housing Units | 4,458 | 100.0% |
Occupancy by Household Size in Alcoa
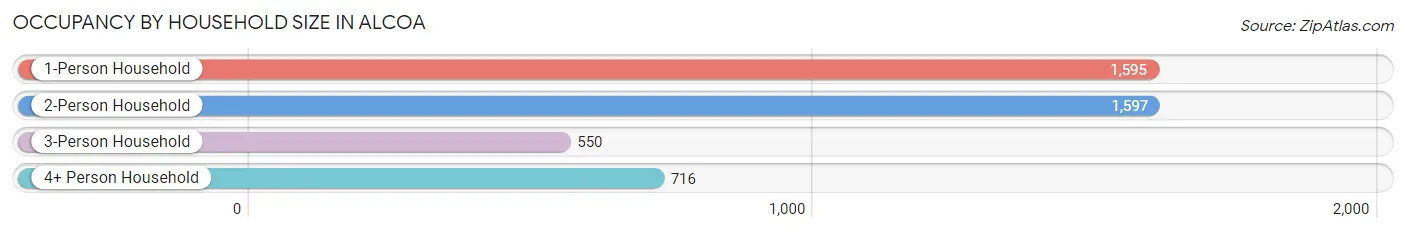
| Household Size | # Housing Units | % Housing Units |
| 1-Person Household | 1,595 | 35.8% |
| 2-Person Household | 1,597 | 35.8% |
| 3-Person Household | 550 | 12.3% |
| 4+ Person Household | 716 | 16.1% |
| Total Housing Units | 4,458 | 100.0% |
Occupancy by Ownership by Household Size in Alcoa
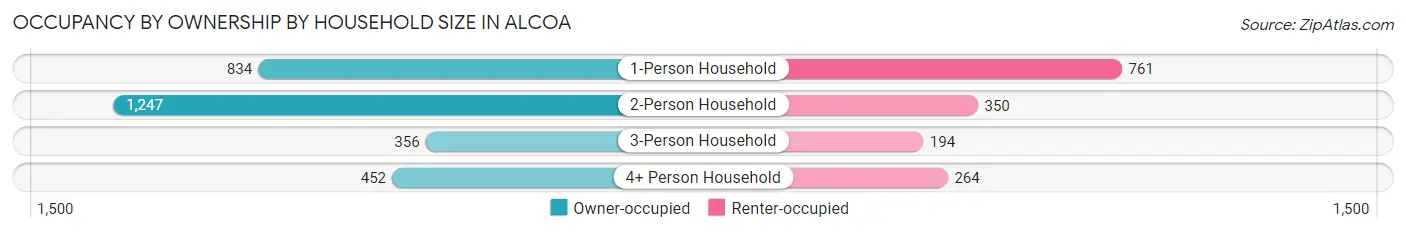
| Household Size | Owner-occupied | Renter-occupied |
| 1-Person Household | 834 (52.3%) | 761 (47.7%) |
| 2-Person Household | 1,247 (78.1%) | 350 (21.9%) |
| 3-Person Household | 356 (64.7%) | 194 (35.3%) |
| 4+ Person Household | 452 (63.1%) | 264 (36.9%) |
| Total Housing Units | 2,889 (64.8%) | 1,569 (35.2%) |
Occupancy by Educational Attainment in Alcoa
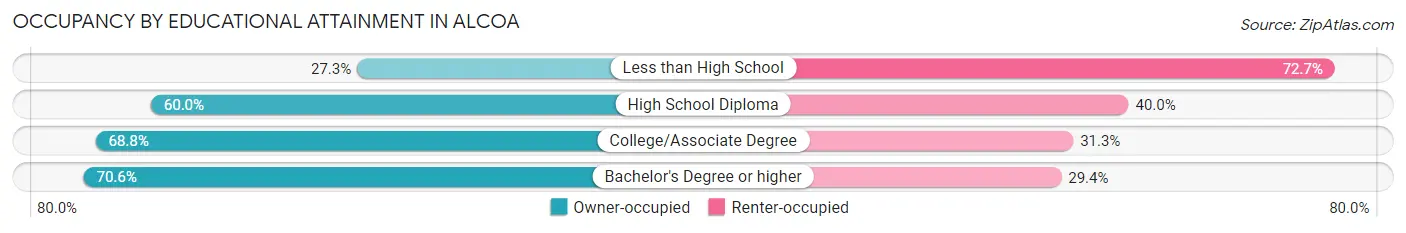
| Household Size | Owner-occupied | Renter-occupied |
| Less than High School | 66 (27.3%) | 176 (72.7%) |
| High School Diploma | 722 (60.0%) | 482 (40.0%) |
| College/Associate Degree | 968 (68.8%) | 440 (31.2%) |
| Bachelor's Degree or higher | 1,133 (70.6%) | 471 (29.4%) |
Occupancy by Age of Householder in Alcoa
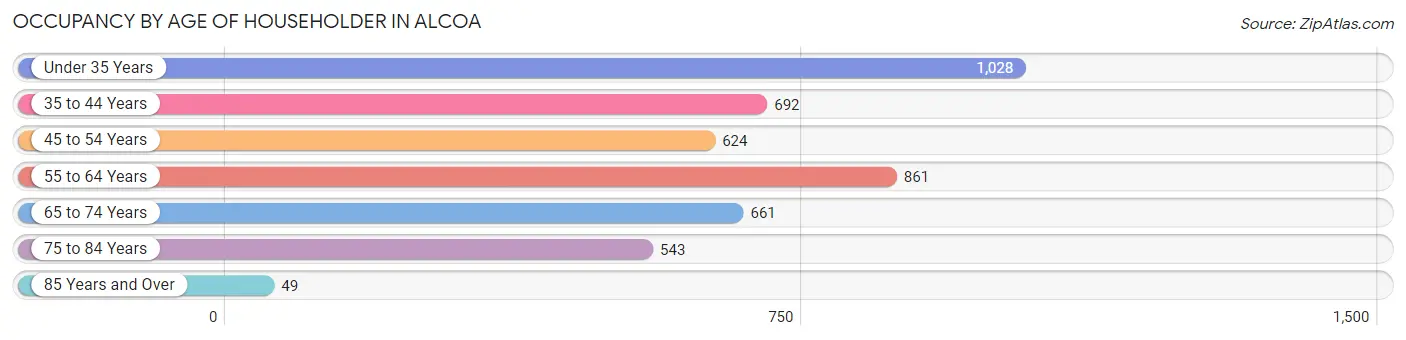
| Age Bracket | # Households | % Households |
| Under 35 Years | 1,028 | 23.1% |
| 35 to 44 Years | 692 | 15.5% |
| 45 to 54 Years | 624 | 14.0% |
| 55 to 64 Years | 861 | 19.3% |
| 65 to 74 Years | 661 | 14.8% |
| 75 to 84 Years | 543 | 12.2% |
| 85 Years and Over | 49 | 1.1% |
| Total | 4,458 | 100.0% |
Housing Finances in Alcoa
Median Income by Occupancy in Alcoa
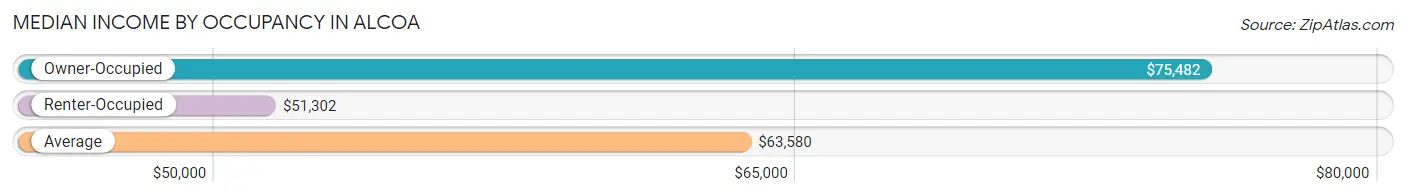
| Occupancy Type | # Households | Median Income |
| Owner-Occupied | 2,889 (64.8%) | $75,482 |
| Renter-Occupied | 1,569 (35.2%) | $51,302 |
| Average | 4,458 (100.0%) | $63,580 |
Occupancy by Householder Income Bracket in Alcoa
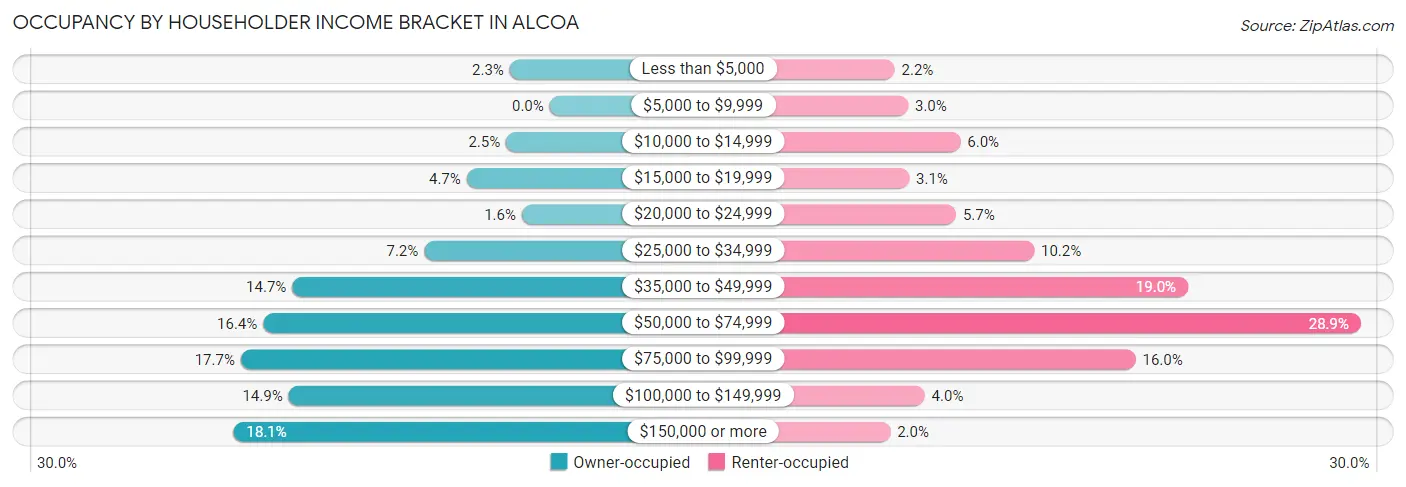
| Income Bracket | Owner-occupied | Renter-occupied |
| Less than $5,000 | 66 (2.3%) | 35 (2.2%) |
| $5,000 to $9,999 | 0 (0.0%) | 47 (3.0%) |
| $10,000 to $14,999 | 72 (2.5%) | 94 (6.0%) |
| $15,000 to $19,999 | 137 (4.7%) | 48 (3.1%) |
| $20,000 to $24,999 | 46 (1.6%) | 90 (5.7%) |
| $25,000 to $34,999 | 207 (7.2%) | 160 (10.2%) |
| $35,000 to $49,999 | 425 (14.7%) | 298 (19.0%) |
| $50,000 to $74,999 | 473 (16.4%) | 453 (28.9%) |
| $75,000 to $99,999 | 510 (17.6%) | 251 (16.0%) |
| $100,000 to $149,999 | 431 (14.9%) | 62 (4.0%) |
| $150,000 or more | 522 (18.1%) | 31 (2.0%) |
| Total | 2,889 (100.0%) | 1,569 (100.0%) |
Monthly Housing Cost Tiers in Alcoa
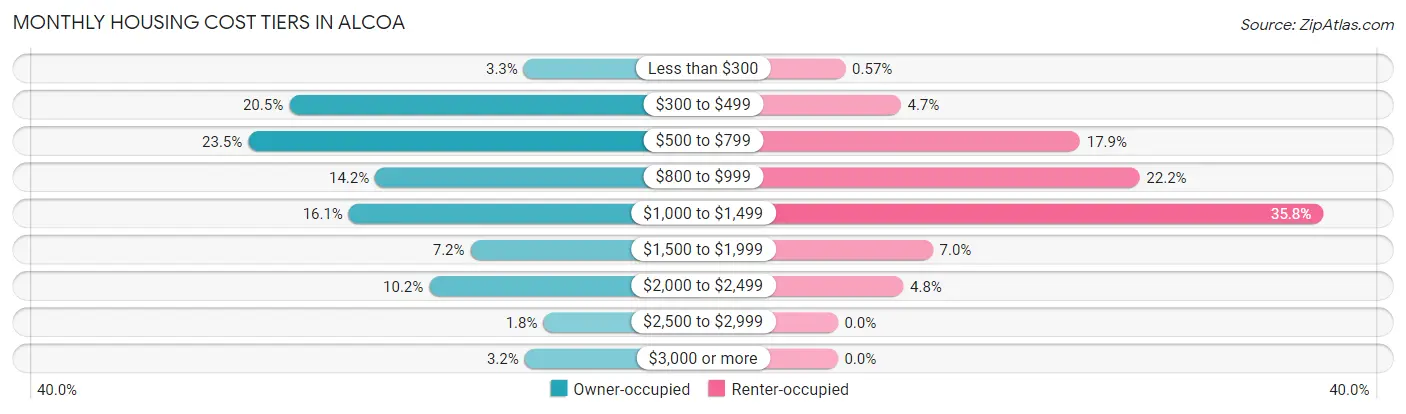
| Monthly Cost | Owner-occupied | Renter-occupied |
| Less than $300 | 94 (3.3%) | 9 (0.6%) |
| $300 to $499 | 593 (20.5%) | 73 (4.6%) |
| $500 to $799 | 680 (23.5%) | 280 (17.8%) |
| $800 to $999 | 410 (14.2%) | 349 (22.2%) |
| $1,000 to $1,499 | 466 (16.1%) | 561 (35.8%) |
| $1,500 to $1,999 | 207 (7.2%) | 110 (7.0%) |
| $2,000 to $2,499 | 295 (10.2%) | 76 (4.8%) |
| $2,500 to $2,999 | 52 (1.8%) | 0 (0.0%) |
| $3,000 or more | 92 (3.2%) | 0 (0.0%) |
| Total | 2,889 (100.0%) | 1,569 (100.0%) |
Physical Housing Characteristics in Alcoa
Housing Structures in Alcoa
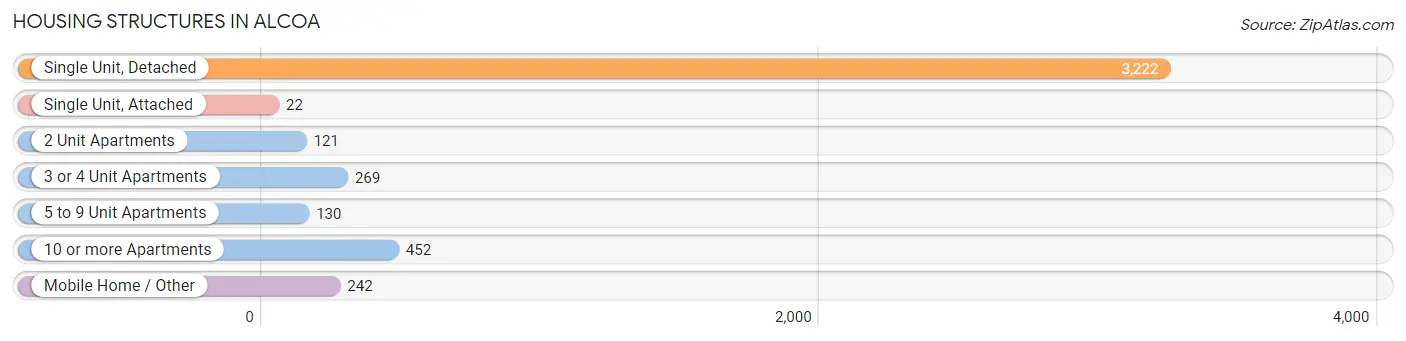
| Structure Type | # Housing Units | % Housing Units |
| Single Unit, Detached | 3,222 | 72.3% |
| Single Unit, Attached | 22 | 0.5% |
| 2 Unit Apartments | 121 | 2.7% |
| 3 or 4 Unit Apartments | 269 | 6.0% |
| 5 to 9 Unit Apartments | 130 | 2.9% |
| 10 or more Apartments | 452 | 10.1% |
| Mobile Home / Other | 242 | 5.4% |
| Total | 4,458 | 100.0% |
Housing Structures by Occupancy in Alcoa
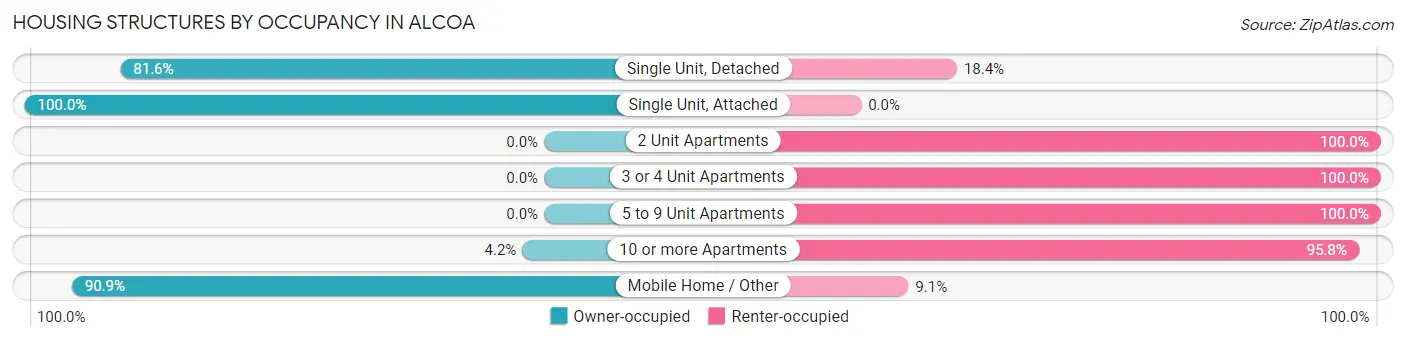
| Structure Type | Owner-occupied | Renter-occupied |
| Single Unit, Detached | 2,628 (81.6%) | 594 (18.4%) |
| Single Unit, Attached | 22 (100.0%) | 0 (0.0%) |
| 2 Unit Apartments | 0 (0.0%) | 121 (100.0%) |
| 3 or 4 Unit Apartments | 0 (0.0%) | 269 (100.0%) |
| 5 to 9 Unit Apartments | 0 (0.0%) | 130 (100.0%) |
| 10 or more Apartments | 19 (4.2%) | 433 (95.8%) |
| Mobile Home / Other | 220 (90.9%) | 22 (9.1%) |
| Total | 2,889 (64.8%) | 1,569 (35.2%) |
Housing Structures by Number of Rooms in Alcoa
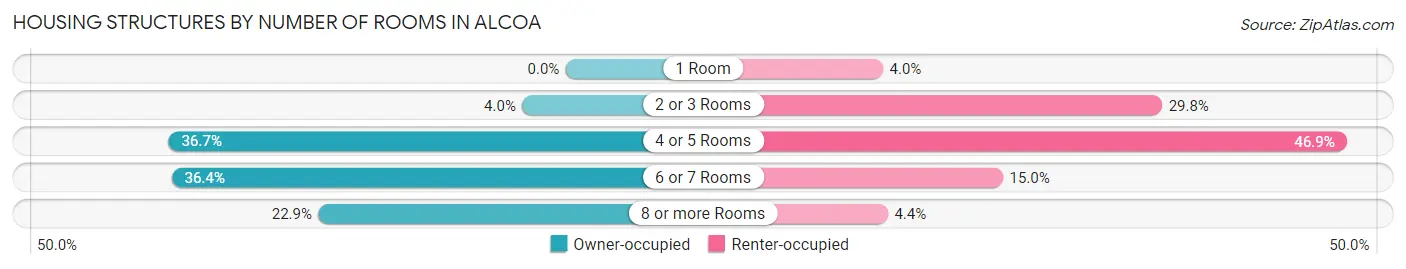
| Number of Rooms | Owner-occupied | Renter-occupied |
| 1 Room | 0 (0.0%) | 62 (4.0%) |
| 2 or 3 Rooms | 116 (4.0%) | 467 (29.8%) |
| 4 or 5 Rooms | 1,060 (36.7%) | 735 (46.9%) |
| 6 or 7 Rooms | 1,052 (36.4%) | 236 (15.0%) |
| 8 or more Rooms | 661 (22.9%) | 69 (4.4%) |
| Total | 2,889 (100.0%) | 1,569 (100.0%) |
Housing Structure by Heating Type in Alcoa
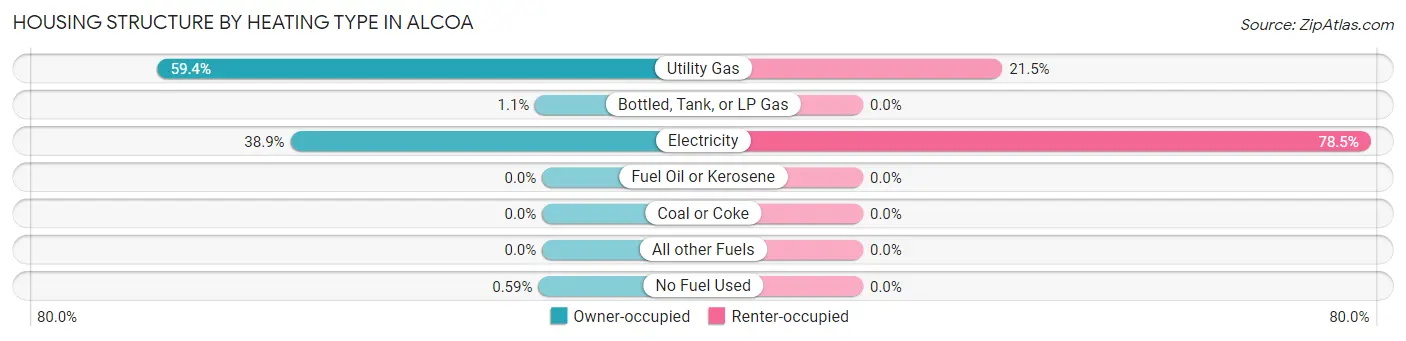
| Heating Type | Owner-occupied | Renter-occupied |
| Utility Gas | 1,717 (59.4%) | 338 (21.5%) |
| Bottled, Tank, or LP Gas | 31 (1.1%) | 0 (0.0%) |
| Electricity | 1,124 (38.9%) | 1,231 (78.5%) |
| Fuel Oil or Kerosene | 0 (0.0%) | 0 (0.0%) |
| Coal or Coke | 0 (0.0%) | 0 (0.0%) |
| All other Fuels | 0 (0.0%) | 0 (0.0%) |
| No Fuel Used | 17 (0.6%) | 0 (0.0%) |
| Total | 2,889 (100.0%) | 1,569 (100.0%) |
Household Vehicle Usage in Alcoa
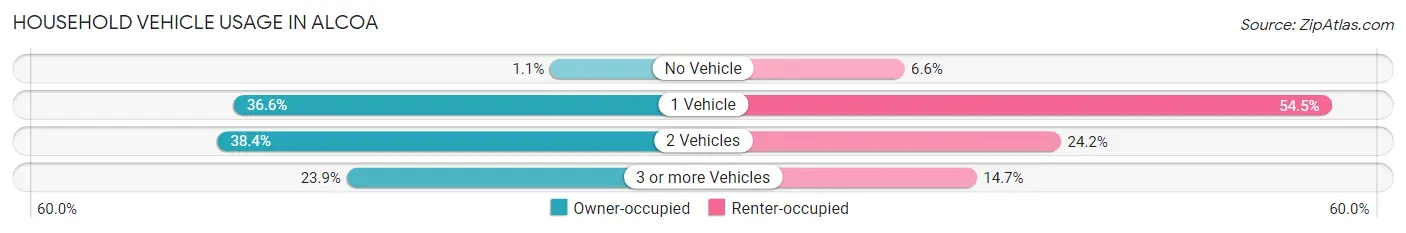
| Vehicles per Household | Owner-occupied | Renter-occupied |
| No Vehicle | 33 (1.1%) | 104 (6.6%) |
| 1 Vehicle | 1,056 (36.5%) | 855 (54.5%) |
| 2 Vehicles | 1,109 (38.4%) | 379 (24.2%) |
| 3 or more Vehicles | 691 (23.9%) | 231 (14.7%) |
| Total | 2,889 (100.0%) | 1,569 (100.0%) |
Real Estate & Mortgages in Alcoa
Real Estate and Mortgage Overview in Alcoa
| Characteristic | Without Mortgage | With Mortgage |
| Housing Units | 1,304 | 1,585 |
| Median Property Value | $220,400 | $211,600 |
| Median Household Income | $57,199 | $351 |
| Monthly Housing Costs | $491 | $92 |
| Real Estate Taxes | $2,117 | $64 |
Property Value by Mortgage Status in Alcoa
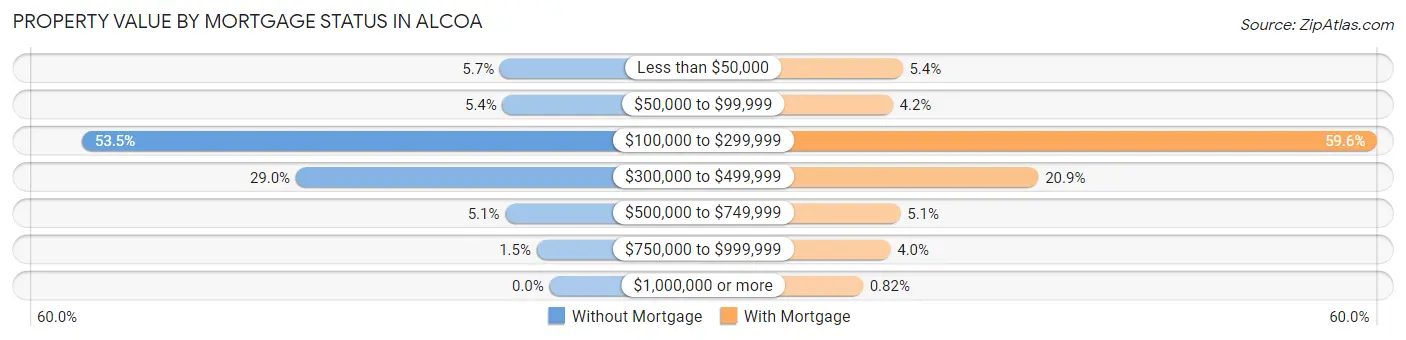
| Property Value | Without Mortgage | With Mortgage |
| Less than $50,000 | 74 (5.7%) | 85 (5.4%) |
| $50,000 to $99,999 | 70 (5.4%) | 67 (4.2%) |
| $100,000 to $299,999 | 697 (53.4%) | 945 (59.6%) |
| $300,000 to $499,999 | 378 (29.0%) | 331 (20.9%) |
| $500,000 to $749,999 | 66 (5.1%) | 81 (5.1%) |
| $750,000 to $999,999 | 19 (1.5%) | 63 (4.0%) |
| $1,000,000 or more | 0 (0.0%) | 13 (0.8%) |
| Total | 1,304 (100.0%) | 1,585 (100.0%) |
Household Income by Mortgage Status in Alcoa
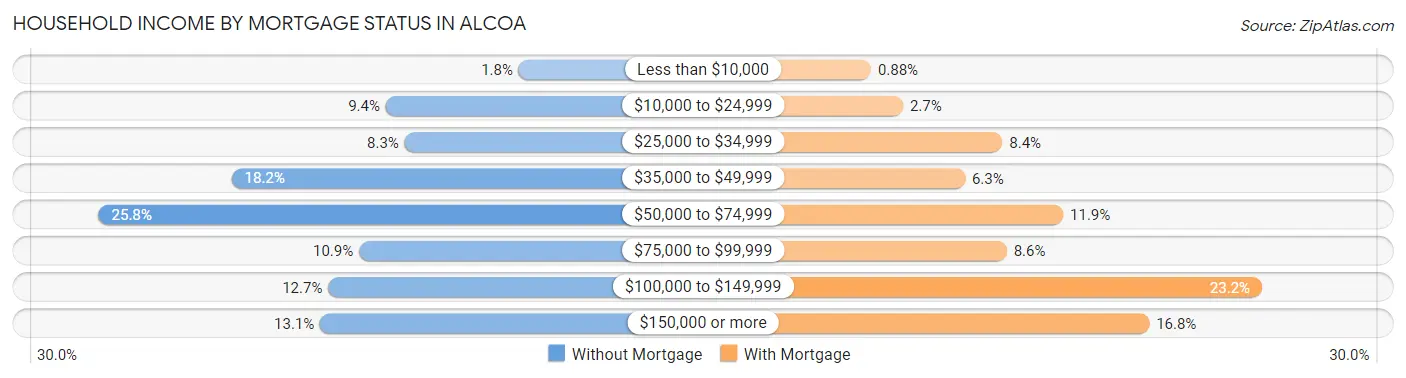
| Household Income | Without Mortgage | With Mortgage |
| Less than $10,000 | 23 (1.8%) | 14 (0.9%) |
| $10,000 to $24,999 | 122 (9.4%) | 43 (2.7%) |
| $25,000 to $34,999 | 108 (8.3%) | 133 (8.4%) |
| $35,000 to $49,999 | 237 (18.2%) | 99 (6.2%) |
| $50,000 to $74,999 | 336 (25.8%) | 188 (11.9%) |
| $75,000 to $99,999 | 142 (10.9%) | 137 (8.6%) |
| $100,000 to $149,999 | 165 (12.7%) | 368 (23.2%) |
| $150,000 or more | 171 (13.1%) | 266 (16.8%) |
| Total | 1,304 (100.0%) | 1,585 (100.0%) |
Property Value to Household Income Ratio in Alcoa
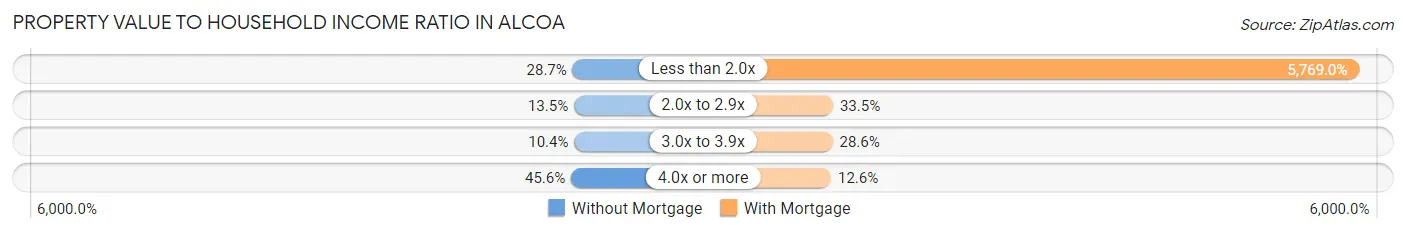
| Value-to-Income Ratio | Without Mortgage | With Mortgage |
| Less than 2.0x | 374 (28.7%) | 91,439 (5,769.0%) |
| 2.0x to 2.9x | 176 (13.5%) | 531 (33.5%) |
| 3.0x to 3.9x | 136 (10.4%) | 453 (28.6%) |
| 4.0x or more | 595 (45.6%) | 200 (12.6%) |
| Total | 1,304 (100.0%) | 1,585 (100.0%) |
Real Estate Taxes by Mortgage Status in Alcoa
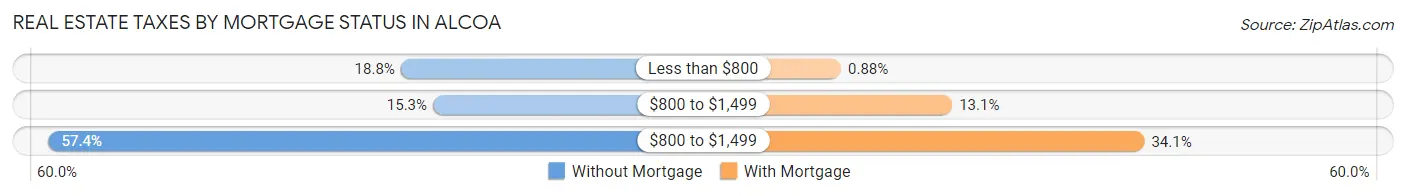
| Property Taxes | Without Mortgage | With Mortgage |
| Less than $800 | 245 (18.8%) | 14 (0.9%) |
| $800 to $1,499 | 199 (15.3%) | 207 (13.1%) |
| $800 to $1,499 | 748 (57.4%) | 541 (34.1%) |
| Total | 1,304 (100.0%) | 1,585 (100.0%) |
Health & Disability in Alcoa
Health Insurance Coverage by Age in Alcoa
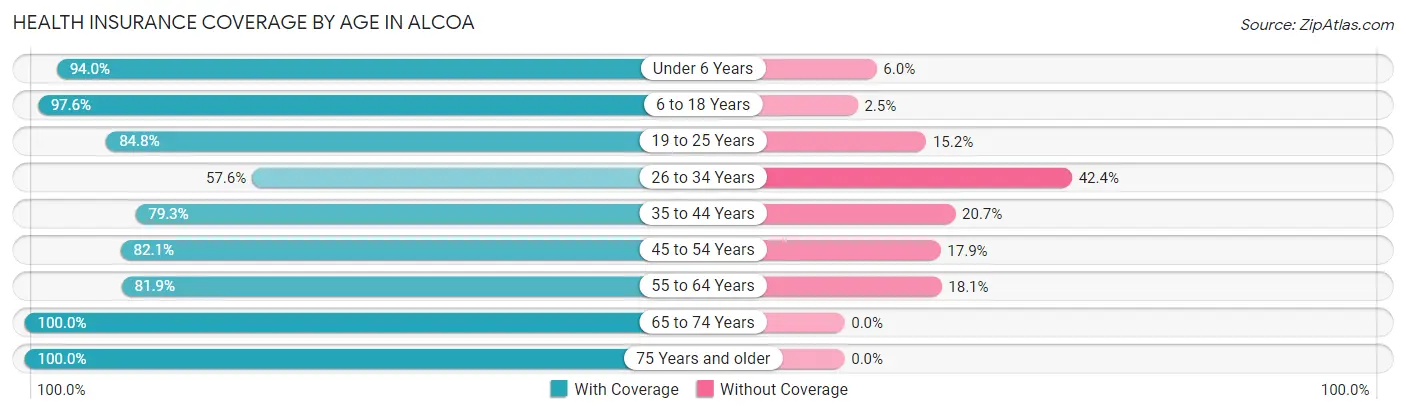
| Age Bracket | With Coverage | Without Coverage |
| Under 6 Years | 722 (94.0%) | 46 (6.0%) |
| 6 to 18 Years | 1,871 (97.6%) | 47 (2.5%) |
| 19 to 25 Years | 657 (84.8%) | 118 (15.2%) |
| 26 to 34 Years | 1,039 (57.6%) | 765 (42.4%) |
| 35 to 44 Years | 1,041 (79.3%) | 271 (20.7%) |
| 45 to 54 Years | 1,003 (82.1%) | 219 (17.9%) |
| 55 to 64 Years | 1,059 (81.9%) | 234 (18.1%) |
| 65 to 74 Years | 932 (100.0%) | 0 (0.0%) |
| 75 Years and older | 1,056 (100.0%) | 0 (0.0%) |
| Total | 9,380 (84.7%) | 1,700 (15.3%) |
Health Insurance Coverage by Citizenship Status in Alcoa
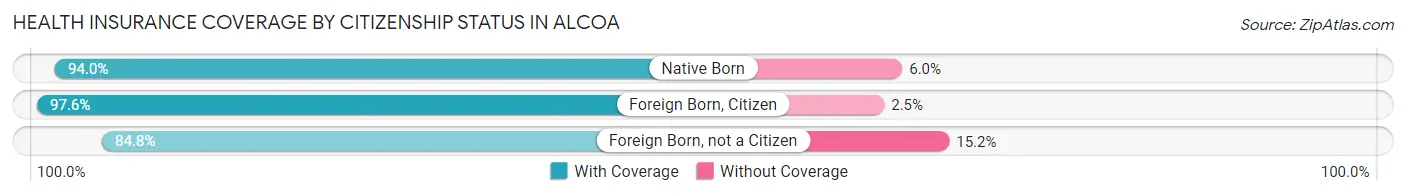
| Citizenship Status | With Coverage | Without Coverage |
| Native Born | 722 (94.0%) | 46 (6.0%) |
| Foreign Born, Citizen | 1,871 (97.6%) | 47 (2.5%) |
| Foreign Born, not a Citizen | 657 (84.8%) | 118 (15.2%) |
Health Insurance Coverage by Household Income in Alcoa
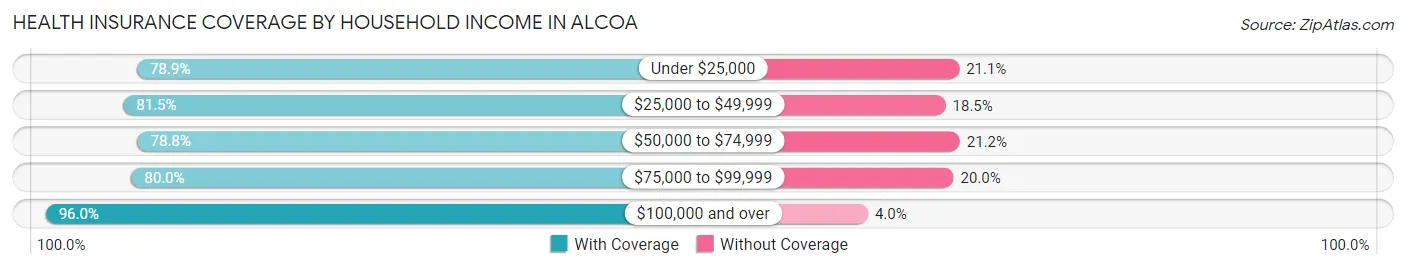
| Household Income | With Coverage | Without Coverage |
| Under $25,000 | 877 (78.9%) | 234 (21.1%) |
| $25,000 to $49,999 | 1,814 (81.5%) | 412 (18.5%) |
| $50,000 to $74,999 | 2,028 (78.8%) | 545 (21.2%) |
| $75,000 to $99,999 | 1,519 (80.0%) | 380 (20.0%) |
| $100,000 and over | 3,130 (96.0%) | 129 (4.0%) |
Public vs Private Health Insurance Coverage by Age in Alcoa
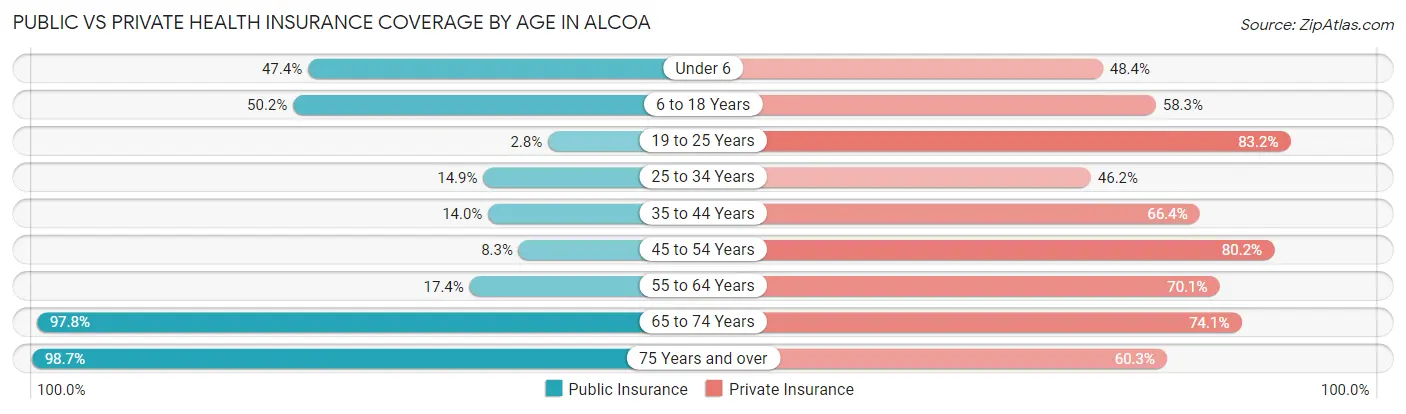
| Age Bracket | Public Insurance | Private Insurance |
| Under 6 | 364 (47.4%) | 372 (48.4%) |
| 6 to 18 Years | 962 (50.2%) | 1,118 (58.3%) |
| 19 to 25 Years | 22 (2.8%) | 645 (83.2%) |
| 25 to 34 Years | 268 (14.9%) | 834 (46.2%) |
| 35 to 44 Years | 183 (14.0%) | 871 (66.4%) |
| 45 to 54 Years | 101 (8.3%) | 980 (80.2%) |
| 55 to 64 Years | 225 (17.4%) | 906 (70.1%) |
| 65 to 74 Years | 911 (97.8%) | 691 (74.1%) |
| 75 Years and over | 1,042 (98.7%) | 637 (60.3%) |
| Total | 4,078 (36.8%) | 7,054 (63.7%) |
Disability Status by Sex by Age in Alcoa
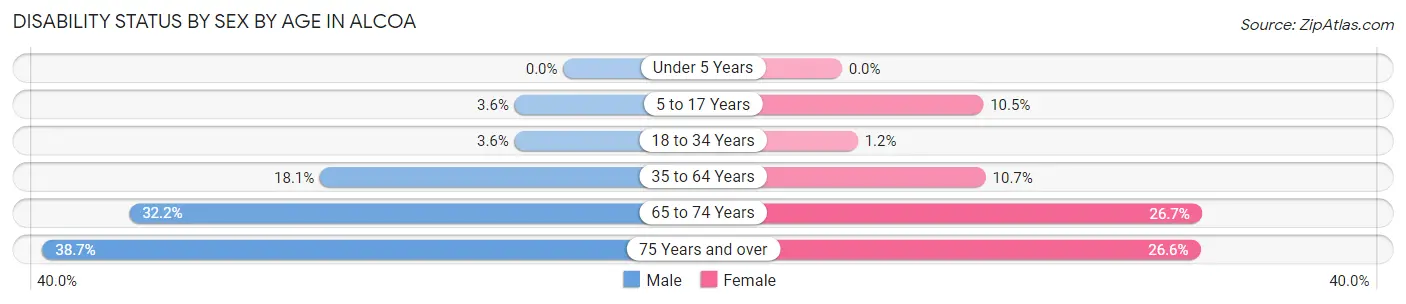
| Age Bracket | Male | Female |
| Under 5 Years | 0 (0.0%) | 0 (0.0%) |
| 5 to 17 Years | 33 (3.6%) | 108 (10.5%) |
| 18 to 34 Years | 54 (3.6%) | 14 (1.2%) |
| 35 to 64 Years | 353 (18.1%) | 200 (10.7%) |
| 65 to 74 Years | 117 (32.2%) | 152 (26.7%) |
| 75 Years and over | 205 (38.7%) | 140 (26.6%) |
Disability Class by Sex by Age in Alcoa
Disability Class: Hearing Difficulty
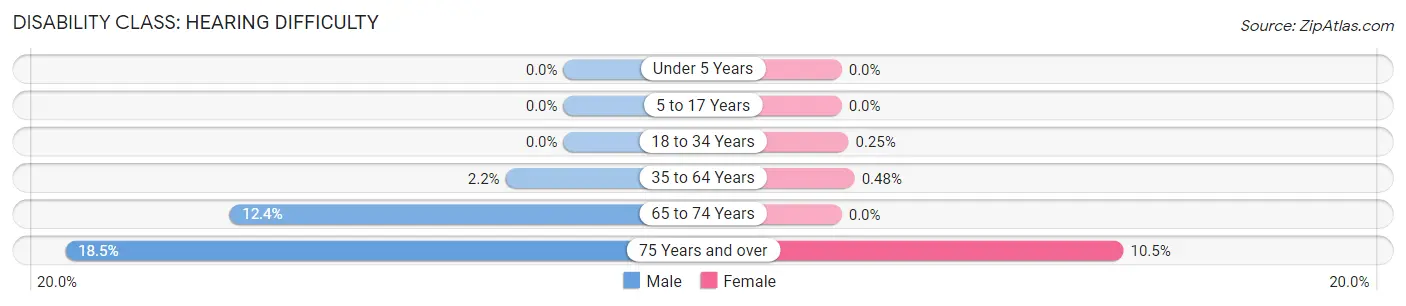
| Age Bracket | Male | Female |
| Under 5 Years | 0 (0.0%) | 0 (0.0%) |
| 5 to 17 Years | 0 (0.0%) | 0 (0.0%) |
| 18 to 34 Years | 0 (0.0%) | 3 (0.3%) |
| 35 to 64 Years | 42 (2.1%) | 9 (0.5%) |
| 65 to 74 Years | 45 (12.4%) | 0 (0.0%) |
| 75 Years and over | 98 (18.5%) | 55 (10.5%) |
Disability Class: Vision Difficulty
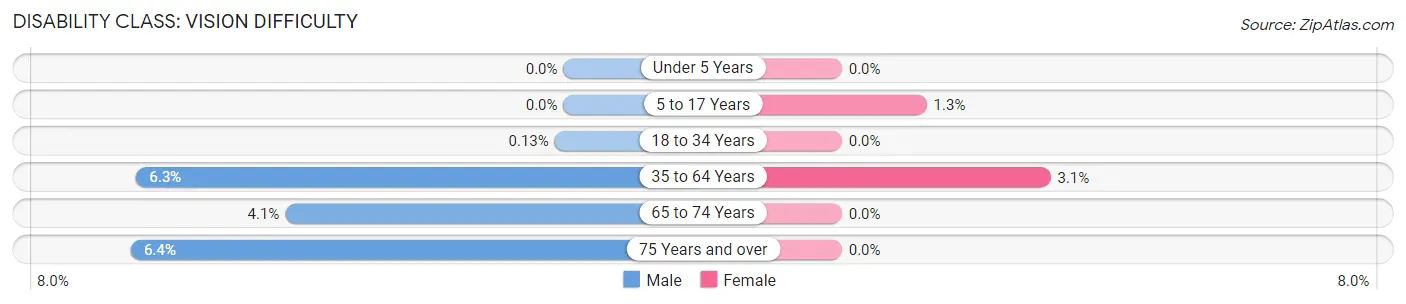
| Age Bracket | Male | Female |
| Under 5 Years | 0 (0.0%) | 0 (0.0%) |
| 5 to 17 Years | 0 (0.0%) | 13 (1.3%) |
| 18 to 34 Years | 2 (0.1%) | 0 (0.0%) |
| 35 to 64 Years | 124 (6.3%) | 58 (3.1%) |
| 65 to 74 Years | 15 (4.1%) | 0 (0.0%) |
| 75 Years and over | 34 (6.4%) | 0 (0.0%) |
Disability Class: Cognitive Difficulty
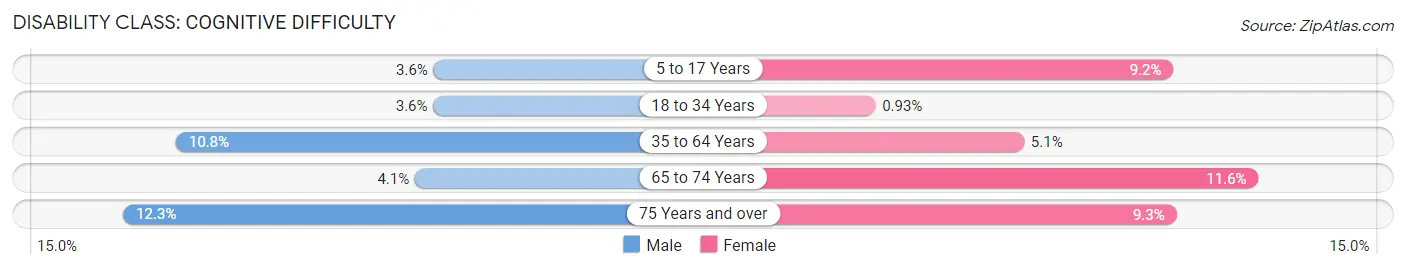
| Age Bracket | Male | Female |
| 5 to 17 Years | 33 (3.6%) | 95 (9.2%) |
| 18 to 34 Years | 54 (3.6%) | 11 (0.9%) |
| 35 to 64 Years | 211 (10.8%) | 95 (5.1%) |
| 65 to 74 Years | 15 (4.1%) | 66 (11.6%) |
| 75 Years and over | 65 (12.3%) | 49 (9.3%) |
Disability Class: Ambulatory Difficulty
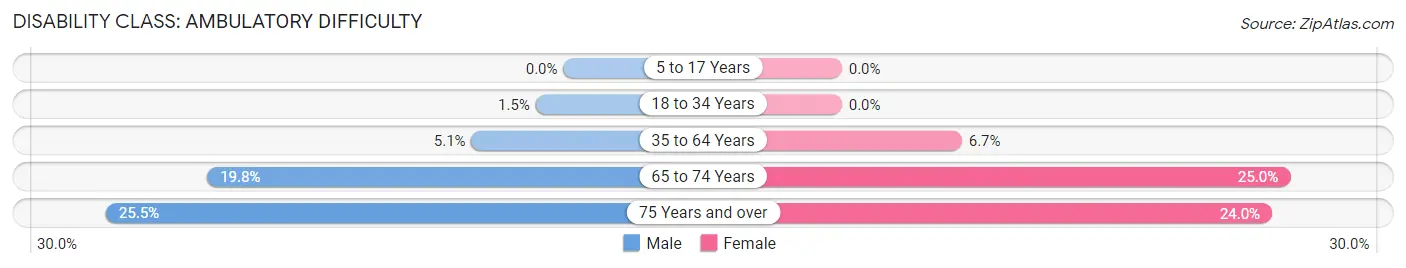
| Age Bracket | Male | Female |
| 5 to 17 Years | 0 (0.0%) | 0 (0.0%) |
| 18 to 34 Years | 23 (1.5%) | 0 (0.0%) |
| 35 to 64 Years | 100 (5.1%) | 125 (6.7%) |
| 65 to 74 Years | 72 (19.8%) | 142 (25.0%) |
| 75 Years and over | 135 (25.5%) | 126 (23.9%) |
Disability Class: Self-Care Difficulty
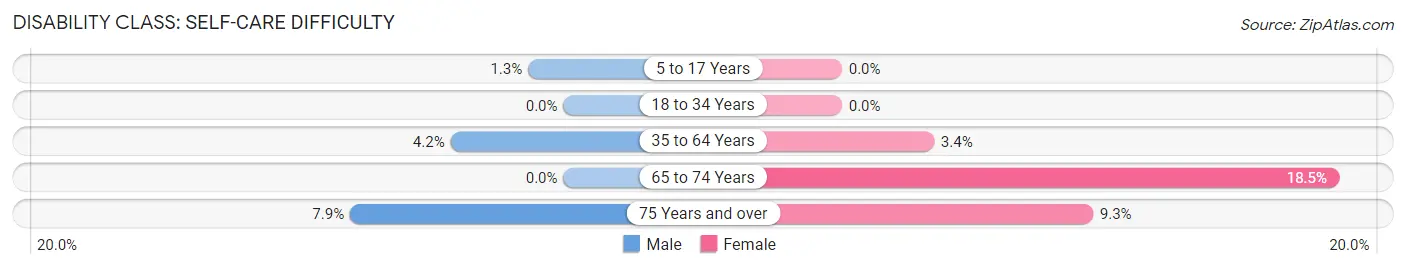
| Age Bracket | Male | Female |
| 5 to 17 Years | 12 (1.3%) | 0 (0.0%) |
| 18 to 34 Years | 0 (0.0%) | 0 (0.0%) |
| 35 to 64 Years | 82 (4.2%) | 64 (3.4%) |
| 65 to 74 Years | 0 (0.0%) | 105 (18.4%) |
| 75 Years and over | 42 (7.9%) | 49 (9.3%) |
Technology Access in Alcoa
Computing Device Access in Alcoa
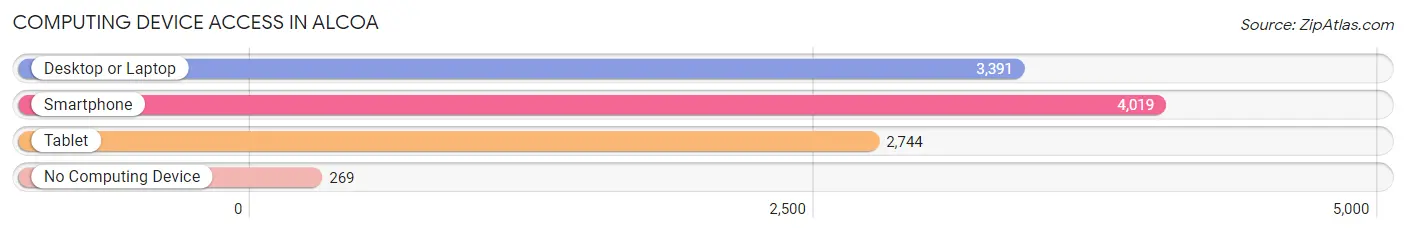
| Device Type | # Households | % Households |
| Desktop or Laptop | 3,391 | 76.1% |
| Smartphone | 4,019 | 90.1% |
| Tablet | 2,744 | 61.6% |
| No Computing Device | 269 | 6.0% |
| Total | 4,458 | 100.0% |
Internet Access in Alcoa
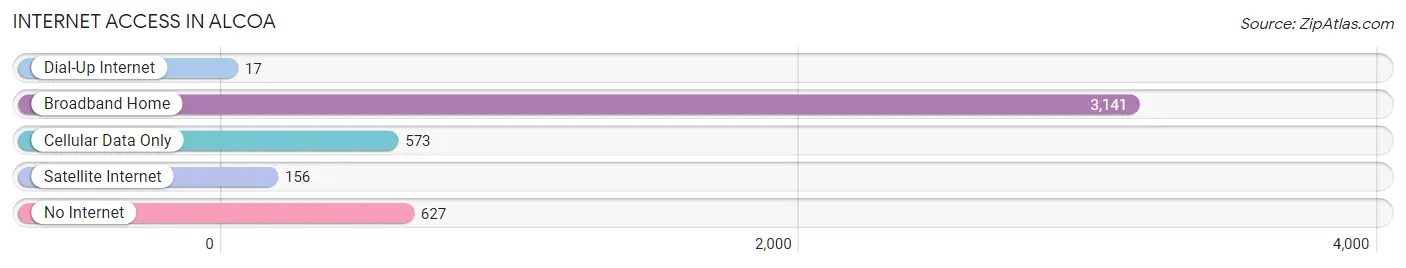
| Internet Type | # Households | % Households |
| Dial-Up Internet | 17 | 0.4% |
| Broadband Home | 3,141 | 70.5% |
| Cellular Data Only | 573 | 12.9% |
| Satellite Internet | 156 | 3.5% |
| No Internet | 627 | 14.1% |
| Total | 4,458 | 100.0% |
Alcoa Summary
Alcoa, Tennessee is a city located in Blount County, Tennessee, United States. It is part of the Knoxville metropolitan area and is located just south of Knoxville. The city is named after the aluminum company Alcoa, which is headquartered in the city. As of the 2010 census, the city had a population of 8,449.
History
The area that is now Alcoa was first settled in the early 19th century by settlers from North Carolina. The city was originally known as North Maryville, and was later renamed Alcoa in 1919 after the Aluminum Company of America (Alcoa) opened a plant in the area. The plant was the first aluminum plant in the United States and was instrumental in the development of the city.
In the early 20th century, Alcoa was a small rural community with a population of just over 1,000. The city experienced rapid growth in the 1950s and 1960s as the aluminum plant expanded and new industries moved into the area. By the 1970s, Alcoa had become a major industrial center and had a population of over 10,000.
Geography
Alcoa is located in Blount County, Tennessee, at the foothills of the Great Smoky Mountains. The city is situated along the Little River, which flows through the city. The city is located just south of Knoxville and is part of the Knoxville metropolitan area.
The city has a total area of 8.3 square miles, of which 8.2 square miles is land and 0.1 square miles is water. The city is located at an elevation of 890 feet above sea level.
Economy
Alcoa is home to the headquarters of the Aluminum Company of America (Alcoa), which is the largest employer in the city. The company operates an aluminum plant in the city, which is the oldest aluminum plant in the United States. The plant produces aluminum products for the automotive, aerospace, and construction industries.
In addition to Alcoa, the city is home to several other major employers, including Denso Manufacturing Tennessee, Inc., Blount Memorial Hospital, and the Blount County School System. The city is also home to several small businesses, including restaurants, retail stores, and professional services.
Demographics
As of the 2010 census, the city had a population of 8,449. The racial makeup of the city was 87.3% White, 8.2% African American, 0.4% Native American, 1.2% Asian, 0.1% Pacific Islander, 1.2% from other races, and 1.7% from two or more races. Hispanic or Latino of any race were 3.2% of the population.
The median income for a household in the city was $41,945, and the median income for a family was $50,945. The per capita income for the city was $21,945. About 8.2% of families and 10.2% of the population were below the poverty line, including 14.2% of those under age 18 and 8.2% of those age 65 or over.
Common Questions
What is Per Capita Income in Alcoa?
Per Capita income in Alcoa is $33,389.
What is the Median Family Income in Alcoa?
Median Family Income in Alcoa is $76,484.
What is the Median Household income in Alcoa?
Median Household Income in Alcoa is $63,580.
What is Income or Wage Gap in Alcoa?
Income or Wage Gap in Alcoa is 27.3%.
Women in Alcoa earn 72.7 cents for every dollar earned by a man.
What is Inequality or Gini Index in Alcoa?
Inequality or Gini Index in Alcoa is 0.40.
What is the Total Population of Alcoa?
Total Population of Alcoa is 11,095.
What is the Total Male Population of Alcoa?
Total Male Population of Alcoa is 5,553.
What is the Total Female Population of Alcoa?
Total Female Population of Alcoa is 5,542.
What is the Ratio of Males per 100 Females in Alcoa?
There are 100.20 Males per 100 Females in Alcoa.
What is the Ratio of Females per 100 Males in Alcoa?
There are 99.80 Females per 100 Males in Alcoa.
What is the Median Population Age in Alcoa?
Median Population Age in Alcoa is 36.3 Years.
What is the Average Family Size in Alcoa
Average Family Size in Alcoa is 3.2 People.
What is the Average Household Size in Alcoa
Average Household Size in Alcoa is 2.5 People.
How Large is the Labor Force in Alcoa?
There are 5,945 People in the Labor Forcein in Alcoa.
What is the Percentage of People in the Labor Force in Alcoa?
68.8% of People are in the Labor Force in Alcoa.
What is the Unemployment Rate in Alcoa?
Unemployment Rate in Alcoa is 4.0%.