Zip Codes with the Highest Percentage of Families with Income Above $200,000 in Tennessee
RELATED REPORTS & OPTIONS
Family Income | $200k+
Tennessee
Compare Zip Codes
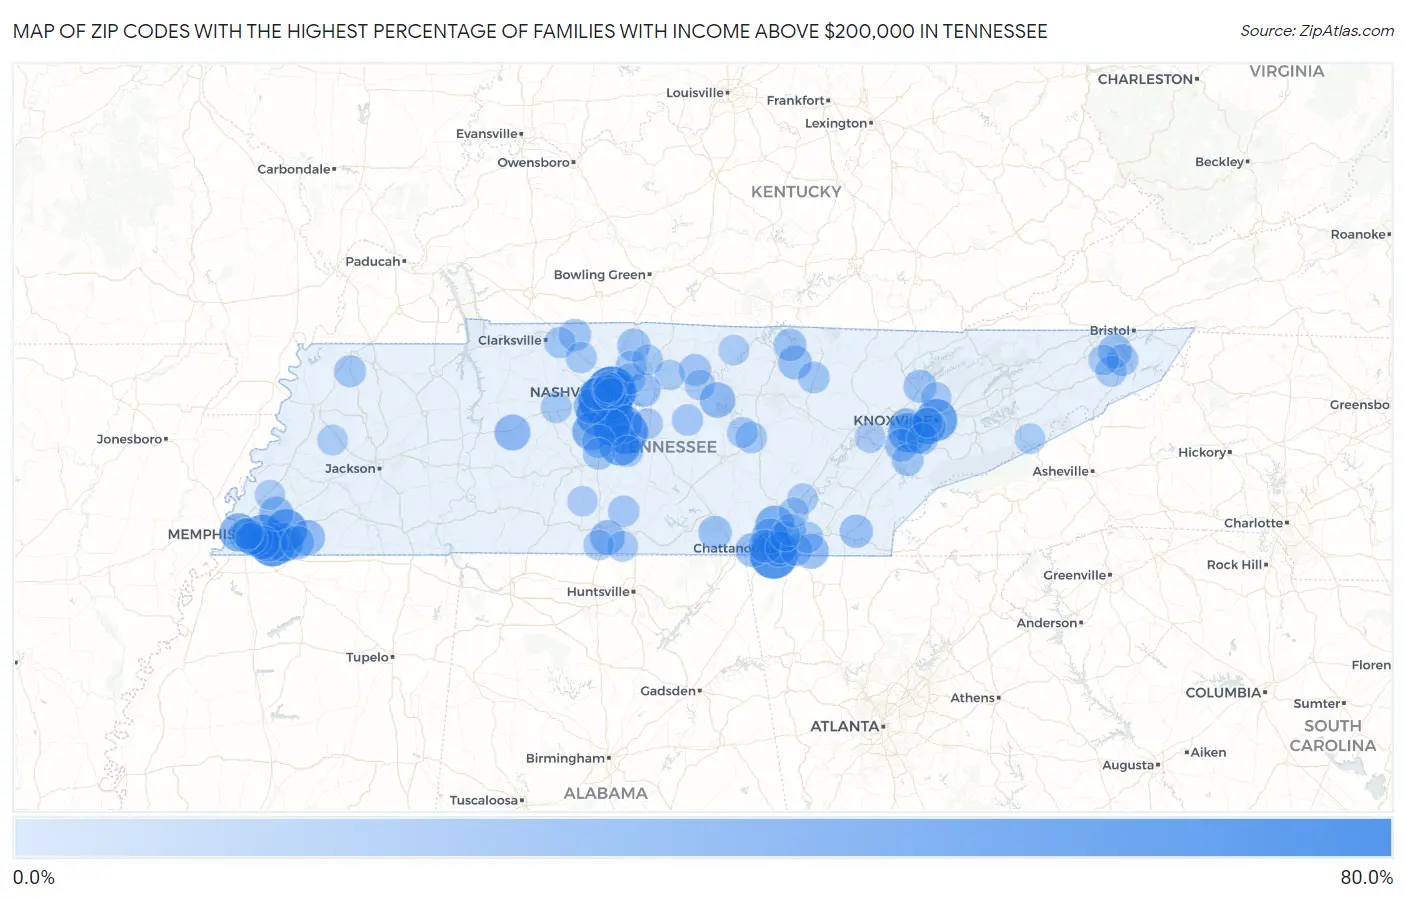
Map of Zip Codes with the Highest Percentage of Families with Income Above $200,000 in Tennessee
0.0%
80.0%
Zip Codes with the Highest Percentage of Families with Income Above $200,000 in Tennessee
| Zip Code | Families with Income > $200k | vs State | vs National | |
| 1. | 37201 | 60.7% | 9.7%(+51.0)#1 | 14.8%(+45.9)#279 |
| 2. | 37350 | 55.6% | 9.7%(+45.9)#2 | 14.8%(+40.8)#433 |
| 3. | 37215 | 54.8% | 9.7%(+45.1)#3 | 14.8%(+40.0)#462 |
| 4. | 37205 | 51.7% | 9.7%(+42.0)#4 | 14.8%(+36.9)#584 |
| 5. | 38139 | 49.9% | 9.7%(+40.2)#5 | 14.8%(+35.1)#674 |
| 6. | 37027 | 45.1% | 9.7%(+35.4)#6 | 14.8%(+30.3)#931 |
| 7. | 37014 | 44.4% | 9.7%(+34.7)#7 | 14.8%(+29.6)#970 |
| 8. | 38120 | 43.9% | 9.7%(+34.2)#8 | 14.8%(+29.1)#999 |
| 9. | 37219 | 42.5% | 9.7%(+32.8)#9 | 14.8%(+27.7)#1,099 |
| 10. | 37069 | 41.3% | 9.7%(+31.6)#10 | 14.8%(+26.5)#1,197 |
| 11. | 37220 | 41.0% | 9.7%(+31.3)#11 | 14.8%(+26.2)#1,227 |
| 12. | 37902 | 40.6% | 9.7%(+30.9)#12 | 14.8%(+25.8)#1,268 |
| 13. | 37212 | 40.4% | 9.7%(+30.7)#13 | 14.8%(+25.6)#1,277 |
| 14. | 38028 | 40.2% | 9.7%(+30.5)#14 | 14.8%(+25.4)#1,291 |
| 15. | 37204 | 39.7% | 9.7%(+30.0)#15 | 14.8%(+24.9)#1,338 |
| 16. | 37046 | 38.5% | 9.7%(+28.8)#16 | 14.8%(+23.7)#1,463 |
| 17. | 37934 | 33.2% | 9.7%(+23.5)#17 | 14.8%(+18.4)#2,080 |
| 18. | 37377 | 33.2% | 9.7%(+23.5)#18 | 14.8%(+18.4)#2,084 |
| 19. | 38017 | 32.6% | 9.7%(+22.9)#19 | 14.8%(+17.8)#2,150 |
| 20. | 38138 | 32.0% | 9.7%(+22.3)#20 | 14.8%(+17.2)#2,223 |
| 21. | 38103 | 31.4% | 9.7%(+21.7)#21 | 14.8%(+16.6)#2,310 |
| 22. | 37064 | 30.8% | 9.7%(+21.1)#22 | 14.8%(+16.0)#2,394 |
| 23. | 37135 | 29.9% | 9.7%(+20.2)#23 | 14.8%(+15.1)#2,527 |
| 24. | 37922 | 29.0% | 9.7%(+19.3)#24 | 14.8%(+14.2)#2,666 |
| 25. | 37067 | 28.7% | 9.7%(+19.0)#25 | 14.8%(+13.9)#2,731 |
| 26. | 37408 | 26.9% | 9.7%(+17.2)#26 | 14.8%(+12.1)#3,072 |
| 27. | 37919 | 26.7% | 9.7%(+17.0)#27 | 14.8%(+11.9)#3,104 |
| 28. | 37140 | 25.0% | 9.7%(+15.3)#28 | 14.8%(+10.2)#3,475 |
| 29. | 37405 | 24.6% | 9.7%(+14.9)#29 | 14.8%(+9.80)#3,572 |
| 30. | 38569 | 23.9% | 9.7%(+14.2)#30 | 14.8%(+9.10)#3,747 |
| 31. | 38117 | 22.8% | 9.7%(+13.1)#31 | 14.8%(+8.00)#3,992 |
| 32. | 38076 | 22.7% | 9.7%(+13.0)#32 | 14.8%(+7.90)#4,028 |
| 33. | 37302 | 22.4% | 9.7%(+12.7)#33 | 14.8%(+7.60)#4,122 |
| 34. | 37221 | 22.2% | 9.7%(+12.5)#34 | 14.8%(+7.40)#4,152 |
| 35. | 38453 | 21.8% | 9.7%(+12.1)#35 | 14.8%(+7.00)#4,288 |
| 36. | 38002 | 20.8% | 9.7%(+11.1)#36 | 14.8%(+6.00)#4,558 |
| 37. | 37206 | 20.8% | 9.7%(+11.1)#37 | 14.8%(+6.00)#4,563 |
| 38. | 38119 | 20.8% | 9.7%(+11.1)#38 | 14.8%(+6.00)#4,569 |
| 39. | 37340 | 20.3% | 9.7%(+10.6)#39 | 14.8%(+5.50)#4,738 |
| 40. | 38543 | 19.6% | 9.7%(+9.90)#40 | 14.8%(+4.80)#4,961 |
| 41. | 37686 | 19.5% | 9.7%(+9.80)#41 | 14.8%(+4.70)#4,979 |
| 42. | 37122 | 18.9% | 9.7%(+9.20)#42 | 14.8%(+4.10)#5,172 |
| 43. | 38104 | 18.7% | 9.7%(+9.00)#43 | 14.8%(+3.90)#5,283 |
| 44. | 38066 | 18.7% | 9.7%(+9.00)#44 | 14.8%(+3.90)#5,299 |
| 45. | 37932 | 18.5% | 9.7%(+8.80)#45 | 14.8%(+3.70)#5,362 |
| 46. | 37419 | 18.4% | 9.7%(+8.70)#46 | 14.8%(+3.60)#5,426 |
| 47. | 37179 | 18.3% | 9.7%(+8.60)#47 | 14.8%(+3.50)#5,455 |
| 48. | 37307 | 18.2% | 9.7%(+8.50)#48 | 14.8%(+3.40)#5,497 |
| 49. | 37375 | 18.1% | 9.7%(+8.40)#49 | 14.8%(+3.30)#5,541 |
| 50. | 37828 | 17.7% | 9.7%(+8.00)#50 | 14.8%(+2.90)#5,701 |
| 51. | 37048 | 17.4% | 9.7%(+7.70)#51 | 14.8%(+2.60)#5,824 |
| 52. | 37772 | 17.3% | 9.7%(+7.60)#52 | 14.8%(+2.50)#5,860 |
| 53. | 38573 | 17.0% | 9.7%(+7.30)#53 | 14.8%(+2.20)#6,015 |
| 54. | 37209 | 16.5% | 9.7%(+6.80)#54 | 14.8%(+1.70)#6,198 |
| 55. | 38111 | 15.9% | 9.7%(+6.20)#55 | 14.8%(+1.10)#6,488 |
| 56. | 37010 | 15.6% | 9.7%(+5.90)#56 | 14.8%(+0.800)#6,653 |
| 57. | 37151 | 15.3% | 9.7%(+5.60)#57 | 14.8%(+0.500)#6,827 |
| 58. | 37403 | 14.8% | 9.7%(+5.10)#58 | 14.8%(=0.000)#7,102 |
| 59. | 38253 | 14.8% | 9.7%(+5.10)#59 | 14.8%(=0.000)#7,127 |
| 60. | 37174 | 14.7% | 9.7%(+5.00)#60 | 14.8%(-0.100)#7,144 |
| 61. | 37421 | 14.6% | 9.7%(+4.90)#61 | 14.8%(-0.200)#7,203 |
| 62. | 37742 | 14.6% | 9.7%(+4.90)#62 | 14.8%(-0.200)#7,227 |
| 63. | 37694 | 14.6% | 9.7%(+4.90)#63 | 14.8%(-0.200)#7,234 |
| 64. | 38112 | 14.5% | 9.7%(+4.80)#64 | 14.8%(-0.300)#7,272 |
| 65. | 37343 | 14.4% | 9.7%(+4.70)#65 | 14.8%(-0.400)#7,310 |
| 66. | 38565 | 14.3% | 9.7%(+4.60)#66 | 14.8%(-0.500)#7,404 |
| 67. | 37363 | 13.8% | 9.7%(+4.10)#67 | 14.8%(-1.00)#7,649 |
| 68. | 37075 | 13.6% | 9.7%(+3.90)#68 | 14.8%(-1.20)#7,795 |
| 69. | 37138 | 13.6% | 9.7%(+3.90)#69 | 14.8%(-1.20)#7,808 |
| 70. | 37016 | 13.6% | 9.7%(+3.90)#70 | 14.8%(-1.20)#7,837 |
| 71. | 37203 | 13.5% | 9.7%(+3.80)#71 | 14.8%(-1.30)#7,871 |
| 72. | 37777 | 13.5% | 9.7%(+3.80)#72 | 14.8%(-1.30)#7,872 |
| 73. | 37060 | 13.5% | 9.7%(+3.80)#73 | 14.8%(-1.30)#7,886 |
| 74. | 38579 | 13.5% | 9.7%(+3.80)#74 | 14.8%(-1.30)#7,897 |
| 75. | 37043 | 13.3% | 9.7%(+3.60)#75 | 14.8%(-1.50)#7,978 |
| 76. | 37144 | 13.3% | 9.7%(+3.60)#76 | 14.8%(-1.50)#8,022 |
| 77. | 37146 | 12.9% | 9.7%(+3.20)#77 | 14.8%(-1.90)#8,311 |
| 78. | 37029 | 12.9% | 9.7%(+3.20)#78 | 14.8%(-1.90)#8,312 |
| 79. | 37604 | 12.8% | 9.7%(+3.10)#79 | 14.8%(-2.00)#8,354 |
| 80. | 37066 | 12.6% | 9.7%(+2.90)#80 | 14.8%(-2.20)#8,478 |
| 81. | 38587 | 12.5% | 9.7%(+2.80)#81 | 14.8%(-2.30)#8,606 |
| 82. | 38488 | 12.2% | 9.7%(+2.50)#82 | 14.8%(-2.60)#8,851 |
| 83. | 37208 | 12.0% | 9.7%(+2.30)#83 | 14.8%(-2.80)#8,978 |
| 84. | 38455 | 11.8% | 9.7%(+2.10)#84 | 14.8%(-3.00)#9,176 |
| 85. | 37129 | 11.6% | 9.7%(+1.90)#85 | 14.8%(-3.20)#9,253 |
| 86. | 37763 | 11.6% | 9.7%(+1.90)#86 | 14.8%(-3.20)#9,273 |
| 87. | 37373 | 11.6% | 9.7%(+1.90)#87 | 14.8%(-3.20)#9,304 |
| 88. | 38563 | 11.6% | 9.7%(+1.90)#88 | 14.8%(-3.20)#9,308 |
| 89. | 37615 | 11.5% | 9.7%(+1.80)#89 | 14.8%(-3.30)#9,356 |
| 90. | 37938 | 11.5% | 9.7%(+1.80)#90 | 14.8%(-3.30)#9,361 |
| 91. | 37228 | 11.5% | 9.7%(+1.80)#91 | 14.8%(-3.30)#9,389 |
| 92. | 38050 | 11.5% | 9.7%(+1.80)#92 | 14.8%(-3.30)#9,411 |
| 93. | 38588 | 11.3% | 9.7%(+1.60)#93 | 14.8%(-3.50)#9,588 |
| 94. | 37753 | 11.1% | 9.7%(+1.40)#94 | 14.8%(-3.70)#9,770 |
| 95. | 37415 | 11.0% | 9.7%(+1.30)#95 | 14.8%(-3.80)#9,818 |
| 96. | 38472 | 11.0% | 9.7%(+1.30)#96 | 14.8%(-3.80)#9,846 |
| 97. | 37087 | 10.8% | 9.7%(+1.10)#97 | 14.8%(-4.00)#9,987 |
| 98. | 37379 | 10.7% | 9.7%(+1.00)#98 | 14.8%(-4.10)#10,099 |
| 99. | 37909 | 10.7% | 9.7%(+1.00)#99 | 14.8%(-4.10)#10,111 |
| 100. | 38004 | 10.7% | 9.7%(+1.00)#100 | 14.8%(-4.10)#10,121 |
Common Questions
What are the Top 10 Zip Codes with the Highest Percentage of Families with Income Above $200,000 in Tennessee?
Top 10 Zip Codes with the Highest Percentage of Families with Income Above $200,000 in Tennessee are:
What zip code has the Highest Percentage of Families with Income Above $200,000 in Tennessee?
37201 has the Highest Percentage of Families with Income Above $200,000 in Tennessee with 60.7%.
What is the Percentage of Families with Income Above $200,000 in the State of Tennessee?
Percentage of Families with Income Above $200,000 in Tennessee is 9.7%.
What is the Percentage of Families with Income Above $200,000 in the United States?
Percentage of Families with Income Above $200,000 in the United States is 14.8%.