Falling Water, TN Map & Demographics
Falling Water Map
Falling Water Overview
$46,737
PER CAPITA INCOME
$129,531
AVG FAMILY INCOME
$117,639
AVG HOUSEHOLD INCOME
37.7%
WAGE / INCOME GAP [ % ]
62.3¢/ $1
WAGE / INCOME GAP [ $ ]
0.40
INEQUALITY / GINI INDEX
2,022
TOTAL POPULATION
955
MALE POPULATION
1,067
FEMALE POPULATION
89.50
MALES / 100 FEMALES
111.73
FEMALES / 100 MALES
44.2
MEDIAN AGE
3.2
AVG FAMILY SIZE
2.9
AVG HOUSEHOLD SIZE
1,094
LABOR FORCE [ PEOPLE ]
66.8%
PERCENT IN LABOR FORCE
3.5%
UNEMPLOYMENT RATE
Income in Falling Water
Income Overview in Falling Water
Per Capita Income in Falling Water is $46,737, while median incomes of families and households are $129,531 and $117,639 respectively.
| Characteristic | Number | Measure |
| Per Capita Income | 2,022 | $46,737 |
| Median Family Income | 582 | $129,531 |
| Mean Family Income | 582 | $147,162 |
| Median Household Income | 687 | $117,639 |
| Mean Household Income | 687 | $134,759 |
| Income Deficit | 582 | $0 |
| Wage / Income Gap (%) | 2,022 | 37.73% |
| Wage / Income Gap ($) | 2,022 | 62.27¢ per $1 |
| Gini / Inequality Index | 2,022 | 0.40 |
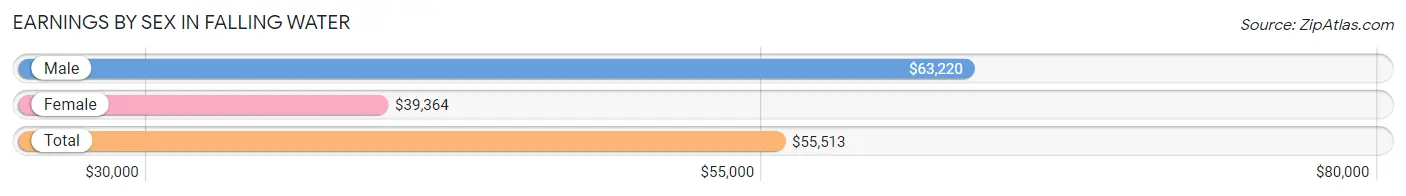
Earnings by Sex in Falling Water
Average Earnings in Falling Water are $55,513, $63,220 for men and $39,364 for women, a difference of 37.7%.
| Sex | Number | Average Earnings |
| Male | 578 (50.9%) | $63,220 |
| Female | 557 (49.1%) | $39,364 |
| Total | 1,135 (100.0%) | $55,513 |
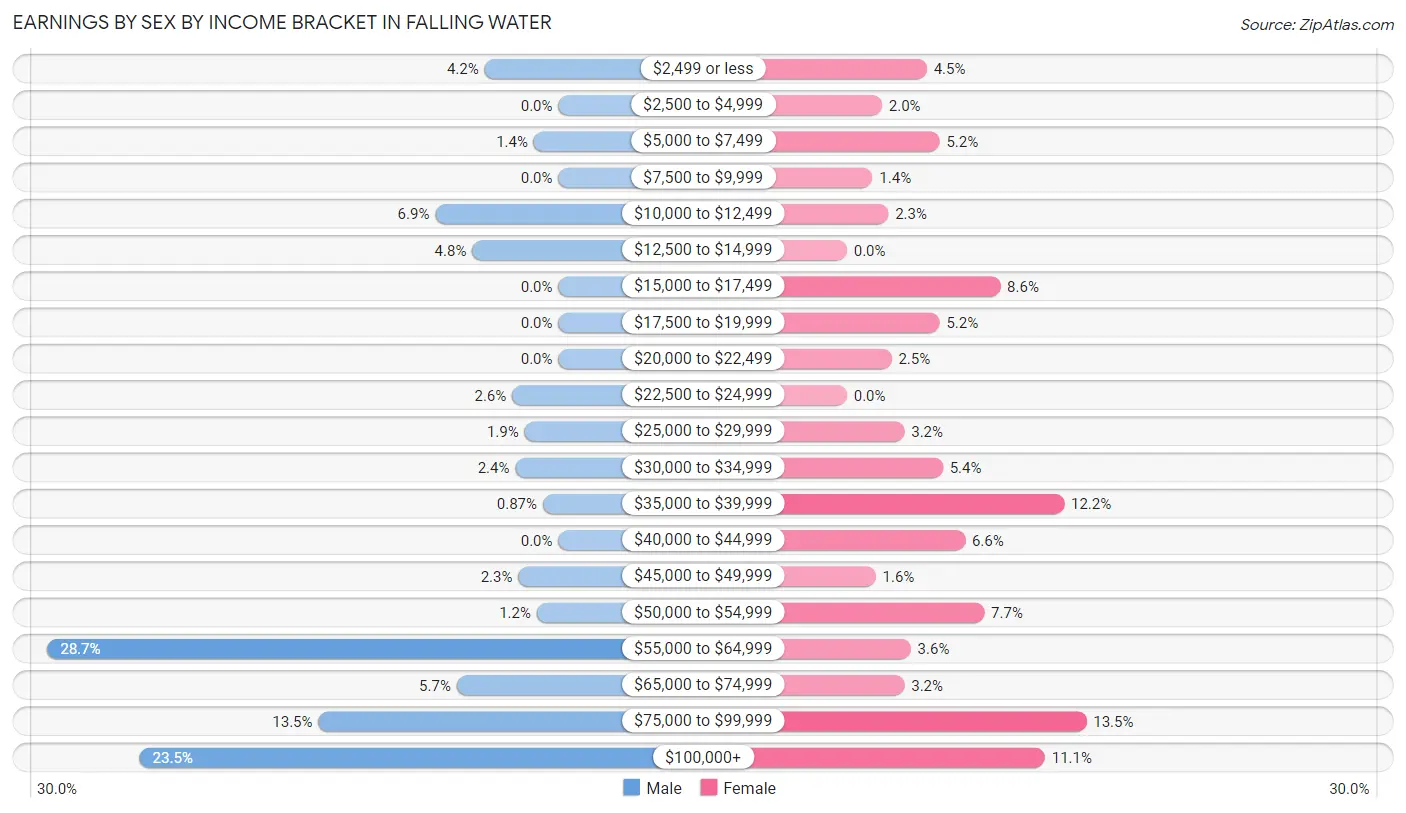
Earnings by Sex by Income Bracket in Falling Water
The most common earnings brackets in Falling Water are $55,000 to $64,999 for men (166 | 28.7%) and $75,000 to $99,999 for women (75 | 13.5%).
| Income | Male | Female |
| $2,499 or less | 24 (4.2%) | 25 (4.5%) |
| $2,500 to $4,999 | 0 (0.0%) | 11 (2.0%) |
| $5,000 to $7,499 | 8 (1.4%) | 29 (5.2%) |
| $7,500 to $9,999 | 0 (0.0%) | 8 (1.4%) |
| $10,000 to $12,499 | 40 (6.9%) | 13 (2.3%) |
| $12,500 to $14,999 | 28 (4.8%) | 0 (0.0%) |
| $15,000 to $17,499 | 0 (0.0%) | 48 (8.6%) |
| $17,500 to $19,999 | 0 (0.0%) | 29 (5.2%) |
| $20,000 to $22,499 | 0 (0.0%) | 14 (2.5%) |
| $22,500 to $24,999 | 15 (2.6%) | 0 (0.0%) |
| $25,000 to $29,999 | 11 (1.9%) | 18 (3.2%) |
| $30,000 to $34,999 | 14 (2.4%) | 30 (5.4%) |
| $35,000 to $39,999 | 5 (0.9%) | 68 (12.2%) |
| $40,000 to $44,999 | 0 (0.0%) | 37 (6.6%) |
| $45,000 to $49,999 | 13 (2.2%) | 9 (1.6%) |
| $50,000 to $54,999 | 7 (1.2%) | 43 (7.7%) |
| $55,000 to $64,999 | 166 (28.7%) | 20 (3.6%) |
| $65,000 to $74,999 | 33 (5.7%) | 18 (3.2%) |
| $75,000 to $99,999 | 78 (13.5%) | 75 (13.5%) |
| $100,000+ | 136 (23.5%) | 62 (11.1%) |
| Total | 578 (100.0%) | 557 (100.0%) |
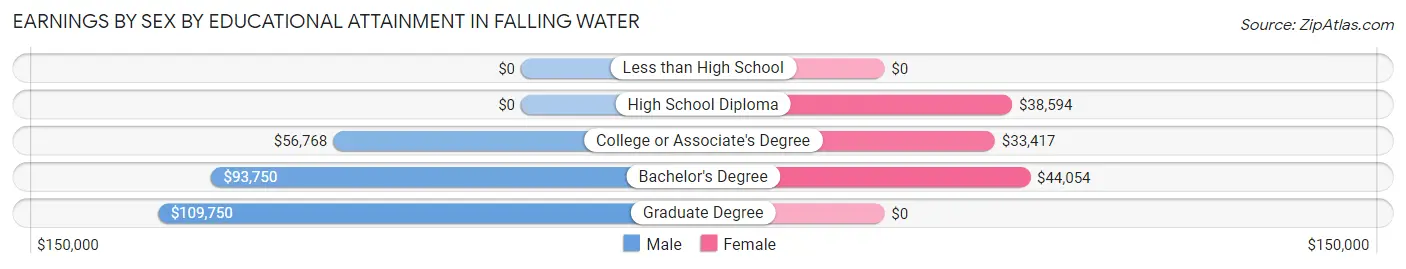
Earnings by Sex by Educational Attainment in Falling Water
Average earnings in Falling Water are $66,771 for men and $43,818 for women, a difference of 34.4%. Men with an educational attainment of graduate degree enjoy the highest average annual earnings of $109,750, while those with college or associate's degree education earn the least with $56,768. Women with an educational attainment of bachelor's degree earn the most with the average annual earnings of $44,054, while those with college or associate's degree education have the smallest earnings of $33,417.
| Educational Attainment | Male Income | Female Income |
| Less than High School | - | - |
| High School Diploma | - | - |
| College or Associate's Degree | $56,768 | $33,417 |
| Bachelor's Degree | $93,750 | $44,054 |
| Graduate Degree | $109,750 | $0 |
| Total | $66,771 | $43,818 |
Family Income in Falling Water
Family Income Brackets in Falling Water
According to the Falling Water family income data, there are 159 families falling into the $150,000 to $199,999 income range, which is the most common income bracket and makes up 27.3% of all families.
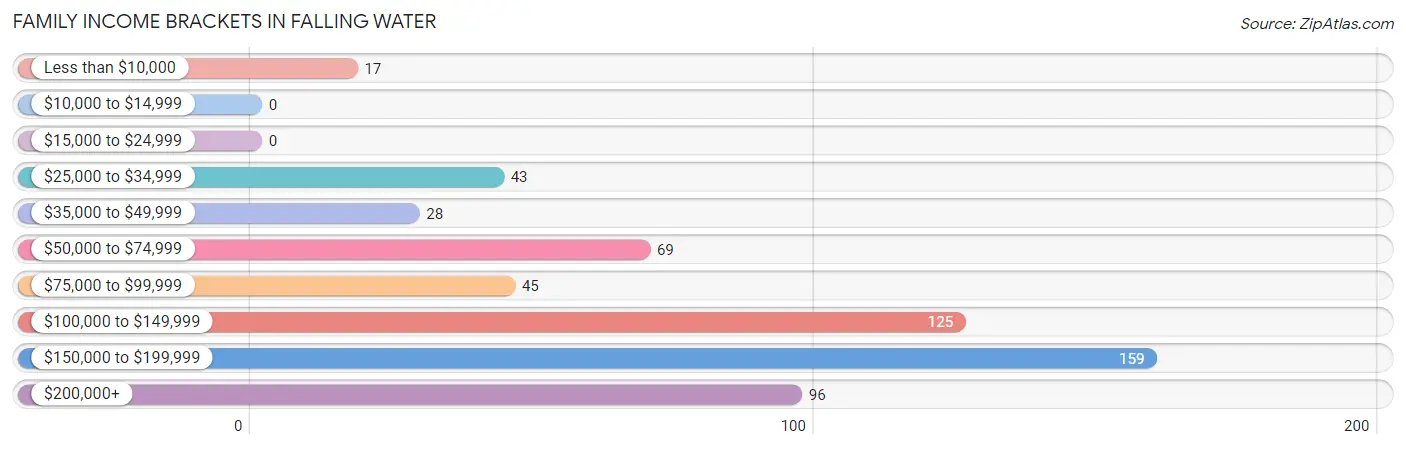
| Income Bracket | # Families | % Families |
| Less than $10,000 | 17 | 2.9% |
| $10,000 to $14,999 | 0 | 0.0% |
| $15,000 to $24,999 | 0 | 0.0% |
| $25,000 to $34,999 | 43 | 7.4% |
| $35,000 to $49,999 | 28 | 4.8% |
| $50,000 to $74,999 | 69 | 11.9% |
| $75,000 to $99,999 | 45 | 7.7% |
| $100,000 to $149,999 | 125 | 21.5% |
| $150,000 to $199,999 | 159 | 27.3% |
| $200,000+ | 96 | 16.5% |
Family Income by Famaliy Size in Falling Water
6-person families (28 | 4.8%) account for the highest median family income in Falling Water with $193,654 per family, while 4-person families (112 | 19.2%) have the highest median income of $46,625 per family member.
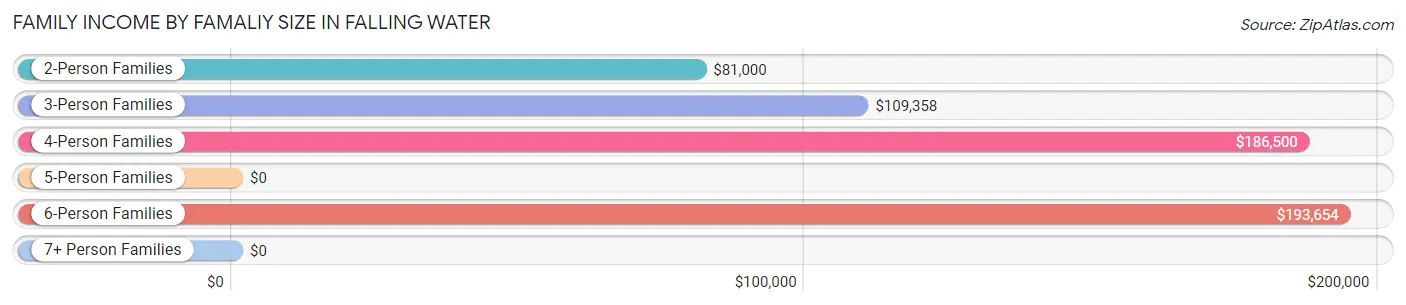
| Income Bracket | # Families | Median Income |
| 2-Person Families | 220 (37.8%) | $81,000 |
| 3-Person Families | 181 (31.1%) | $109,358 |
| 4-Person Families | 112 (19.2%) | $186,500 |
| 5-Person Families | 28 (4.8%) | $0 |
| 6-Person Families | 28 (4.8%) | $193,654 |
| 7+ Person Families | 13 (2.2%) | $0 |
| Total | 582 (100.0%) | $129,531 |
Family Income by Number of Earners in Falling Water
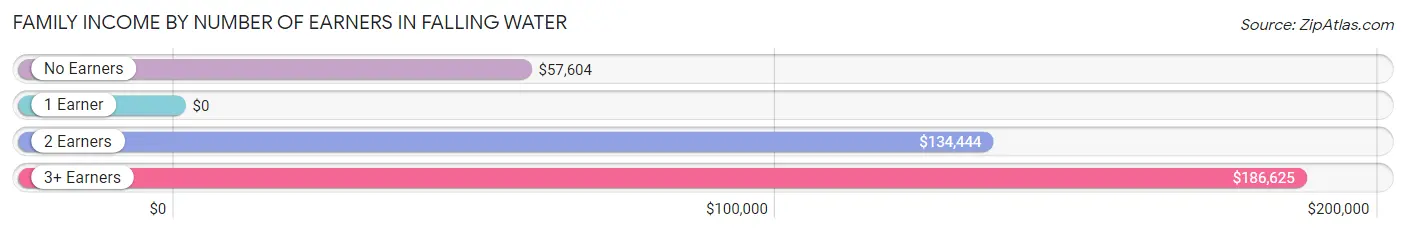
| Number of Earners | # Families | Median Income |
| No Earners | 108 (18.6%) | $57,604 |
| 1 Earner | 138 (23.7%) | $0 |
| 2 Earners | 180 (30.9%) | $134,444 |
| 3+ Earners | 156 (26.8%) | $186,625 |
| Total | 582 (100.0%) | $129,531 |
Household Income in Falling Water
Household Income Brackets in Falling Water
With 134 households falling in the category, the $100,000 to $149,999 income range is the most frequent in Falling Water, accounting for 19.5% of all households.
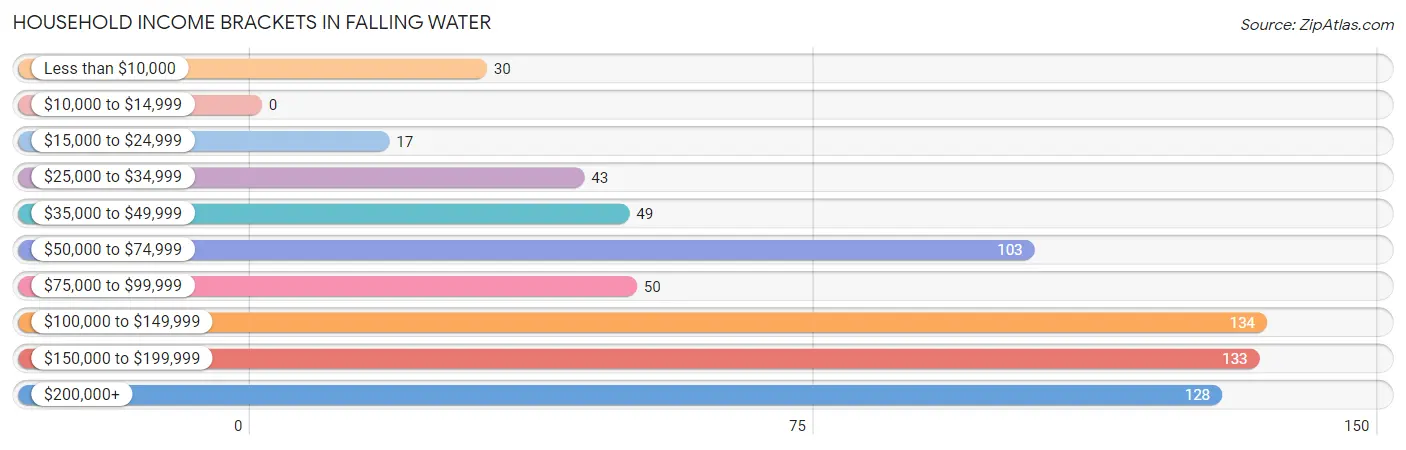
| Income Bracket | # Households | % Households |
| Less than $10,000 | 30 | 4.4% |
| $10,000 to $14,999 | 0 | 0.0% |
| $15,000 to $24,999 | 17 | 2.5% |
| $25,000 to $34,999 | 43 | 6.3% |
| $35,000 to $49,999 | 49 | 7.1% |
| $50,000 to $74,999 | 103 | 15.0% |
| $75,000 to $99,999 | 50 | 7.3% |
| $100,000 to $149,999 | 134 | 19.5% |
| $150,000 to $199,999 | 133 | 19.4% |
| $200,000+ | 128 | 18.6% |
Household Income by Householder Age in Falling Water
The median household income in Falling Water is $117,639, with the highest median household income of $174,044 found in the 45 to 64 years age bracket for the primary householder. A total of 259 households (37.7%) fall into this category.
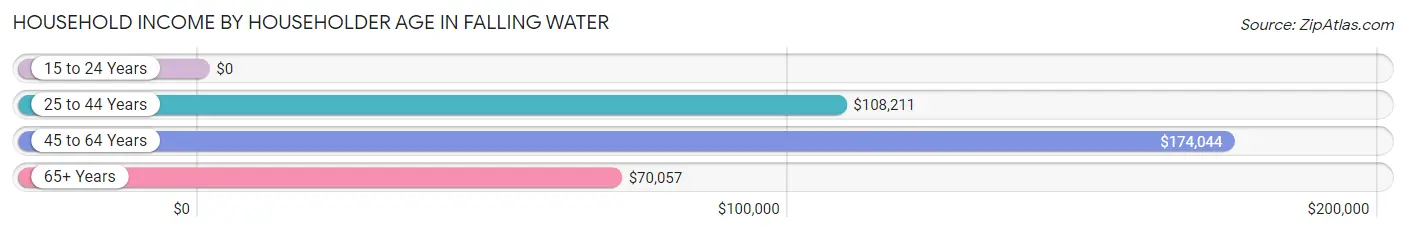
| Income Bracket | # Households | Median Income |
| 15 to 24 Years | 0 (0.0%) | $0 |
| 25 to 44 Years | 221 (32.2%) | $108,211 |
| 45 to 64 Years | 259 (37.7%) | $174,044 |
| 65+ Years | 207 (30.1%) | $70,057 |
| Total | 687 (100.0%) | $117,639 |
Poverty in Falling Water
Income Below Poverty by Sex and Age in Falling Water
With 5.4% poverty level for males and 1.6% for females among the residents of Falling Water, 18 to 24 year old males and 65 to 74 year old females are the most vulnerable to poverty, with 22 males (18.6%) and 17 females (11.0%) in their respective age groups living below the poverty level.
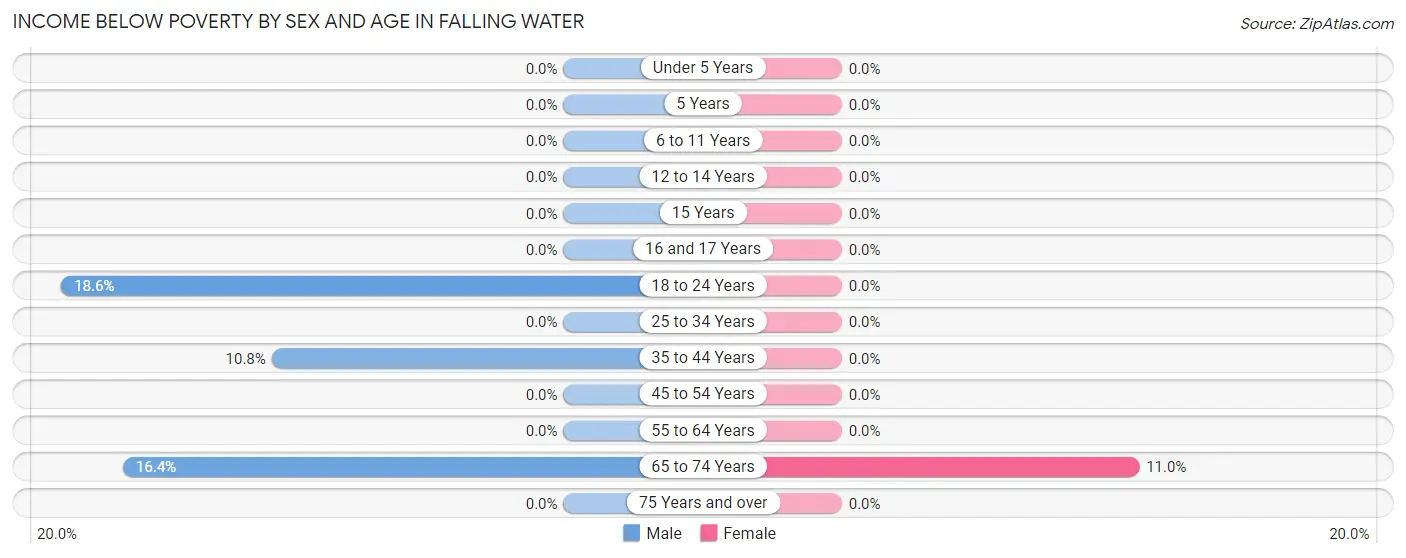
| Age Bracket | Male | Female |
| Under 5 Years | 0 (0.0%) | 0 (0.0%) |
| 5 Years | 0 (0.0%) | 0 (0.0%) |
| 6 to 11 Years | 0 (0.0%) | 0 (0.0%) |
| 12 to 14 Years | 0 (0.0%) | 0 (0.0%) |
| 15 Years | 0 (0.0%) | 0 (0.0%) |
| 16 and 17 Years | 0 (0.0%) | 0 (0.0%) |
| 18 to 24 Years | 22 (18.6%) | 0 (0.0%) |
| 25 to 34 Years | 0 (0.0%) | 0 (0.0%) |
| 35 to 44 Years | 13 (10.8%) | 0 (0.0%) |
| 45 to 54 Years | 0 (0.0%) | 0 (0.0%) |
| 55 to 64 Years | 0 (0.0%) | 0 (0.0%) |
| 65 to 74 Years | 17 (16.4%) | 17 (11.0%) |
| 75 Years and over | 0 (0.0%) | 0 (0.0%) |
| Total | 52 (5.4%) | 17 (1.6%) |
Income Above Poverty by Sex and Age in Falling Water
According to the poverty statistics in Falling Water, males aged under 5 years and females aged under 5 years are the age groups that are most secure financially, with 100.0% of males and 100.0% of females in these age groups living above the poverty line.
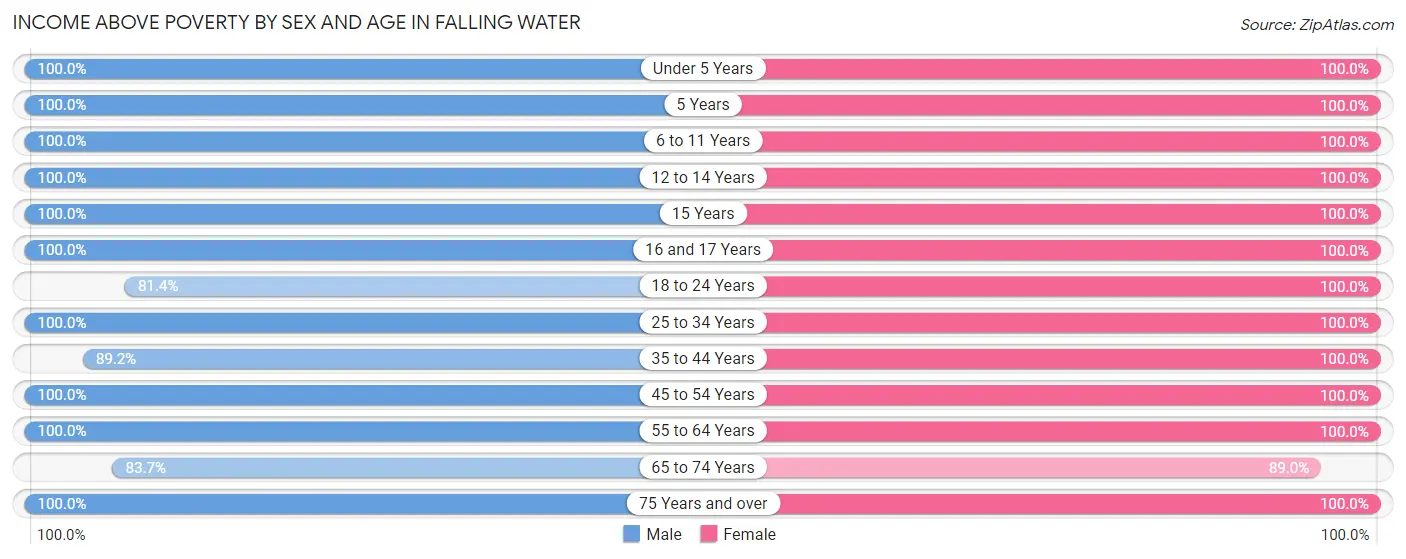
| Age Bracket | Male | Female |
| Under 5 Years | 19 (100.0%) | 83 (100.0%) |
| 5 Years | 11 (100.0%) | 20 (100.0%) |
| 6 to 11 Years | 34 (100.0%) | 57 (100.0%) |
| 12 to 14 Years | 47 (100.0%) | 42 (100.0%) |
| 15 Years | 29 (100.0%) | 43 (100.0%) |
| 16 and 17 Years | 9 (100.0%) | 55 (100.0%) |
| 18 to 24 Years | 96 (81.4%) | 28 (100.0%) |
| 25 to 34 Years | 98 (100.0%) | 110 (100.0%) |
| 35 to 44 Years | 107 (89.2%) | 120 (100.0%) |
| 45 to 54 Years | 184 (100.0%) | 161 (100.0%) |
| 55 to 64 Years | 163 (100.0%) | 136 (100.0%) |
| 65 to 74 Years | 87 (83.7%) | 137 (89.0%) |
| 75 Years and over | 19 (100.0%) | 58 (100.0%) |
| Total | 903 (94.6%) | 1,050 (98.4%) |
Income Below Poverty Among Married-Couple Families in Falling Water
The poverty statistics for married-couple families in Falling Water show that 3.4% or 17 of the total 499 families live below the poverty line. Families with no children have the highest poverty rate of 6.6%, comprising of 17 families. On the other hand, families with 1 or 2 children have the lowest poverty rate of 0.0%, which includes 0 families.
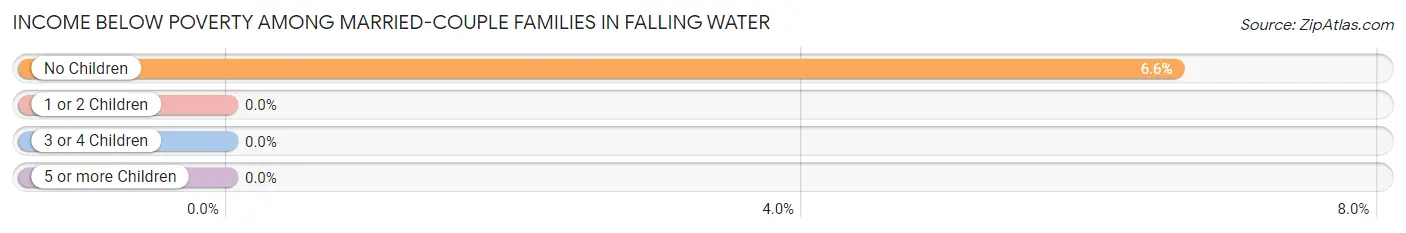
| Children | Above Poverty | Below Poverty |
| No Children | 241 (93.4%) | 17 (6.6%) |
| 1 or 2 Children | 200 (100.0%) | 0 (0.0%) |
| 3 or 4 Children | 28 (100.0%) | 0 (0.0%) |
| 5 or more Children | 13 (100.0%) | 0 (0.0%) |
| Total | 482 (96.6%) | 17 (3.4%) |
Income Below Poverty Among Single-Parent Households in Falling Water
| Children | Single Father | Single Mother |
| No Children | 0 (0.0%) | 0 (0.0%) |
| 1 or 2 Children | 0 (0.0%) | 0 (0.0%) |
| 3 or 4 Children | 0 (0.0%) | 0 (0.0%) |
| 5 or more Children | 0 (0.0%) | 0 (0.0%) |
| Total | 0 (0.0%) | 0 (0.0%) |
Income Below Poverty Among Married-Couple vs Single-Parent Households in Falling Water
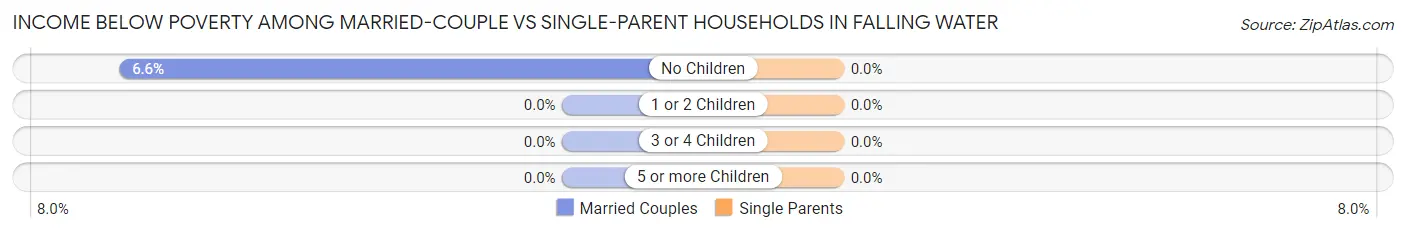
| Children | Married-Couple Families | Single-Parent Households |
| No Children | 17 (6.6%) | 0 (0.0%) |
| 1 or 2 Children | 0 (0.0%) | 0 (0.0%) |
| 3 or 4 Children | 0 (0.0%) | 0 (0.0%) |
| 5 or more Children | 0 (0.0%) | 0 (0.0%) |
| Total | 17 (3.4%) | 0 (0.0%) |
Race in Falling Water
The most populous races in Falling Water are White / Caucasian (1,872 | 92.6%), Two or more Races (72 | 3.6%), and Black / African American (60 | 3.0%).
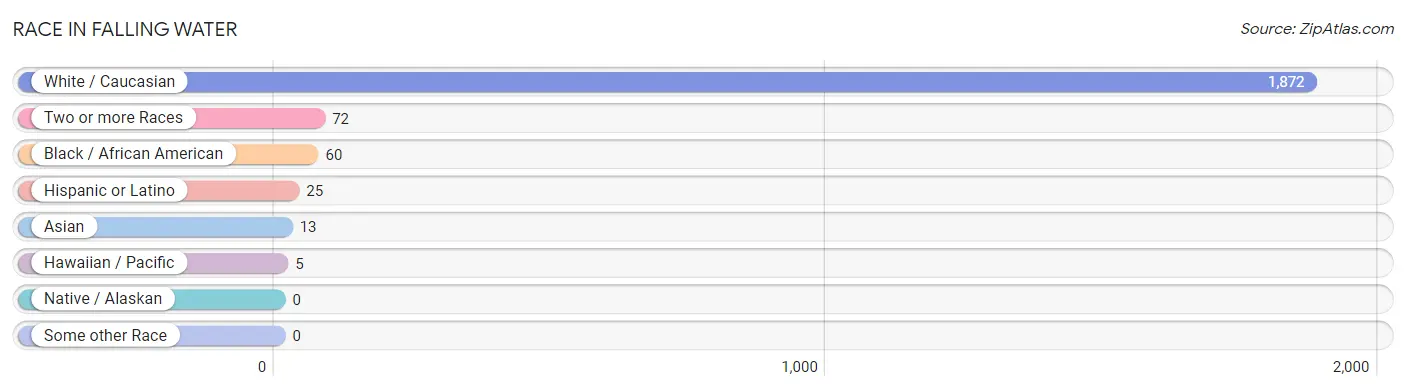
| Race | # Population | % Population |
| Asian | 13 | 0.6% |
| Black / African American | 60 | 3.0% |
| Hawaiian / Pacific | 5 | 0.3% |
| Hispanic or Latino | 25 | 1.2% |
| Native / Alaskan | 0 | 0.0% |
| White / Caucasian | 1,872 | 92.6% |
| Two or more Races | 72 | 3.6% |
| Some other Race | 0 | 0.0% |
| Total | 2,022 | 100.0% |
Ancestry in Falling Water
The most populous ancestries reported in Falling Water are Irish (378 | 18.7%), American (320 | 15.8%), German (305 | 15.1%), English (235 | 11.6%), and Scottish (93 | 4.6%), together accounting for 65.8% of all Falling Water residents.
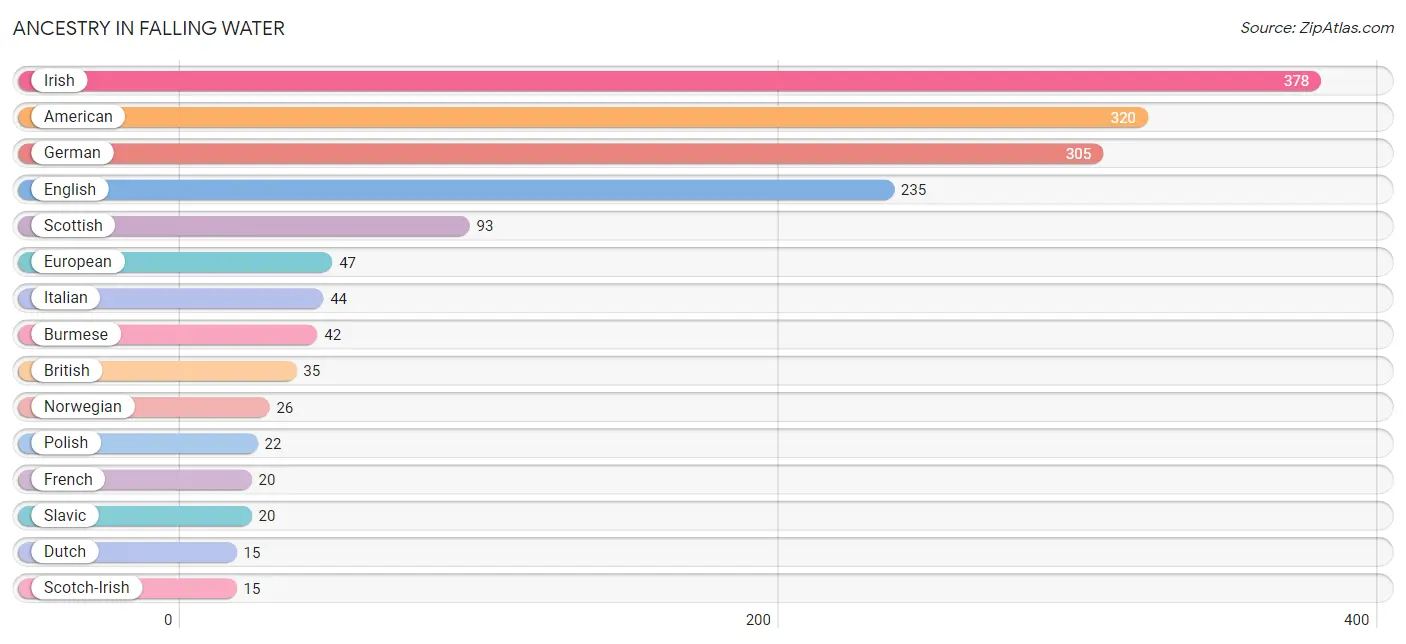
| Ancestry | # Population | % Population |
| American | 320 | 15.8% |
| British | 35 | 1.7% |
| Burmese | 42 | 2.1% |
| Central American | 13 | 0.6% |
| Dutch | 15 | 0.7% |
| English | 235 | 11.6% |
| European | 47 | 2.3% |
| French | 20 | 1.0% |
| German | 305 | 15.1% |
| Greek | 5 | 0.3% |
| Guamanian / Chamorro | 5 | 0.3% |
| Guatemalan | 13 | 0.6% |
| Irish | 378 | 18.7% |
| Italian | 44 | 2.2% |
| Korean | 13 | 0.6% |
| Mexican | 12 | 0.6% |
| Norwegian | 26 | 1.3% |
| Polish | 22 | 1.1% |
| Scotch-Irish | 15 | 0.7% |
| Scottish | 93 | 4.6% |
| Slavic | 20 | 1.0% |
| Slovak | 5 | 0.3% |
| Welsh | 3 | 0.2% | View All 23 Rows |
Immigrants in Falling Water
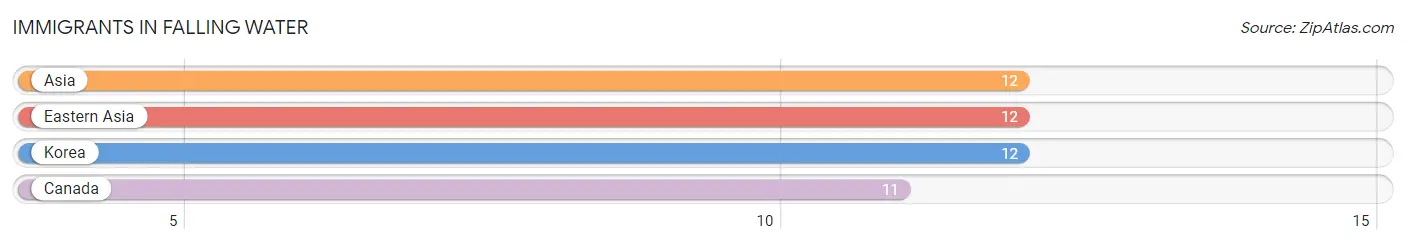
The most numerous immigrant groups reported in Falling Water came from Asia (12 | 0.6%), Eastern Asia (12 | 0.6%), Korea (12 | 0.6%), and Canada (11 | 0.5%), together accounting for 2.3% of all Falling Water residents.
| Immigration Origin | # Population | % Population |
| Asia | 12 | 0.6% |
| Canada | 11 | 0.5% |
| Eastern Asia | 12 | 0.6% |
| Korea | 12 | 0.6% | View All 4 Rows |
Sex and Age in Falling Water
Sex and Age in Falling Water
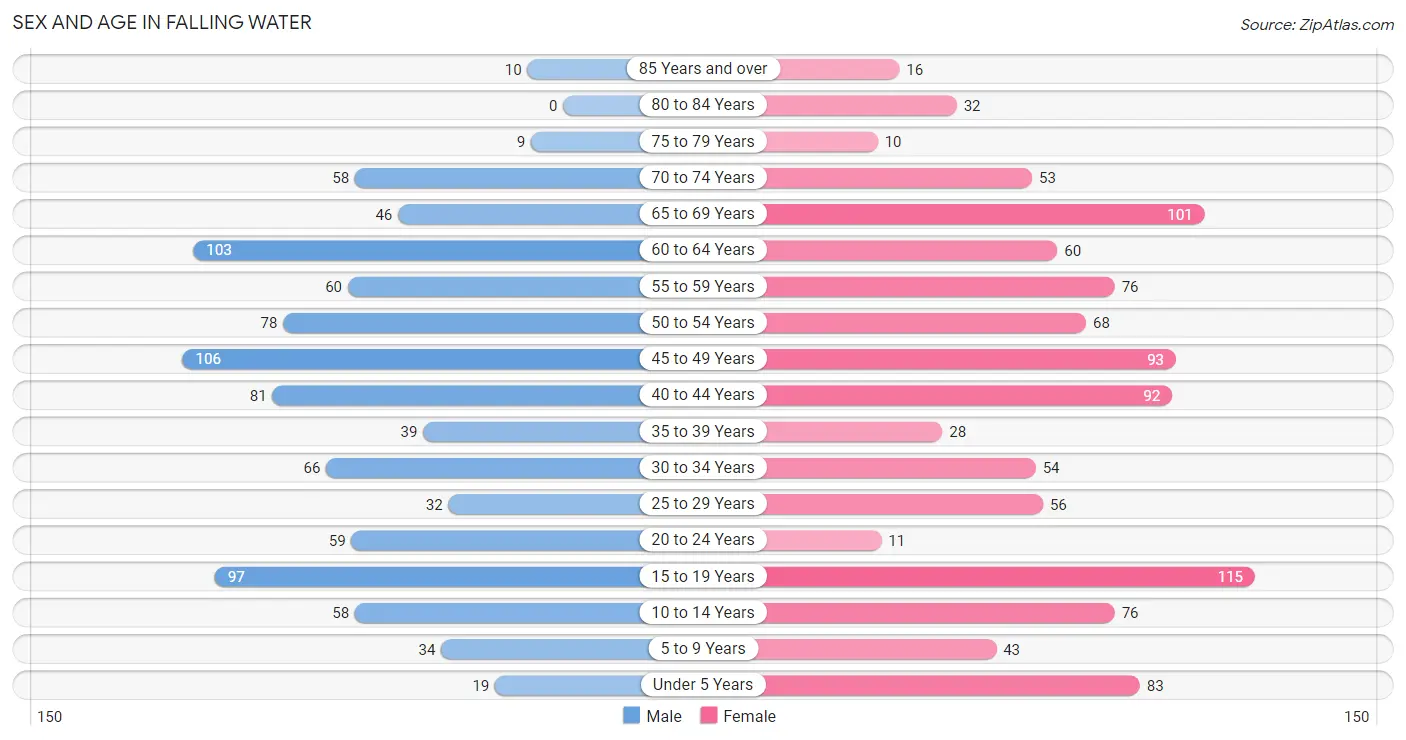
The most populous age groups in Falling Water are 45 to 49 Years (106 | 11.1%) for men and 15 to 19 Years (115 | 10.8%) for women.
| Age Bracket | Male | Female |
| Under 5 Years | 19 (2.0%) | 83 (7.8%) |
| 5 to 9 Years | 34 (3.6%) | 43 (4.0%) |
| 10 to 14 Years | 58 (6.1%) | 76 (7.1%) |
| 15 to 19 Years | 97 (10.2%) | 115 (10.8%) |
| 20 to 24 Years | 59 (6.2%) | 11 (1.0%) |
| 25 to 29 Years | 32 (3.4%) | 56 (5.2%) |
| 30 to 34 Years | 66 (6.9%) | 54 (5.1%) |
| 35 to 39 Years | 39 (4.1%) | 28 (2.6%) |
| 40 to 44 Years | 81 (8.5%) | 92 (8.6%) |
| 45 to 49 Years | 106 (11.1%) | 93 (8.7%) |
| 50 to 54 Years | 78 (8.2%) | 68 (6.4%) |
| 55 to 59 Years | 60 (6.3%) | 76 (7.1%) |
| 60 to 64 Years | 103 (10.8%) | 60 (5.6%) |
| 65 to 69 Years | 46 (4.8%) | 101 (9.5%) |
| 70 to 74 Years | 58 (6.1%) | 53 (5.0%) |
| 75 to 79 Years | 9 (0.9%) | 10 (0.9%) |
| 80 to 84 Years | 0 (0.0%) | 32 (3.0%) |
| 85 Years and over | 10 (1.1%) | 16 (1.5%) |
| Total | 955 (100.0%) | 1,067 (100.0%) |
Families and Households in Falling Water
Median Family Size in Falling Water
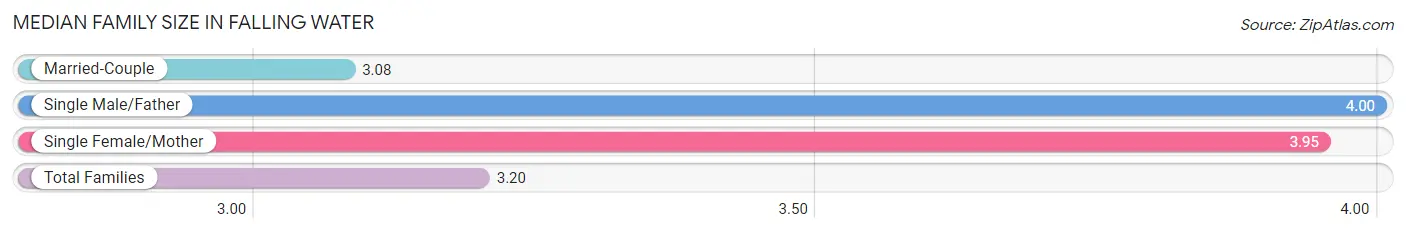
The median family size in Falling Water is 3.20 persons per family, with single male/father families (9 | 1.5%) accounting for the largest median family size of 4 persons per family. On the other hand, married-couple families (499 | 85.7%) represent the smallest median family size with 3.08 persons per family.
| Family Type | # Families | Family Size |
| Married-Couple | 499 (85.7%) | 3.08 |
| Single Male/Father | 9 (1.5%) | 4.00 |
| Single Female/Mother | 74 (12.7%) | 3.95 |
| Total Families | 582 (100.0%) | 3.20 |
Median Household Size in Falling Water
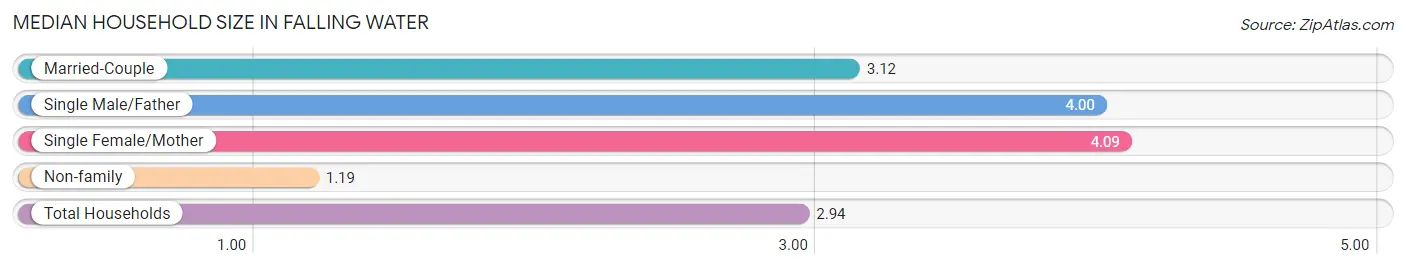
The median household size in Falling Water is 2.94 persons per household, with single female/mother households (74 | 10.8%) accounting for the largest median household size of 4.09 persons per household. non-family households (105 | 15.3%) represent the smallest median household size with 1.19 persons per household.
| Household Type | # Households | Household Size |
| Married-Couple | 499 (72.6%) | 3.12 |
| Single Male/Father | 9 (1.3%) | 4.00 |
| Single Female/Mother | 74 (10.8%) | 4.09 |
| Non-family | 105 (15.3%) | 1.19 |
| Total Households | 687 (100.0%) | 2.94 |
Household Size by Marriage Status in Falling Water
Out of a total of 687 households in Falling Water, 582 (84.7%) are family households, while 105 (15.3%) are nonfamily households. The most numerous type of family households are 2-person households, comprising 220, and the most common type of nonfamily households are 1-person households, comprising 85.
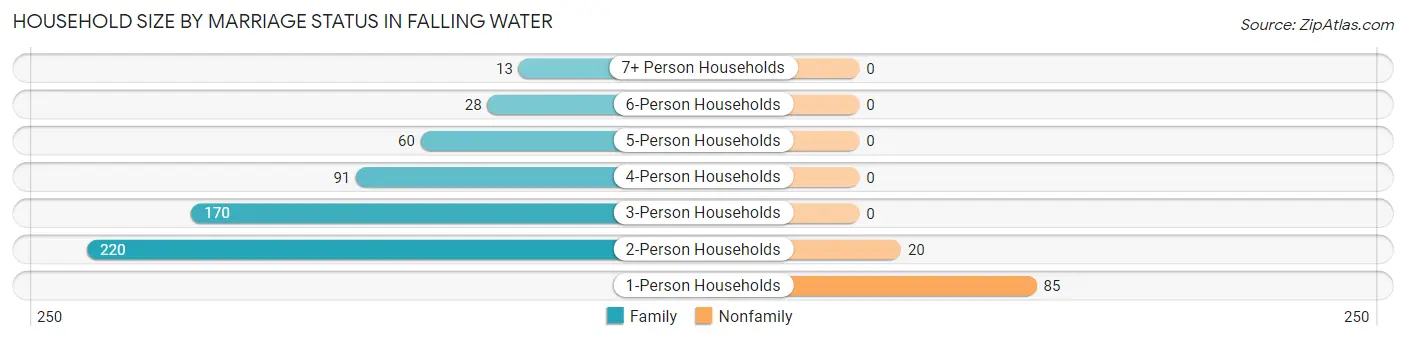
| Household Size | Family Households | Nonfamily Households |
| 1-Person Households | - | 85 (12.4%) |
| 2-Person Households | 220 (32.0%) | 20 (2.9%) |
| 3-Person Households | 170 (24.7%) | 0 (0.0%) |
| 4-Person Households | 91 (13.3%) | 0 (0.0%) |
| 5-Person Households | 60 (8.7%) | 0 (0.0%) |
| 6-Person Households | 28 (4.1%) | 0 (0.0%) |
| 7+ Person Households | 13 (1.9%) | 0 (0.0%) |
| Total | 582 (84.7%) | 105 (15.3%) |
Female Fertility in Falling Water
Fertility by Age in Falling Water
Average fertility rate in Falling Water is 96.0 births per 1,000 women. Women in the age bracket of 20 to 34 years have the highest fertility rate with 355.0 births per 1,000 women. Women in the age bracket of 20 to 34 years acount for 100.0% of all women with births.
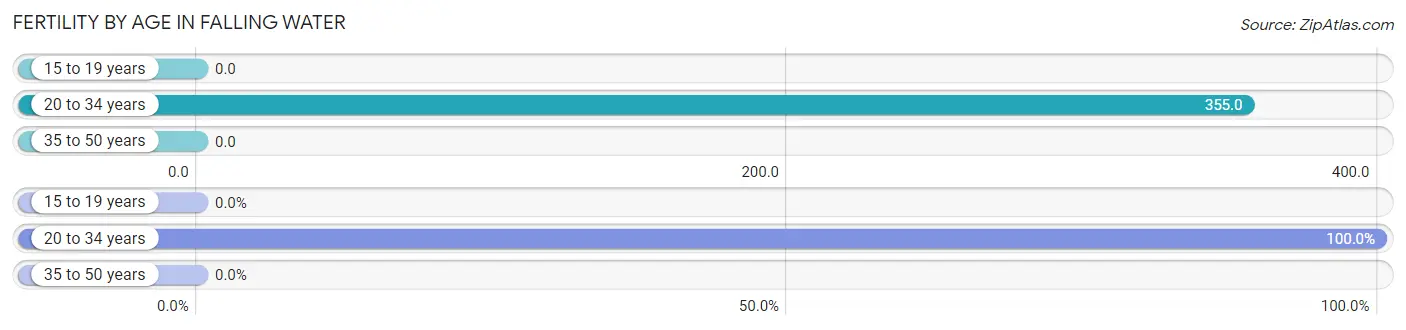
| Age Bracket | Women with Births | Births / 1,000 Women |
| 15 to 19 years | 0 (0.0%) | 0.0 |
| 20 to 34 years | 43 (100.0%) | 355.0 |
| 35 to 50 years | 0 (0.0%) | 0.0 |
| Total | 43 (100.0%) | 96.0 |
Fertility by Age by Marriage Status in Falling Water
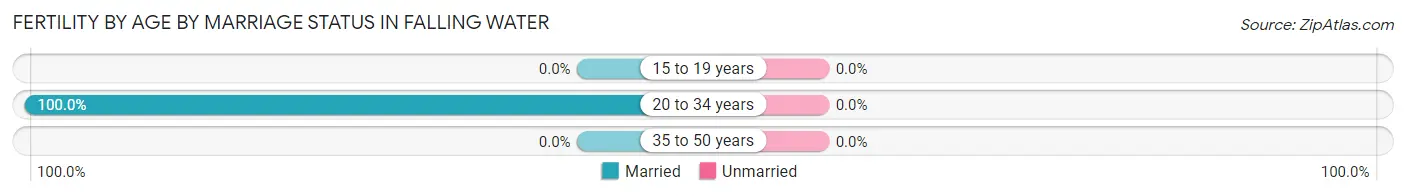
| Age Bracket | Married | Unmarried |
| 15 to 19 years | 0 (0.0%) | 0 (0.0%) |
| 20 to 34 years | 43 (100.0%) | 0 (0.0%) |
| 35 to 50 years | 0 (0.0%) | 0 (0.0%) |
| Total | 43 (100.0%) | 0 (0.0%) |
Fertility by Education in Falling Water
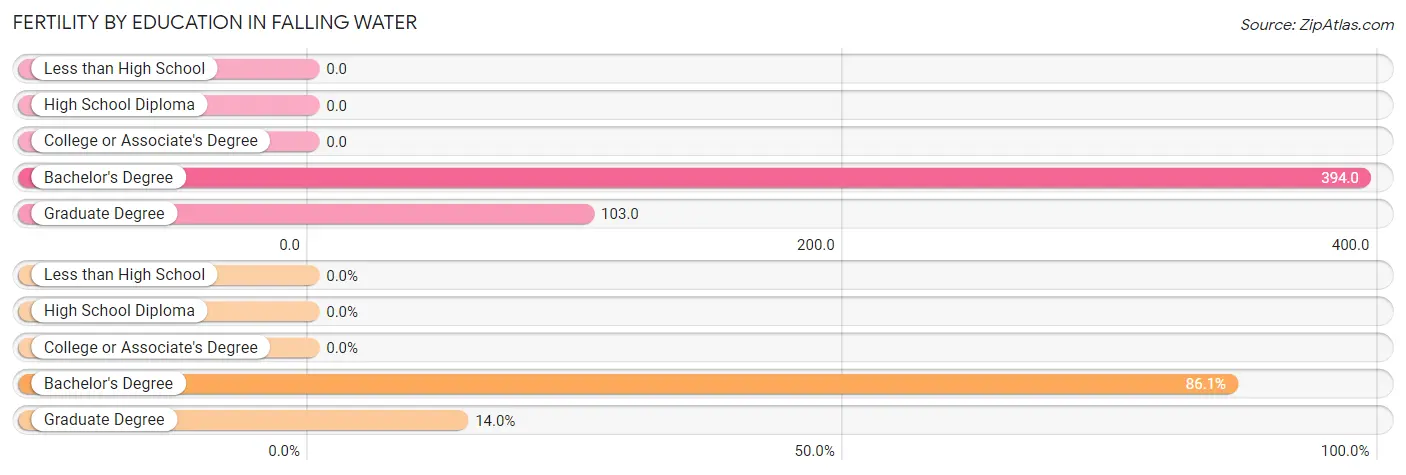
| Educational Attainment | Women with Births | Births / 1,000 Women |
| Less than High School | 0 (0.0%) | 0.0 |
| High School Diploma | 0 (0.0%) | 0.0 |
| College or Associate's Degree | 0 (0.0%) | 0.0 |
| Bachelor's Degree | 37 (86.1%) | 394.0 |
| Graduate Degree | 6 (14.0%) | 103.0 |
| Total | 43 (100.0%) | 96.0 |
Fertility by Education by Marriage Status in Falling Water
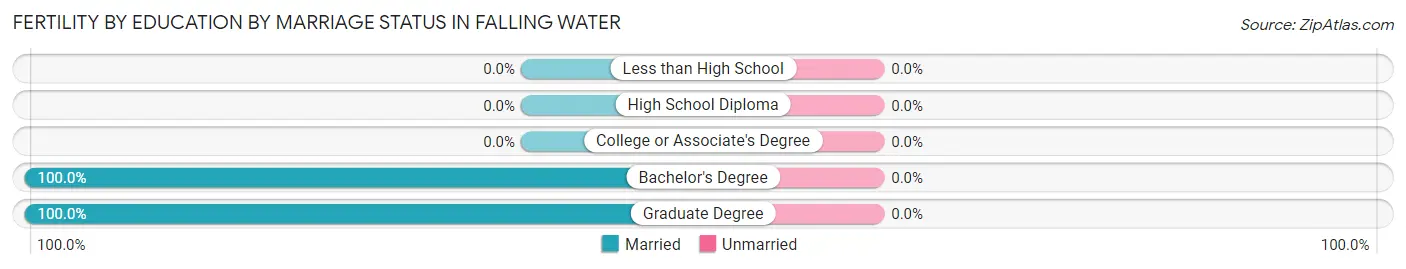
| Educational Attainment | Married | Unmarried |
| Less than High School | 0 (0.0%) | 0 (0.0%) |
| High School Diploma | 0 (0.0%) | 0 (0.0%) |
| College or Associate's Degree | 0 (0.0%) | 0 (0.0%) |
| Bachelor's Degree | 37 (100.0%) | 0 (0.0%) |
| Graduate Degree | 6 (100.0%) | 0 (0.0%) |
| Total | 43 (100.0%) | 0 (0.0%) |
Employment Characteristics in Falling Water
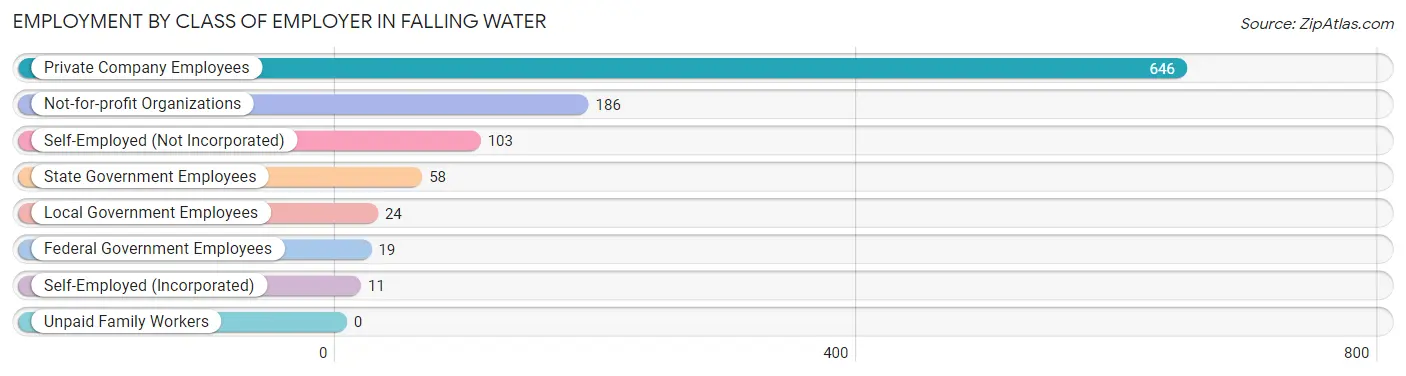
Employment by Class of Employer in Falling Water
Among the 1,047 employed individuals in Falling Water, private company employees (646 | 61.7%), not-for-profit organizations (186 | 17.8%), and self-employed (not incorporated) (103 | 9.8%) make up the most common classes of employment.
| Employer Class | # Employees | % Employees |
| Private Company Employees | 646 | 61.7% |
| Self-Employed (Incorporated) | 11 | 1.1% |
| Self-Employed (Not Incorporated) | 103 | 9.8% |
| Not-for-profit Organizations | 186 | 17.8% |
| Local Government Employees | 24 | 2.3% |
| State Government Employees | 58 | 5.5% |
| Federal Government Employees | 19 | 1.8% |
| Unpaid Family Workers | 0 | 0.0% |
| Total | 1,047 | 100.0% |
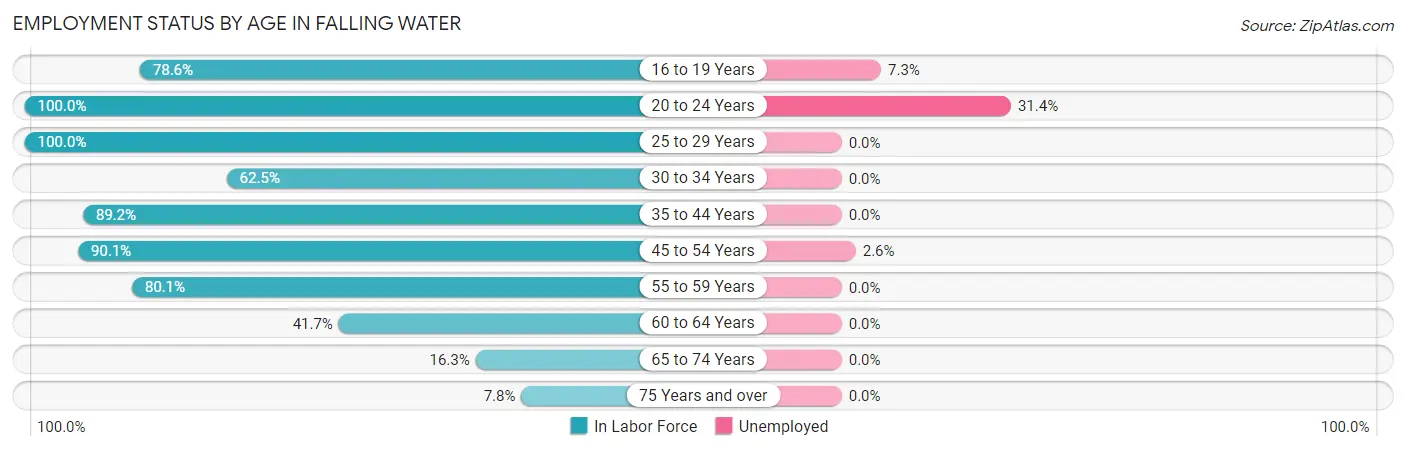
Employment Status by Age in Falling Water
According to the labor force statistics for Falling Water, out of the total population over 16 years of age (1,637), 66.8% or 1,094 individuals are in the labor force, with 3.5% or 38 of them unemployed. The age group with the highest labor force participation rate is 20 to 24 years, with 100.0% or 70 individuals in the labor force. Within the labor force, the 20 to 24 years age range has the highest percentage of unemployed individuals, with 31.4% or 22 of them being unemployed.
| Age Bracket | In Labor Force | Unemployed |
| 16 to 19 Years | 110 (78.6%) | 8 (7.3%) |
| 20 to 24 Years | 70 (100.0%) | 22 (31.4%) |
| 25 to 29 Years | 88 (100.0%) | 0 (0.0%) |
| 30 to 34 Years | 75 (62.5%) | 0 (0.0%) |
| 35 to 44 Years | 214 (89.2%) | 0 (0.0%) |
| 45 to 54 Years | 311 (90.1%) | 8 (2.6%) |
| 55 to 59 Years | 109 (80.1%) | 0 (0.0%) |
| 60 to 64 Years | 68 (41.7%) | 0 (0.0%) |
| 65 to 74 Years | 42 (16.3%) | 0 (0.0%) |
| 75 Years and over | 6 (7.8%) | 0 (0.0%) |
| Total | 1,094 (66.8%) | 38 (3.5%) |
Employment Status by Educational Attainment in Falling Water
According to labor force statistics for Falling Water, 79.2% of individuals (865) out of the total population between 25 and 64 years of age (1,092) are in the labor force, with 0.9% or 8 of them being unemployed. The group with the highest labor force participation rate are those with the educational attainment of bachelor's degree or higher, with 87.8% or 387 individuals in the labor force. Within the labor force, individuals with bachelor's degree or higher education have the highest percentage of unemployment, with 2.1% or 8 of them being unemployed.
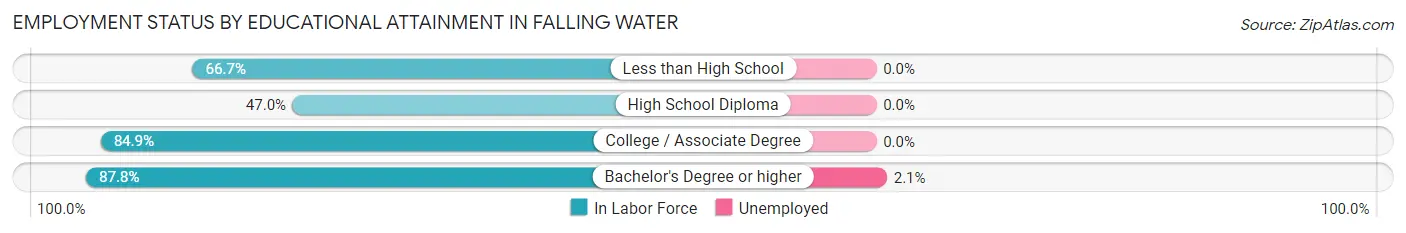
| Educational Attainment | In Labor Force | Unemployed |
| Less than High School | 46 (66.7%) | 0 (0.0%) |
| High School Diploma | 77 (47.0%) | 0 (0.0%) |
| College / Associate Degree | 355 (84.9%) | 0 (0.0%) |
| Bachelor's Degree or higher | 387 (87.8%) | 9 (2.1%) |
| Total | 865 (79.2%) | 10 (0.9%) |
Employment Occupations by Sex in Falling Water
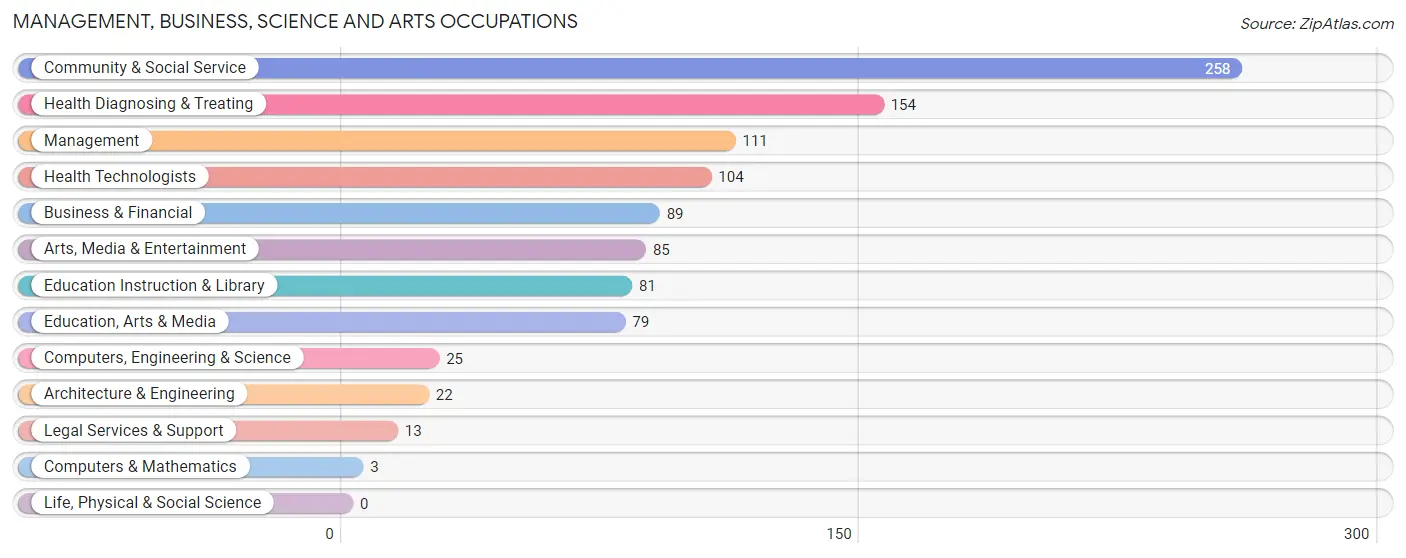
Management, Business, Science and Arts Occupations
The most common Management, Business, Science and Arts occupations in Falling Water are Community & Social Service (258 | 24.4%), Health Diagnosing & Treating (154 | 14.6%), Management (111 | 10.5%), Health Technologists (104 | 9.9%), and Business & Financial (89 | 8.4%).
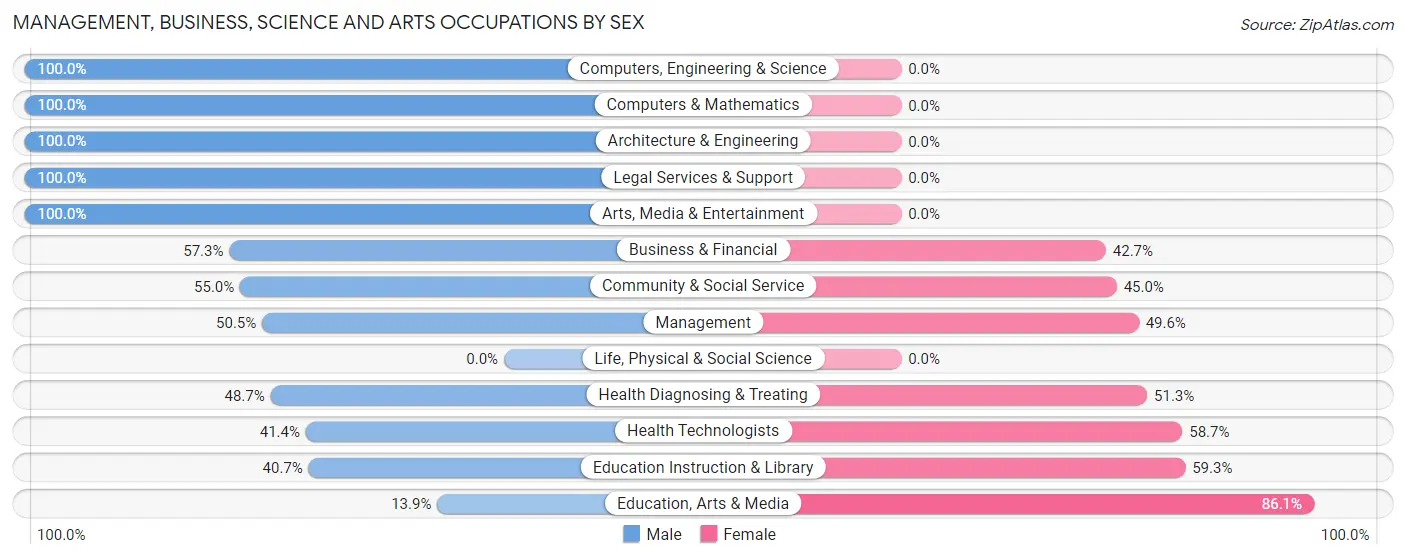
Management, Business, Science and Arts Occupations by Sex
Within the Management, Business, Science and Arts occupations in Falling Water, the most male-oriented occupations are Computers, Engineering & Science (100.0%), Computers & Mathematics (100.0%), and Architecture & Engineering (100.0%), while the most female-oriented occupations are Education, Arts & Media (86.1%), Education Instruction & Library (59.3%), and Health Technologists (58.7%).
| Occupation | Male | Female |
| Management | 56 (50.4%) | 55 (49.5%) |
| Business & Financial | 51 (57.3%) | 38 (42.7%) |
| Computers, Engineering & Science | 25 (100.0%) | 0 (0.0%) |
| Computers & Mathematics | 3 (100.0%) | 0 (0.0%) |
| Architecture & Engineering | 22 (100.0%) | 0 (0.0%) |
| Life, Physical & Social Science | 0 (0.0%) | 0 (0.0%) |
| Community & Social Service | 142 (55.0%) | 116 (45.0%) |
| Education, Arts & Media | 11 (13.9%) | 68 (86.1%) |
| Legal Services & Support | 13 (100.0%) | 0 (0.0%) |
| Education Instruction & Library | 33 (40.7%) | 48 (59.3%) |
| Arts, Media & Entertainment | 85 (100.0%) | 0 (0.0%) |
| Health Diagnosing & Treating | 75 (48.7%) | 79 (51.3%) |
| Health Technologists | 43 (41.3%) | 61 (58.7%) |
| Total (Category) | 349 (54.8%) | 288 (45.2%) |
| Total (Overall) | 546 (51.7%) | 509 (48.2%) |
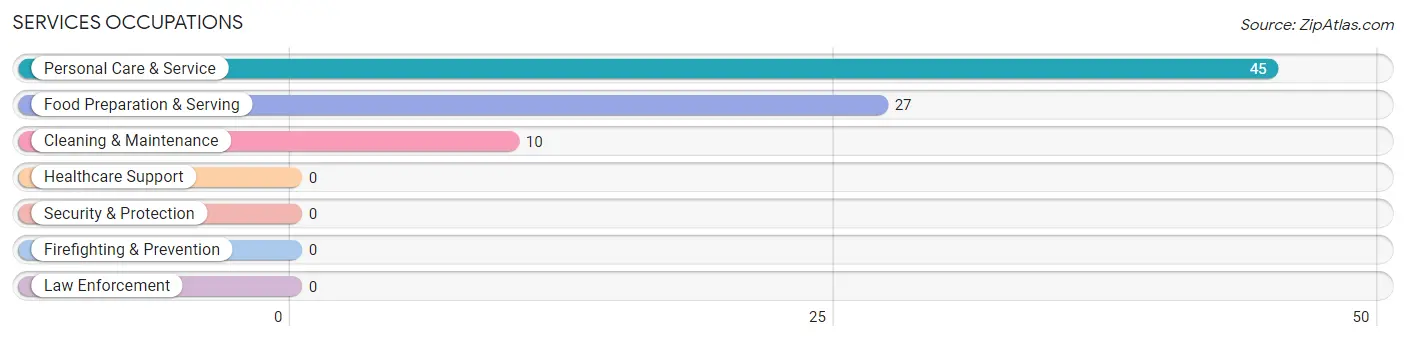
Services Occupations
The most common Services occupations in Falling Water are Personal Care & Service (45 | 4.3%), Food Preparation & Serving (27 | 2.6%), and Cleaning & Maintenance (10 | 0.9%).
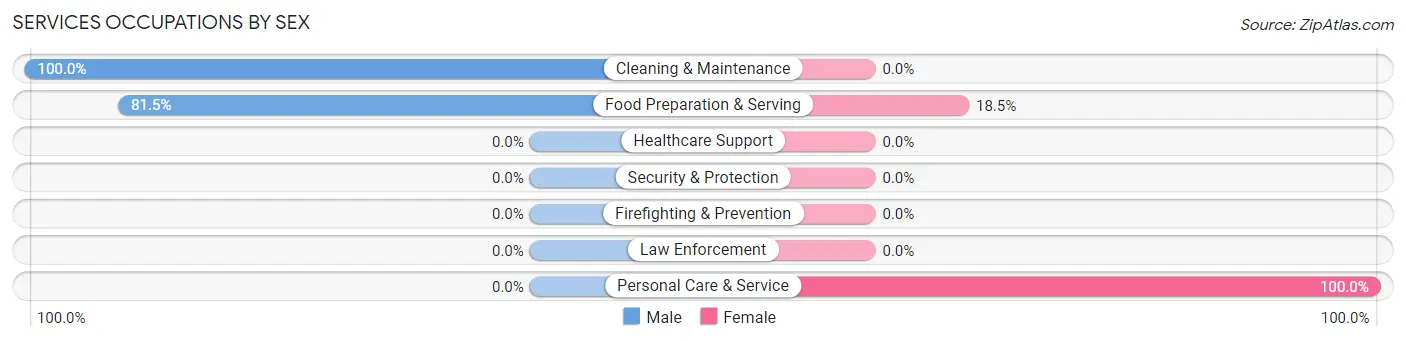
Services Occupations by Sex
Within the Services occupations in Falling Water, the most male-oriented occupations are Cleaning & Maintenance (100.0%), and Food Preparation & Serving (81.5%), while the most female-oriented occupations are Personal Care & Service (100.0%), and Food Preparation & Serving (18.5%).
| Occupation | Male | Female |
| Healthcare Support | 0 (0.0%) | 0 (0.0%) |
| Security & Protection | 0 (0.0%) | 0 (0.0%) |
| Firefighting & Prevention | 0 (0.0%) | 0 (0.0%) |
| Law Enforcement | 0 (0.0%) | 0 (0.0%) |
| Food Preparation & Serving | 22 (81.5%) | 5 (18.5%) |
| Cleaning & Maintenance | 10 (100.0%) | 0 (0.0%) |
| Personal Care & Service | 0 (0.0%) | 45 (100.0%) |
| Total (Category) | 32 (39.0%) | 50 (61.0%) |
| Total (Overall) | 546 (51.7%) | 509 (48.2%) |
Sales and Office Occupations
The most common Sales and Office occupations in Falling Water are Office & Administration (111 | 10.5%), and Sales & Related (95 | 9.0%).
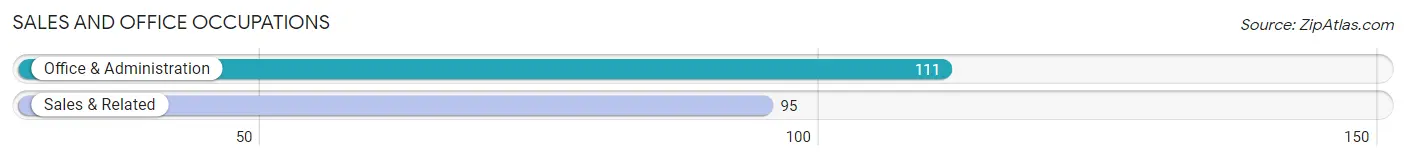
Sales and Office Occupations by Sex
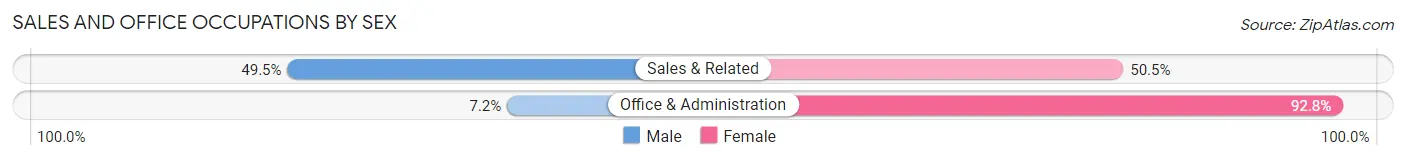
| Occupation | Male | Female |
| Sales & Related | 47 (49.5%) | 48 (50.5%) |
| Office & Administration | 8 (7.2%) | 103 (92.8%) |
| Total (Category) | 55 (26.7%) | 151 (73.3%) |
| Total (Overall) | 546 (51.7%) | 509 (48.2%) |
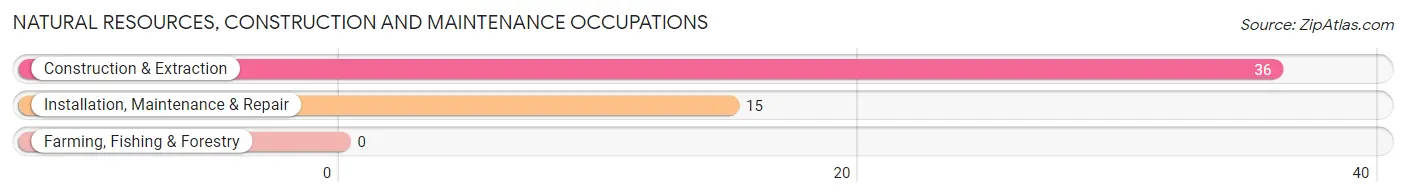
Natural Resources, Construction and Maintenance Occupations
The most common Natural Resources, Construction and Maintenance occupations in Falling Water are Construction & Extraction (36 | 3.4%), and Installation, Maintenance & Repair (15 | 1.4%).
Natural Resources, Construction and Maintenance Occupations by Sex
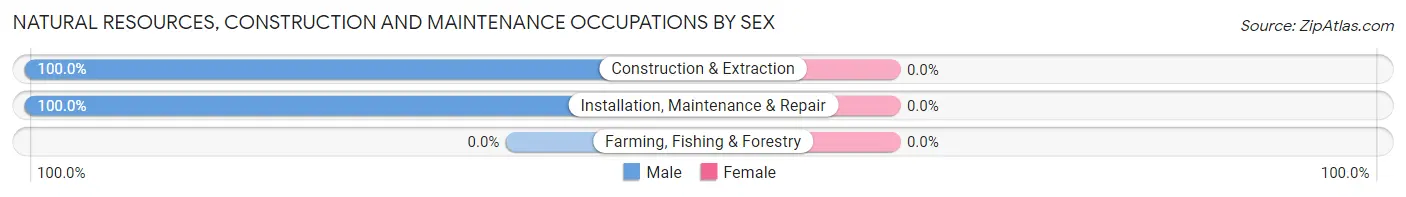
| Occupation | Male | Female |
| Farming, Fishing & Forestry | 0 (0.0%) | 0 (0.0%) |
| Construction & Extraction | 36 (100.0%) | 0 (0.0%) |
| Installation, Maintenance & Repair | 15 (100.0%) | 0 (0.0%) |
| Total (Category) | 51 (100.0%) | 0 (0.0%) |
| Total (Overall) | 546 (51.7%) | 509 (48.2%) |
Production, Transportation and Moving Occupations
The most common Production, Transportation and Moving occupations in Falling Water are Material Moving (47 | 4.4%), Production (20 | 1.9%), and Transportation (12 | 1.1%).
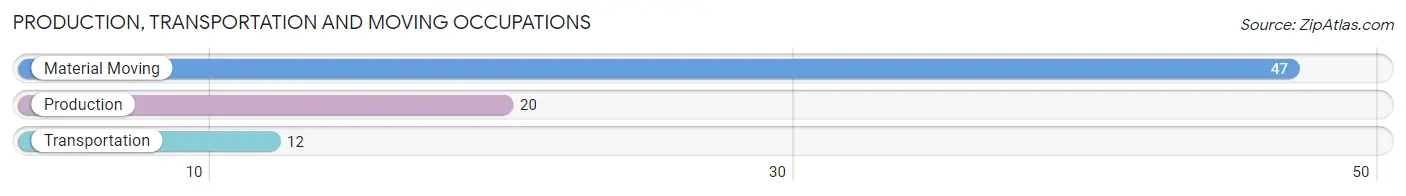
Production, Transportation and Moving Occupations by Sex
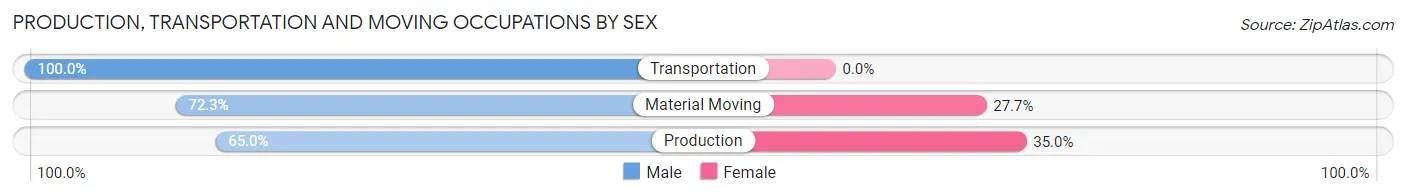
| Occupation | Male | Female |
| Production | 13 (65.0%) | 7 (35.0%) |
| Transportation | 12 (100.0%) | 0 (0.0%) |
| Material Moving | 34 (72.3%) | 13 (27.7%) |
| Total (Category) | 59 (74.7%) | 20 (25.3%) |
| Total (Overall) | 546 (51.7%) | 509 (48.2%) |
Employment Industries by Sex in Falling Water
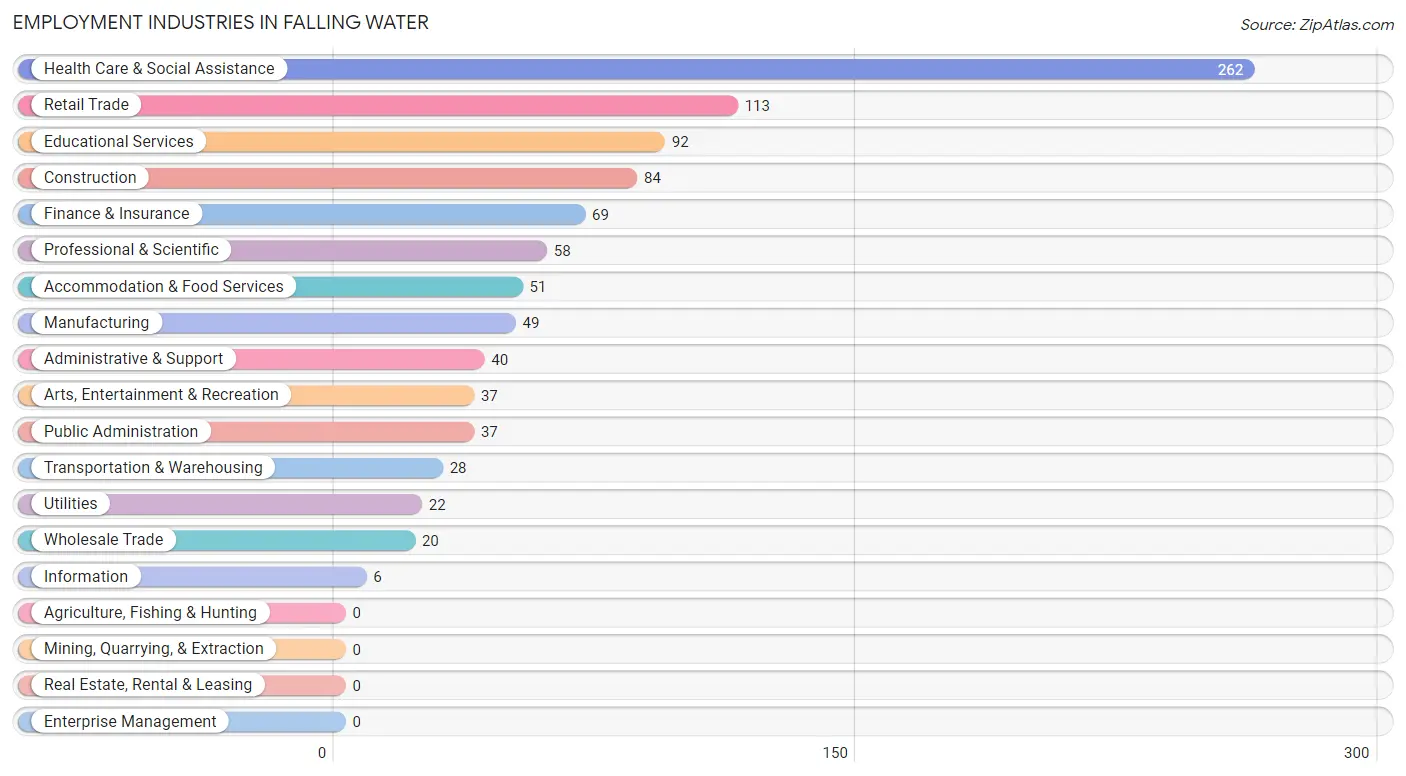
Employment Industries in Falling Water
The major employment industries in Falling Water include Health Care & Social Assistance (262 | 24.8%), Retail Trade (113 | 10.7%), Educational Services (92 | 8.7%), Construction (84 | 8.0%), and Finance & Insurance (69 | 6.5%).
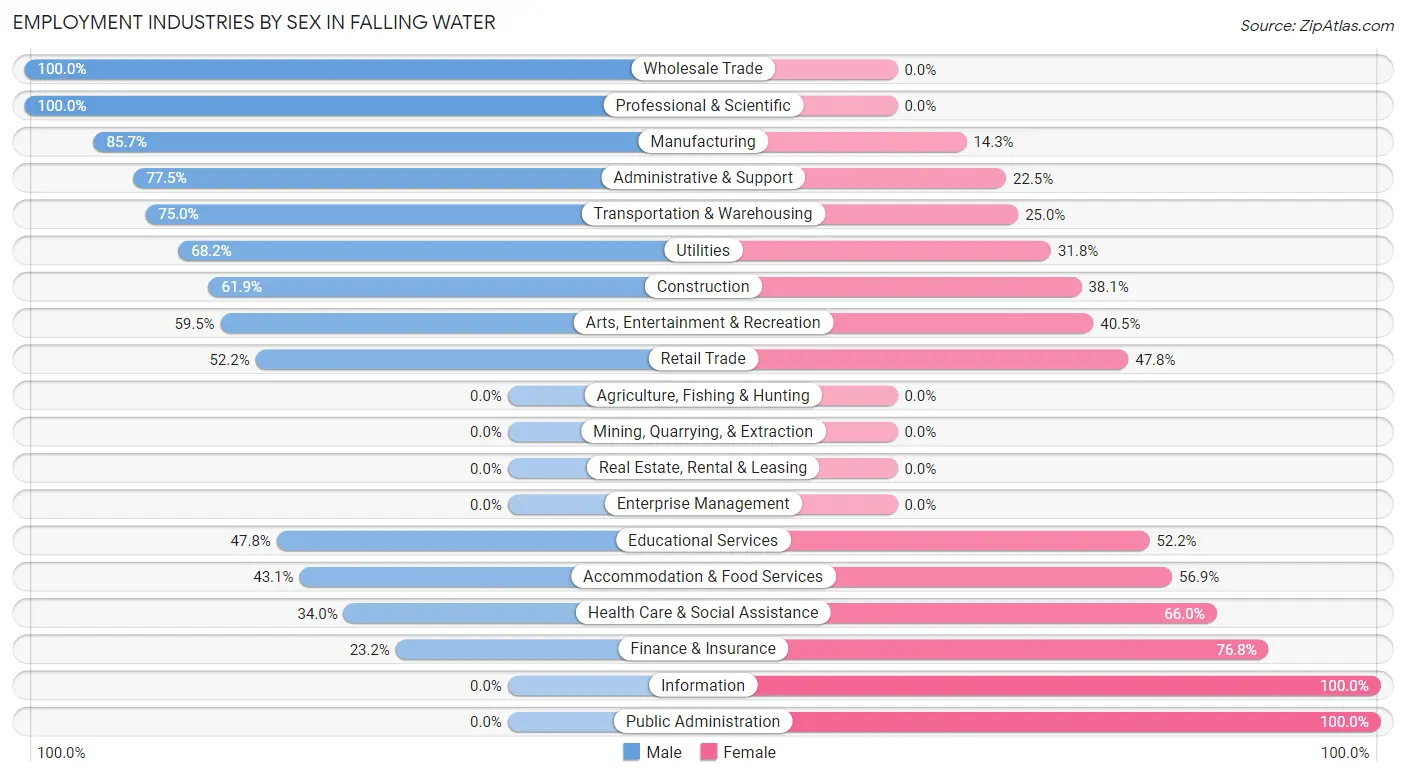
Employment Industries by Sex in Falling Water
The Falling Water industries that see more men than women are Wholesale Trade (100.0%), Professional & Scientific (100.0%), and Manufacturing (85.7%), whereas the industries that tend to have a higher number of women are Information (100.0%), Public Administration (100.0%), and Finance & Insurance (76.8%).
| Industry | Male | Female |
| Agriculture, Fishing & Hunting | 0 (0.0%) | 0 (0.0%) |
| Mining, Quarrying, & Extraction | 0 (0.0%) | 0 (0.0%) |
| Construction | 52 (61.9%) | 32 (38.1%) |
| Manufacturing | 42 (85.7%) | 7 (14.3%) |
| Wholesale Trade | 20 (100.0%) | 0 (0.0%) |
| Retail Trade | 59 (52.2%) | 54 (47.8%) |
| Transportation & Warehousing | 21 (75.0%) | 7 (25.0%) |
| Utilities | 15 (68.2%) | 7 (31.8%) |
| Information | 0 (0.0%) | 6 (100.0%) |
| Finance & Insurance | 16 (23.2%) | 53 (76.8%) |
| Real Estate, Rental & Leasing | 0 (0.0%) | 0 (0.0%) |
| Professional & Scientific | 58 (100.0%) | 0 (0.0%) |
| Enterprise Management | 0 (0.0%) | 0 (0.0%) |
| Administrative & Support | 31 (77.5%) | 9 (22.5%) |
| Educational Services | 44 (47.8%) | 48 (52.2%) |
| Health Care & Social Assistance | 89 (34.0%) | 173 (66.0%) |
| Arts, Entertainment & Recreation | 22 (59.5%) | 15 (40.5%) |
| Accommodation & Food Services | 22 (43.1%) | 29 (56.9%) |
| Public Administration | 0 (0.0%) | 37 (100.0%) |
| Total | 546 (51.7%) | 509 (48.2%) |
Education in Falling Water
School Enrollment in Falling Water
The most common levels of schooling among the 524 students in Falling Water are high school (161 | 30.7%), middle school (114 | 21.8%), and college / undergraduate (114 | 21.8%).
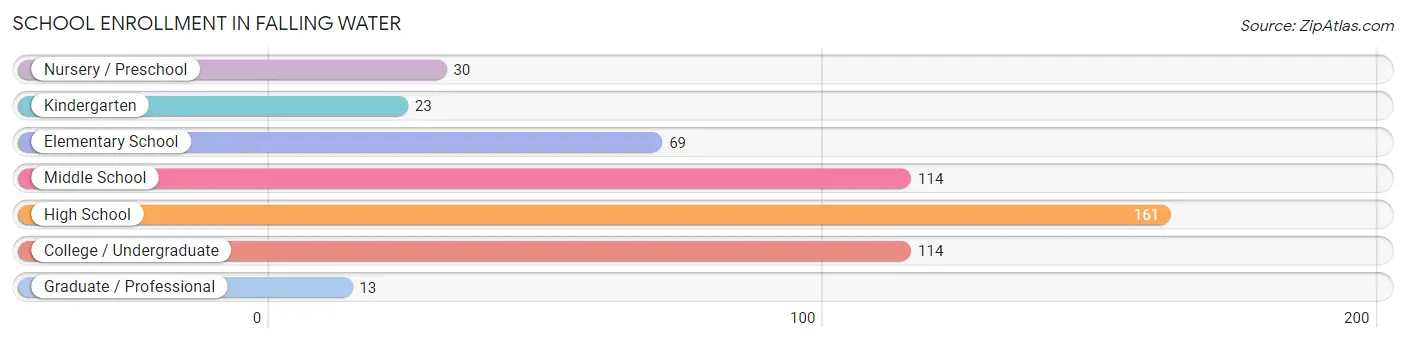
| School Level | # Students | % Students |
| Nursery / Preschool | 30 | 5.7% |
| Kindergarten | 23 | 4.4% |
| Elementary School | 69 | 13.2% |
| Middle School | 114 | 21.8% |
| High School | 161 | 30.7% |
| College / Undergraduate | 114 | 21.8% |
| Graduate / Professional | 13 | 2.5% |
| Total | 524 | 100.0% |
School Enrollment by Age by Funding Source in Falling Water
Out of a total of 524 students who are enrolled in schools in Falling Water, 329 (62.8%) attend a private institution, while the remaining 195 (37.2%) are enrolled in public schools. The age group of 35 years and over has the highest likelihood of being enrolled in private schools, with 43 (100.0% in the age bracket) enrolled. Conversely, the age group of 25 to 34 year olds has the lowest likelihood of being enrolled in a private school, with 32 (100.0% in the age bracket) attending a public institution.
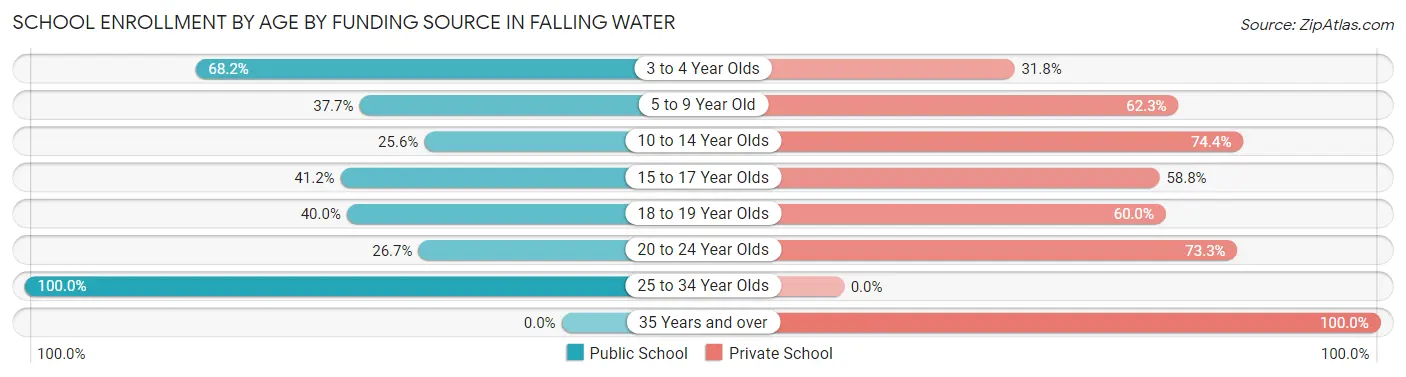
| Age Bracket | Public School | Private School |
| 3 to 4 Year Olds | 15 (68.2%) | 7 (31.8%) |
| 5 to 9 Year Old | 29 (37.7%) | 48 (62.3%) |
| 10 to 14 Year Olds | 33 (25.6%) | 96 (74.4%) |
| 15 to 17 Year Olds | 56 (41.2%) | 80 (58.8%) |
| 18 to 19 Year Olds | 22 (40.0%) | 33 (60.0%) |
| 20 to 24 Year Olds | 8 (26.7%) | 22 (73.3%) |
| 25 to 34 Year Olds | 32 (100.0%) | 0 (0.0%) |
| 35 Years and over | 0 (0.0%) | 43 (100.0%) |
| Total | 195 (37.2%) | 329 (62.8%) |
Educational Attainment by Field of Study in Falling Water
Business (139 | 23.2%), science & technology (99 | 16.6%), education (97 | 16.2%), social sciences (69 | 11.5%), and literature & languages (41 | 6.9%) are the most common fields of study among 598 individuals in Falling Water who have obtained a bachelor's degree or higher.
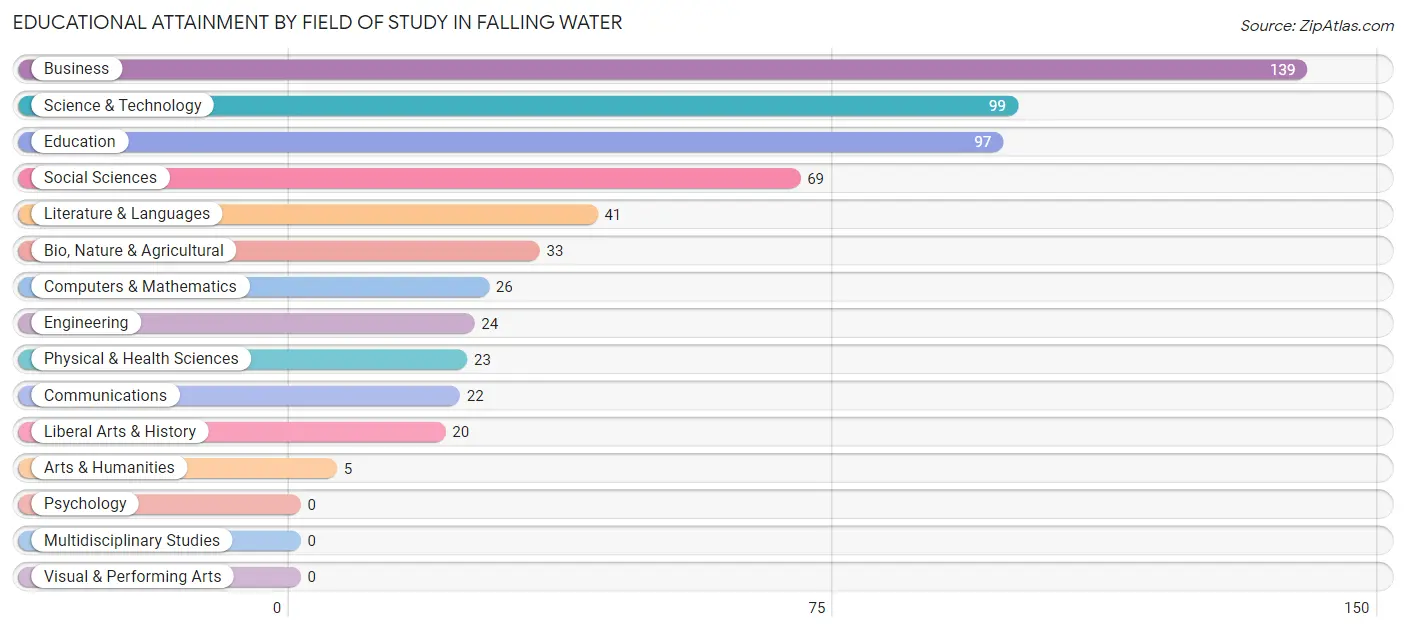
| Field of Study | # Graduates | % Graduates |
| Computers & Mathematics | 26 | 4.3% |
| Bio, Nature & Agricultural | 33 | 5.5% |
| Physical & Health Sciences | 23 | 3.8% |
| Psychology | 0 | 0.0% |
| Social Sciences | 69 | 11.5% |
| Engineering | 24 | 4.0% |
| Multidisciplinary Studies | 0 | 0.0% |
| Science & Technology | 99 | 16.6% |
| Business | 139 | 23.2% |
| Education | 97 | 16.2% |
| Literature & Languages | 41 | 6.9% |
| Liberal Arts & History | 20 | 3.3% |
| Visual & Performing Arts | 0 | 0.0% |
| Communications | 22 | 3.7% |
| Arts & Humanities | 5 | 0.8% |
| Total | 598 | 100.0% |
Transportation & Commute in Falling Water
Vehicle Availability by Sex in Falling Water
The most prevalent vehicle ownership categories in Falling Water are males with 5 or more vehicles (174, accounting for 31.9%) and females with 5 or more vehicles (111, making up 34.7%).
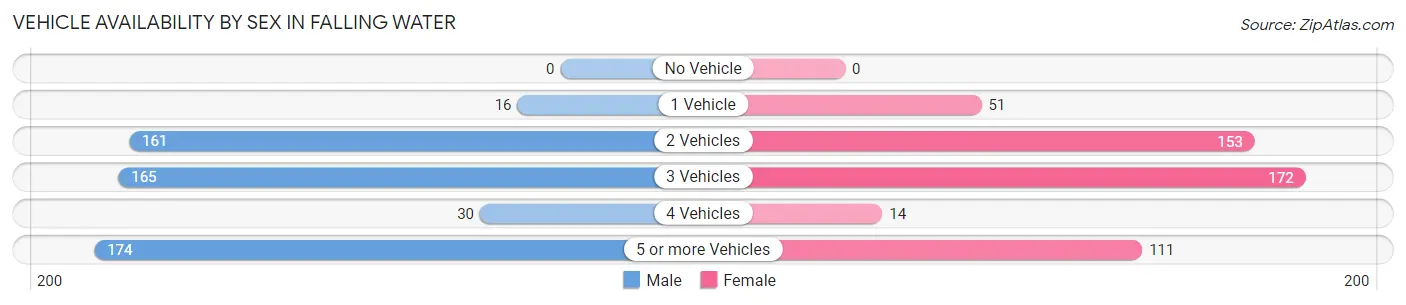
| Vehicles Available | Male | Female |
| No Vehicle | 0 (0.0%) | 0 (0.0%) |
| 1 Vehicle | 16 (2.9%) | 51 (10.2%) |
| 2 Vehicles | 161 (29.5%) | 153 (30.5%) |
| 3 Vehicles | 165 (30.2%) | 172 (34.3%) |
| 4 Vehicles | 30 (5.5%) | 14 (2.8%) |
| 5 or more Vehicles | 174 (31.9%) | 111 (22.2%) |
| Total | 546 (100.0%) | 501 (100.0%) |
Commute Time in Falling Water
The most frequently occuring commute durations in Falling Water are 20 to 24 minutes (185 commuters, 21.0%), 30 to 34 minutes (177 commuters, 20.1%), and 10 to 14 minutes (106 commuters, 12.1%).
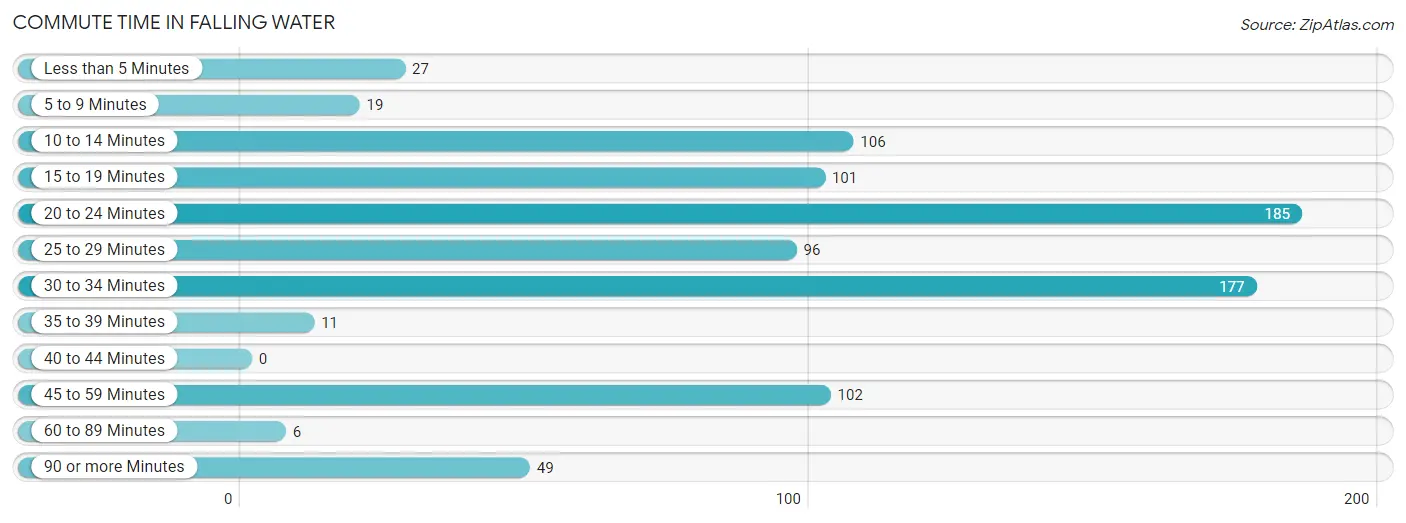
| Commute Time | # Commuters | % Commuters |
| Less than 5 Minutes | 27 | 3.1% |
| 5 to 9 Minutes | 19 | 2.2% |
| 10 to 14 Minutes | 106 | 12.1% |
| 15 to 19 Minutes | 101 | 11.5% |
| 20 to 24 Minutes | 185 | 21.0% |
| 25 to 29 Minutes | 96 | 10.9% |
| 30 to 34 Minutes | 177 | 20.1% |
| 35 to 39 Minutes | 11 | 1.3% |
| 40 to 44 Minutes | 0 | 0.0% |
| 45 to 59 Minutes | 102 | 11.6% |
| 60 to 89 Minutes | 6 | 0.7% |
| 90 or more Minutes | 49 | 5.6% |
Commute Time by Sex in Falling Water
The most common commute times in Falling Water are 20 to 24 minutes (106 commuters, 21.0%) for males and 30 to 34 minutes (82 commuters, 21.9%) for females.
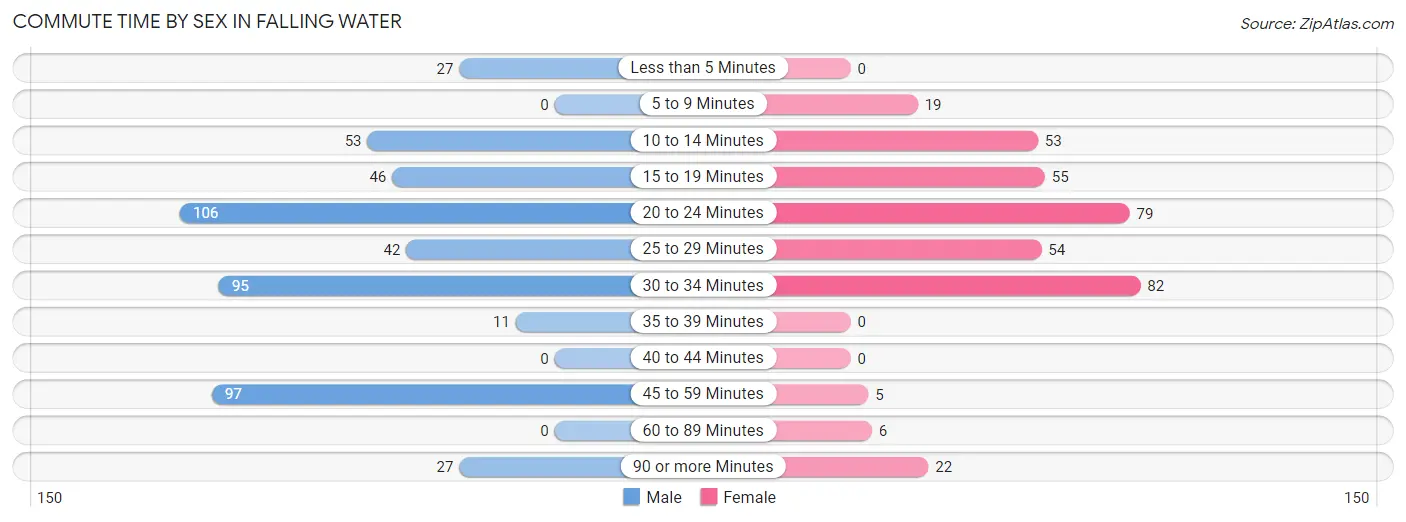
| Commute Time | Male | Female |
| Less than 5 Minutes | 27 (5.4%) | 0 (0.0%) |
| 5 to 9 Minutes | 0 (0.0%) | 19 (5.1%) |
| 10 to 14 Minutes | 53 (10.5%) | 53 (14.1%) |
| 15 to 19 Minutes | 46 (9.1%) | 55 (14.7%) |
| 20 to 24 Minutes | 106 (21.0%) | 79 (21.1%) |
| 25 to 29 Minutes | 42 (8.3%) | 54 (14.4%) |
| 30 to 34 Minutes | 95 (18.9%) | 82 (21.9%) |
| 35 to 39 Minutes | 11 (2.2%) | 0 (0.0%) |
| 40 to 44 Minutes | 0 (0.0%) | 0 (0.0%) |
| 45 to 59 Minutes | 97 (19.3%) | 5 (1.3%) |
| 60 to 89 Minutes | 0 (0.0%) | 6 (1.6%) |
| 90 or more Minutes | 27 (5.4%) | 22 (5.9%) |
Time of Departure to Work by Sex in Falling Water
The most frequent times of departure to work in Falling Water are 7:30 AM to 7:59 AM (106, 21.0%) for males and 8:00 AM to 8:29 AM (104, 27.7%) for females.
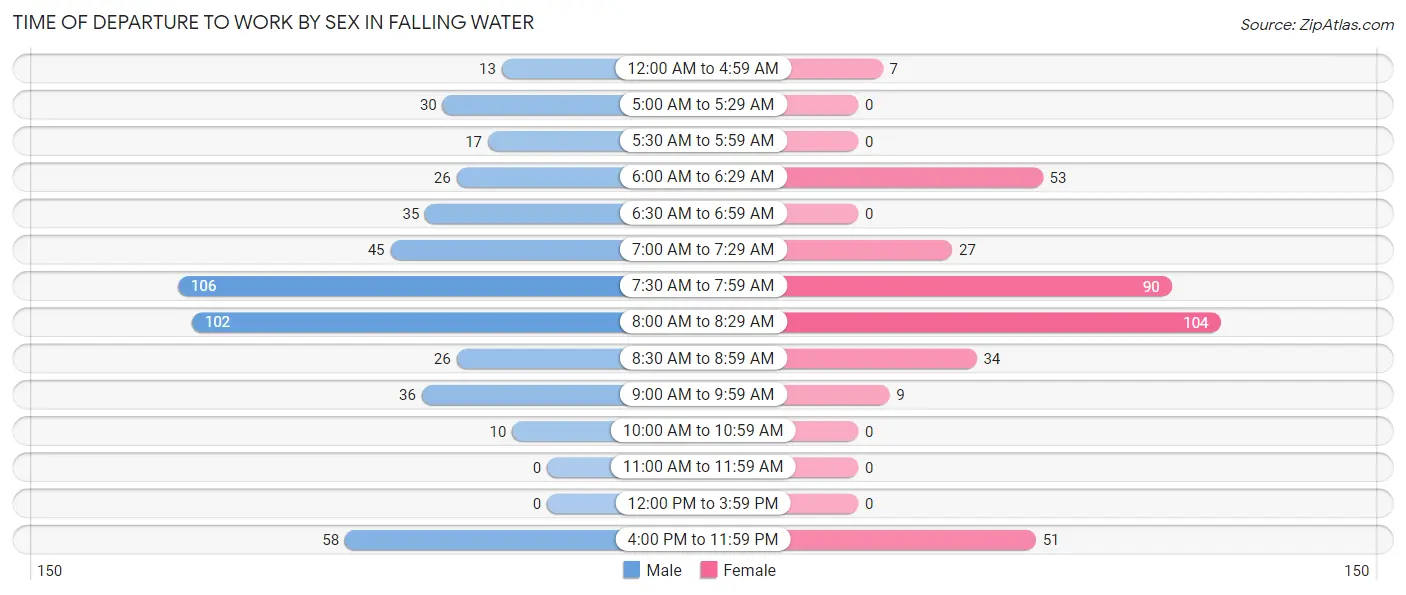
| Time of Departure | Male | Female |
| 12:00 AM to 4:59 AM | 13 (2.6%) | 7 (1.9%) |
| 5:00 AM to 5:29 AM | 30 (5.9%) | 0 (0.0%) |
| 5:30 AM to 5:59 AM | 17 (3.4%) | 0 (0.0%) |
| 6:00 AM to 6:29 AM | 26 (5.2%) | 53 (14.1%) |
| 6:30 AM to 6:59 AM | 35 (6.9%) | 0 (0.0%) |
| 7:00 AM to 7:29 AM | 45 (8.9%) | 27 (7.2%) |
| 7:30 AM to 7:59 AM | 106 (21.0%) | 90 (24.0%) |
| 8:00 AM to 8:29 AM | 102 (20.2%) | 104 (27.7%) |
| 8:30 AM to 8:59 AM | 26 (5.2%) | 34 (9.1%) |
| 9:00 AM to 9:59 AM | 36 (7.1%) | 9 (2.4%) |
| 10:00 AM to 10:59 AM | 10 (2.0%) | 0 (0.0%) |
| 11:00 AM to 11:59 AM | 0 (0.0%) | 0 (0.0%) |
| 12:00 PM to 3:59 PM | 0 (0.0%) | 0 (0.0%) |
| 4:00 PM to 11:59 PM | 58 (11.5%) | 51 (13.6%) |
| Total | 504 (100.0%) | 375 (100.0%) |
Housing Occupancy in Falling Water
Occupancy by Ownership in Falling Water
Of the total 687 dwellings in Falling Water, owner-occupied units account for 553 (80.5%), while renter-occupied units make up 134 (19.5%).
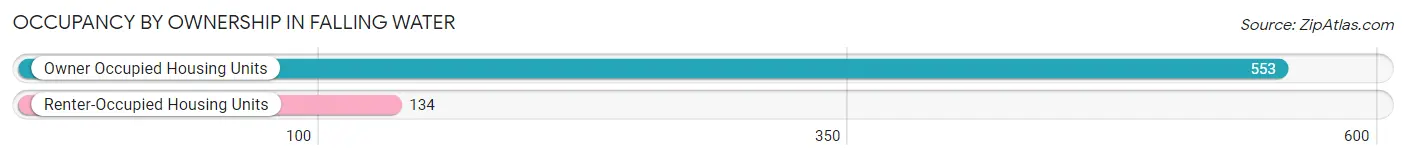
| Occupancy | # Housing Units | % Housing Units |
| Owner Occupied Housing Units | 553 | 80.5% |
| Renter-Occupied Housing Units | 134 | 19.5% |
| Total Occupied Housing Units | 687 | 100.0% |
Occupancy by Household Size in Falling Water
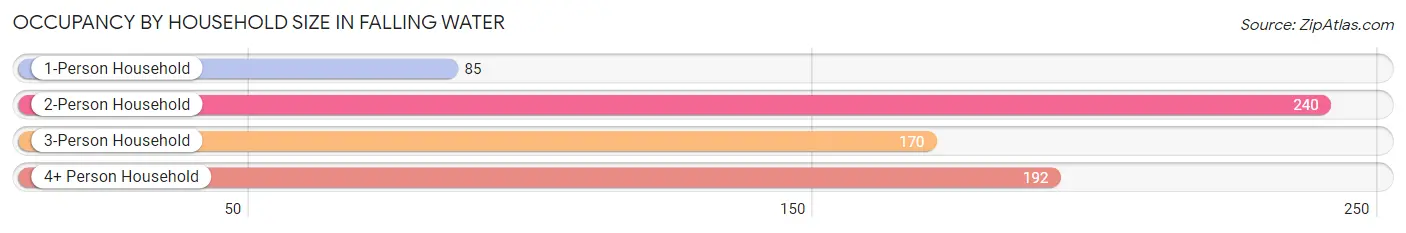
| Household Size | # Housing Units | % Housing Units |
| 1-Person Household | 85 | 12.4% |
| 2-Person Household | 240 | 34.9% |
| 3-Person Household | 170 | 24.7% |
| 4+ Person Household | 192 | 28.0% |
| Total Housing Units | 687 | 100.0% |
Occupancy by Ownership by Household Size in Falling Water
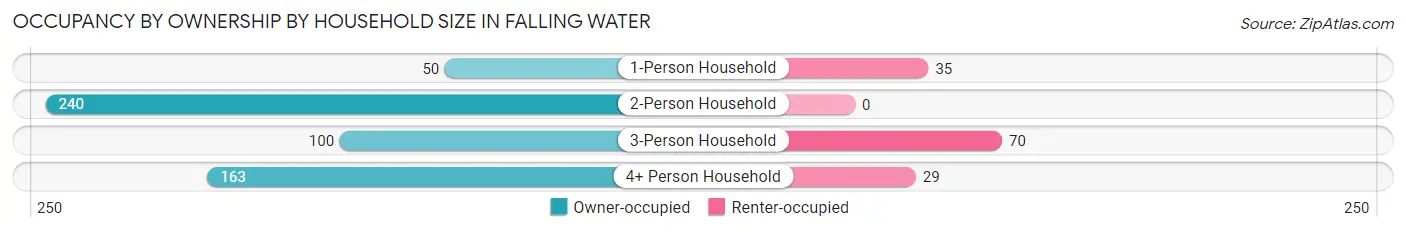
| Household Size | Owner-occupied | Renter-occupied |
| 1-Person Household | 50 (58.8%) | 35 (41.2%) |
| 2-Person Household | 240 (100.0%) | 0 (0.0%) |
| 3-Person Household | 100 (58.8%) | 70 (41.2%) |
| 4+ Person Household | 163 (84.9%) | 29 (15.1%) |
| Total Housing Units | 553 (80.5%) | 134 (19.5%) |
Occupancy by Educational Attainment in Falling Water
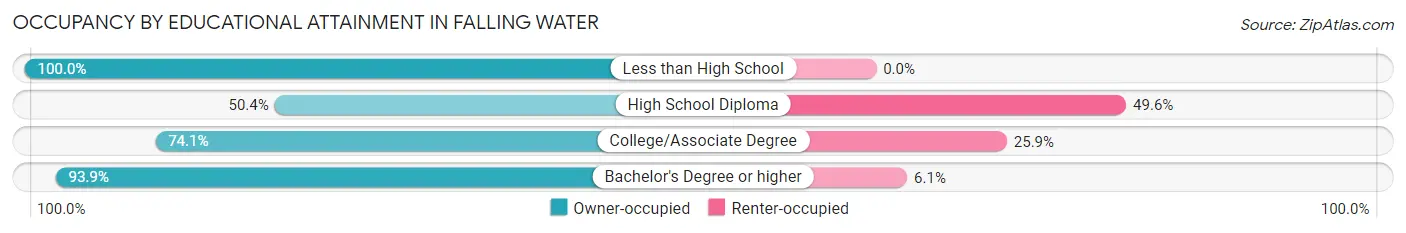
| Household Size | Owner-occupied | Renter-occupied |
| Less than High School | 12 (100.0%) | 0 (0.0%) |
| High School Diploma | 57 (50.4%) | 56 (49.6%) |
| College/Associate Degree | 163 (74.1%) | 57 (25.9%) |
| Bachelor's Degree or higher | 321 (93.9%) | 21 (6.1%) |
Occupancy by Age of Householder in Falling Water
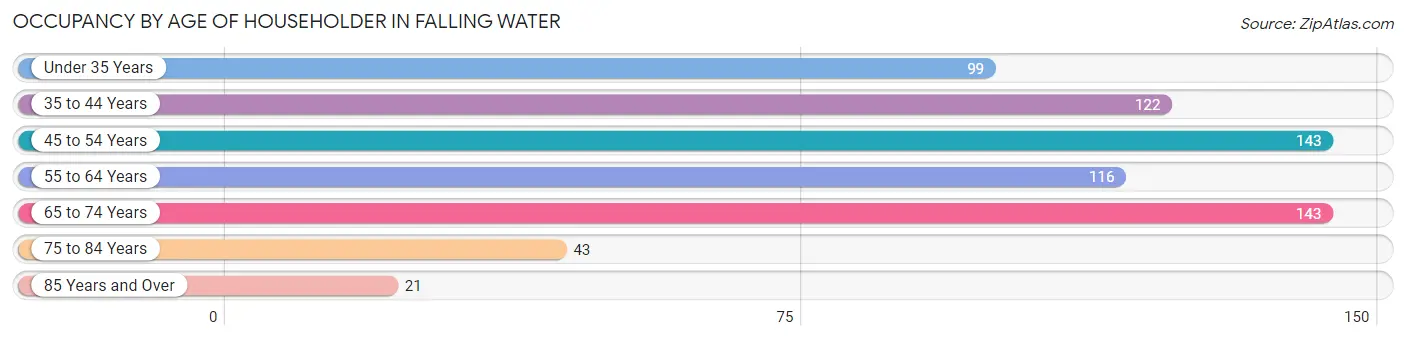
| Age Bracket | # Households | % Households |
| Under 35 Years | 99 | 14.4% |
| 35 to 44 Years | 122 | 17.8% |
| 45 to 54 Years | 143 | 20.8% |
| 55 to 64 Years | 116 | 16.9% |
| 65 to 74 Years | 143 | 20.8% |
| 75 to 84 Years | 43 | 6.3% |
| 85 Years and Over | 21 | 3.1% |
| Total | 687 | 100.0% |
Housing Finances in Falling Water
Median Income by Occupancy in Falling Water
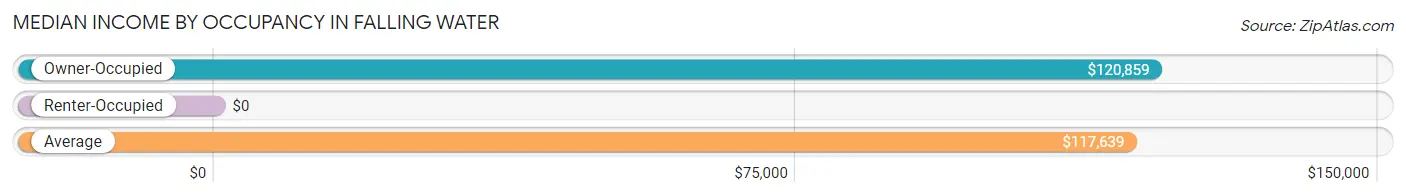
| Occupancy Type | # Households | Median Income |
| Owner-Occupied | 553 (80.5%) | $120,859 |
| Renter-Occupied | 134 (19.5%) | $0 |
| Average | 687 (100.0%) | $117,639 |
Occupancy by Householder Income Bracket in Falling Water
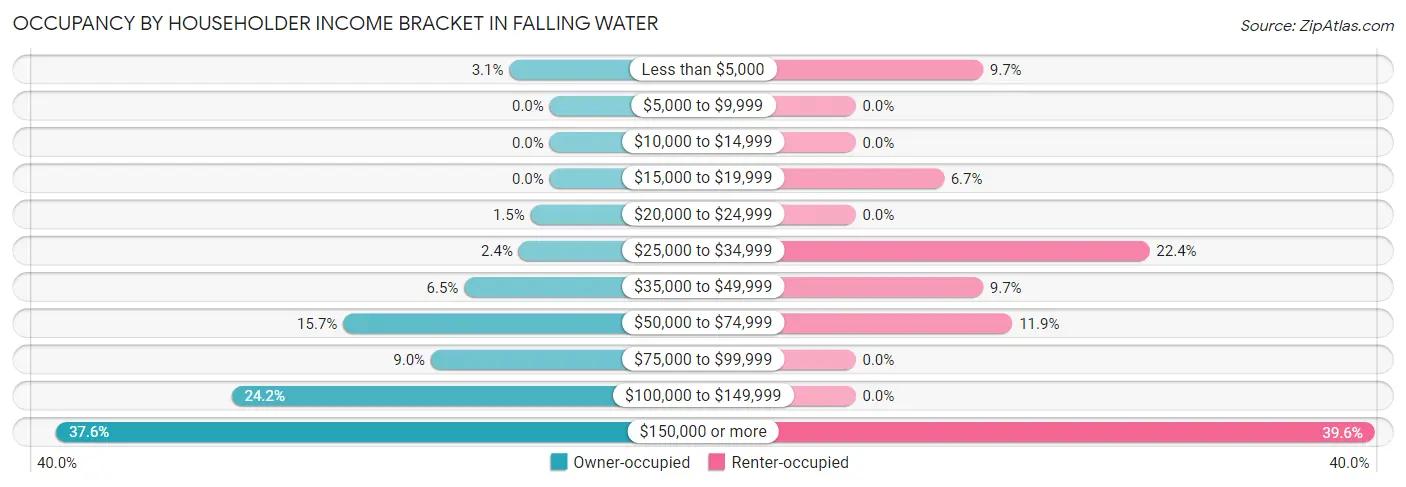
| Income Bracket | Owner-occupied | Renter-occupied |
| Less than $5,000 | 17 (3.1%) | 13 (9.7%) |
| $5,000 to $9,999 | 0 (0.0%) | 0 (0.0%) |
| $10,000 to $14,999 | 0 (0.0%) | 0 (0.0%) |
| $15,000 to $19,999 | 0 (0.0%) | 9 (6.7%) |
| $20,000 to $24,999 | 8 (1.5%) | 0 (0.0%) |
| $25,000 to $34,999 | 13 (2.4%) | 30 (22.4%) |
| $35,000 to $49,999 | 36 (6.5%) | 13 (9.7%) |
| $50,000 to $74,999 | 87 (15.7%) | 16 (11.9%) |
| $75,000 to $99,999 | 50 (9.0%) | 0 (0.0%) |
| $100,000 to $149,999 | 134 (24.2%) | 0 (0.0%) |
| $150,000 or more | 208 (37.6%) | 53 (39.6%) |
| Total | 553 (100.0%) | 134 (100.0%) |
Monthly Housing Cost Tiers in Falling Water
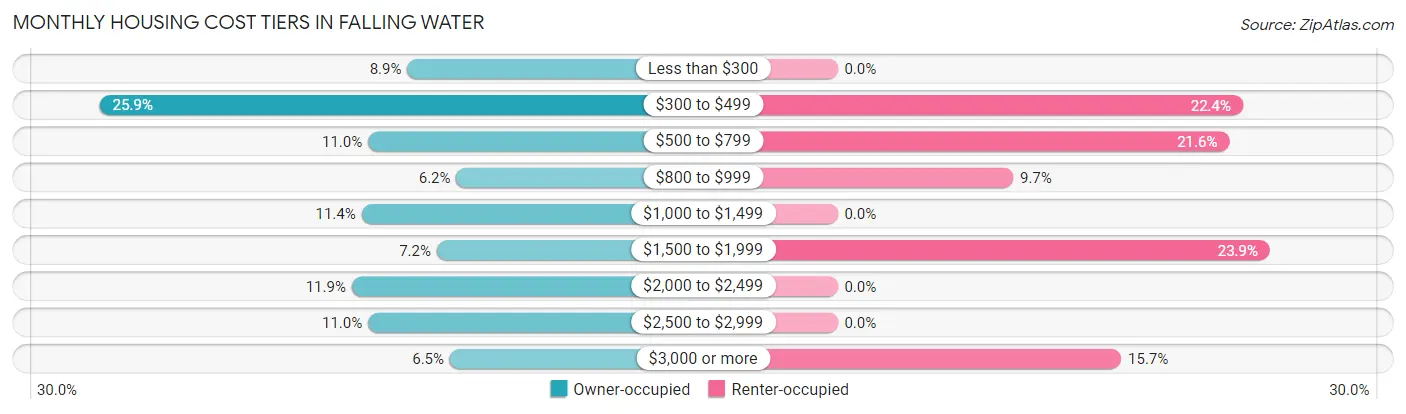
| Monthly Cost | Owner-occupied | Renter-occupied |
| Less than $300 | 49 (8.9%) | 0 (0.0%) |
| $300 to $499 | 143 (25.9%) | 30 (22.4%) |
| $500 to $799 | 61 (11.0%) | 29 (21.6%) |
| $800 to $999 | 34 (6.1%) | 13 (9.7%) |
| $1,000 to $1,499 | 63 (11.4%) | 0 (0.0%) |
| $1,500 to $1,999 | 40 (7.2%) | 32 (23.9%) |
| $2,000 to $2,499 | 66 (11.9%) | 0 (0.0%) |
| $2,500 to $2,999 | 61 (11.0%) | 0 (0.0%) |
| $3,000 or more | 36 (6.5%) | 21 (15.7%) |
| Total | 553 (100.0%) | 134 (100.0%) |
Physical Housing Characteristics in Falling Water
Housing Structures in Falling Water
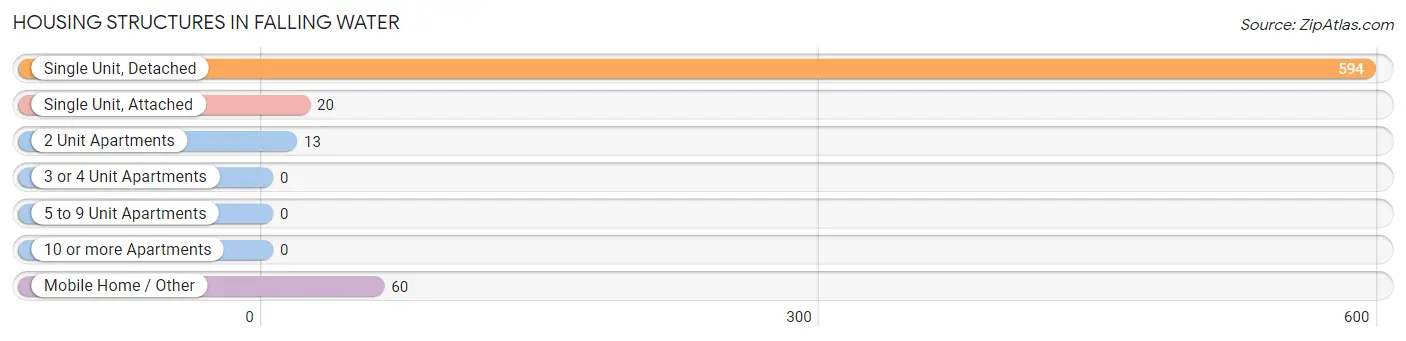
| Structure Type | # Housing Units | % Housing Units |
| Single Unit, Detached | 594 | 86.5% |
| Single Unit, Attached | 20 | 2.9% |
| 2 Unit Apartments | 13 | 1.9% |
| 3 or 4 Unit Apartments | 0 | 0.0% |
| 5 to 9 Unit Apartments | 0 | 0.0% |
| 10 or more Apartments | 0 | 0.0% |
| Mobile Home / Other | 60 | 8.7% |
| Total | 687 | 100.0% |
Housing Structures by Occupancy in Falling Water
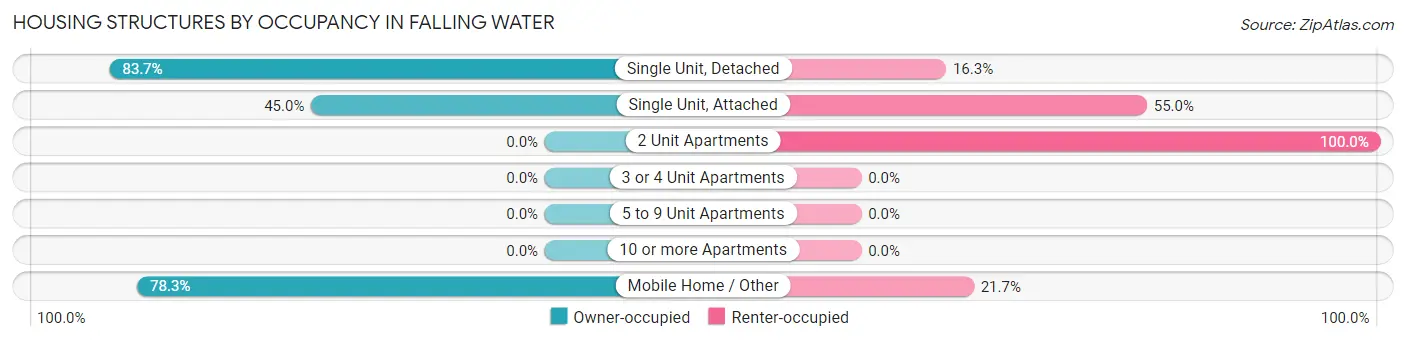
| Structure Type | Owner-occupied | Renter-occupied |
| Single Unit, Detached | 497 (83.7%) | 97 (16.3%) |
| Single Unit, Attached | 9 (45.0%) | 11 (55.0%) |
| 2 Unit Apartments | 0 (0.0%) | 13 (100.0%) |
| 3 or 4 Unit Apartments | 0 (0.0%) | 0 (0.0%) |
| 5 to 9 Unit Apartments | 0 (0.0%) | 0 (0.0%) |
| 10 or more Apartments | 0 (0.0%) | 0 (0.0%) |
| Mobile Home / Other | 47 (78.3%) | 13 (21.7%) |
| Total | 553 (80.5%) | 134 (19.5%) |
Housing Structures by Number of Rooms in Falling Water
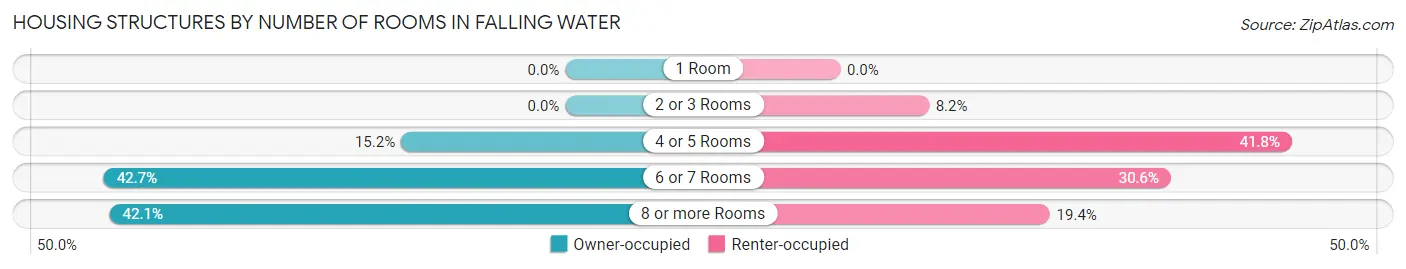
| Number of Rooms | Owner-occupied | Renter-occupied |
| 1 Room | 0 (0.0%) | 0 (0.0%) |
| 2 or 3 Rooms | 0 (0.0%) | 11 (8.2%) |
| 4 or 5 Rooms | 84 (15.2%) | 56 (41.8%) |
| 6 or 7 Rooms | 236 (42.7%) | 41 (30.6%) |
| 8 or more Rooms | 233 (42.1%) | 26 (19.4%) |
| Total | 553 (100.0%) | 134 (100.0%) |
Housing Structure by Heating Type in Falling Water
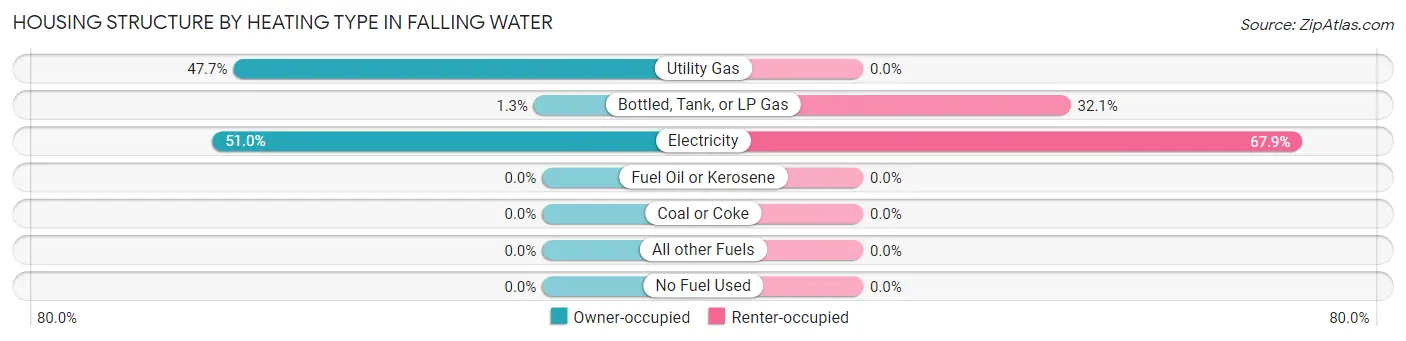
| Heating Type | Owner-occupied | Renter-occupied |
| Utility Gas | 264 (47.7%) | 0 (0.0%) |
| Bottled, Tank, or LP Gas | 7 (1.3%) | 43 (32.1%) |
| Electricity | 282 (51.0%) | 91 (67.9%) |
| Fuel Oil or Kerosene | 0 (0.0%) | 0 (0.0%) |
| Coal or Coke | 0 (0.0%) | 0 (0.0%) |
| All other Fuels | 0 (0.0%) | 0 (0.0%) |
| No Fuel Used | 0 (0.0%) | 0 (0.0%) |
| Total | 553 (100.0%) | 134 (100.0%) |
Household Vehicle Usage in Falling Water
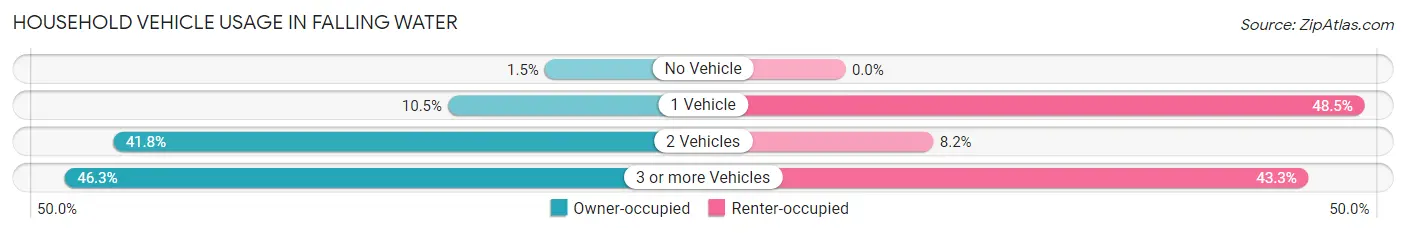
| Vehicles per Household | Owner-occupied | Renter-occupied |
| No Vehicle | 8 (1.5%) | 0 (0.0%) |
| 1 Vehicle | 58 (10.5%) | 65 (48.5%) |
| 2 Vehicles | 231 (41.8%) | 11 (8.2%) |
| 3 or more Vehicles | 256 (46.3%) | 58 (43.3%) |
| Total | 553 (100.0%) | 134 (100.0%) |
Real Estate & Mortgages in Falling Water
Real Estate and Mortgage Overview in Falling Water
| Characteristic | Without Mortgage | With Mortgage |
| Housing Units | 293 | 260 |
| Median Property Value | $219,600 | $438,700 |
| Median Household Income | $90,375 | $148 |
| Monthly Housing Costs | $391 | $36 |
| Real Estate Taxes | $1,342 | $0 |
Property Value by Mortgage Status in Falling Water
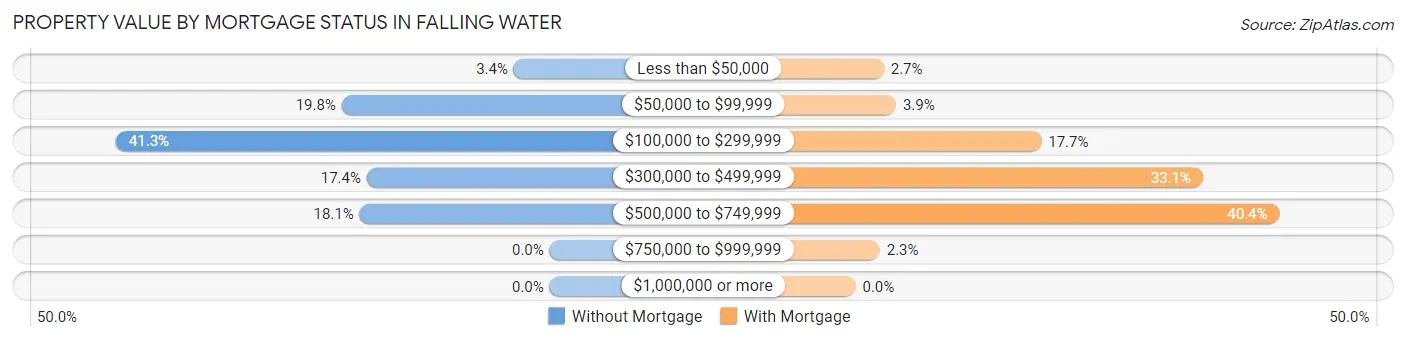
| Property Value | Without Mortgage | With Mortgage |
| Less than $50,000 | 10 (3.4%) | 7 (2.7%) |
| $50,000 to $99,999 | 58 (19.8%) | 10 (3.8%) |
| $100,000 to $299,999 | 121 (41.3%) | 46 (17.7%) |
| $300,000 to $499,999 | 51 (17.4%) | 86 (33.1%) |
| $500,000 to $749,999 | 53 (18.1%) | 105 (40.4%) |
| $750,000 to $999,999 | 0 (0.0%) | 6 (2.3%) |
| $1,000,000 or more | 0 (0.0%) | 0 (0.0%) |
| Total | 293 (100.0%) | 260 (100.0%) |
Household Income by Mortgage Status in Falling Water
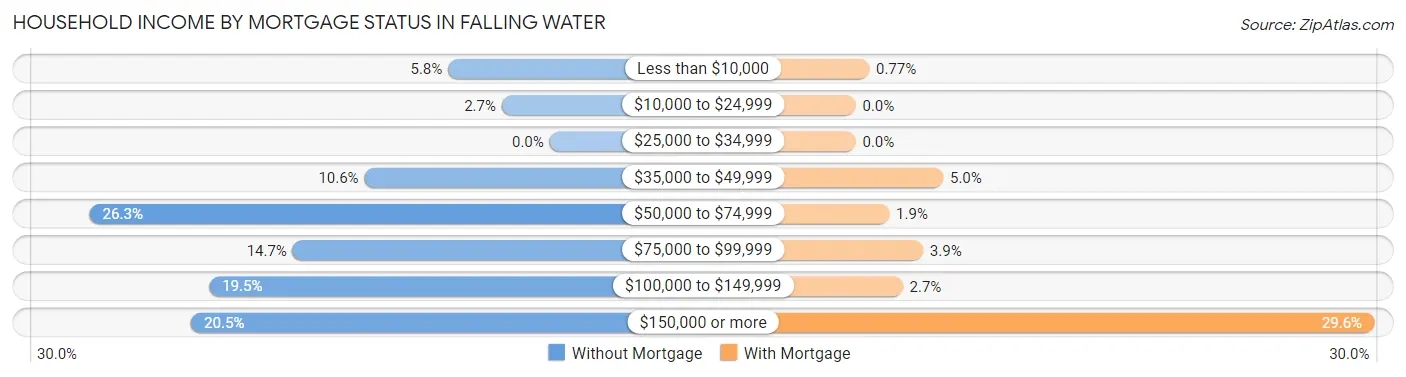
| Household Income | Without Mortgage | With Mortgage |
| Less than $10,000 | 17 (5.8%) | 2 (0.8%) |
| $10,000 to $24,999 | 8 (2.7%) | 0 (0.0%) |
| $25,000 to $34,999 | 0 (0.0%) | 0 (0.0%) |
| $35,000 to $49,999 | 31 (10.6%) | 13 (5.0%) |
| $50,000 to $74,999 | 77 (26.3%) | 5 (1.9%) |
| $75,000 to $99,999 | 43 (14.7%) | 10 (3.8%) |
| $100,000 to $149,999 | 57 (19.5%) | 7 (2.7%) |
| $150,000 or more | 60 (20.5%) | 77 (29.6%) |
| Total | 293 (100.0%) | 260 (100.0%) |
Property Value to Household Income Ratio in Falling Water
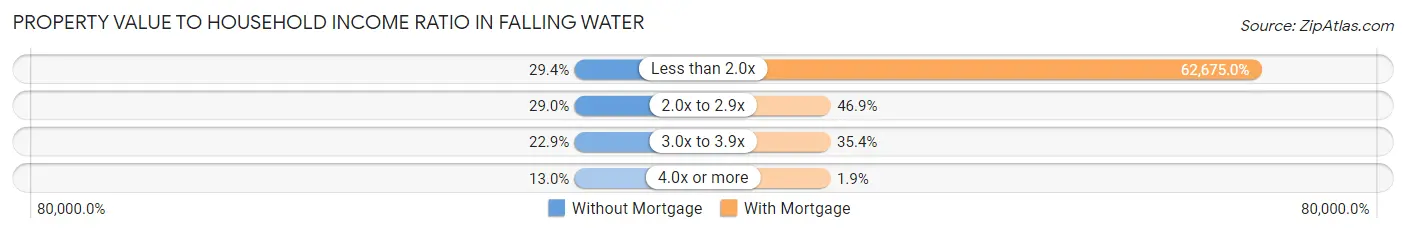
| Value-to-Income Ratio | Without Mortgage | With Mortgage |
| Less than 2.0x | 86 (29.3%) | 162,955 (62,675.0%) |
| 2.0x to 2.9x | 85 (29.0%) | 122 (46.9%) |
| 3.0x to 3.9x | 67 (22.9%) | 92 (35.4%) |
| 4.0x or more | 38 (13.0%) | 5 (1.9%) |
| Total | 293 (100.0%) | 260 (100.0%) |
Real Estate Taxes by Mortgage Status in Falling Water
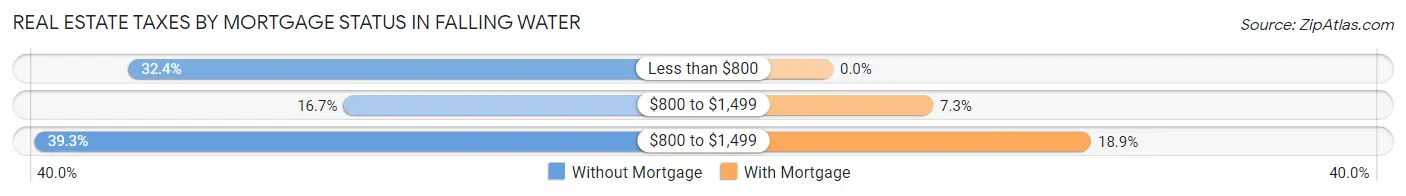
| Property Taxes | Without Mortgage | With Mortgage |
| Less than $800 | 95 (32.4%) | 0 (0.0%) |
| $800 to $1,499 | 49 (16.7%) | 19 (7.3%) |
| $800 to $1,499 | 115 (39.3%) | 49 (18.9%) |
| Total | 293 (100.0%) | 260 (100.0%) |
Health & Disability in Falling Water
Health Insurance Coverage by Age in Falling Water
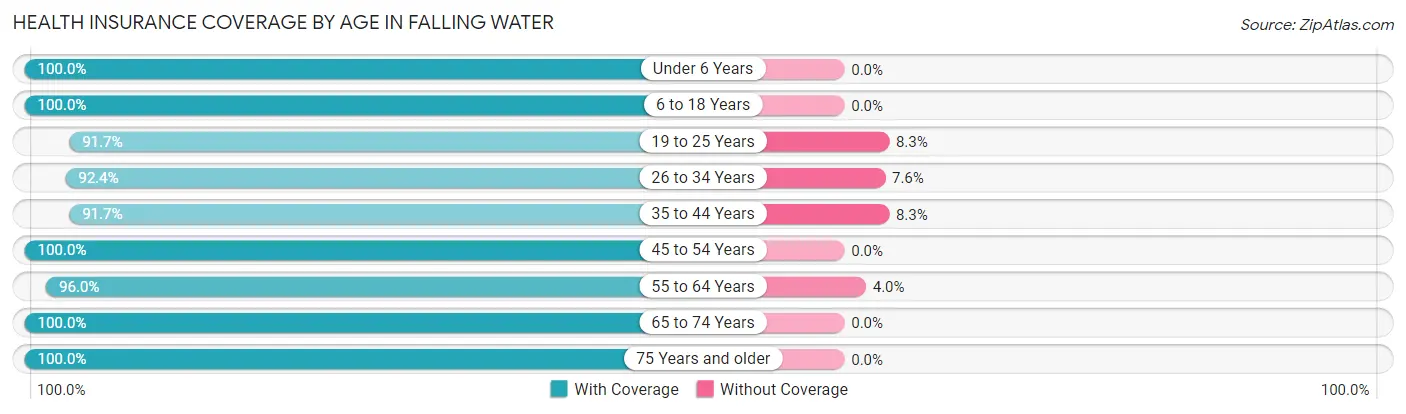
| Age Bracket | With Coverage | Without Coverage |
| Under 6 Years | 133 (100.0%) | 0 (0.0%) |
| 6 to 18 Years | 379 (100.0%) | 0 (0.0%) |
| 19 to 25 Years | 110 (91.7%) | 10 (8.3%) |
| 26 to 34 Years | 158 (92.4%) | 13 (7.6%) |
| 35 to 44 Years | 220 (91.7%) | 20 (8.3%) |
| 45 to 54 Years | 345 (100.0%) | 0 (0.0%) |
| 55 to 64 Years | 287 (96.0%) | 12 (4.0%) |
| 65 to 74 Years | 258 (100.0%) | 0 (0.0%) |
| 75 Years and older | 77 (100.0%) | 0 (0.0%) |
| Total | 1,967 (97.3%) | 55 (2.7%) |
Health Insurance Coverage by Citizenship Status in Falling Water
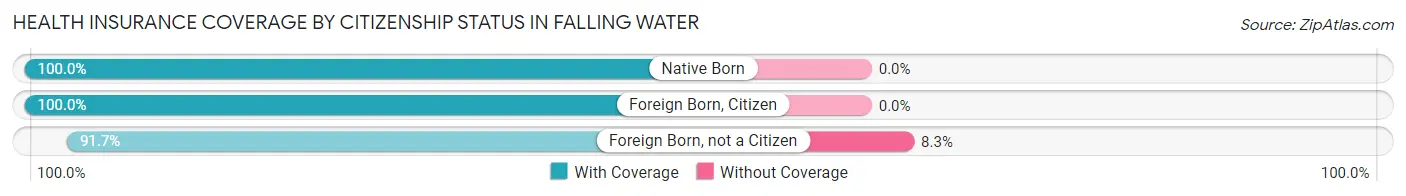
| Citizenship Status | With Coverage | Without Coverage |
| Native Born | 133 (100.0%) | 0 (0.0%) |
| Foreign Born, Citizen | 379 (100.0%) | 0 (0.0%) |
| Foreign Born, not a Citizen | 110 (91.7%) | 10 (8.3%) |
Health Insurance Coverage by Household Income in Falling Water
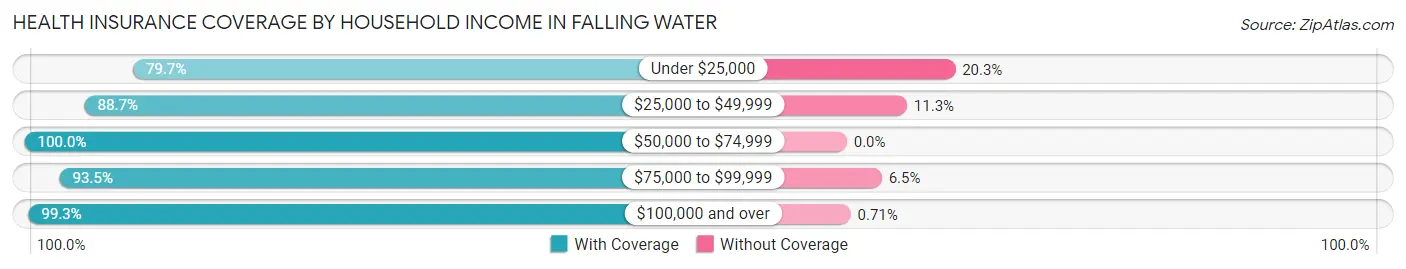
| Household Income | With Coverage | Without Coverage |
| Under $25,000 | 51 (79.7%) | 13 (20.3%) |
| $25,000 to $49,999 | 197 (88.7%) | 25 (11.3%) |
| $50,000 to $74,999 | 218 (100.0%) | 0 (0.0%) |
| $75,000 to $99,999 | 100 (93.5%) | 7 (6.5%) |
| $100,000 and over | 1,401 (99.3%) | 10 (0.7%) |
Public vs Private Health Insurance Coverage by Age in Falling Water
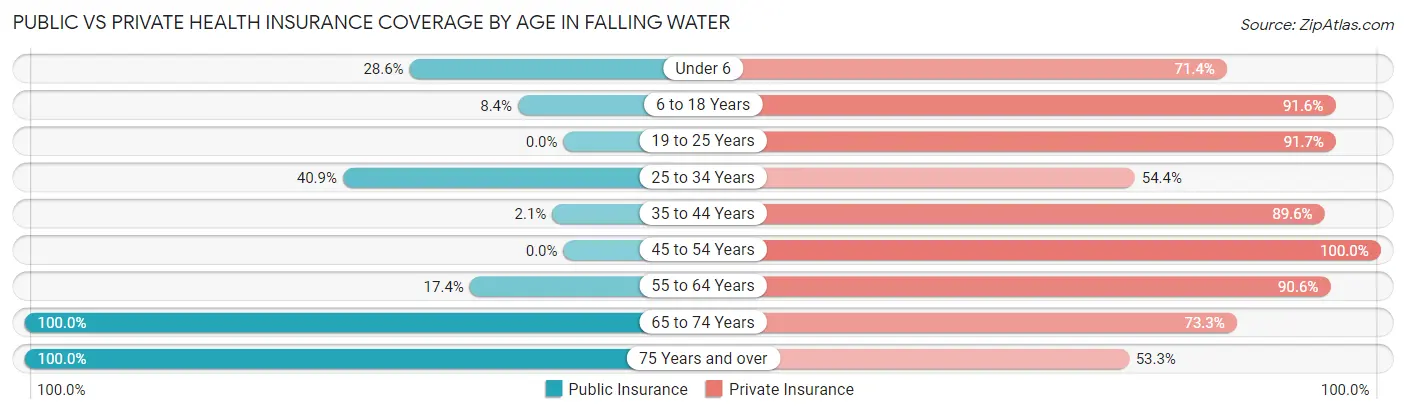
| Age Bracket | Public Insurance | Private Insurance |
| Under 6 | 38 (28.6%) | 95 (71.4%) |
| 6 to 18 Years | 32 (8.4%) | 347 (91.6%) |
| 19 to 25 Years | 0 (0.0%) | 110 (91.7%) |
| 25 to 34 Years | 70 (40.9%) | 93 (54.4%) |
| 35 to 44 Years | 5 (2.1%) | 215 (89.6%) |
| 45 to 54 Years | 0 (0.0%) | 345 (100.0%) |
| 55 to 64 Years | 52 (17.4%) | 271 (90.6%) |
| 65 to 74 Years | 258 (100.0%) | 189 (73.3%) |
| 75 Years and over | 77 (100.0%) | 41 (53.2%) |
| Total | 532 (26.3%) | 1,706 (84.4%) |
Disability Status by Sex by Age in Falling Water
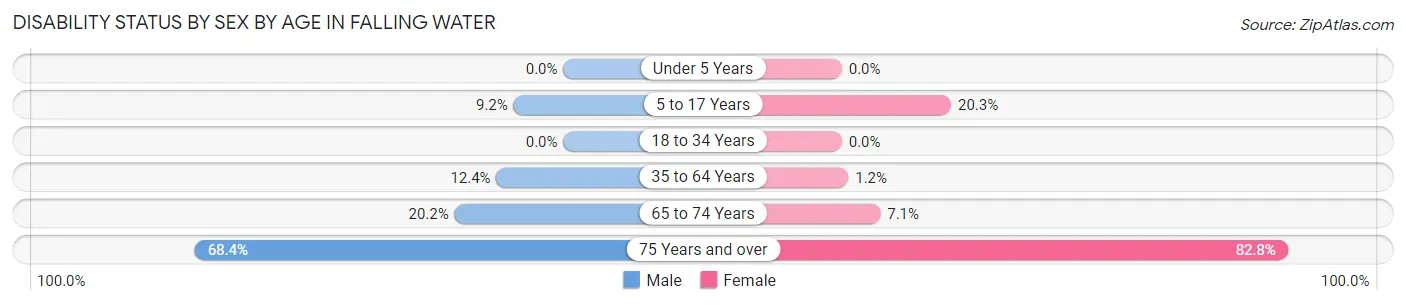
| Age Bracket | Male | Female |
| Under 5 Years | 0 (0.0%) | 0 (0.0%) |
| 5 to 17 Years | 12 (9.2%) | 44 (20.3%) |
| 18 to 34 Years | 0 (0.0%) | 0 (0.0%) |
| 35 to 64 Years | 58 (12.4%) | 5 (1.2%) |
| 65 to 74 Years | 21 (20.2%) | 11 (7.1%) |
| 75 Years and over | 13 (68.4%) | 48 (82.8%) |
Disability Class by Sex by Age in Falling Water
Disability Class: Hearing Difficulty
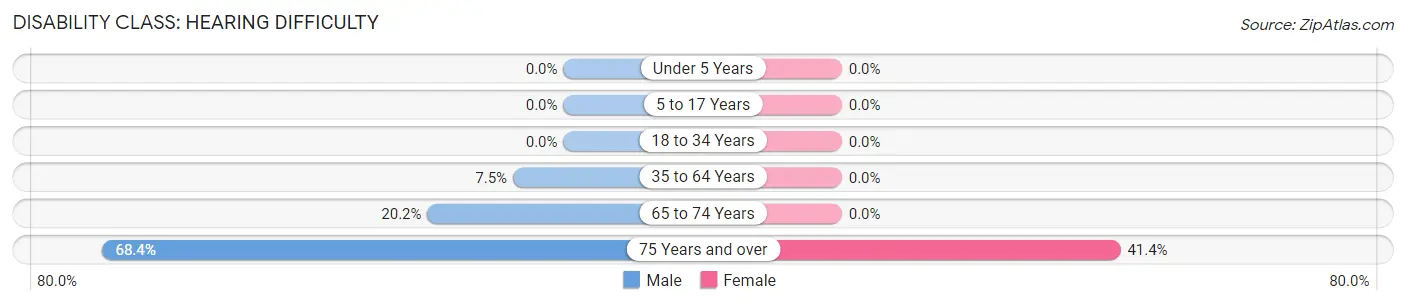
| Age Bracket | Male | Female |
| Under 5 Years | 0 (0.0%) | 0 (0.0%) |
| 5 to 17 Years | 0 (0.0%) | 0 (0.0%) |
| 18 to 34 Years | 0 (0.0%) | 0 (0.0%) |
| 35 to 64 Years | 35 (7.5%) | 0 (0.0%) |
| 65 to 74 Years | 21 (20.2%) | 0 (0.0%) |
| 75 Years and over | 13 (68.4%) | 24 (41.4%) |
Disability Class: Vision Difficulty
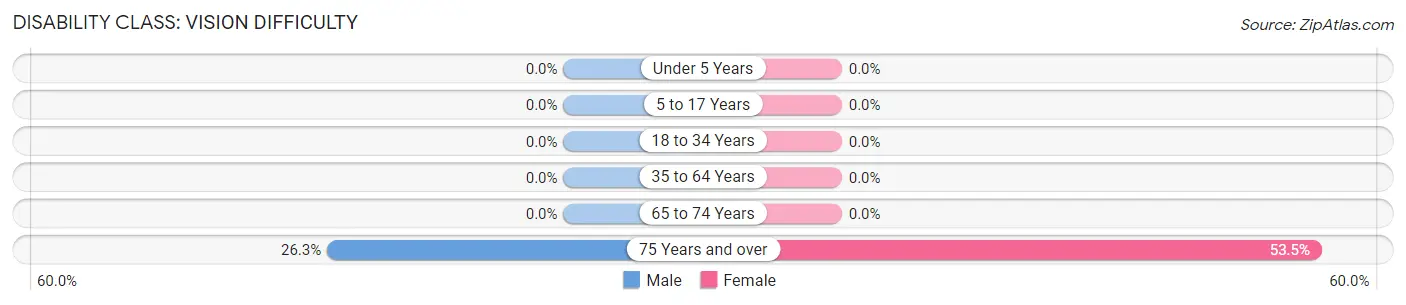
| Age Bracket | Male | Female |
| Under 5 Years | 0 (0.0%) | 0 (0.0%) |
| 5 to 17 Years | 0 (0.0%) | 0 (0.0%) |
| 18 to 34 Years | 0 (0.0%) | 0 (0.0%) |
| 35 to 64 Years | 0 (0.0%) | 0 (0.0%) |
| 65 to 74 Years | 0 (0.0%) | 0 (0.0%) |
| 75 Years and over | 5 (26.3%) | 31 (53.4%) |
Disability Class: Cognitive Difficulty
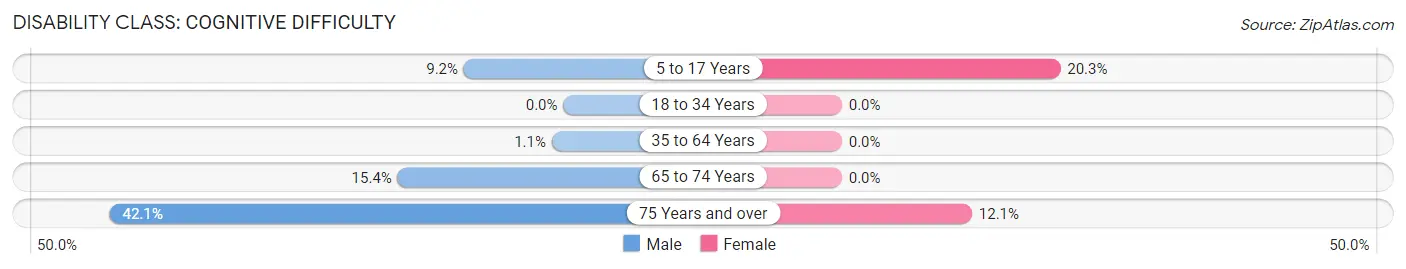
| Age Bracket | Male | Female |
| 5 to 17 Years | 12 (9.2%) | 44 (20.3%) |
| 18 to 34 Years | 0 (0.0%) | 0 (0.0%) |
| 35 to 64 Years | 5 (1.1%) | 0 (0.0%) |
| 65 to 74 Years | 16 (15.4%) | 0 (0.0%) |
| 75 Years and over | 8 (42.1%) | 7 (12.1%) |
Disability Class: Ambulatory Difficulty
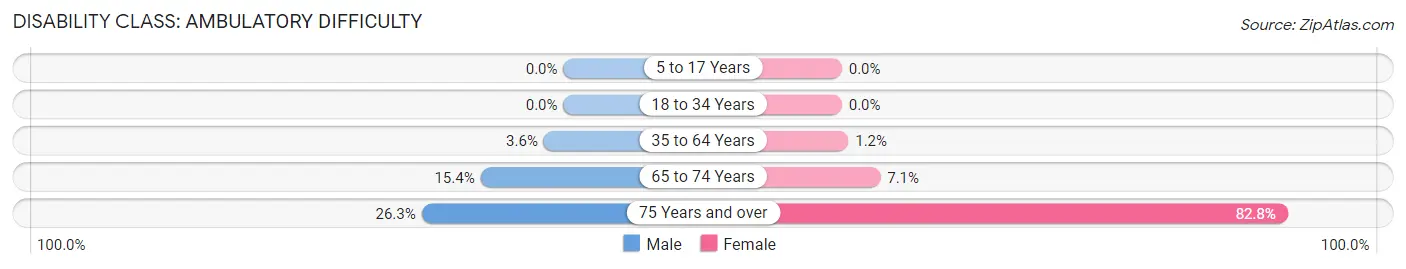
| Age Bracket | Male | Female |
| 5 to 17 Years | 0 (0.0%) | 0 (0.0%) |
| 18 to 34 Years | 0 (0.0%) | 0 (0.0%) |
| 35 to 64 Years | 17 (3.6%) | 5 (1.2%) |
| 65 to 74 Years | 16 (15.4%) | 11 (7.1%) |
| 75 Years and over | 5 (26.3%) | 48 (82.8%) |
Disability Class: Self-Care Difficulty
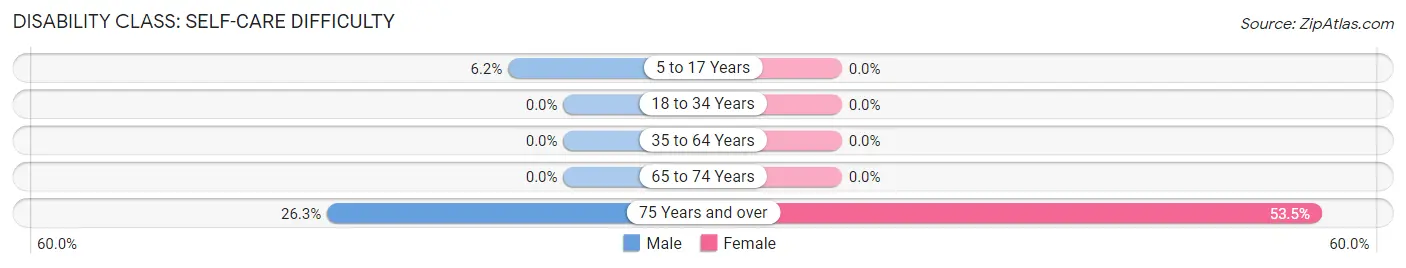
| Age Bracket | Male | Female |
| 5 to 17 Years | 8 (6.1%) | 0 (0.0%) |
| 18 to 34 Years | 0 (0.0%) | 0 (0.0%) |
| 35 to 64 Years | 0 (0.0%) | 0 (0.0%) |
| 65 to 74 Years | 0 (0.0%) | 0 (0.0%) |
| 75 Years and over | 5 (26.3%) | 31 (53.4%) |
Technology Access in Falling Water
Computing Device Access in Falling Water
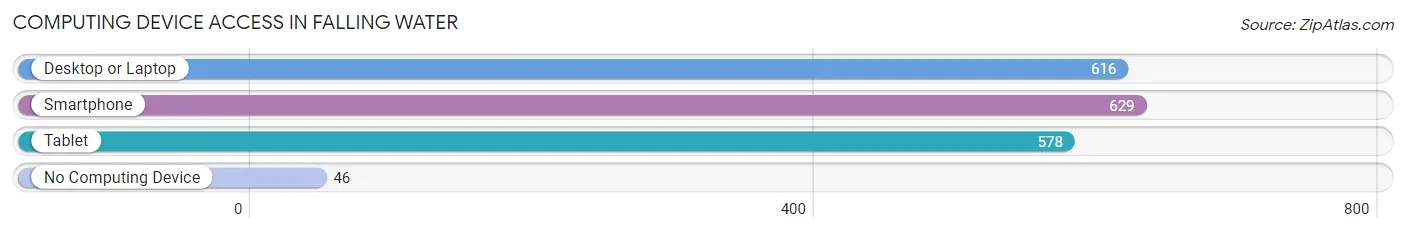
| Device Type | # Households | % Households |
| Desktop or Laptop | 616 | 89.7% |
| Smartphone | 629 | 91.6% |
| Tablet | 578 | 84.1% |
| No Computing Device | 46 | 6.7% |
| Total | 687 | 100.0% |
Internet Access in Falling Water
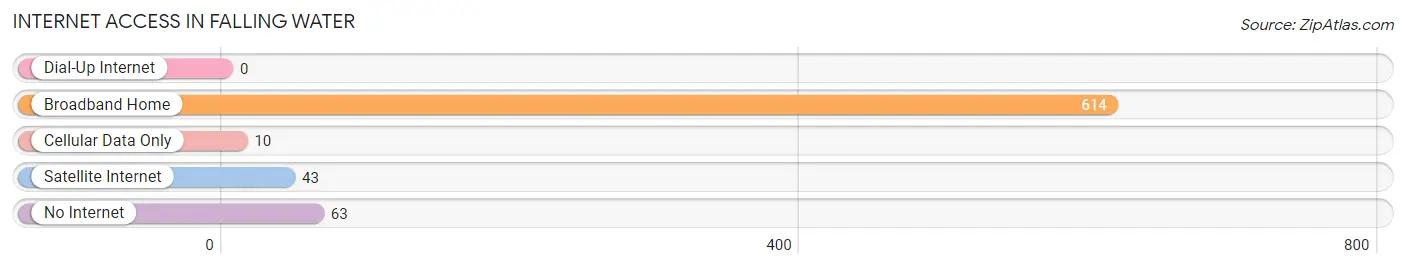
| Internet Type | # Households | % Households |
| Dial-Up Internet | 0 | 0.0% |
| Broadband Home | 614 | 89.4% |
| Cellular Data Only | 10 | 1.5% |
| Satellite Internet | 43 | 6.3% |
| No Internet | 63 | 9.2% |
| Total | 687 | 100.0% |
Falling Water Summary
Falling Water, Tennessee is a small town located in the eastern part of the state, in the foothills of the Appalachian Mountains. It is situated in the Sequatchie Valley, a narrow valley that runs through the Cumberland Plateau. The town is located in Marion County, and is part of the Chattanooga metropolitan area. The population of Falling Water was 1,845 as of the 2010 census.
History
Falling Water was first settled in the early 1800s by settlers from North Carolina and Virginia. The town was originally known as “Falling Water Station”, and was a stop on the Nashville and Chattanooga Railroad. The town was officially incorporated in 1887.
In the late 1800s, the town was a major center for the timber industry. The town was home to several sawmills and lumber companies, and the timber industry was the main source of employment for the town’s residents.
In the early 1900s, the town began to experience a decline in the timber industry. This led to a shift in the town’s economy, as the town began to focus more on agriculture. The town was home to several farms, and the main crops grown were corn, wheat, and hay.
In the mid-1900s, the town began to experience a resurgence in the timber industry. This led to an increase in employment opportunities, and the town’s population began to grow.
Geography
Falling Water is located in the eastern part of Tennessee, in the foothills of the Appalachian Mountains. The town is situated in the Sequatchie Valley, a narrow valley that runs through the Cumberland Plateau. The town is located in Marion County, and is part of the Chattanooga metropolitan area.
The town is located at an elevation of 1,068 feet (326 m). The town is located near the Sequatchie River, which flows through the town. The town is located near the base of the Cumberland Plateau, and is surrounded by hills and mountains.
Economy
The economy of Falling Water is largely based on agriculture and timber. The town is home to several farms, and the main crops grown are corn, wheat, and hay. The town is also home to several sawmills and lumber companies, and the timber industry is a major source of employment for the town’s residents.
The town is also home to several small businesses, including restaurants, shops, and other services. The town is also home to several manufacturing companies, including a furniture factory and a plastics factory.
Demographics
As of the 2010 census, the population of Falling Water was 1,845. The town has a total area of 2.2 square miles (5.7 km2), and the population density is 837.3 people per square mile (323.3/km2).
The racial makeup of the town is 97.2% White, 0.9% African American, 0.2% Native American, 0.2% Asian, 0.2% from other races, and 1.3% from two or more races. Hispanic or Latino of any race were 0.9% of the population.
The median income for a household in the town was $30,938, and the median income for a family was $37,500. The per capita income for the town was $15,945. About 16.2% of families and 19.2% of the population were below the poverty line, including 25.2% of those under age 18 and 11.2% of those age 65 or over.
Common Questions
What is Per Capita Income in Falling Water?
Per Capita income in Falling Water is $46,737.
What is the Median Family Income in Falling Water?
Median Family Income in Falling Water is $129,531.
What is the Median Household income in Falling Water?
Median Household Income in Falling Water is $117,639.
What is Income or Wage Gap in Falling Water?
Income or Wage Gap in Falling Water is 37.7%.
Women in Falling Water earn 62.3 cents for every dollar earned by a man.
What is Inequality or Gini Index in Falling Water?
Inequality or Gini Index in Falling Water is 0.40.
What is the Total Population of Falling Water?
Total Population of Falling Water is 2,022.
What is the Total Male Population of Falling Water?
Total Male Population of Falling Water is 955.
What is the Total Female Population of Falling Water?
Total Female Population of Falling Water is 1,067.
What is the Ratio of Males per 100 Females in Falling Water?
There are 89.50 Males per 100 Females in Falling Water.
What is the Ratio of Females per 100 Males in Falling Water?
There are 111.73 Females per 100 Males in Falling Water.
What is the Median Population Age in Falling Water?
Median Population Age in Falling Water is 44.2 Years.
What is the Average Family Size in Falling Water
Average Family Size in Falling Water is 3.2 People.
What is the Average Household Size in Falling Water
Average Household Size in Falling Water is 2.9 People.
How Large is the Labor Force in Falling Water?
There are 1,094 People in the Labor Forcein in Falling Water.
What is the Percentage of People in the Labor Force in Falling Water?
66.8% of People are in the Labor Force in Falling Water.
What is the Unemployment Rate in Falling Water?
Unemployment Rate in Falling Water is 3.5%.