Harrogate, TN Map & Demographics
Harrogate Map
Harrogate Overview
$28,981
PER CAPITA INCOME
$75,147
AVG FAMILY INCOME
$60,025
AVG HOUSEHOLD INCOME
59.8%
WAGE / INCOME GAP [ % ]
40.2¢/ $1
WAGE / INCOME GAP [ $ ]
0.45
INEQUALITY / GINI INDEX
4,371
TOTAL POPULATION
2,041
MALE POPULATION
2,330
FEMALE POPULATION
87.60
MALES / 100 FEMALES
114.16
FEMALES / 100 MALES
43.0
MEDIAN AGE
2.9
AVG FAMILY SIZE
2.3
AVG HOUSEHOLD SIZE
1,941
LABOR FORCE [ PEOPLE ]
49.8%
PERCENT IN LABOR FORCE
2.9%
UNEMPLOYMENT RATE
Harrogate Zip Codes
Harrogate Area Codes
Income in Harrogate
Income Overview in Harrogate
Per Capita Income in Harrogate is $28,981, while median incomes of families and households are $75,147 and $60,025 respectively.
| Characteristic | Number | Measure |
| Per Capita Income | 4,371 | $28,981 |
| Median Family Income | 992 | $75,147 |
| Mean Family Income | 992 | $99,801 |
| Median Household Income | 1,590 | $60,025 |
| Mean Household Income | 1,590 | $79,700 |
| Income Deficit | 992 | $0 |
| Wage / Income Gap (%) | 4,371 | 59.80% |
| Wage / Income Gap ($) | 4,371 | 40.20¢ per $1 |
| Gini / Inequality Index | 4,371 | 0.45 |
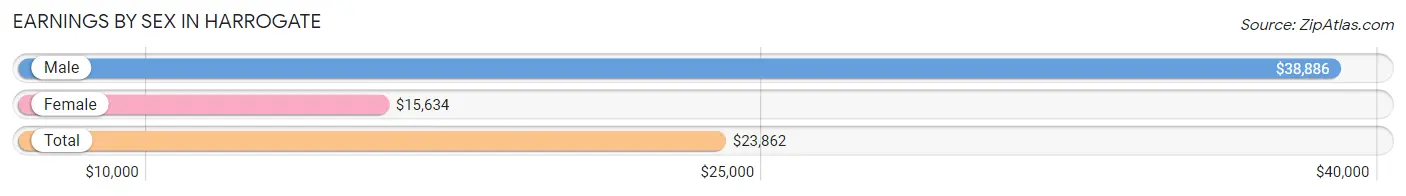
Earnings by Sex in Harrogate
Average Earnings in Harrogate are $23,862, $38,886 for men and $15,634 for women, a difference of 59.8%.
| Sex | Number | Average Earnings |
| Male | 983 (42.2%) | $38,886 |
| Female | 1,346 (57.8%) | $15,634 |
| Total | 2,329 (100.0%) | $23,862 |
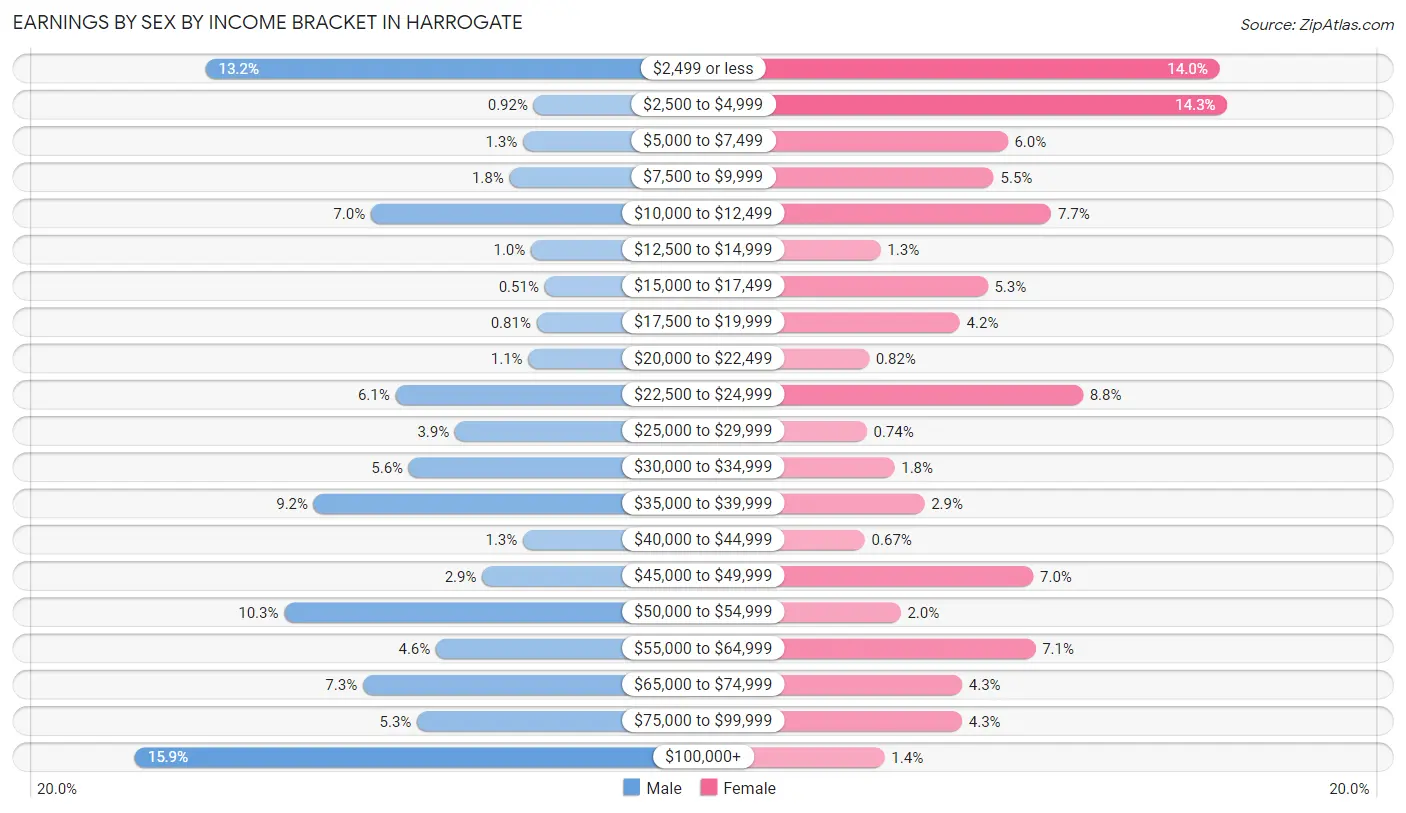
Earnings by Sex by Income Bracket in Harrogate
The most common earnings brackets in Harrogate are $100,000+ for men (156 | 15.9%) and $2,500 to $4,999 for women (192 | 14.3%).
| Income | Male | Female |
| $2,499 or less | 130 (13.2%) | 188 (14.0%) |
| $2,500 to $4,999 | 9 (0.9%) | 192 (14.3%) |
| $5,000 to $7,499 | 13 (1.3%) | 81 (6.0%) |
| $7,500 to $9,999 | 18 (1.8%) | 74 (5.5%) |
| $10,000 to $12,499 | 69 (7.0%) | 103 (7.6%) |
| $12,500 to $14,999 | 10 (1.0%) | 17 (1.3%) |
| $15,000 to $17,499 | 5 (0.5%) | 71 (5.3%) |
| $17,500 to $19,999 | 8 (0.8%) | 57 (4.2%) |
| $20,000 to $22,499 | 11 (1.1%) | 11 (0.8%) |
| $22,500 to $24,999 | 60 (6.1%) | 119 (8.8%) |
| $25,000 to $29,999 | 38 (3.9%) | 10 (0.7%) |
| $30,000 to $34,999 | 55 (5.6%) | 24 (1.8%) |
| $35,000 to $39,999 | 90 (9.2%) | 39 (2.9%) |
| $40,000 to $44,999 | 13 (1.3%) | 9 (0.7%) |
| $45,000 to $49,999 | 28 (2.9%) | 94 (7.0%) |
| $50,000 to $54,999 | 101 (10.3%) | 27 (2.0%) |
| $55,000 to $64,999 | 45 (4.6%) | 95 (7.1%) |
| $65,000 to $74,999 | 72 (7.3%) | 58 (4.3%) |
| $75,000 to $99,999 | 52 (5.3%) | 58 (4.3%) |
| $100,000+ | 156 (15.9%) | 19 (1.4%) |
| Total | 983 (100.0%) | 1,346 (100.0%) |
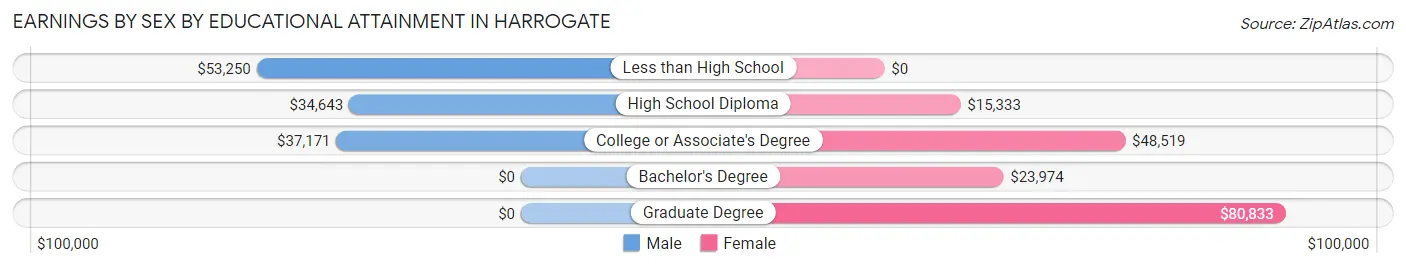
Earnings by Sex by Educational Attainment in Harrogate
Average earnings in Harrogate are $51,235 for men and $29,063 for women, a difference of 43.3%. Men with an educational attainment of less than high school enjoy the highest average annual earnings of $53,250, while those with high school diploma education earn the least with $34,643. Women with an educational attainment of graduate degree earn the most with the average annual earnings of $80,833, while those with high school diploma education have the smallest earnings of $15,333.
| Educational Attainment | Male Income | Female Income |
| Less than High School | $53,250 | $0 |
| High School Diploma | $34,643 | $15,333 |
| College or Associate's Degree | $37,171 | $48,519 |
| Bachelor's Degree | - | - |
| Graduate Degree | - | - |
| Total | $51,235 | $29,063 |
Family Income in Harrogate
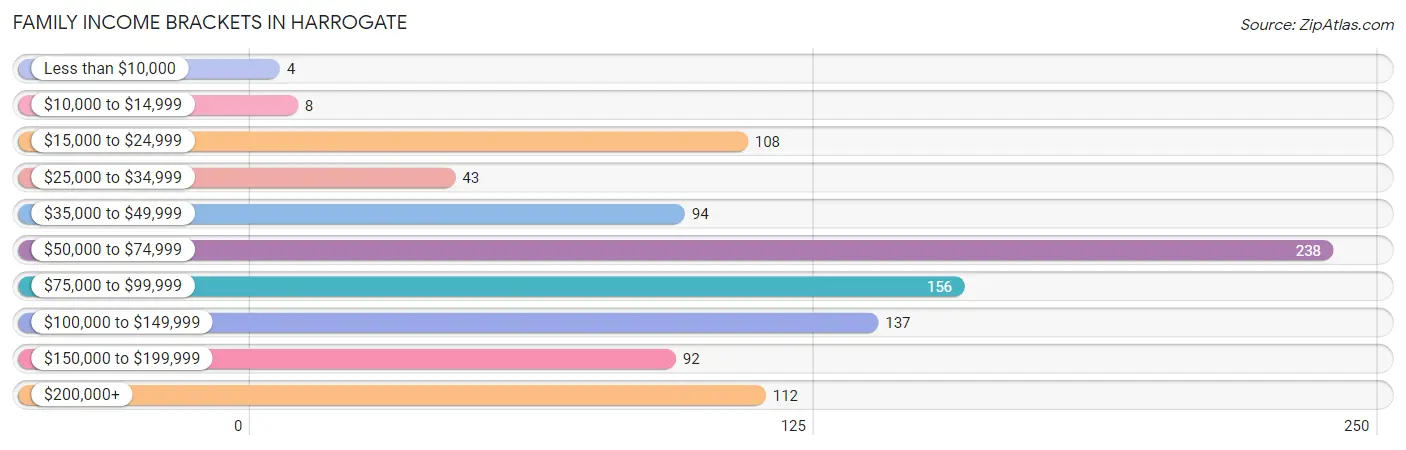
Family Income Brackets in Harrogate
According to the Harrogate family income data, there are 238 families falling into the $50,000 to $74,999 income range, which is the most common income bracket and makes up 24.0% of all families. Conversely, the less than $10,000 income bracket is the least frequent group with only 4 families (0.4%) belonging to this category.
| Income Bracket | # Families | % Families |
| Less than $10,000 | 4 | 0.4% |
| $10,000 to $14,999 | 8 | 0.8% |
| $15,000 to $24,999 | 108 | 10.9% |
| $25,000 to $34,999 | 43 | 4.3% |
| $35,000 to $49,999 | 94 | 9.5% |
| $50,000 to $74,999 | 238 | 24.0% |
| $75,000 to $99,999 | 156 | 15.7% |
| $100,000 to $149,999 | 137 | 13.8% |
| $150,000 to $199,999 | 92 | 9.3% |
| $200,000+ | 112 | 11.3% |
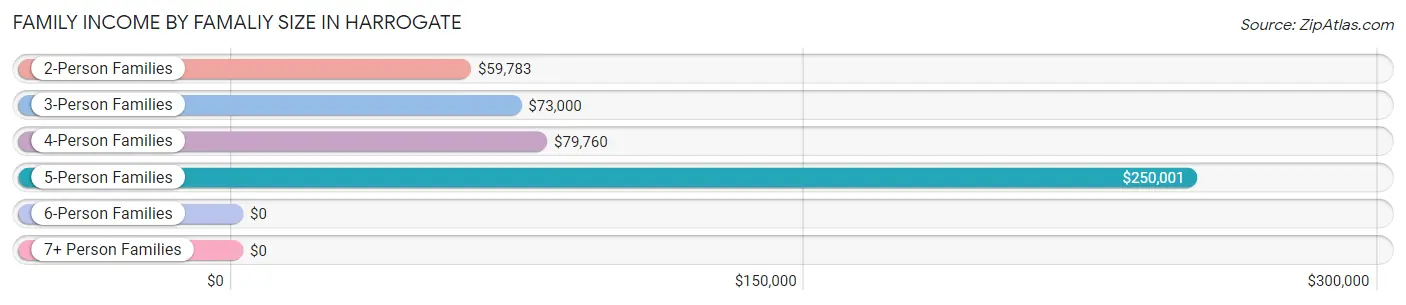
Family Income by Famaliy Size in Harrogate
5-person families (131 | 13.2%) account for the highest median family income in Harrogate with $250,001 per family, while 5-person families (131 | 13.2%) have the highest median income of $50,000 per family member.
| Income Bracket | # Families | Median Income |
| 2-Person Families | 490 (49.4%) | $59,783 |
| 3-Person Families | 190 (19.2%) | $73,000 |
| 4-Person Families | 139 (14.0%) | $79,760 |
| 5-Person Families | 131 (13.2%) | $250,001 |
| 6-Person Families | 42 (4.2%) | $0 |
| 7+ Person Families | 0 (0.0%) | $0 |
| Total | 992 (100.0%) | $75,147 |
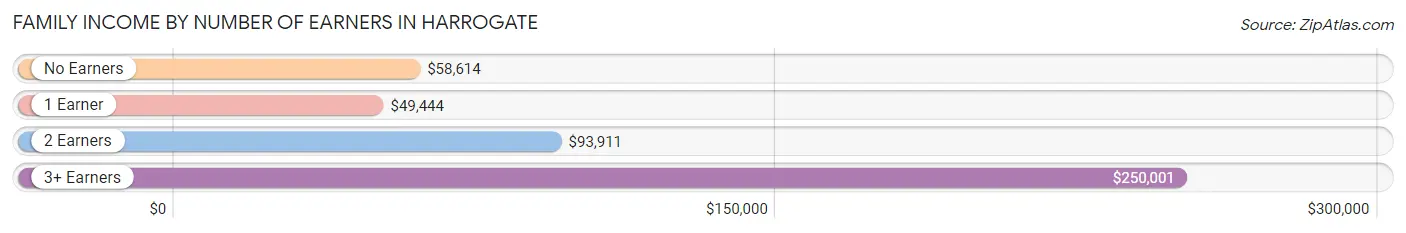
Family Income by Number of Earners in Harrogate
The median family income in Harrogate is $75,147, with families comprising 3+ earners (154) having the highest median family income of $250,001, while families with 1 earner (272) have the lowest median family income of $49,444, accounting for 15.5% and 27.4% of families, respectively.
| Number of Earners | # Families | Median Income |
| No Earners | 219 (22.1%) | $58,614 |
| 1 Earner | 272 (27.4%) | $49,444 |
| 2 Earners | 347 (35.0%) | $93,911 |
| 3+ Earners | 154 (15.5%) | $250,001 |
| Total | 992 (100.0%) | $75,147 |
Household Income in Harrogate
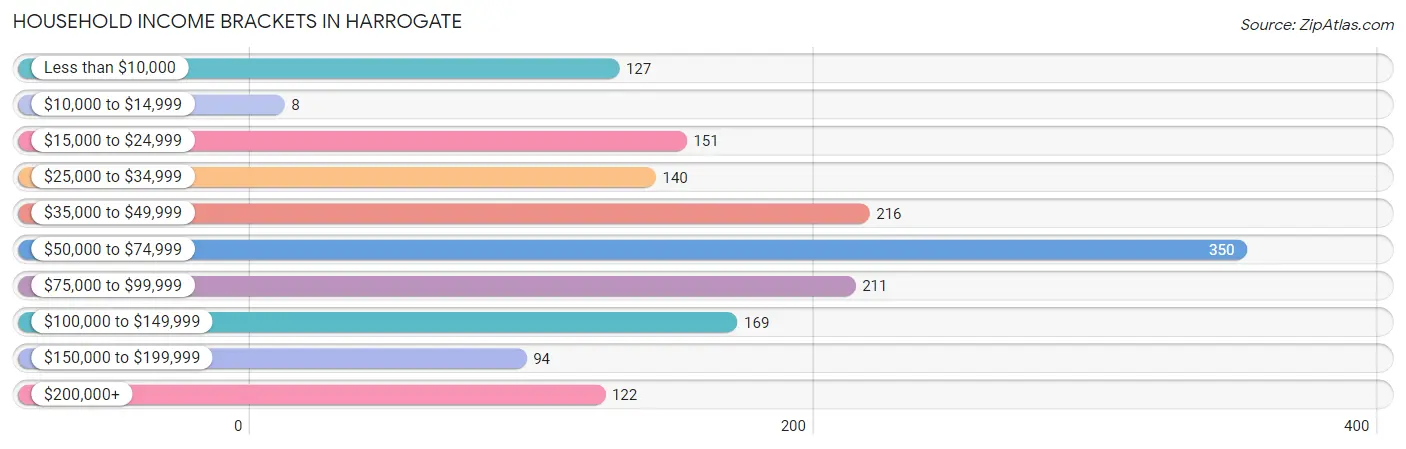
Household Income Brackets in Harrogate
With 350 households falling in the category, the $50,000 to $74,999 income range is the most frequent in Harrogate, accounting for 22.0% of all households. In contrast, only 8 households (0.5%) fall into the $10,000 to $14,999 income bracket, making it the least populous group.
| Income Bracket | # Households | % Households |
| Less than $10,000 | 127 | 8.0% |
| $10,000 to $14,999 | 8 | 0.5% |
| $15,000 to $24,999 | 151 | 9.5% |
| $25,000 to $34,999 | 140 | 8.8% |
| $35,000 to $49,999 | 216 | 13.6% |
| $50,000 to $74,999 | 350 | 22.0% |
| $75,000 to $99,999 | 211 | 13.3% |
| $100,000 to $149,999 | 169 | 10.6% |
| $150,000 to $199,999 | 94 | 5.9% |
| $200,000+ | 122 | 7.7% |
Household Income by Householder Age in Harrogate
The median household income in Harrogate is $60,025, with the highest median household income of $89,583 found in the 25 to 44 years age bracket for the primary householder. A total of 401 households (25.2%) fall into this category. Meanwhile, the 15 to 24 years age bracket for the primary householder has the lowest median household income of $0, with 58 households (3.6%) in this group.
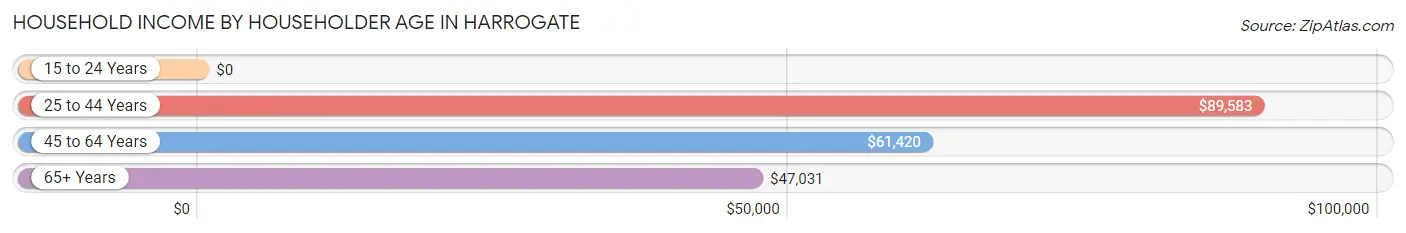
| Income Bracket | # Households | Median Income |
| 15 to 24 Years | 58 (3.6%) | $0 |
| 25 to 44 Years | 401 (25.2%) | $89,583 |
| 45 to 64 Years | 577 (36.3%) | $61,420 |
| 65+ Years | 554 (34.8%) | $47,031 |
| Total | 1,590 (100.0%) | $60,025 |
Poverty in Harrogate
Income Below Poverty by Sex and Age in Harrogate
With 7.5% poverty level for males and 12.4% for females among the residents of Harrogate, 16 and 17 year old males and 15 year old females are the most vulnerable to poverty, with 10 males (37.0%) and 9 females (36.0%) in their respective age groups living below the poverty level.
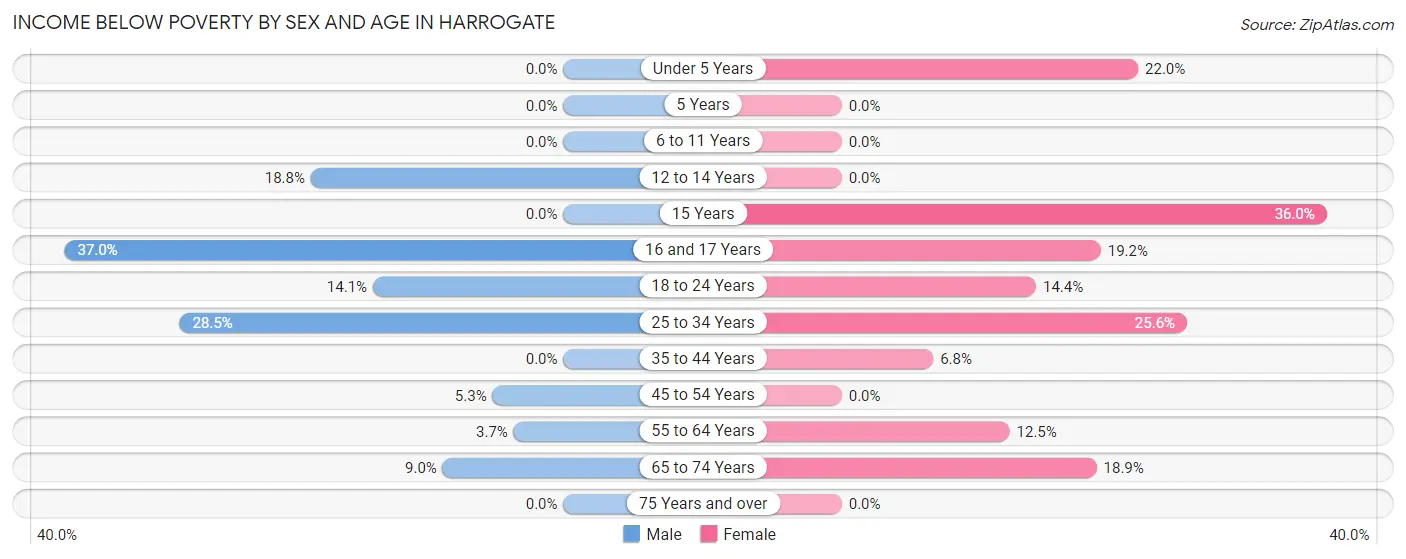
| Age Bracket | Male | Female |
| Under 5 Years | 0 (0.0%) | 22 (22.0%) |
| 5 Years | 0 (0.0%) | 0 (0.0%) |
| 6 to 11 Years | 0 (0.0%) | 0 (0.0%) |
| 12 to 14 Years | 9 (18.8%) | 0 (0.0%) |
| 15 Years | 0 (0.0%) | 9 (36.0%) |
| 16 and 17 Years | 10 (37.0%) | 10 (19.2%) |
| 18 to 24 Years | 14 (14.1%) | 31 (14.4%) |
| 25 to 34 Years | 59 (28.5%) | 41 (25.6%) |
| 35 to 44 Years | 0 (0.0%) | 18 (6.8%) |
| 45 to 54 Years | 8 (5.3%) | 0 (0.0%) |
| 55 to 64 Years | 17 (3.7%) | 38 (12.5%) |
| 65 to 74 Years | 18 (9.0%) | 56 (18.9%) |
| 75 Years and over | 0 (0.0%) | 0 (0.0%) |
| Total | 135 (7.5%) | 225 (12.4%) |
Income Above Poverty by Sex and Age in Harrogate
According to the poverty statistics in Harrogate, males aged under 5 years and females aged 6 to 11 years are the age groups that are most secure financially, with 100.0% of males and 100.0% of females in these age groups living above the poverty line.
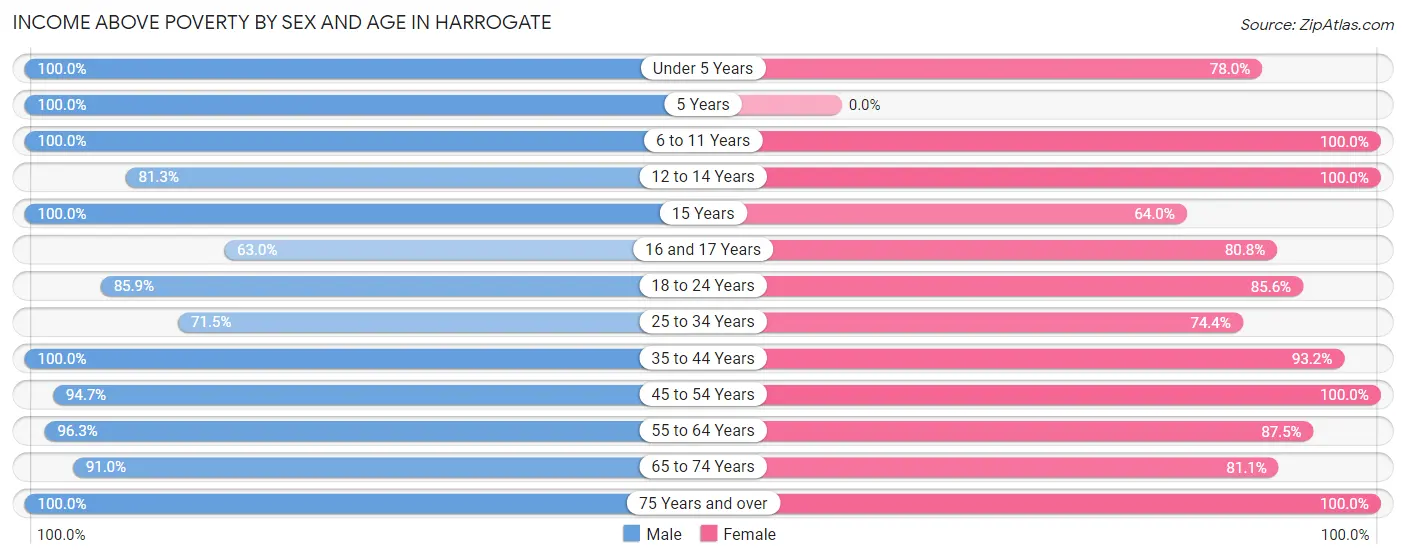
| Age Bracket | Male | Female |
| Under 5 Years | 115 (100.0%) | 78 (78.0%) |
| 5 Years | 28 (100.0%) | 0 (0.0%) |
| 6 to 11 Years | 122 (100.0%) | 18 (100.0%) |
| 12 to 14 Years | 39 (81.2%) | 1 (100.0%) |
| 15 Years | 17 (100.0%) | 16 (64.0%) |
| 16 and 17 Years | 17 (63.0%) | 42 (80.8%) |
| 18 to 24 Years | 85 (85.9%) | 184 (85.6%) |
| 25 to 34 Years | 148 (71.5%) | 119 (74.4%) |
| 35 to 44 Years | 142 (100.0%) | 247 (93.2%) |
| 45 to 54 Years | 144 (94.7%) | 261 (100.0%) |
| 55 to 64 Years | 444 (96.3%) | 267 (87.5%) |
| 65 to 74 Years | 183 (91.0%) | 240 (81.1%) |
| 75 Years and over | 186 (100.0%) | 119 (100.0%) |
| Total | 1,670 (92.5%) | 1,592 (87.6%) |
Income Below Poverty Among Married-Couple Families in Harrogate
The poverty statistics for married-couple families in Harrogate show that 2.4% or 20 of the total 830 families live below the poverty line. Families with 1 or 2 children have the highest poverty rate of 2.7%, comprising of 8 families. On the other hand, families with 3 or 4 children have the lowest poverty rate of 0.0%, which includes 0 families.
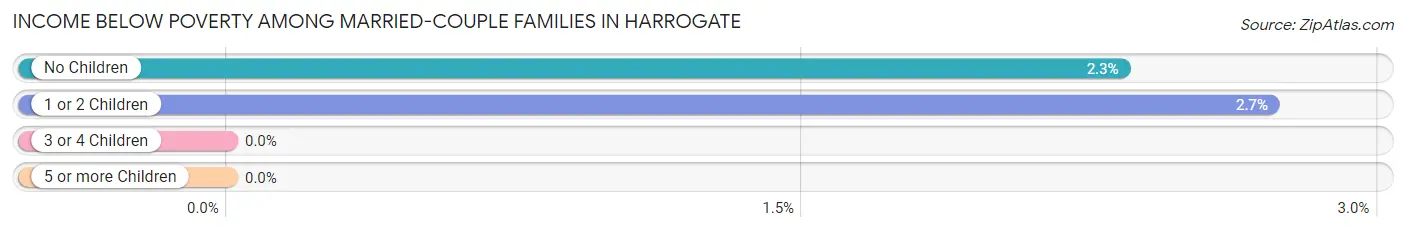
| Children | Above Poverty | Below Poverty |
| No Children | 504 (97.7%) | 12 (2.3%) |
| 1 or 2 Children | 286 (97.3%) | 8 (2.7%) |
| 3 or 4 Children | 20 (100.0%) | 0 (0.0%) |
| 5 or more Children | 0 (0.0%) | 0 (0.0%) |
| Total | 810 (97.6%) | 20 (2.4%) |
Income Below Poverty Among Single-Parent Households in Harrogate
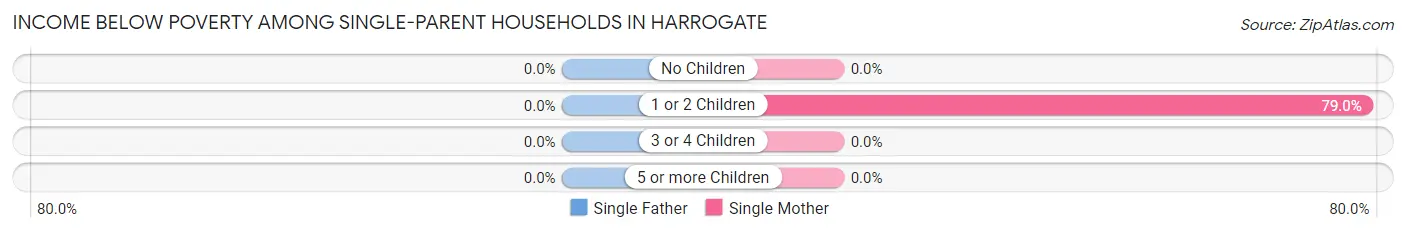
| Children | Single Father | Single Mother |
| No Children | 0 (0.0%) | 0 (0.0%) |
| 1 or 2 Children | 0 (0.0%) | 30 (78.9%) |
| 3 or 4 Children | 0 (0.0%) | 0 (0.0%) |
| 5 or more Children | 0 (0.0%) | 0 (0.0%) |
| Total | 0 (0.0%) | 30 (33.7%) |
Income Below Poverty Among Married-Couple vs Single-Parent Households in Harrogate
The poverty data for Harrogate shows that 20 of the married-couple family households (2.4%) and 30 of the single-parent households (18.5%) are living below the poverty level. Within the married-couple family households, those with 1 or 2 children have the highest poverty rate, with 8 households (2.7%) falling below the poverty line. Among the single-parent households, those with 1 or 2 children have the highest poverty rate, with 30 household (32.6%) living below poverty.
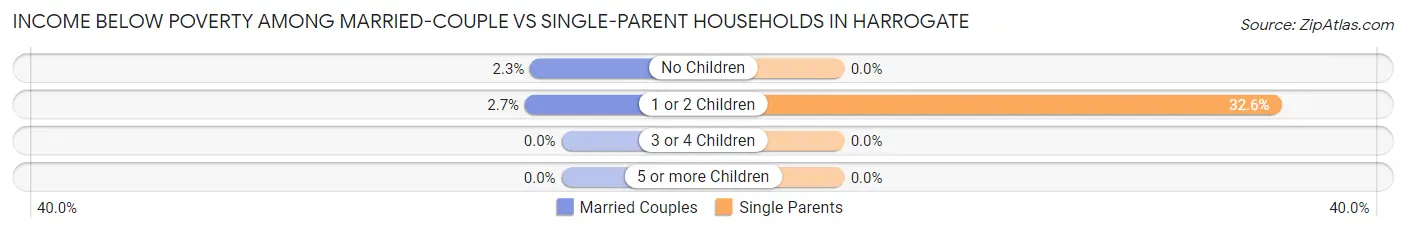
| Children | Married-Couple Families | Single-Parent Households |
| No Children | 12 (2.3%) | 0 (0.0%) |
| 1 or 2 Children | 8 (2.7%) | 30 (32.6%) |
| 3 or 4 Children | 0 (0.0%) | 0 (0.0%) |
| 5 or more Children | 0 (0.0%) | 0 (0.0%) |
| Total | 20 (2.4%) | 30 (18.5%) |
Race in Harrogate
The most populous races in Harrogate are White / Caucasian (4,110 | 94.0%), Asian (96 | 2.2%), and Two or more Races (96 | 2.2%).
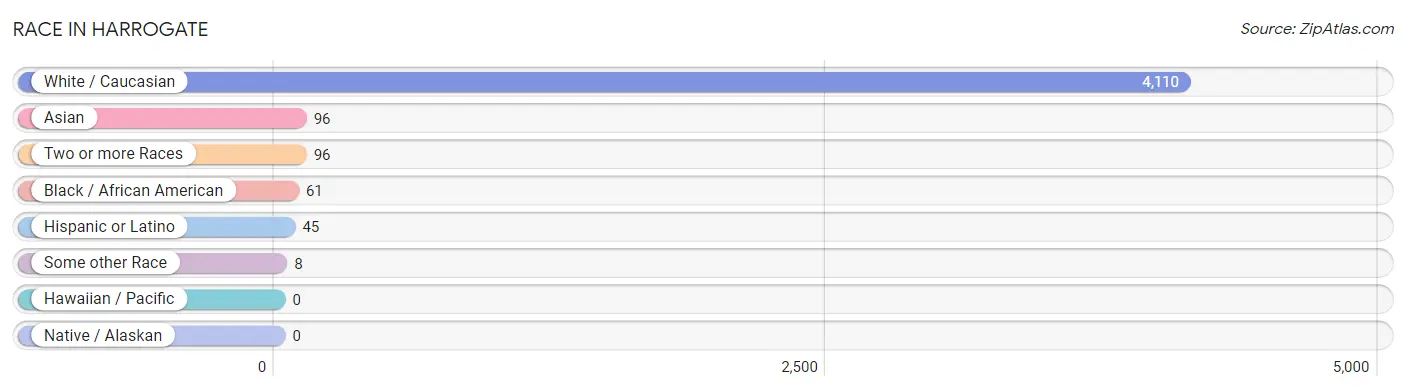
| Race | # Population | % Population |
| Asian | 96 | 2.2% |
| Black / African American | 61 | 1.4% |
| Hawaiian / Pacific | 0 | 0.0% |
| Hispanic or Latino | 45 | 1.0% |
| Native / Alaskan | 0 | 0.0% |
| White / Caucasian | 4,110 | 94.0% |
| Two or more Races | 96 | 2.2% |
| Some other Race | 8 | 0.2% |
| Total | 4,371 | 100.0% |
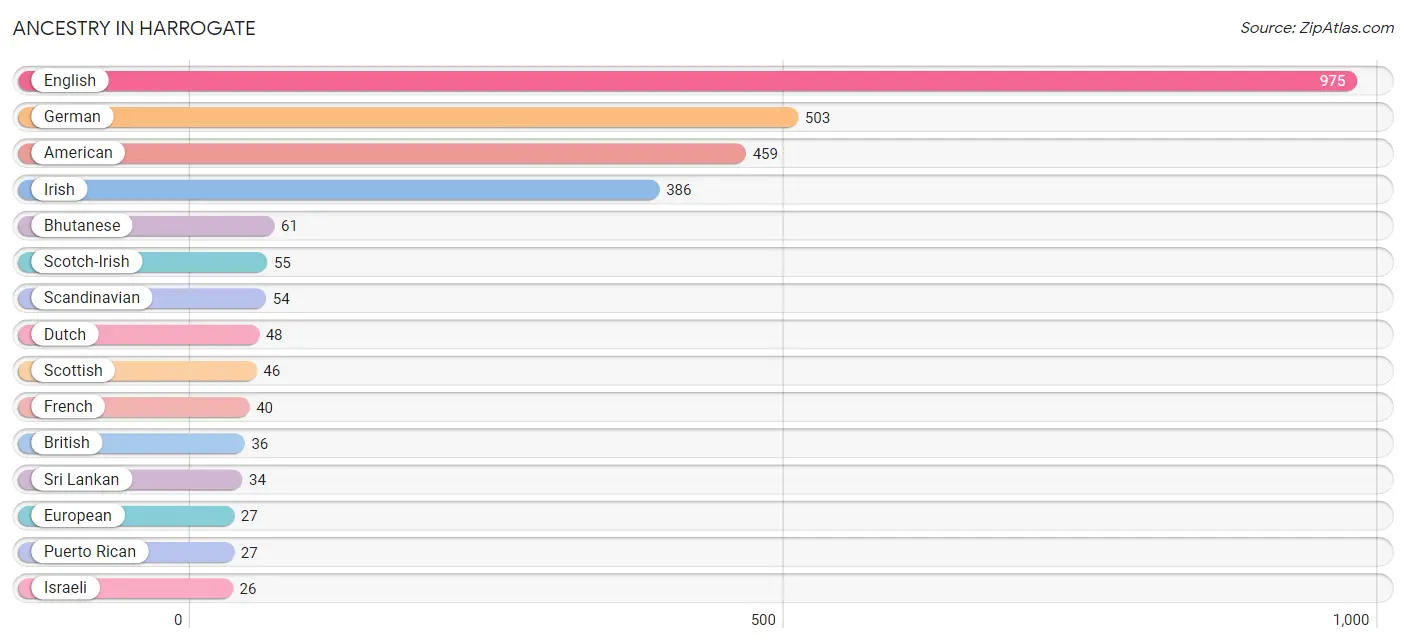
Ancestry in Harrogate
The most populous ancestries reported in Harrogate are English (975 | 22.3%), German (503 | 11.5%), American (459 | 10.5%), Irish (386 | 8.8%), and Bhutanese (61 | 1.4%), together accounting for 54.5% of all Harrogate residents.
| Ancestry | # Population | % Population |
| American | 459 | 10.5% |
| Armenian | 2 | 0.1% |
| Belgian | 10 | 0.2% |
| Bhutanese | 61 | 1.4% |
| British | 36 | 0.8% |
| Burmese | 7 | 0.2% |
| Canadian | 24 | 0.5% |
| Chilean | 9 | 0.2% |
| Chippewa | 1 | 0.0% |
| Colombian | 3 | 0.1% |
| Croatian | 9 | 0.2% |
| Dutch | 48 | 1.1% |
| Dutch West Indian | 8 | 0.2% |
| English | 975 | 22.3% |
| European | 27 | 0.6% |
| French | 40 | 0.9% |
| German | 503 | 11.5% |
| Greek | 15 | 0.3% |
| Guyanese | 1 | 0.0% |
| Irish | 386 | 8.8% |
| Israeli | 26 | 0.6% |
| Korean | 23 | 0.5% |
| Mexican | 4 | 0.1% |
| Norwegian | 20 | 0.5% |
| Polish | 25 | 0.6% |
| Puerto Rican | 27 | 0.6% |
| Scandinavian | 54 | 1.2% |
| Scotch-Irish | 55 | 1.3% |
| Scottish | 46 | 1.1% |
| South American | 12 | 0.3% |
| Spaniard | 2 | 0.1% |
| Sri Lankan | 34 | 0.8% |
| Swedish | 25 | 0.6% |
| Thai | 5 | 0.1% |
| Welsh | 20 | 0.5% | View All 35 Rows |
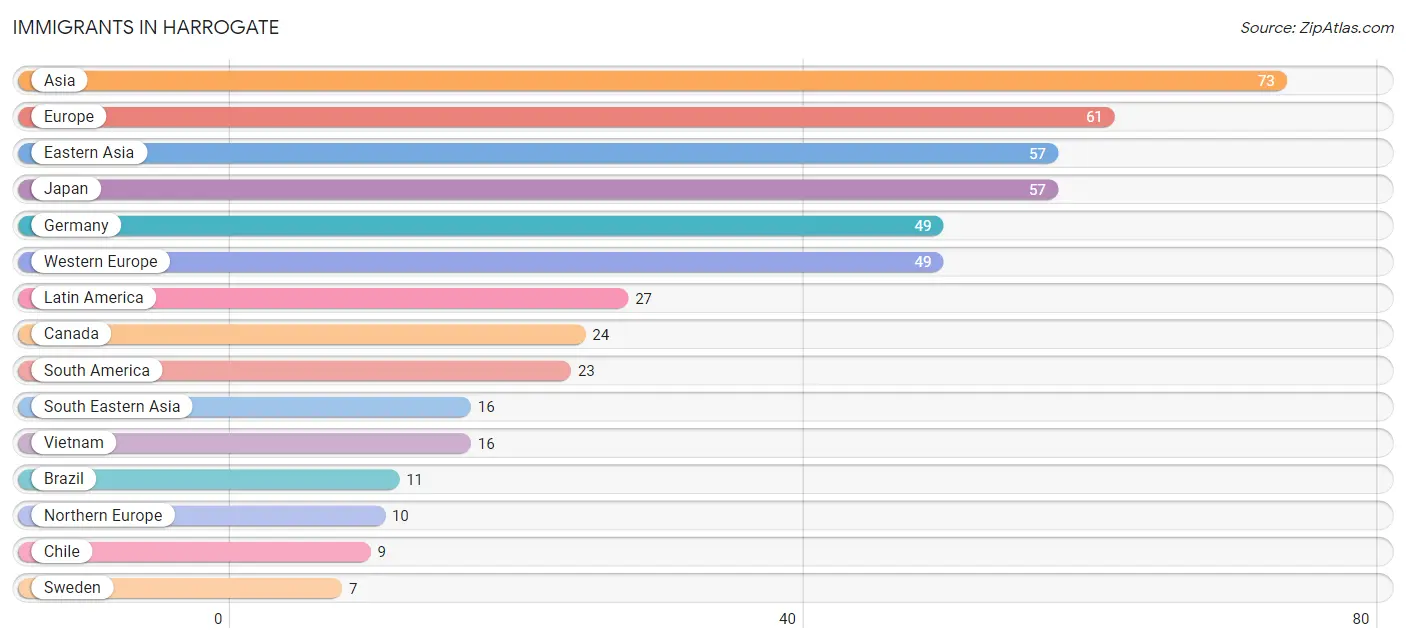
Immigrants in Harrogate
The most numerous immigrant groups reported in Harrogate came from Asia (73 | 1.7%), Europe (61 | 1.4%), Eastern Asia (57 | 1.3%), Japan (57 | 1.3%), and Germany (49 | 1.1%), together accounting for 6.8% of all Harrogate residents.
| Immigration Origin | # Population | % Population |
| Asia | 73 | 1.7% |
| Brazil | 11 | 0.3% |
| Canada | 24 | 0.5% |
| Central America | 4 | 0.1% |
| Chile | 9 | 0.2% |
| Colombia | 3 | 0.1% |
| Eastern Asia | 57 | 1.3% |
| Europe | 61 | 1.4% |
| Germany | 49 | 1.1% |
| Japan | 57 | 1.3% |
| Latin America | 27 | 0.6% |
| Mexico | 4 | 0.1% |
| Northern Europe | 10 | 0.2% |
| South America | 23 | 0.5% |
| South Eastern Asia | 16 | 0.4% |
| Southern Europe | 2 | 0.1% |
| Spain | 2 | 0.1% |
| Sweden | 7 | 0.2% |
| Vietnam | 16 | 0.4% |
| Western Europe | 49 | 1.1% | View All 20 Rows |
Sex and Age in Harrogate
Sex and Age in Harrogate
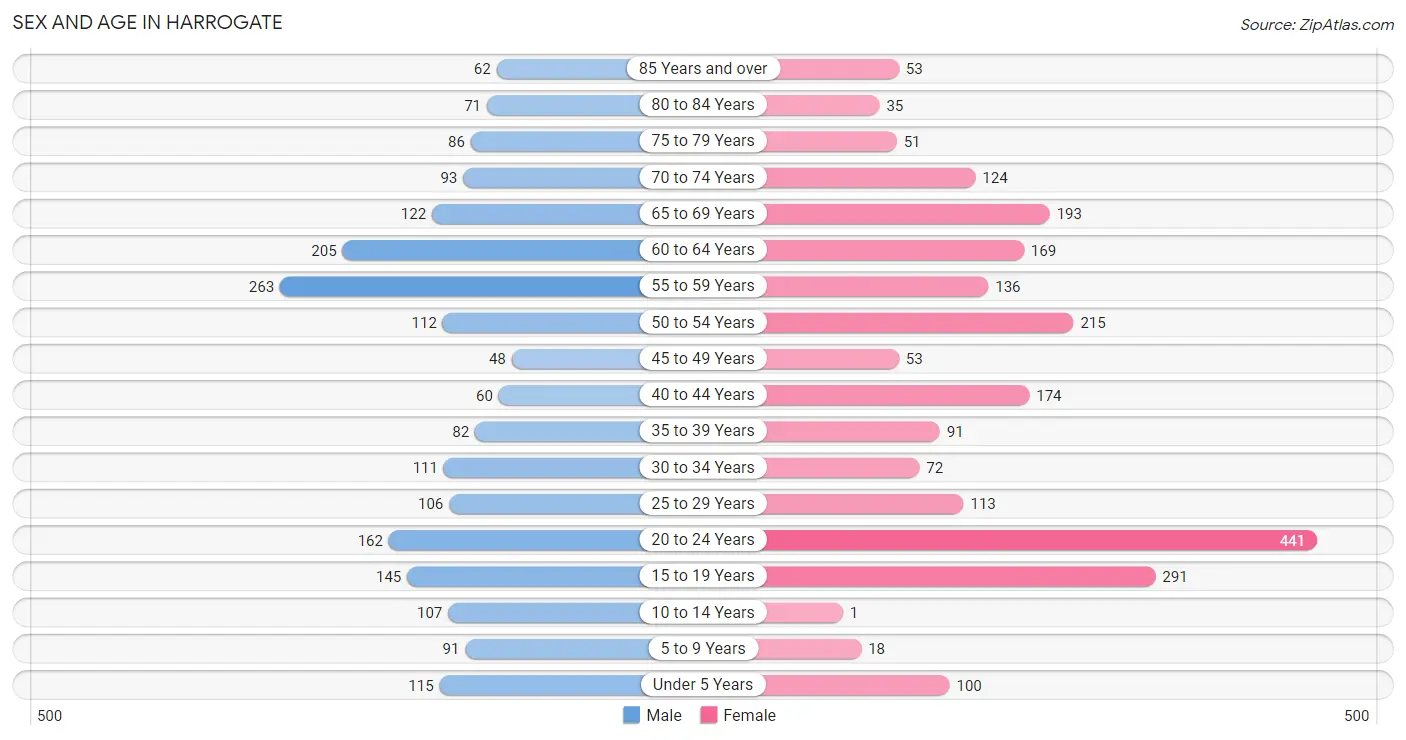
The most populous age groups in Harrogate are 55 to 59 Years (263 | 12.9%) for men and 20 to 24 Years (441 | 18.9%) for women.
| Age Bracket | Male | Female |
| Under 5 Years | 115 (5.6%) | 100 (4.3%) |
| 5 to 9 Years | 91 (4.5%) | 18 (0.8%) |
| 10 to 14 Years | 107 (5.2%) | 1 (0.0%) |
| 15 to 19 Years | 145 (7.1%) | 291 (12.5%) |
| 20 to 24 Years | 162 (7.9%) | 441 (18.9%) |
| 25 to 29 Years | 106 (5.2%) | 113 (4.9%) |
| 30 to 34 Years | 111 (5.4%) | 72 (3.1%) |
| 35 to 39 Years | 82 (4.0%) | 91 (3.9%) |
| 40 to 44 Years | 60 (2.9%) | 174 (7.5%) |
| 45 to 49 Years | 48 (2.4%) | 53 (2.3%) |
| 50 to 54 Years | 112 (5.5%) | 215 (9.2%) |
| 55 to 59 Years | 263 (12.9%) | 136 (5.8%) |
| 60 to 64 Years | 205 (10.0%) | 169 (7.2%) |
| 65 to 69 Years | 122 (6.0%) | 193 (8.3%) |
| 70 to 74 Years | 93 (4.6%) | 124 (5.3%) |
| 75 to 79 Years | 86 (4.2%) | 51 (2.2%) |
| 80 to 84 Years | 71 (3.5%) | 35 (1.5%) |
| 85 Years and over | 62 (3.0%) | 53 (2.3%) |
| Total | 2,041 (100.0%) | 2,330 (100.0%) |
Families and Households in Harrogate
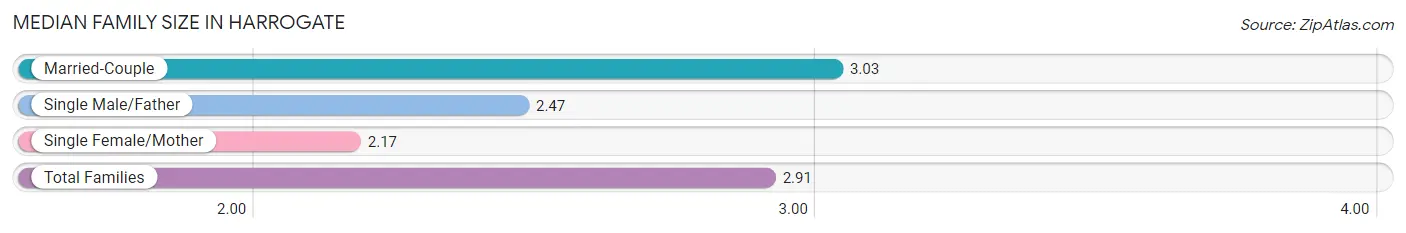
Median Family Size in Harrogate
The median family size in Harrogate is 2.91 persons per family, with married-couple families (830 | 83.7%) accounting for the largest median family size of 3.03 persons per family. On the other hand, single female/mother families (89 | 9.0%) represent the smallest median family size with 2.17 persons per family.
| Family Type | # Families | Family Size |
| Married-Couple | 830 (83.7%) | 3.03 |
| Single Male/Father | 73 (7.4%) | 2.47 |
| Single Female/Mother | 89 (9.0%) | 2.17 |
| Total Families | 992 (100.0%) | 2.91 |
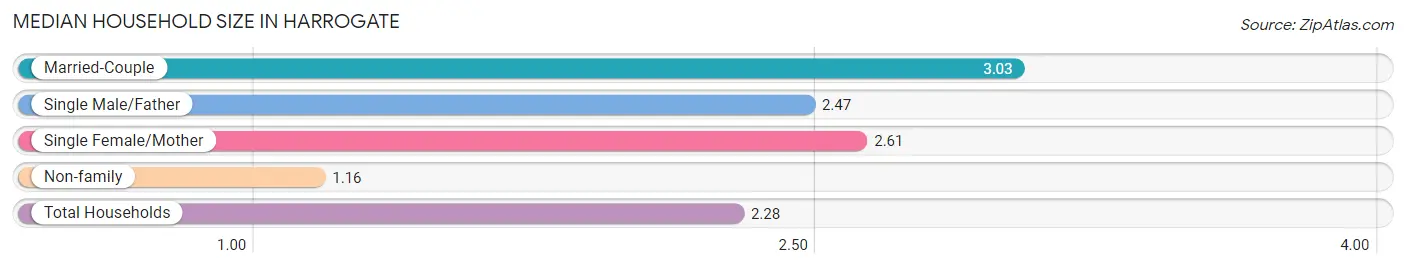
Median Household Size in Harrogate
The median household size in Harrogate is 2.28 persons per household, with married-couple households (830 | 52.2%) accounting for the largest median household size of 3.03 persons per household. non-family households (598 | 37.6%) represent the smallest median household size with 1.16 persons per household.
| Household Type | # Households | Household Size |
| Married-Couple | 830 (52.2%) | 3.03 |
| Single Male/Father | 73 (4.6%) | 2.47 |
| Single Female/Mother | 89 (5.6%) | 2.61 |
| Non-family | 598 (37.6%) | 1.16 |
| Total Households | 1,590 (100.0%) | 2.28 |
Household Size by Marriage Status in Harrogate
Out of a total of 1,590 households in Harrogate, 992 (62.4%) are family households, while 598 (37.6%) are nonfamily households. The most numerous type of family households are 2-person households, comprising 464, and the most common type of nonfamily households are 1-person households, comprising 520.
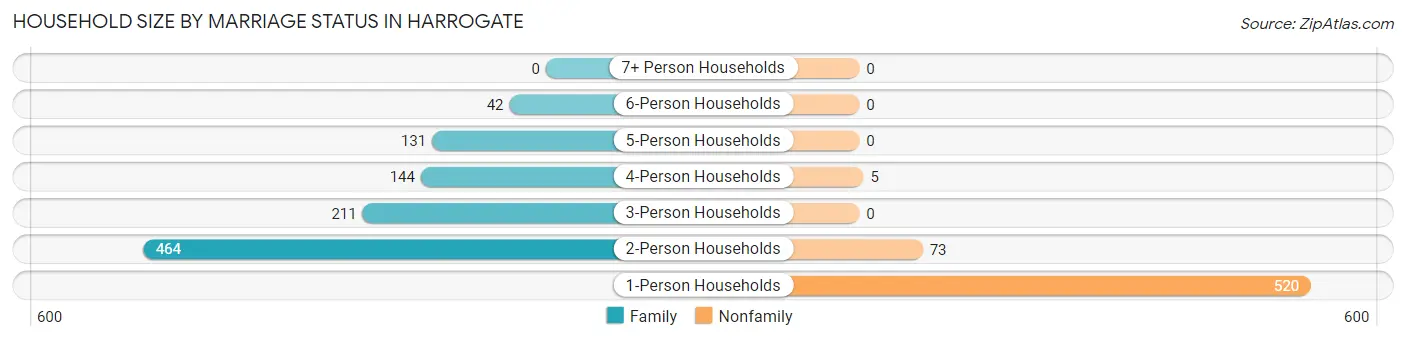
| Household Size | Family Households | Nonfamily Households |
| 1-Person Households | - | 520 (32.7%) |
| 2-Person Households | 464 (29.2%) | 73 (4.6%) |
| 3-Person Households | 211 (13.3%) | 0 (0.0%) |
| 4-Person Households | 144 (9.1%) | 5 (0.3%) |
| 5-Person Households | 131 (8.2%) | 0 (0.0%) |
| 6-Person Households | 42 (2.6%) | 0 (0.0%) |
| 7+ Person Households | 0 (0.0%) | 0 (0.0%) |
| Total | 992 (62.4%) | 598 (37.6%) |
Female Fertility in Harrogate
Fertility by Age in Harrogate
Average fertility rate in Harrogate is 7.0 births per 1,000 women. Women in the age bracket of 20 to 34 years have the highest fertility rate with 14.0 births per 1,000 women. Women in the age bracket of 20 to 34 years acount for 100.0% of all women with births.
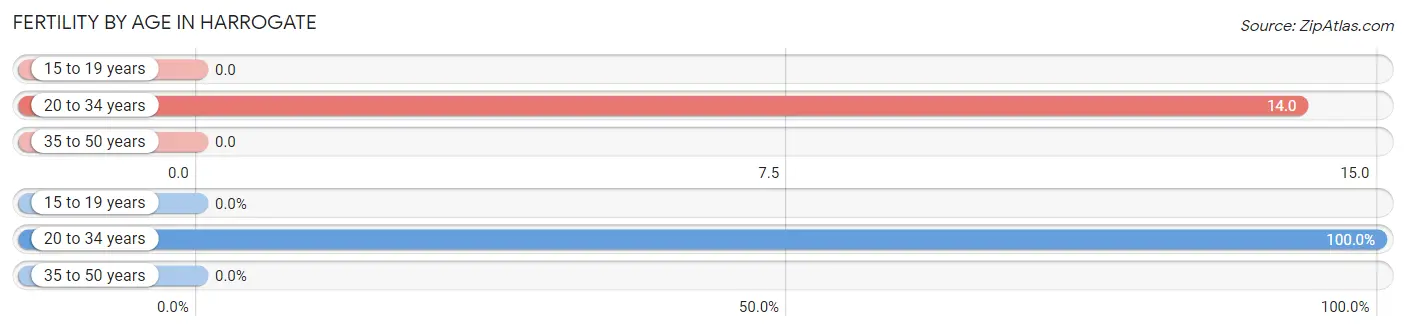
| Age Bracket | Women with Births | Births / 1,000 Women |
| 15 to 19 years | 0 (0.0%) | 0.0 |
| 20 to 34 years | 9 (100.0%) | 14.0 |
| 35 to 50 years | 0 (0.0%) | 0.0 |
| Total | 9 (100.0%) | 7.0 |
Fertility by Age by Marriage Status in Harrogate
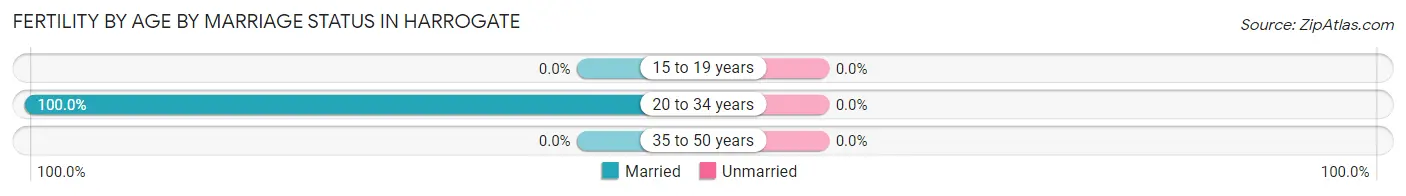
| Age Bracket | Married | Unmarried |
| 15 to 19 years | 0 (0.0%) | 0 (0.0%) |
| 20 to 34 years | 9 (100.0%) | 0 (0.0%) |
| 35 to 50 years | 0 (0.0%) | 0 (0.0%) |
| Total | 9 (100.0%) | 0 (0.0%) |
Fertility by Education in Harrogate
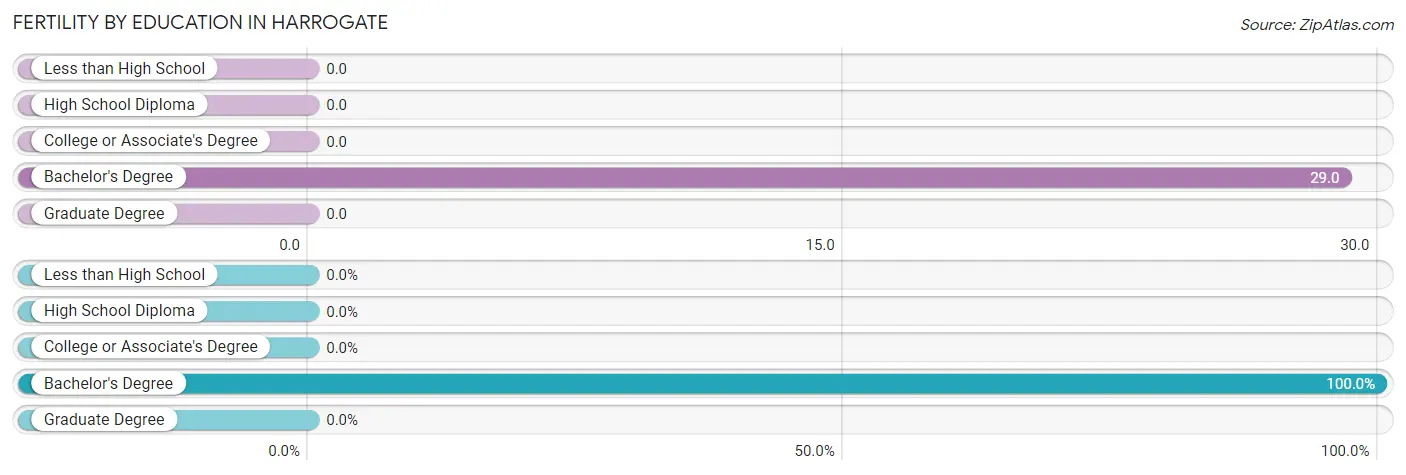
| Educational Attainment | Women with Births | Births / 1,000 Women |
| Less than High School | 0 (0.0%) | 0.0 |
| High School Diploma | 0 (0.0%) | 0.0 |
| College or Associate's Degree | 0 (0.0%) | 0.0 |
| Bachelor's Degree | 9 (100.0%) | 29.0 |
| Graduate Degree | 0 (0.0%) | 0.0 |
| Total | 9 (100.0%) | 7.0 |
Fertility by Education by Marriage Status in Harrogate
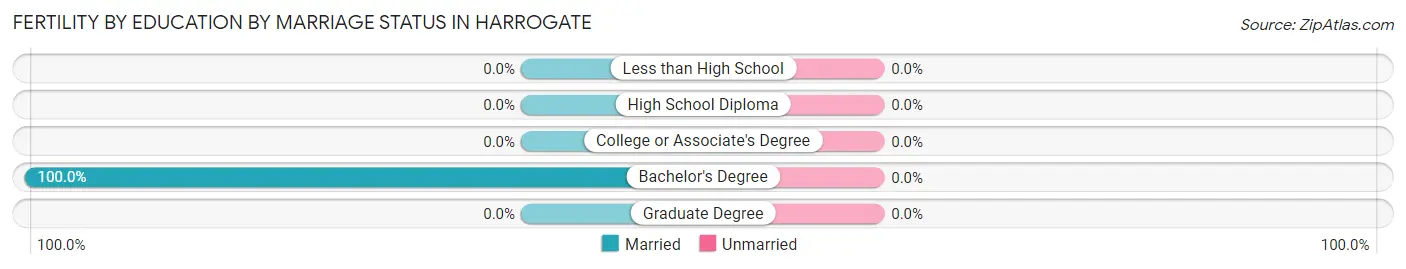
| Educational Attainment | Married | Unmarried |
| Less than High School | 0 (0.0%) | 0 (0.0%) |
| High School Diploma | 0 (0.0%) | 0 (0.0%) |
| College or Associate's Degree | 0 (0.0%) | 0 (0.0%) |
| Bachelor's Degree | 9 (100.0%) | 0 (0.0%) |
| Graduate Degree | 0 (0.0%) | 0 (0.0%) |
| Total | 9 (100.0%) | 0 (0.0%) |
Employment Characteristics in Harrogate
Employment by Class of Employer in Harrogate
Among the 1,843 employed individuals in Harrogate, private company employees (1,274 | 69.1%), not-for-profit organizations (278 | 15.1%), and state government employees (87 | 4.7%) make up the most common classes of employment.
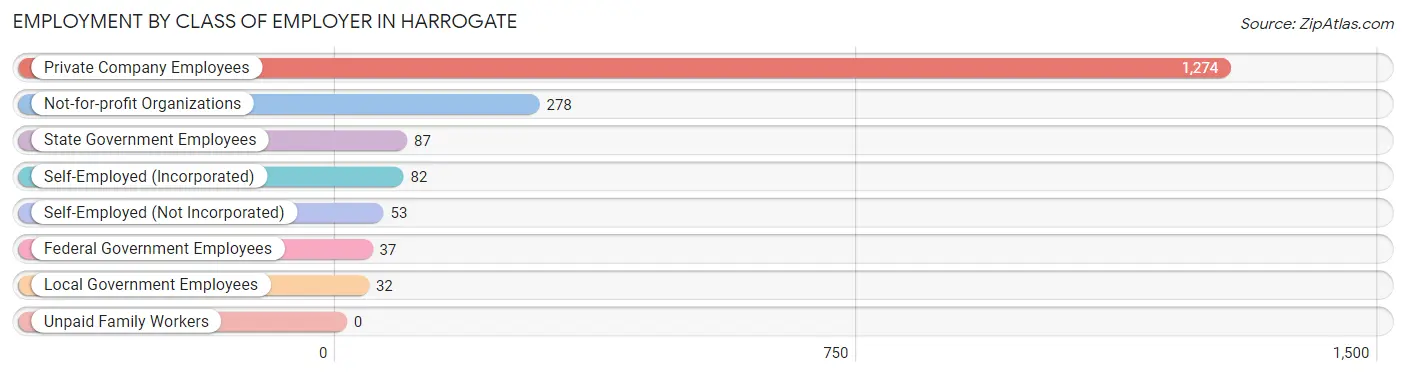
| Employer Class | # Employees | % Employees |
| Private Company Employees | 1,274 | 69.1% |
| Self-Employed (Incorporated) | 82 | 4.4% |
| Self-Employed (Not Incorporated) | 53 | 2.9% |
| Not-for-profit Organizations | 278 | 15.1% |
| Local Government Employees | 32 | 1.7% |
| State Government Employees | 87 | 4.7% |
| Federal Government Employees | 37 | 2.0% |
| Unpaid Family Workers | 0 | 0.0% |
| Total | 1,843 | 100.0% |
Employment Status by Age in Harrogate
According to the labor force statistics for Harrogate, out of the total population over 16 years of age (3,897), 49.8% or 1,941 individuals are in the labor force, with 2.9% or 56 of them unemployed. The age group with the highest labor force participation rate is 30 to 34 years, with 88.0% or 161 individuals in the labor force. Within the labor force, the 25 to 29 years age range has the highest percentage of unemployed individuals, with 19.8% or 17 of them being unemployed.
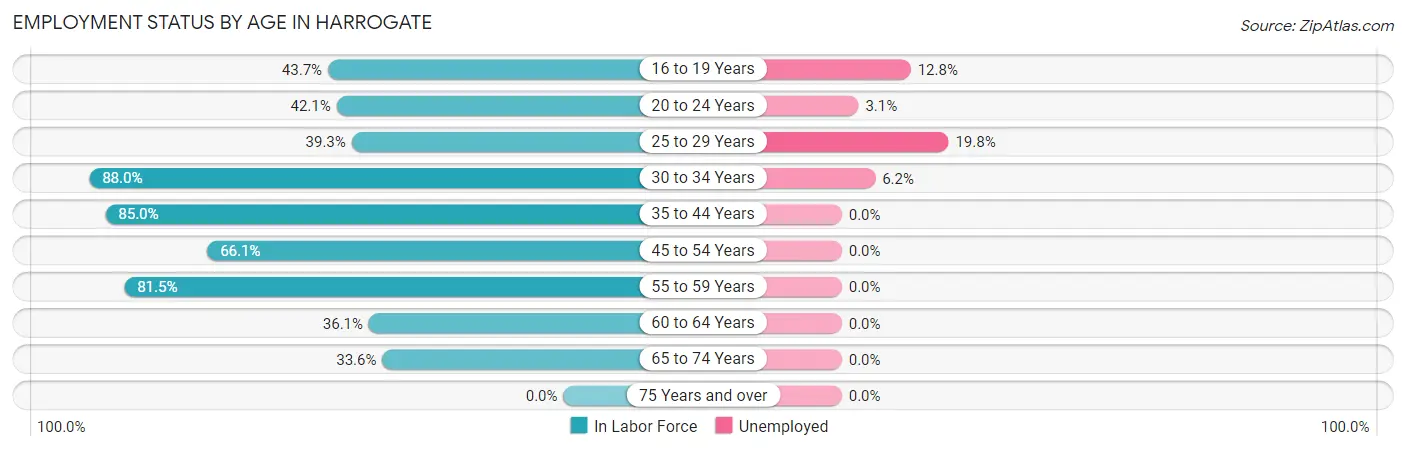
| Age Bracket | In Labor Force | Unemployed |
| 16 to 19 Years | 172 (43.7%) | 22 (12.8%) |
| 20 to 24 Years | 254 (42.1%) | 8 (3.1%) |
| 25 to 29 Years | 86 (39.3%) | 17 (19.8%) |
| 30 to 34 Years | 161 (88.0%) | 10 (6.2%) |
| 35 to 44 Years | 346 (85.0%) | 0 (0.0%) |
| 45 to 54 Years | 283 (66.1%) | 0 (0.0%) |
| 55 to 59 Years | 325 (81.5%) | 0 (0.0%) |
| 60 to 64 Years | 135 (36.1%) | 0 (0.0%) |
| 65 to 74 Years | 179 (33.6%) | 0 (0.0%) |
| 75 Years and over | 0 (0.0%) | 0 (0.0%) |
| Total | 1,941 (49.8%) | 56 (2.9%) |
Employment Status by Educational Attainment in Harrogate
According to labor force statistics for Harrogate, 66.5% of individuals (1,337) out of the total population between 25 and 64 years of age (2,010) are in the labor force, with 2.0% or 27 of them being unemployed. The group with the highest labor force participation rate are those with the educational attainment of college / associate degree, with 69.4% or 333 individuals in the labor force. Within the labor force, individuals with high school diploma education have the highest percentage of unemployment, with 6.0% or 27 of them being unemployed.
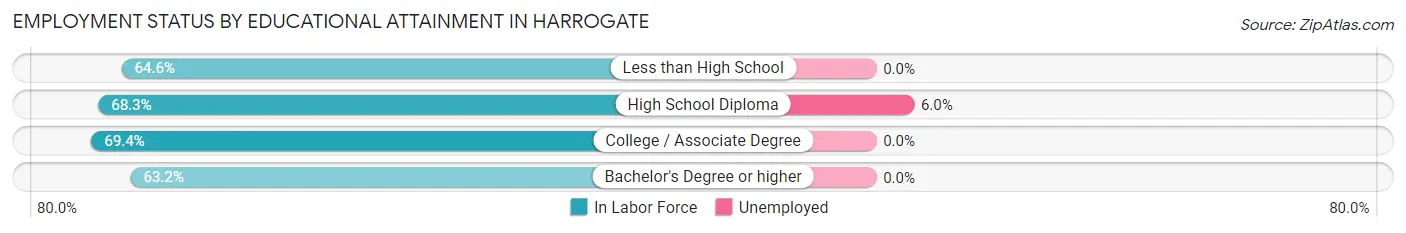
| Educational Attainment | In Labor Force | Unemployed |
| Less than High School | 82 (64.6%) | 0 (0.0%) |
| High School Diploma | 453 (68.3%) | 40 (6.0%) |
| College / Associate Degree | 333 (69.4%) | 0 (0.0%) |
| Bachelor's Degree or higher | 468 (63.2%) | 0 (0.0%) |
| Total | 1,337 (66.5%) | 40 (2.0%) |
Employment Occupations by Sex in Harrogate
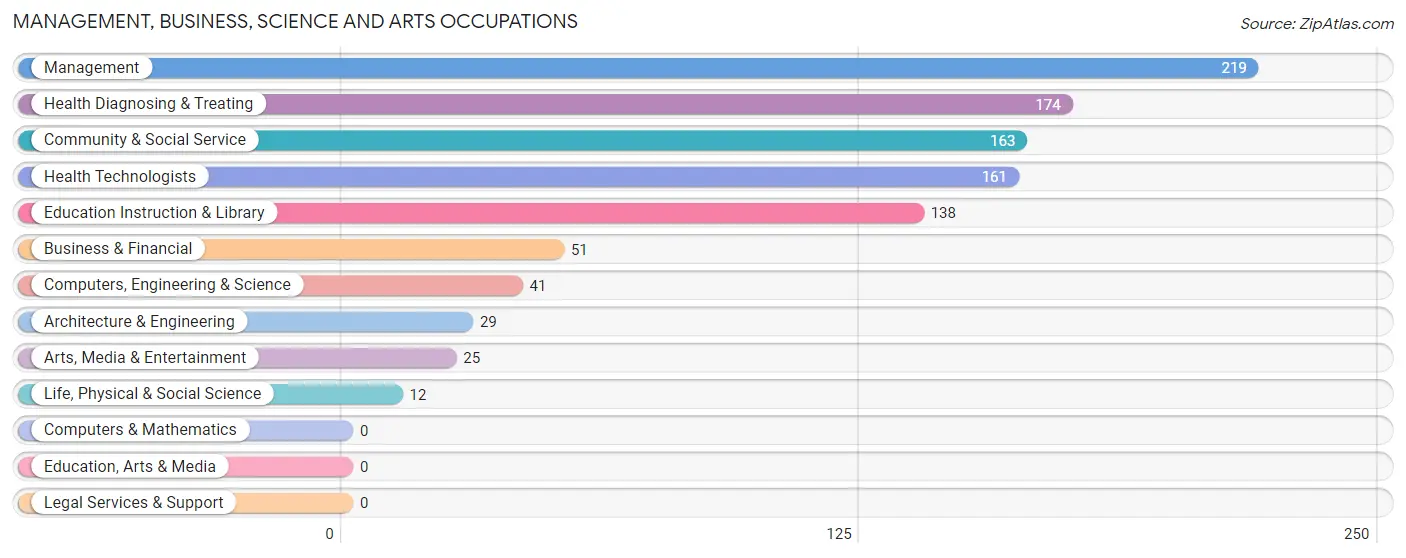
Management, Business, Science and Arts Occupations
The most common Management, Business, Science and Arts occupations in Harrogate are Management (219 | 11.6%), Health Diagnosing & Treating (174 | 9.2%), Community & Social Service (163 | 8.6%), Health Technologists (161 | 8.6%), and Education Instruction & Library (138 | 7.3%).
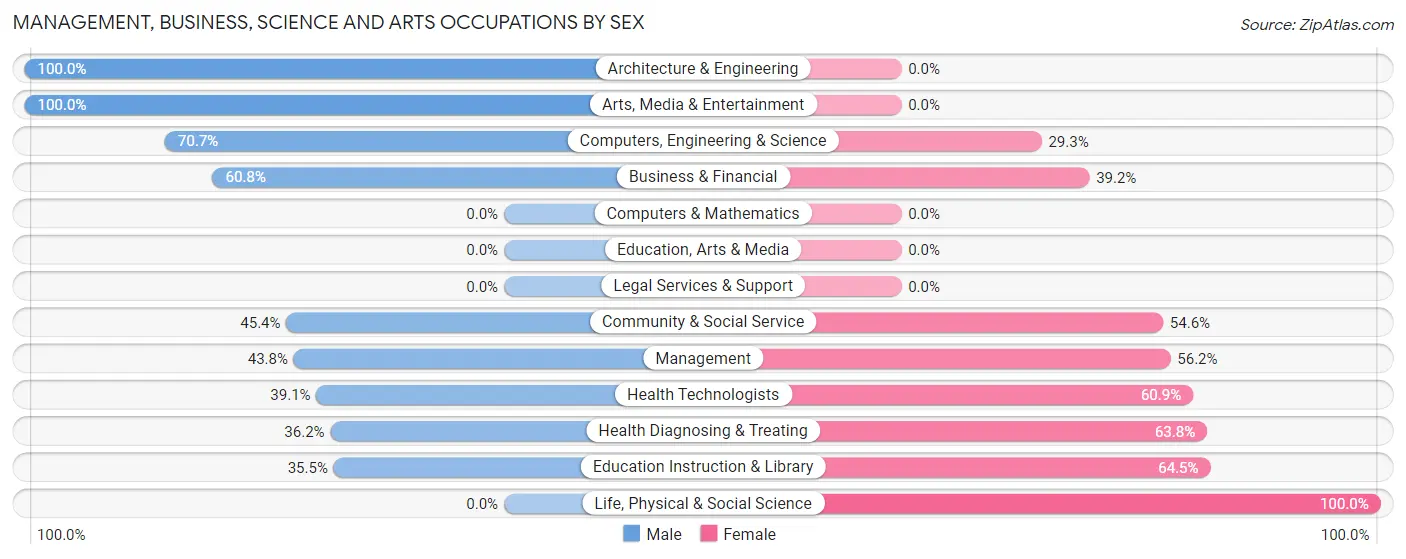
Management, Business, Science and Arts Occupations by Sex
Within the Management, Business, Science and Arts occupations in Harrogate, the most male-oriented occupations are Architecture & Engineering (100.0%), Arts, Media & Entertainment (100.0%), and Computers, Engineering & Science (70.7%), while the most female-oriented occupations are Life, Physical & Social Science (100.0%), Education Instruction & Library (64.5%), and Health Diagnosing & Treating (63.8%).
| Occupation | Male | Female |
| Management | 96 (43.8%) | 123 (56.2%) |
| Business & Financial | 31 (60.8%) | 20 (39.2%) |
| Computers, Engineering & Science | 29 (70.7%) | 12 (29.3%) |
| Computers & Mathematics | 0 (0.0%) | 0 (0.0%) |
| Architecture & Engineering | 29 (100.0%) | 0 (0.0%) |
| Life, Physical & Social Science | 0 (0.0%) | 12 (100.0%) |
| Community & Social Service | 74 (45.4%) | 89 (54.6%) |
| Education, Arts & Media | 0 (0.0%) | 0 (0.0%) |
| Legal Services & Support | 0 (0.0%) | 0 (0.0%) |
| Education Instruction & Library | 49 (35.5%) | 89 (64.5%) |
| Arts, Media & Entertainment | 25 (100.0%) | 0 (0.0%) |
| Health Diagnosing & Treating | 63 (36.2%) | 111 (63.8%) |
| Health Technologists | 63 (39.1%) | 98 (60.9%) |
| Total (Category) | 293 (45.2%) | 355 (54.8%) |
| Total (Overall) | 819 (43.5%) | 1,065 (56.5%) |
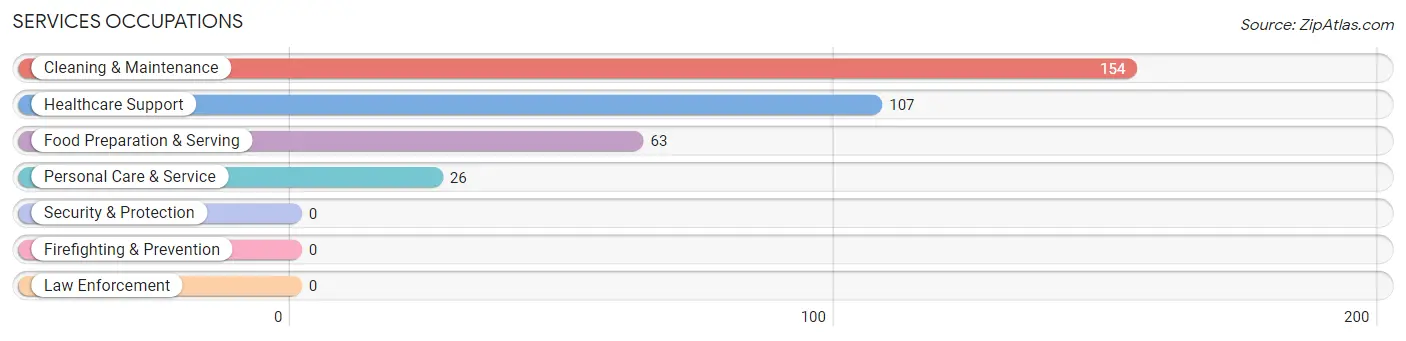
Services Occupations
The most common Services occupations in Harrogate are Cleaning & Maintenance (154 | 8.2%), Healthcare Support (107 | 5.7%), Food Preparation & Serving (63 | 3.3%), and Personal Care & Service (26 | 1.4%).
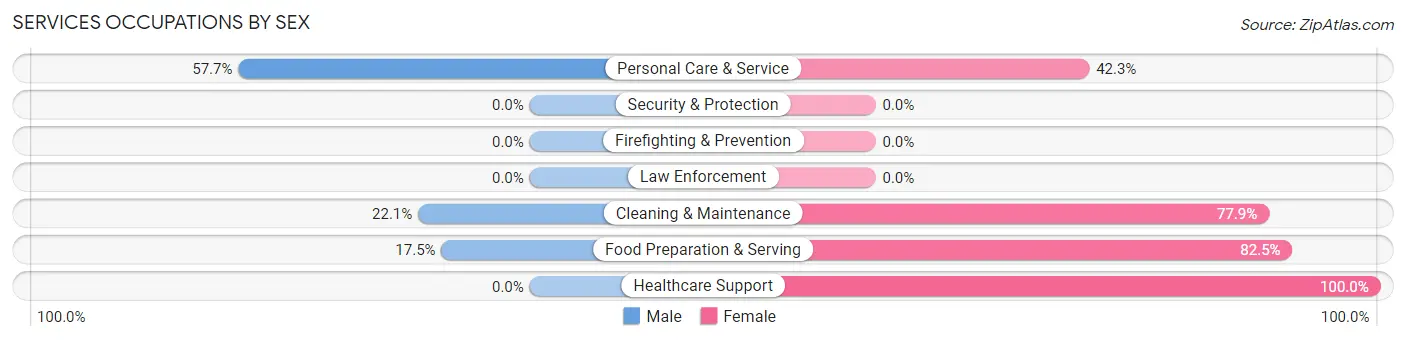
Services Occupations by Sex
Within the Services occupations in Harrogate, the most male-oriented occupations are Personal Care & Service (57.7%), Cleaning & Maintenance (22.1%), and Food Preparation & Serving (17.5%), while the most female-oriented occupations are Healthcare Support (100.0%), Food Preparation & Serving (82.5%), and Cleaning & Maintenance (77.9%).
| Occupation | Male | Female |
| Healthcare Support | 0 (0.0%) | 107 (100.0%) |
| Security & Protection | 0 (0.0%) | 0 (0.0%) |
| Firefighting & Prevention | 0 (0.0%) | 0 (0.0%) |
| Law Enforcement | 0 (0.0%) | 0 (0.0%) |
| Food Preparation & Serving | 11 (17.5%) | 52 (82.5%) |
| Cleaning & Maintenance | 34 (22.1%) | 120 (77.9%) |
| Personal Care & Service | 15 (57.7%) | 11 (42.3%) |
| Total (Category) | 60 (17.1%) | 290 (82.9%) |
| Total (Overall) | 819 (43.5%) | 1,065 (56.5%) |
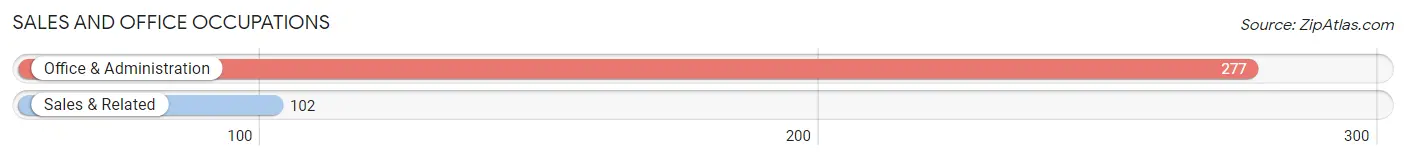
Sales and Office Occupations
The most common Sales and Office occupations in Harrogate are Office & Administration (277 | 14.7%), and Sales & Related (102 | 5.4%).
Sales and Office Occupations by Sex
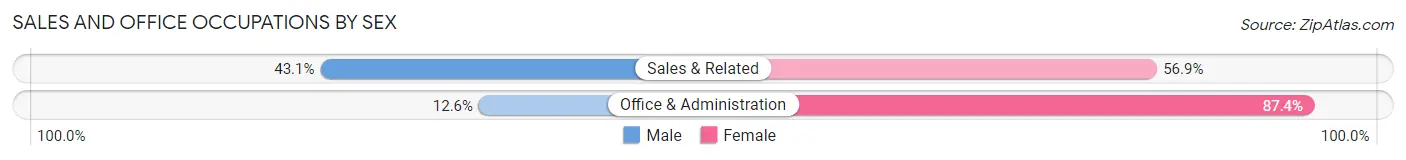
| Occupation | Male | Female |
| Sales & Related | 44 (43.1%) | 58 (56.9%) |
| Office & Administration | 35 (12.6%) | 242 (87.4%) |
| Total (Category) | 79 (20.8%) | 300 (79.2%) |
| Total (Overall) | 819 (43.5%) | 1,065 (56.5%) |
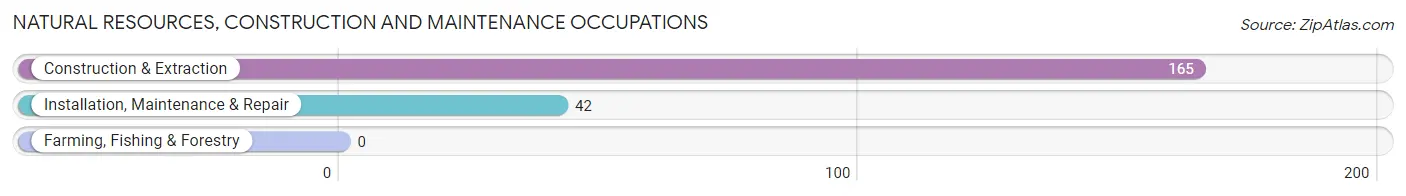
Natural Resources, Construction and Maintenance Occupations
The most common Natural Resources, Construction and Maintenance occupations in Harrogate are Construction & Extraction (165 | 8.8%), and Installation, Maintenance & Repair (42 | 2.2%).
Natural Resources, Construction and Maintenance Occupations by Sex
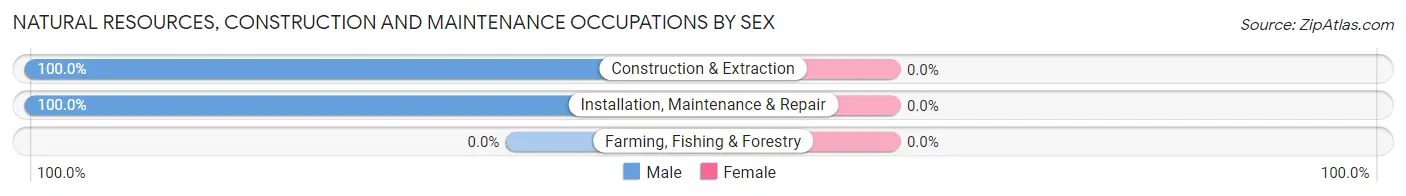
| Occupation | Male | Female |
| Farming, Fishing & Forestry | 0 (0.0%) | 0 (0.0%) |
| Construction & Extraction | 165 (100.0%) | 0 (0.0%) |
| Installation, Maintenance & Repair | 42 (100.0%) | 0 (0.0%) |
| Total (Category) | 207 (100.0%) | 0 (0.0%) |
| Total (Overall) | 819 (43.5%) | 1,065 (56.5%) |
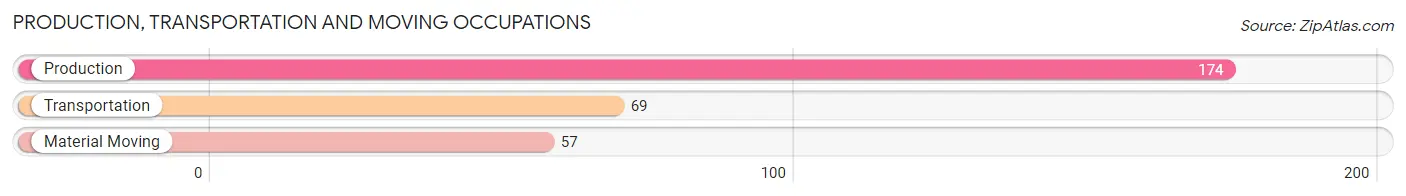
Production, Transportation and Moving Occupations
The most common Production, Transportation and Moving occupations in Harrogate are Production (174 | 9.2%), Transportation (69 | 3.7%), and Material Moving (57 | 3.0%).
Production, Transportation and Moving Occupations by Sex
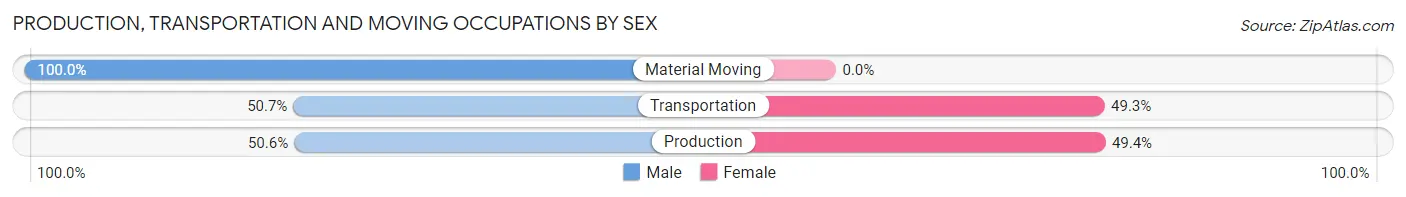
| Occupation | Male | Female |
| Production | 88 (50.6%) | 86 (49.4%) |
| Transportation | 35 (50.7%) | 34 (49.3%) |
| Material Moving | 57 (100.0%) | 0 (0.0%) |
| Total (Category) | 180 (60.0%) | 120 (40.0%) |
| Total (Overall) | 819 (43.5%) | 1,065 (56.5%) |
Employment Industries by Sex in Harrogate
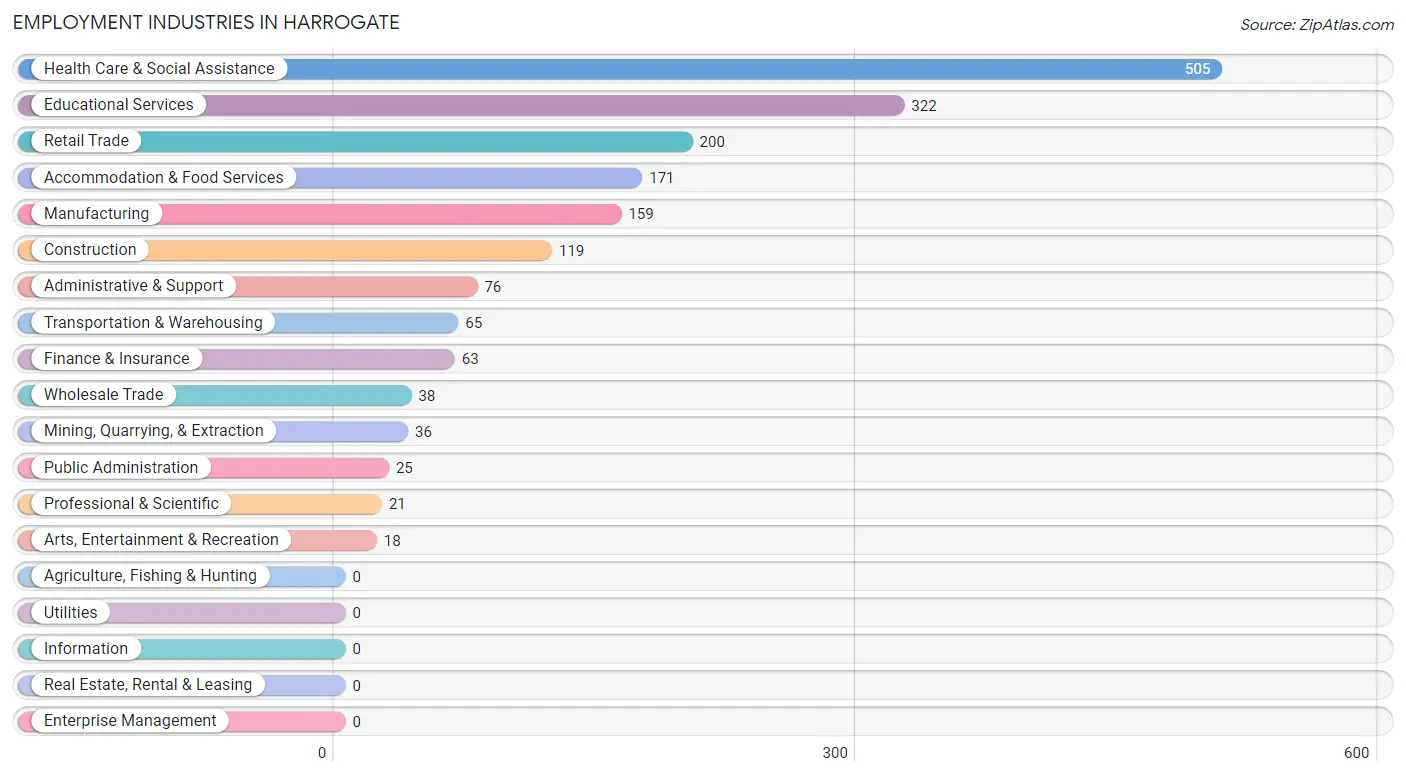
Employment Industries in Harrogate
The major employment industries in Harrogate include Health Care & Social Assistance (505 | 26.8%), Educational Services (322 | 17.1%), Retail Trade (200 | 10.6%), Accommodation & Food Services (171 | 9.1%), and Manufacturing (159 | 8.4%).
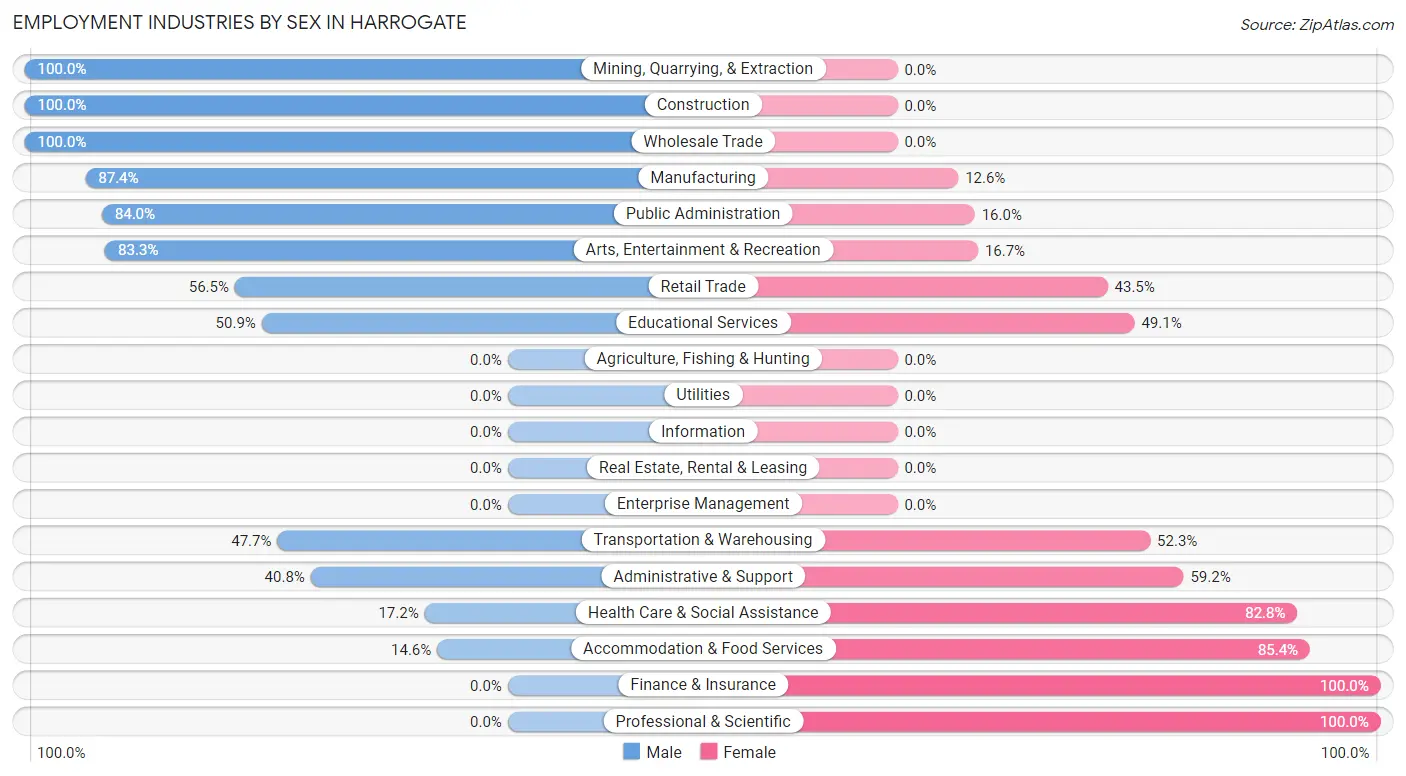
Employment Industries by Sex in Harrogate
The Harrogate industries that see more men than women are Mining, Quarrying, & Extraction (100.0%), Construction (100.0%), and Wholesale Trade (100.0%), whereas the industries that tend to have a higher number of women are Finance & Insurance (100.0%), Professional & Scientific (100.0%), and Accommodation & Food Services (85.4%).
| Industry | Male | Female |
| Agriculture, Fishing & Hunting | 0 (0.0%) | 0 (0.0%) |
| Mining, Quarrying, & Extraction | 36 (100.0%) | 0 (0.0%) |
| Construction | 119 (100.0%) | 0 (0.0%) |
| Manufacturing | 139 (87.4%) | 20 (12.6%) |
| Wholesale Trade | 38 (100.0%) | 0 (0.0%) |
| Retail Trade | 113 (56.5%) | 87 (43.5%) |
| Transportation & Warehousing | 31 (47.7%) | 34 (52.3%) |
| Utilities | 0 (0.0%) | 0 (0.0%) |
| Information | 0 (0.0%) | 0 (0.0%) |
| Finance & Insurance | 0 (0.0%) | 63 (100.0%) |
| Real Estate, Rental & Leasing | 0 (0.0%) | 0 (0.0%) |
| Professional & Scientific | 0 (0.0%) | 21 (100.0%) |
| Enterprise Management | 0 (0.0%) | 0 (0.0%) |
| Administrative & Support | 31 (40.8%) | 45 (59.2%) |
| Educational Services | 164 (50.9%) | 158 (49.1%) |
| Health Care & Social Assistance | 87 (17.2%) | 418 (82.8%) |
| Arts, Entertainment & Recreation | 15 (83.3%) | 3 (16.7%) |
| Accommodation & Food Services | 25 (14.6%) | 146 (85.4%) |
| Public Administration | 21 (84.0%) | 4 (16.0%) |
| Total | 819 (43.5%) | 1,065 (56.5%) |
Education in Harrogate
School Enrollment in Harrogate
The most common levels of schooling among the 1,302 students in Harrogate are college / undergraduate (749 | 57.5%), graduate / professional (201 | 15.4%), and high school (132 | 10.1%).
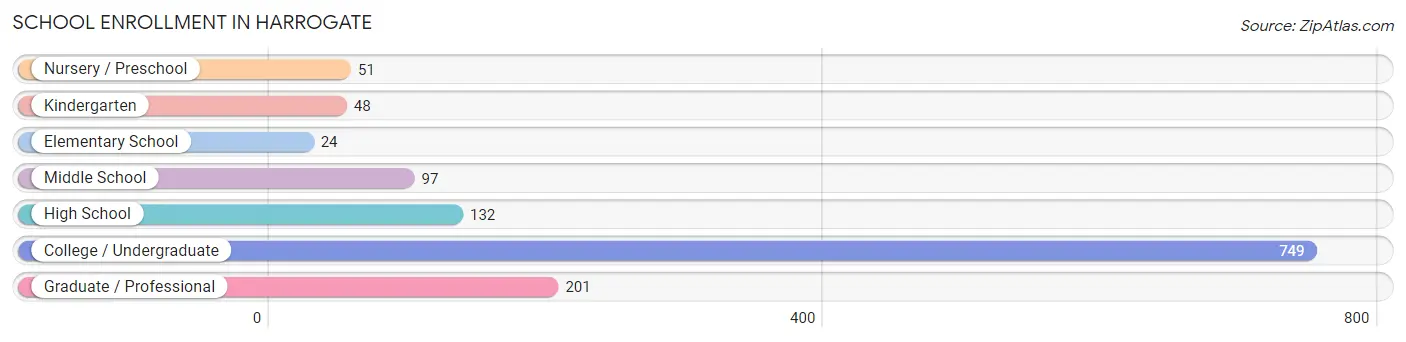
| School Level | # Students | % Students |
| Nursery / Preschool | 51 | 3.9% |
| Kindergarten | 48 | 3.7% |
| Elementary School | 24 | 1.8% |
| Middle School | 97 | 7.4% |
| High School | 132 | 10.1% |
| College / Undergraduate | 749 | 57.5% |
| Graduate / Professional | 201 | 15.4% |
| Total | 1,302 | 100.0% |
School Enrollment by Age by Funding Source in Harrogate
Out of a total of 1,302 students who are enrolled in schools in Harrogate, 697 (53.5%) attend a private institution, while the remaining 605 (46.5%) are enrolled in public schools. The age group of 25 to 34 year olds has the highest likelihood of being enrolled in private schools, with 124 (79.5% in the age bracket) enrolled. Conversely, the age group of 3 to 4 year olds has the lowest likelihood of being enrolled in a private school, with 51 (100.0% in the age bracket) attending a public institution.
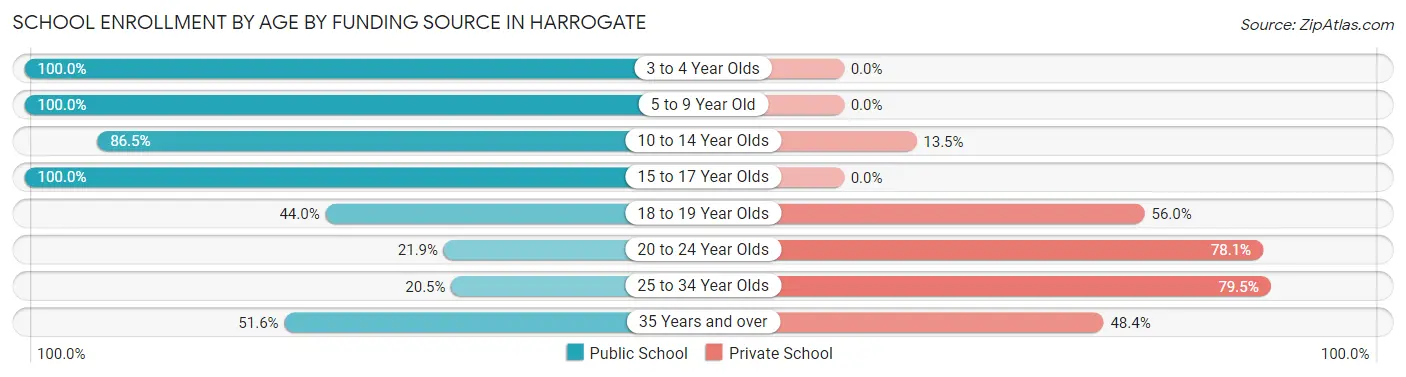
| Age Bracket | Public School | Private School |
| 3 to 4 Year Olds | 51 (100.0%) | 0 (0.0%) |
| 5 to 9 Year Old | 72 (100.0%) | 0 (0.0%) |
| 10 to 14 Year Olds | 83 (86.5%) | 13 (13.5%) |
| 15 to 17 Year Olds | 121 (100.0%) | 0 (0.0%) |
| 18 to 19 Year Olds | 120 (44.0%) | 153 (56.0%) |
| 20 to 24 Year Olds | 110 (21.9%) | 392 (78.1%) |
| 25 to 34 Year Olds | 32 (20.5%) | 124 (79.5%) |
| 35 Years and over | 16 (51.6%) | 15 (48.4%) |
| Total | 605 (46.5%) | 697 (53.5%) |
Educational Attainment by Field of Study in Harrogate
Education (224 | 21.4%), business (220 | 21.0%), bio, nature & agricultural (144 | 13.8%), science & technology (114 | 10.9%), and visual & performing arts (84 | 8.0%) are the most common fields of study among 1,045 individuals in Harrogate who have obtained a bachelor's degree or higher.
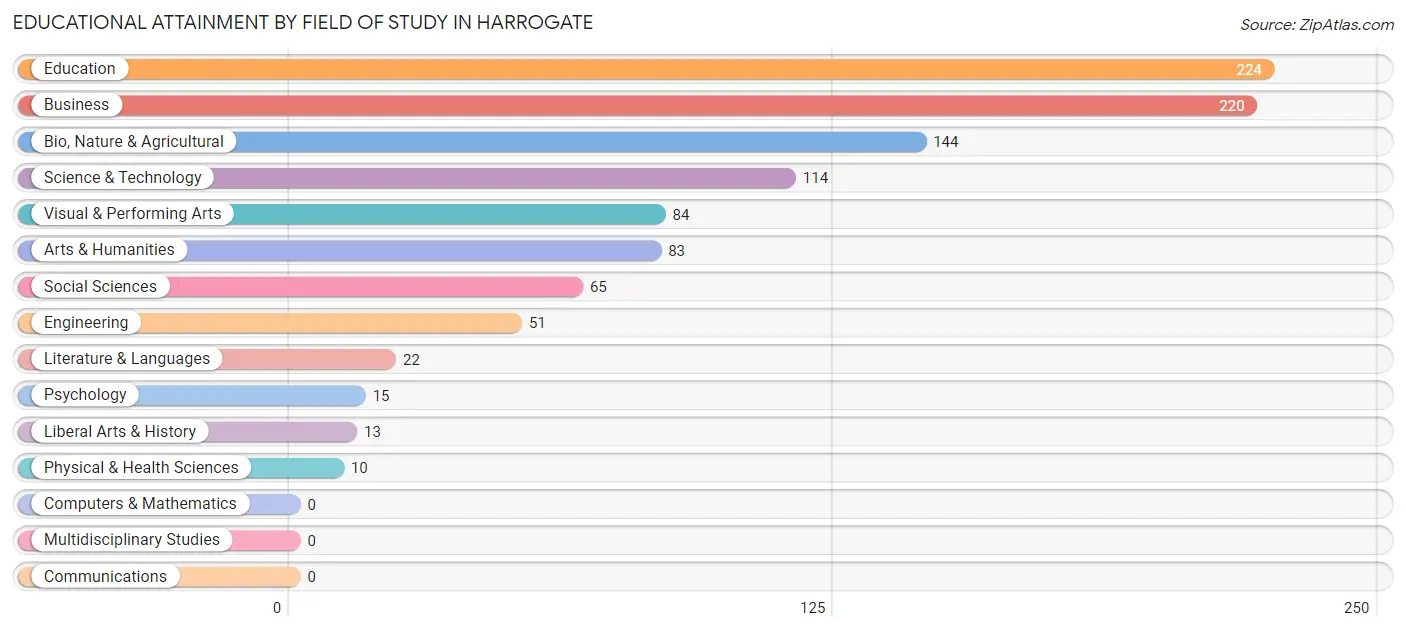
| Field of Study | # Graduates | % Graduates |
| Computers & Mathematics | 0 | 0.0% |
| Bio, Nature & Agricultural | 144 | 13.8% |
| Physical & Health Sciences | 10 | 1.0% |
| Psychology | 15 | 1.4% |
| Social Sciences | 65 | 6.2% |
| Engineering | 51 | 4.9% |
| Multidisciplinary Studies | 0 | 0.0% |
| Science & Technology | 114 | 10.9% |
| Business | 220 | 21.0% |
| Education | 224 | 21.4% |
| Literature & Languages | 22 | 2.1% |
| Liberal Arts & History | 13 | 1.2% |
| Visual & Performing Arts | 84 | 8.0% |
| Communications | 0 | 0.0% |
| Arts & Humanities | 83 | 7.9% |
| Total | 1,045 | 100.0% |
Transportation & Commute in Harrogate
Vehicle Availability by Sex in Harrogate
The most prevalent vehicle ownership categories in Harrogate are males with 2 vehicles (272, accounting for 34.1%) and females with 2 vehicles (224, making up 31.8%).
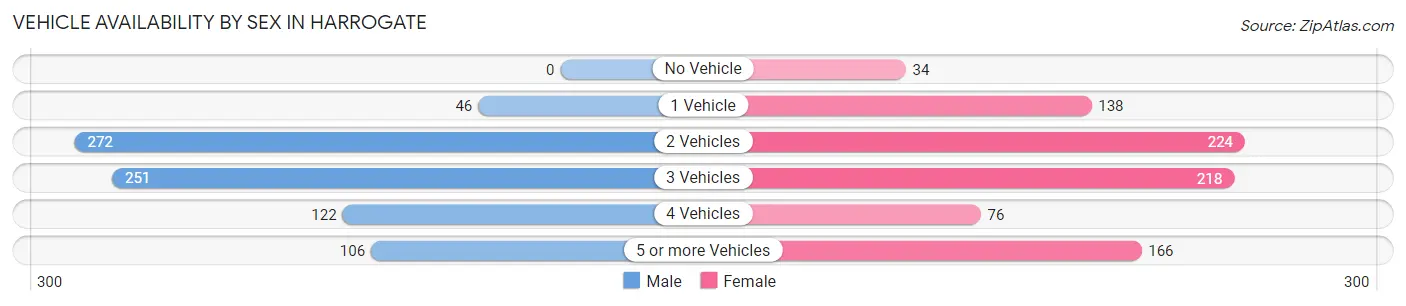
| Vehicles Available | Male | Female |
| No Vehicle | 0 (0.0%) | 34 (4.0%) |
| 1 Vehicle | 46 (5.8%) | 138 (16.1%) |
| 2 Vehicles | 272 (34.1%) | 224 (26.2%) |
| 3 Vehicles | 251 (31.5%) | 218 (25.5%) |
| 4 Vehicles | 122 (15.3%) | 76 (8.9%) |
| 5 or more Vehicles | 106 (13.3%) | 166 (19.4%) |
| Total | 797 (100.0%) | 856 (100.0%) |
Commute Time in Harrogate
The most frequently occuring commute durations in Harrogate are 15 to 19 minutes (342 commuters, 19.1%), 5 to 9 minutes (333 commuters, 18.5%), and 20 to 24 minutes (221 commuters, 12.3%).
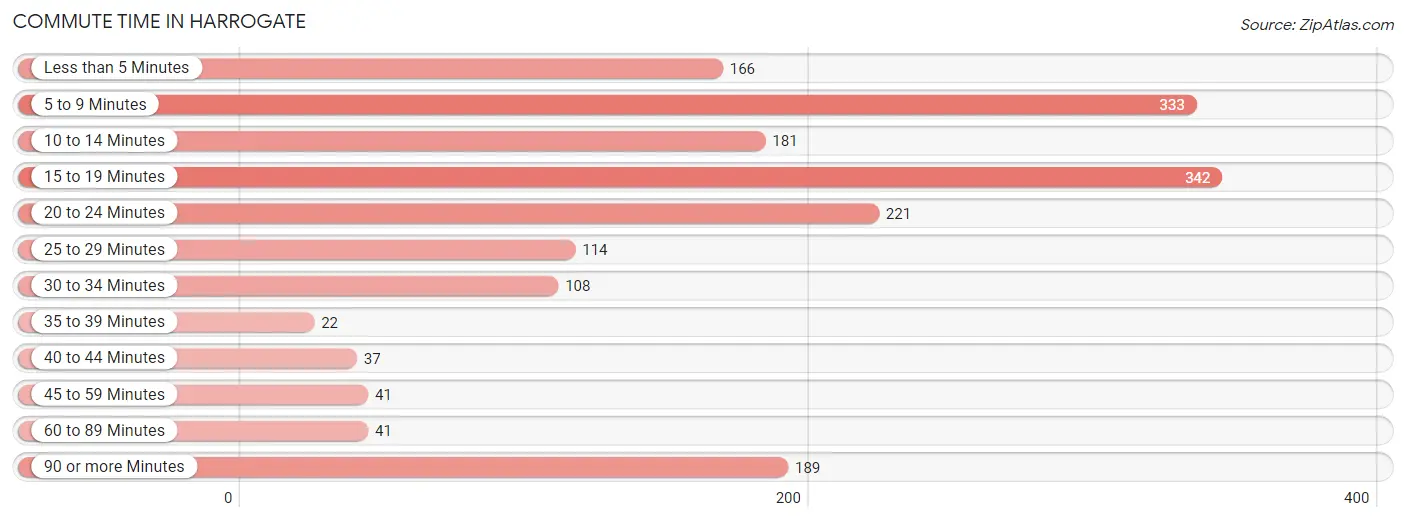
| Commute Time | # Commuters | % Commuters |
| Less than 5 Minutes | 166 | 9.2% |
| 5 to 9 Minutes | 333 | 18.5% |
| 10 to 14 Minutes | 181 | 10.1% |
| 15 to 19 Minutes | 342 | 19.1% |
| 20 to 24 Minutes | 221 | 12.3% |
| 25 to 29 Minutes | 114 | 6.4% |
| 30 to 34 Minutes | 108 | 6.0% |
| 35 to 39 Minutes | 22 | 1.2% |
| 40 to 44 Minutes | 37 | 2.1% |
| 45 to 59 Minutes | 41 | 2.3% |
| 60 to 89 Minutes | 41 | 2.3% |
| 90 or more Minutes | 189 | 10.5% |
Commute Time by Sex in Harrogate
The most common commute times in Harrogate are 5 to 9 minutes (219 commuters, 28.5%) for males and 20 to 24 minutes (193 commuters, 18.8%) for females.
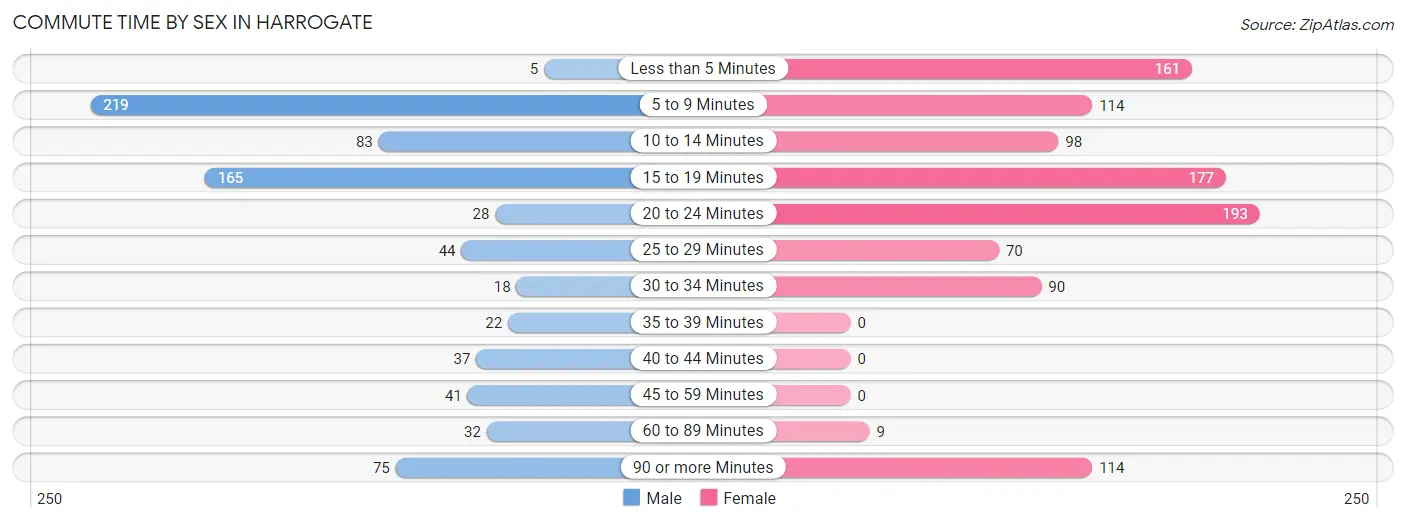
| Commute Time | Male | Female |
| Less than 5 Minutes | 5 (0.6%) | 161 (15.7%) |
| 5 to 9 Minutes | 219 (28.5%) | 114 (11.1%) |
| 10 to 14 Minutes | 83 (10.8%) | 98 (9.6%) |
| 15 to 19 Minutes | 165 (21.5%) | 177 (17.2%) |
| 20 to 24 Minutes | 28 (3.6%) | 193 (18.8%) |
| 25 to 29 Minutes | 44 (5.7%) | 70 (6.8%) |
| 30 to 34 Minutes | 18 (2.3%) | 90 (8.8%) |
| 35 to 39 Minutes | 22 (2.9%) | 0 (0.0%) |
| 40 to 44 Minutes | 37 (4.8%) | 0 (0.0%) |
| 45 to 59 Minutes | 41 (5.3%) | 0 (0.0%) |
| 60 to 89 Minutes | 32 (4.2%) | 9 (0.9%) |
| 90 or more Minutes | 75 (9.8%) | 114 (11.1%) |
Time of Departure to Work by Sex in Harrogate
The most frequent times of departure to work in Harrogate are 8:00 AM to 8:29 AM (142, 18.5%) for males and 7:00 AM to 7:29 AM (179, 17.4%) for females.
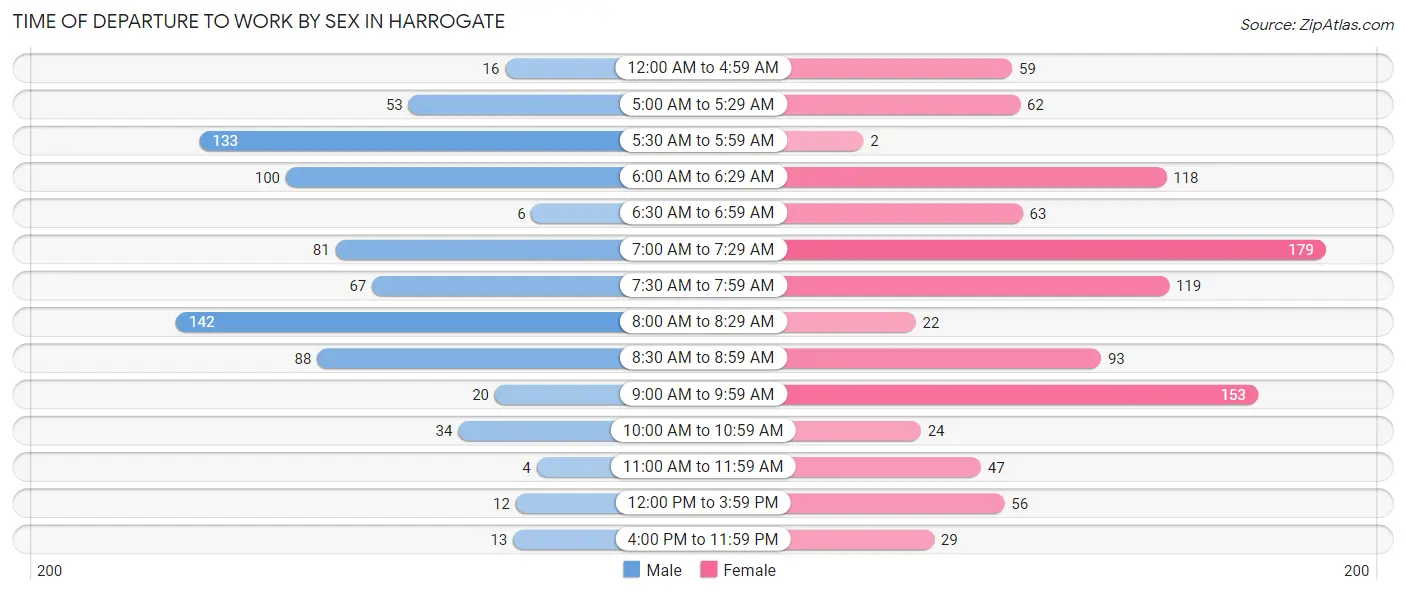
| Time of Departure | Male | Female |
| 12:00 AM to 4:59 AM | 16 (2.1%) | 59 (5.8%) |
| 5:00 AM to 5:29 AM | 53 (6.9%) | 62 (6.0%) |
| 5:30 AM to 5:59 AM | 133 (17.3%) | 2 (0.2%) |
| 6:00 AM to 6:29 AM | 100 (13.0%) | 118 (11.5%) |
| 6:30 AM to 6:59 AM | 6 (0.8%) | 63 (6.1%) |
| 7:00 AM to 7:29 AM | 81 (10.5%) | 179 (17.4%) |
| 7:30 AM to 7:59 AM | 67 (8.7%) | 119 (11.6%) |
| 8:00 AM to 8:29 AM | 142 (18.5%) | 22 (2.1%) |
| 8:30 AM to 8:59 AM | 88 (11.4%) | 93 (9.1%) |
| 9:00 AM to 9:59 AM | 20 (2.6%) | 153 (14.9%) |
| 10:00 AM to 10:59 AM | 34 (4.4%) | 24 (2.3%) |
| 11:00 AM to 11:59 AM | 4 (0.5%) | 47 (4.6%) |
| 12:00 PM to 3:59 PM | 12 (1.6%) | 56 (5.5%) |
| 4:00 PM to 11:59 PM | 13 (1.7%) | 29 (2.8%) |
| Total | 769 (100.0%) | 1,026 (100.0%) |
Housing Occupancy in Harrogate
Occupancy by Ownership in Harrogate
Of the total 1,590 dwellings in Harrogate, owner-occupied units account for 1,160 (73.0%), while renter-occupied units make up 430 (27.0%).
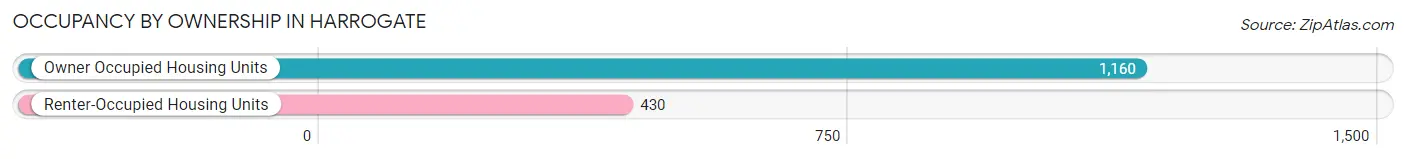
| Occupancy | # Housing Units | % Housing Units |
| Owner Occupied Housing Units | 1,160 | 73.0% |
| Renter-Occupied Housing Units | 430 | 27.0% |
| Total Occupied Housing Units | 1,590 | 100.0% |
Occupancy by Household Size in Harrogate
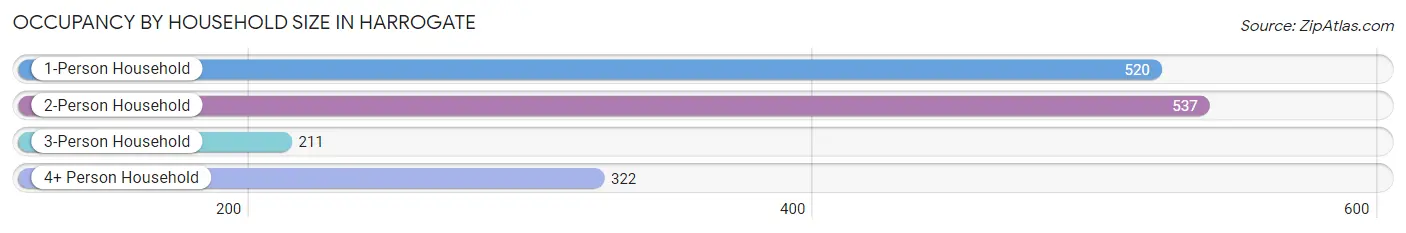
| Household Size | # Housing Units | % Housing Units |
| 1-Person Household | 520 | 32.7% |
| 2-Person Household | 537 | 33.8% |
| 3-Person Household | 211 | 13.3% |
| 4+ Person Household | 322 | 20.3% |
| Total Housing Units | 1,590 | 100.0% |
Occupancy by Ownership by Household Size in Harrogate
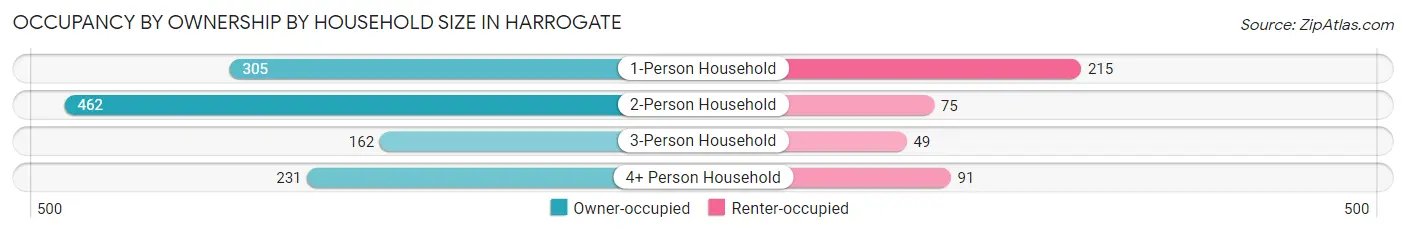
| Household Size | Owner-occupied | Renter-occupied |
| 1-Person Household | 305 (58.7%) | 215 (41.3%) |
| 2-Person Household | 462 (86.0%) | 75 (14.0%) |
| 3-Person Household | 162 (76.8%) | 49 (23.2%) |
| 4+ Person Household | 231 (71.7%) | 91 (28.3%) |
| Total Housing Units | 1,160 (73.0%) | 430 (27.0%) |
Occupancy by Educational Attainment in Harrogate
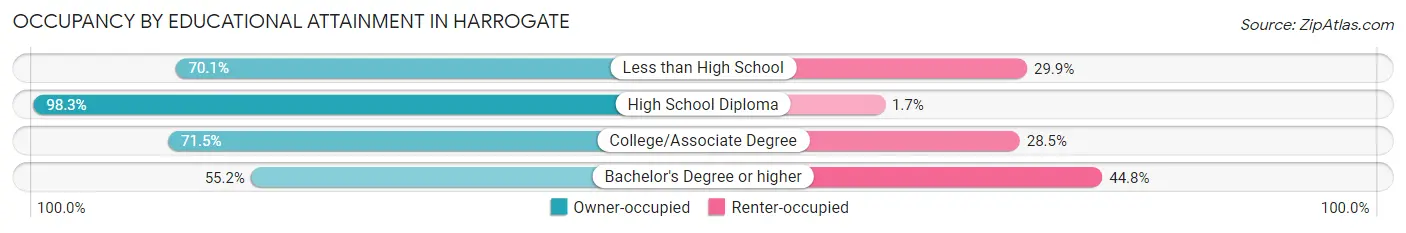
| Household Size | Owner-occupied | Renter-occupied |
| Less than High School | 89 (70.1%) | 38 (29.9%) |
| High School Diploma | 451 (98.3%) | 8 (1.7%) |
| College/Associate Degree | 289 (71.5%) | 115 (28.5%) |
| Bachelor's Degree or higher | 331 (55.2%) | 269 (44.8%) |
Occupancy by Age of Householder in Harrogate
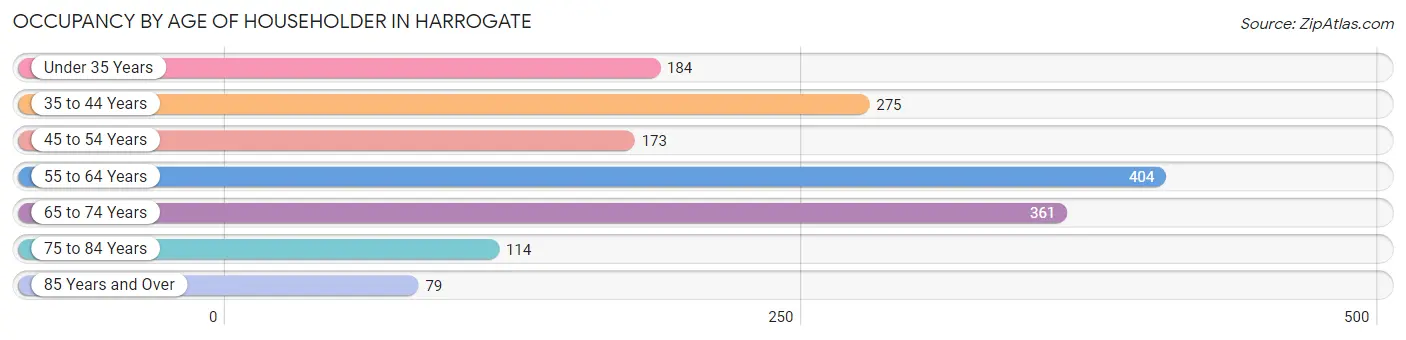
| Age Bracket | # Households | % Households |
| Under 35 Years | 184 | 11.6% |
| 35 to 44 Years | 275 | 17.3% |
| 45 to 54 Years | 173 | 10.9% |
| 55 to 64 Years | 404 | 25.4% |
| 65 to 74 Years | 361 | 22.7% |
| 75 to 84 Years | 114 | 7.2% |
| 85 Years and Over | 79 | 5.0% |
| Total | 1,590 | 100.0% |
Housing Finances in Harrogate
Median Income by Occupancy in Harrogate
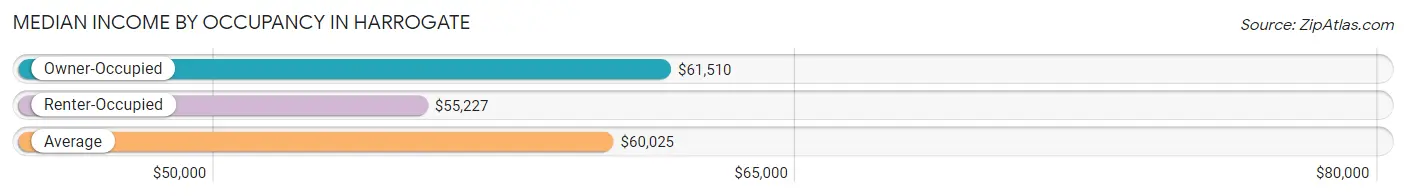
| Occupancy Type | # Households | Median Income |
| Owner-Occupied | 1,160 (73.0%) | $61,510 |
| Renter-Occupied | 430 (27.0%) | $55,227 |
| Average | 1,590 (100.0%) | $60,025 |
Occupancy by Householder Income Bracket in Harrogate
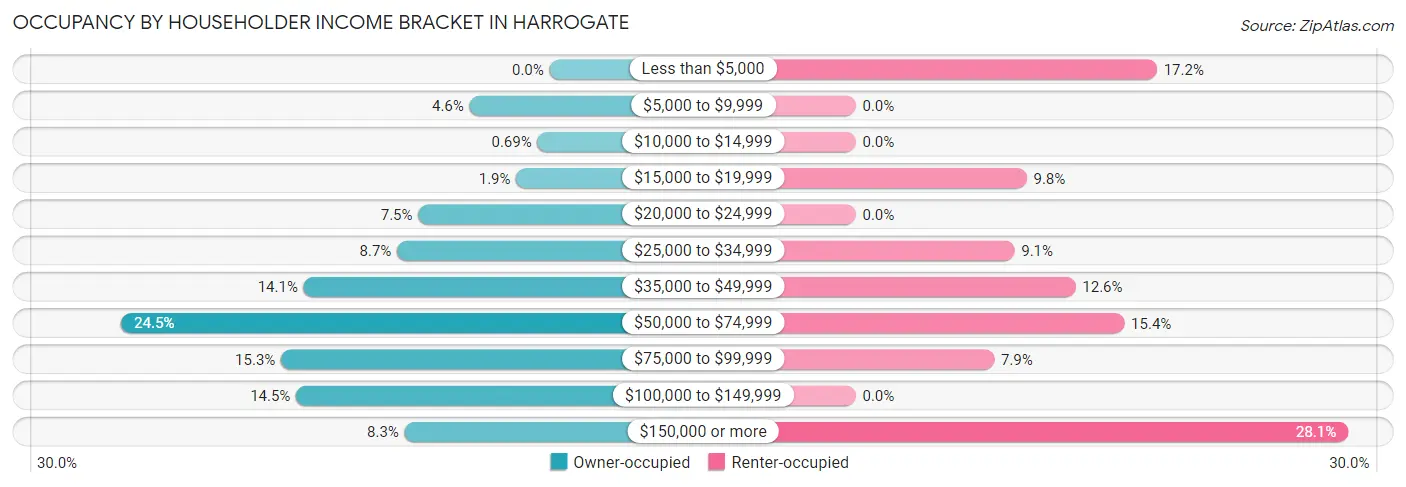
| Income Bracket | Owner-occupied | Renter-occupied |
| Less than $5,000 | 0 (0.0%) | 74 (17.2%) |
| $5,000 to $9,999 | 53 (4.6%) | 0 (0.0%) |
| $10,000 to $14,999 | 8 (0.7%) | 0 (0.0%) |
| $15,000 to $19,999 | 22 (1.9%) | 42 (9.8%) |
| $20,000 to $24,999 | 87 (7.5%) | 0 (0.0%) |
| $25,000 to $34,999 | 101 (8.7%) | 39 (9.1%) |
| $35,000 to $49,999 | 163 (14.1%) | 54 (12.6%) |
| $50,000 to $74,999 | 284 (24.5%) | 66 (15.3%) |
| $75,000 to $99,999 | 178 (15.3%) | 34 (7.9%) |
| $100,000 to $149,999 | 168 (14.5%) | 0 (0.0%) |
| $150,000 or more | 96 (8.3%) | 121 (28.1%) |
| Total | 1,160 (100.0%) | 430 (100.0%) |
Monthly Housing Cost Tiers in Harrogate
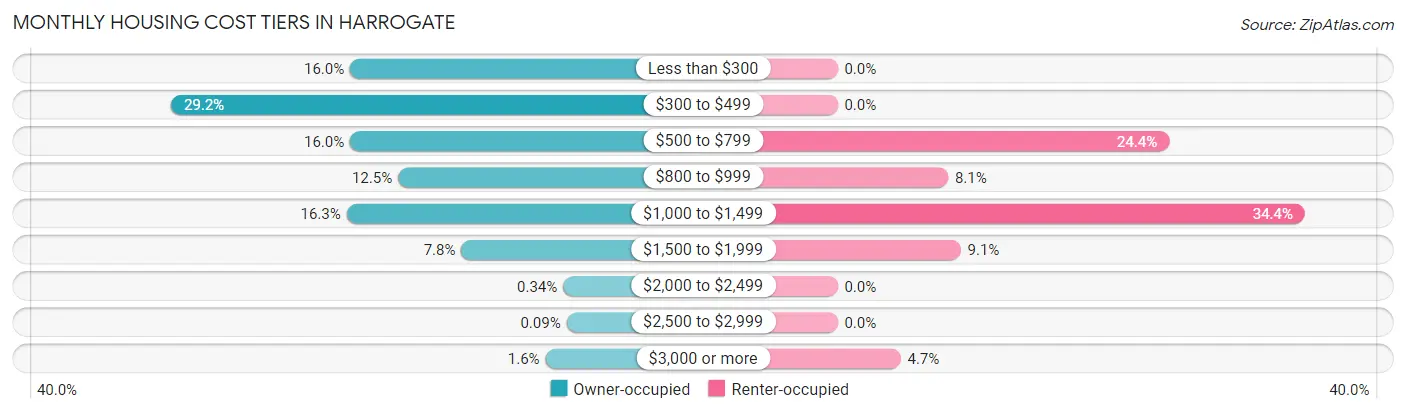
| Monthly Cost | Owner-occupied | Renter-occupied |
| Less than $300 | 186 (16.0%) | 0 (0.0%) |
| $300 to $499 | 339 (29.2%) | 0 (0.0%) |
| $500 to $799 | 186 (16.0%) | 105 (24.4%) |
| $800 to $999 | 145 (12.5%) | 35 (8.1%) |
| $1,000 to $1,499 | 189 (16.3%) | 148 (34.4%) |
| $1,500 to $1,999 | 91 (7.8%) | 39 (9.1%) |
| $2,000 to $2,499 | 4 (0.3%) | 0 (0.0%) |
| $2,500 to $2,999 | 1 (0.1%) | 0 (0.0%) |
| $3,000 or more | 19 (1.6%) | 20 (4.6%) |
| Total | 1,160 (100.0%) | 430 (100.0%) |
Physical Housing Characteristics in Harrogate
Housing Structures in Harrogate
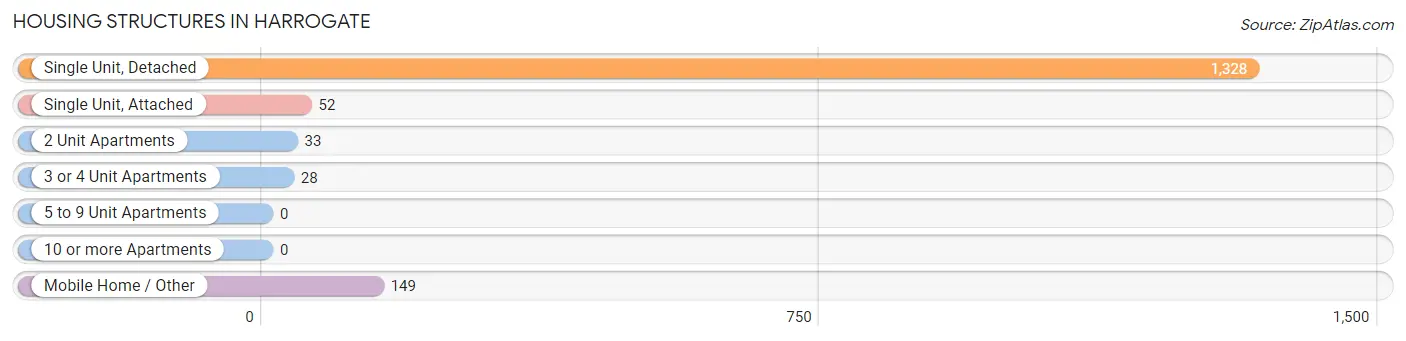
| Structure Type | # Housing Units | % Housing Units |
| Single Unit, Detached | 1,328 | 83.5% |
| Single Unit, Attached | 52 | 3.3% |
| 2 Unit Apartments | 33 | 2.1% |
| 3 or 4 Unit Apartments | 28 | 1.8% |
| 5 to 9 Unit Apartments | 0 | 0.0% |
| 10 or more Apartments | 0 | 0.0% |
| Mobile Home / Other | 149 | 9.4% |
| Total | 1,590 | 100.0% |
Housing Structures by Occupancy in Harrogate
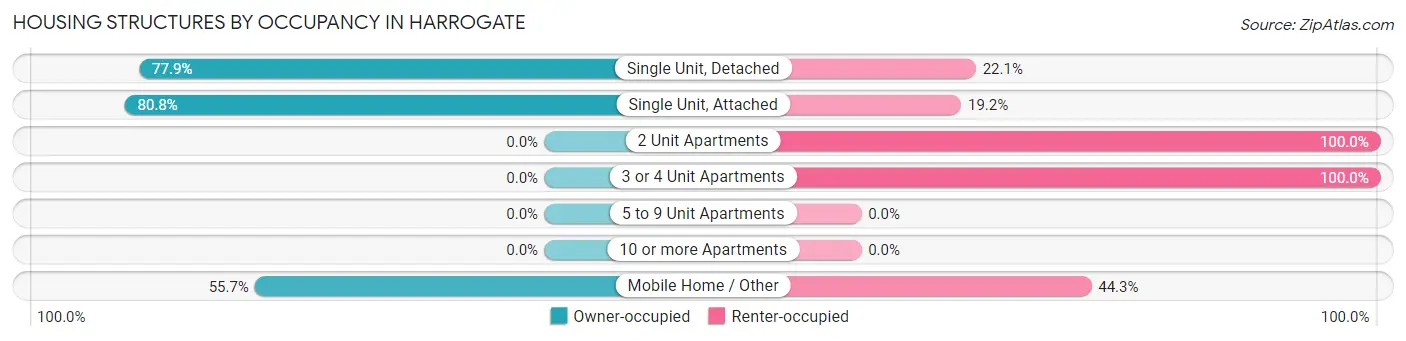
| Structure Type | Owner-occupied | Renter-occupied |
| Single Unit, Detached | 1,035 (77.9%) | 293 (22.1%) |
| Single Unit, Attached | 42 (80.8%) | 10 (19.2%) |
| 2 Unit Apartments | 0 (0.0%) | 33 (100.0%) |
| 3 or 4 Unit Apartments | 0 (0.0%) | 28 (100.0%) |
| 5 to 9 Unit Apartments | 0 (0.0%) | 0 (0.0%) |
| 10 or more Apartments | 0 (0.0%) | 0 (0.0%) |
| Mobile Home / Other | 83 (55.7%) | 66 (44.3%) |
| Total | 1,160 (73.0%) | 430 (27.0%) |
Housing Structures by Number of Rooms in Harrogate
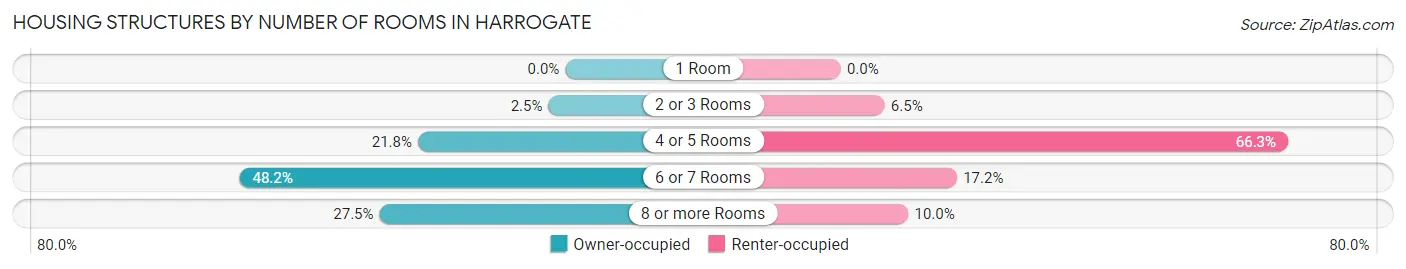
| Number of Rooms | Owner-occupied | Renter-occupied |
| 1 Room | 0 (0.0%) | 0 (0.0%) |
| 2 or 3 Rooms | 29 (2.5%) | 28 (6.5%) |
| 4 or 5 Rooms | 253 (21.8%) | 285 (66.3%) |
| 6 or 7 Rooms | 559 (48.2%) | 74 (17.2%) |
| 8 or more Rooms | 319 (27.5%) | 43 (10.0%) |
| Total | 1,160 (100.0%) | 430 (100.0%) |
Housing Structure by Heating Type in Harrogate
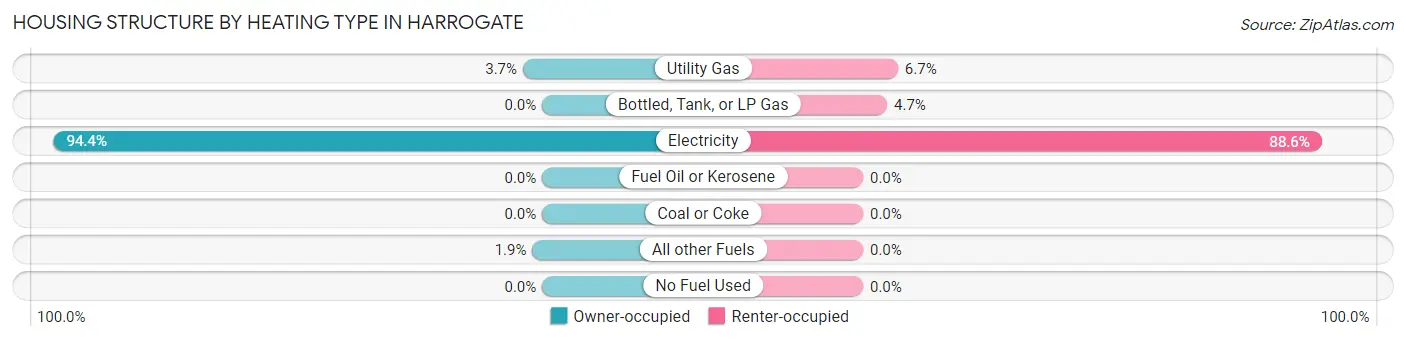
| Heating Type | Owner-occupied | Renter-occupied |
| Utility Gas | 43 (3.7%) | 29 (6.7%) |
| Bottled, Tank, or LP Gas | 0 (0.0%) | 20 (4.6%) |
| Electricity | 1,095 (94.4%) | 381 (88.6%) |
| Fuel Oil or Kerosene | 0 (0.0%) | 0 (0.0%) |
| Coal or Coke | 0 (0.0%) | 0 (0.0%) |
| All other Fuels | 22 (1.9%) | 0 (0.0%) |
| No Fuel Used | 0 (0.0%) | 0 (0.0%) |
| Total | 1,160 (100.0%) | 430 (100.0%) |
Household Vehicle Usage in Harrogate
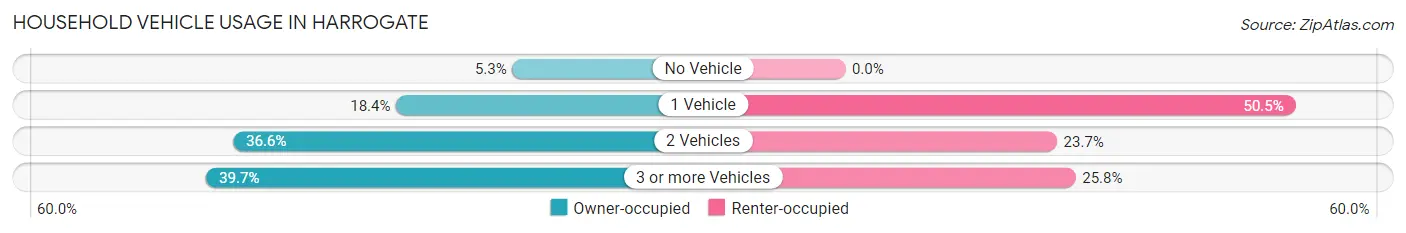
| Vehicles per Household | Owner-occupied | Renter-occupied |
| No Vehicle | 62 (5.3%) | 0 (0.0%) |
| 1 Vehicle | 213 (18.4%) | 217 (50.5%) |
| 2 Vehicles | 425 (36.6%) | 102 (23.7%) |
| 3 or more Vehicles | 460 (39.7%) | 111 (25.8%) |
| Total | 1,160 (100.0%) | 430 (100.0%) |
Real Estate & Mortgages in Harrogate
Real Estate and Mortgage Overview in Harrogate
| Characteristic | Without Mortgage | With Mortgage |
| Housing Units | 684 | 476 |
| Median Property Value | $142,400 | $183,200 |
| Median Household Income | $51,364 | $70 |
| Monthly Housing Costs | $348 | $19 |
| Real Estate Taxes | $754 | $0 |
Property Value by Mortgage Status in Harrogate
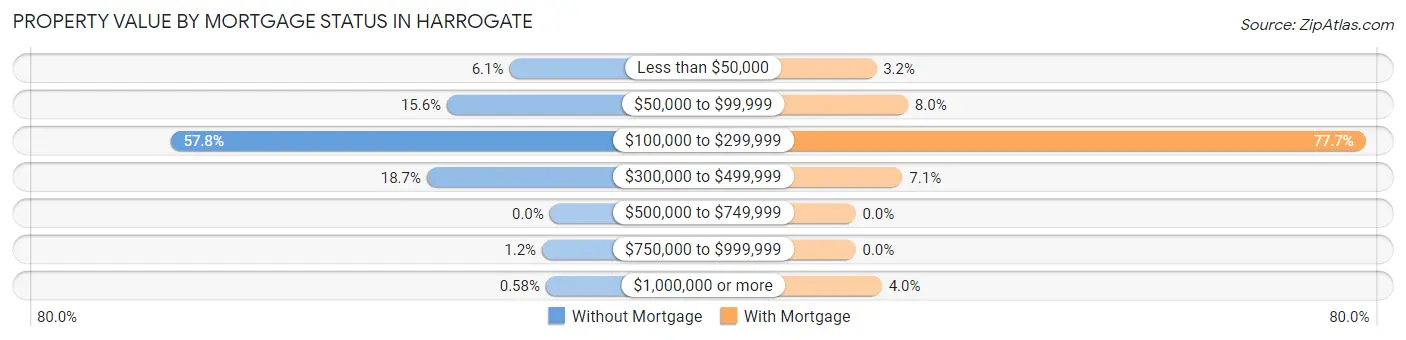
| Property Value | Without Mortgage | With Mortgage |
| Less than $50,000 | 42 (6.1%) | 15 (3.2%) |
| $50,000 to $99,999 | 107 (15.6%) | 38 (8.0%) |
| $100,000 to $299,999 | 395 (57.8%) | 370 (77.7%) |
| $300,000 to $499,999 | 128 (18.7%) | 34 (7.1%) |
| $500,000 to $749,999 | 0 (0.0%) | 0 (0.0%) |
| $750,000 to $999,999 | 8 (1.2%) | 0 (0.0%) |
| $1,000,000 or more | 4 (0.6%) | 19 (4.0%) |
| Total | 684 (100.0%) | 476 (100.0%) |
Household Income by Mortgage Status in Harrogate
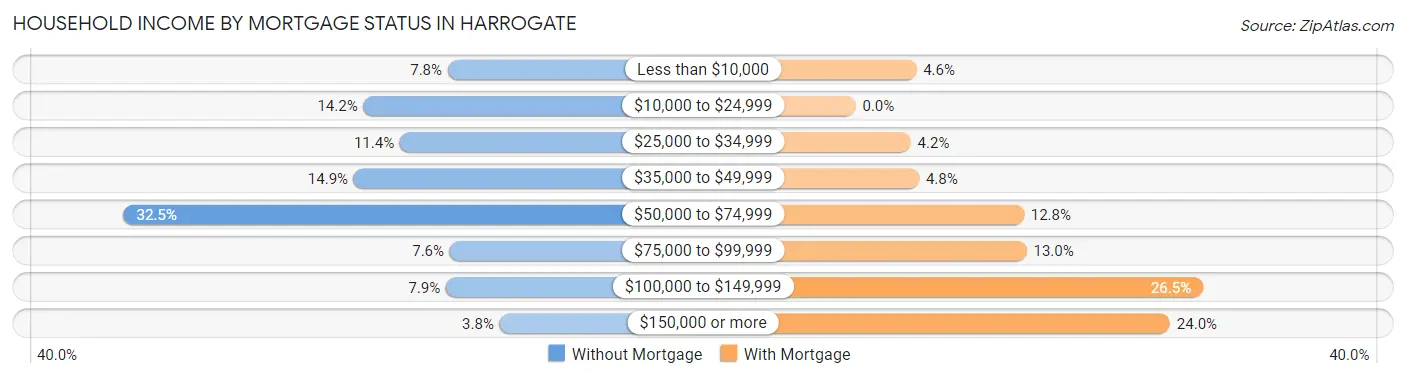
| Household Income | Without Mortgage | With Mortgage |
| Less than $10,000 | 53 (7.7%) | 22 (4.6%) |
| $10,000 to $24,999 | 97 (14.2%) | 0 (0.0%) |
| $25,000 to $34,999 | 78 (11.4%) | 20 (4.2%) |
| $35,000 to $49,999 | 102 (14.9%) | 23 (4.8%) |
| $50,000 to $74,999 | 222 (32.5%) | 61 (12.8%) |
| $75,000 to $99,999 | 52 (7.6%) | 62 (13.0%) |
| $100,000 to $149,999 | 54 (7.9%) | 126 (26.5%) |
| $150,000 or more | 26 (3.8%) | 114 (23.9%) |
| Total | 684 (100.0%) | 476 (100.0%) |
Property Value to Household Income Ratio in Harrogate
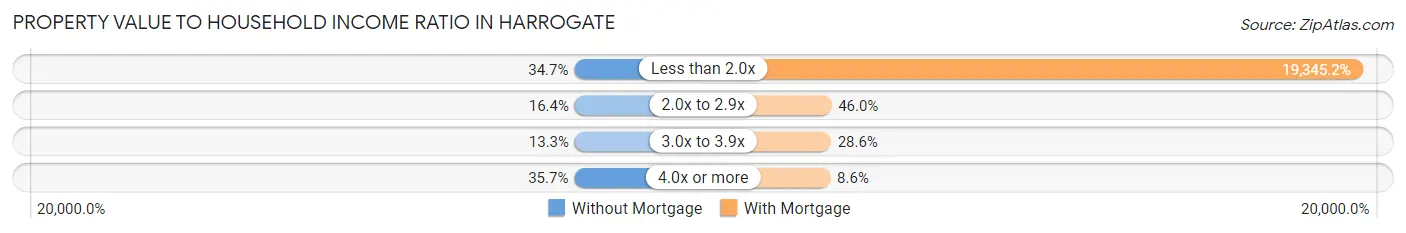
| Value-to-Income Ratio | Without Mortgage | With Mortgage |
| Less than 2.0x | 237 (34.6%) | 92,083 (19,345.2%) |
| 2.0x to 2.9x | 112 (16.4%) | 219 (46.0%) |
| 3.0x to 3.9x | 91 (13.3%) | 136 (28.6%) |
| 4.0x or more | 244 (35.7%) | 41 (8.6%) |
| Total | 684 (100.0%) | 476 (100.0%) |
Real Estate Taxes by Mortgage Status in Harrogate
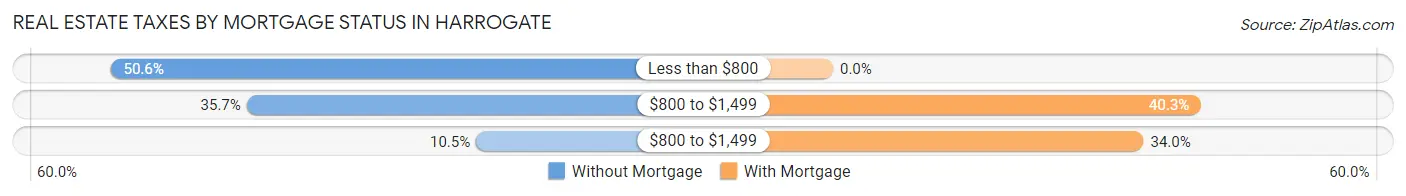
| Property Taxes | Without Mortgage | With Mortgage |
| Less than $800 | 346 (50.6%) | 0 (0.0%) |
| $800 to $1,499 | 244 (35.7%) | 192 (40.3%) |
| $800 to $1,499 | 72 (10.5%) | 162 (34.0%) |
| Total | 684 (100.0%) | 476 (100.0%) |
Health & Disability in Harrogate
Health Insurance Coverage by Age in Harrogate
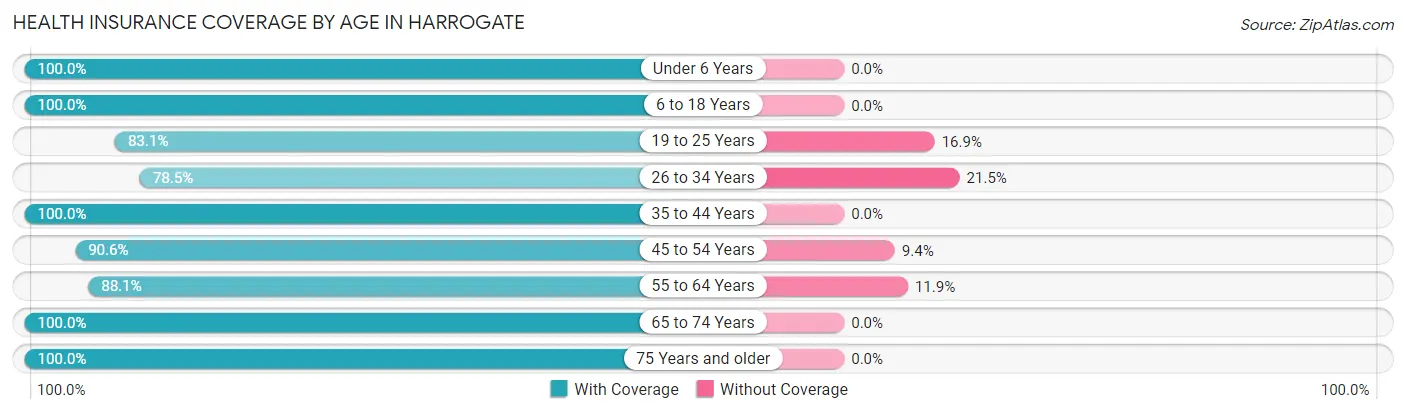
| Age Bracket | With Coverage | Without Coverage |
| Under 6 Years | 243 (100.0%) | 0 (0.0%) |
| 6 to 18 Years | 390 (100.0%) | 0 (0.0%) |
| 19 to 25 Years | 799 (83.1%) | 162 (16.9%) |
| 26 to 34 Years | 219 (78.5%) | 60 (21.5%) |
| 35 to 44 Years | 407 (100.0%) | 0 (0.0%) |
| 45 to 54 Years | 374 (90.6%) | 39 (9.4%) |
| 55 to 64 Years | 675 (88.1%) | 91 (11.9%) |
| 65 to 74 Years | 497 (100.0%) | 0 (0.0%) |
| 75 Years and older | 305 (100.0%) | 0 (0.0%) |
| Total | 3,909 (91.7%) | 352 (8.3%) |
Health Insurance Coverage by Citizenship Status in Harrogate
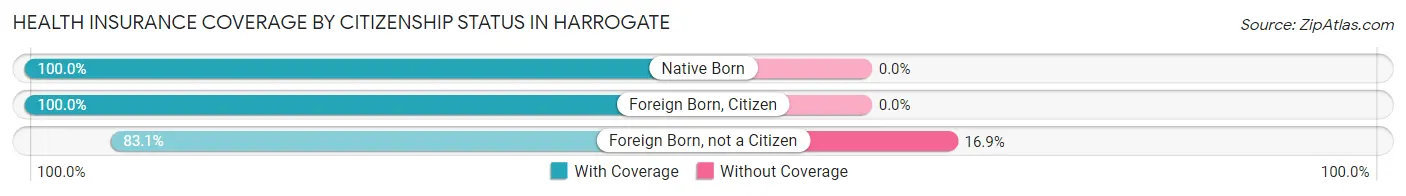
| Citizenship Status | With Coverage | Without Coverage |
| Native Born | 243 (100.0%) | 0 (0.0%) |
| Foreign Born, Citizen | 390 (100.0%) | 0 (0.0%) |
| Foreign Born, not a Citizen | 799 (83.1%) | 162 (16.9%) |
Health Insurance Coverage by Household Income in Harrogate
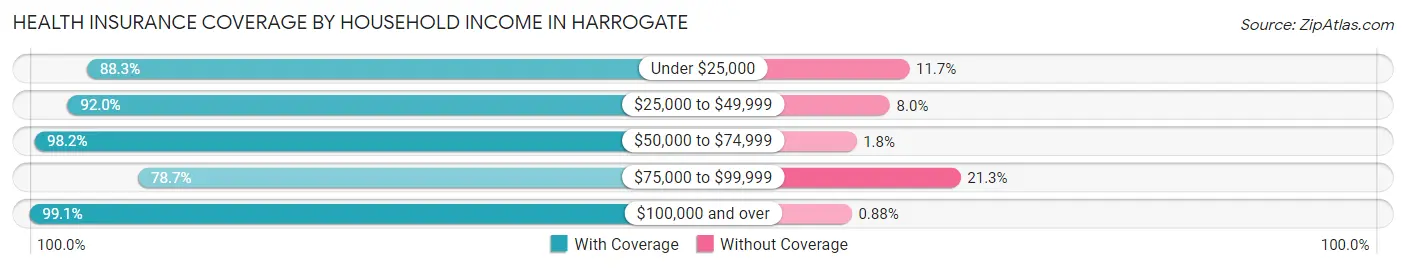
| Household Income | With Coverage | Without Coverage |
| Under $25,000 | 379 (88.3%) | 50 (11.7%) |
| $25,000 to $49,999 | 607 (92.0%) | 53 (8.0%) |
| $50,000 to $74,999 | 722 (98.2%) | 13 (1.8%) |
| $75,000 to $99,999 | 518 (78.7%) | 140 (21.3%) |
| $100,000 and over | 1,130 (99.1%) | 10 (0.9%) |
Public vs Private Health Insurance Coverage by Age in Harrogate
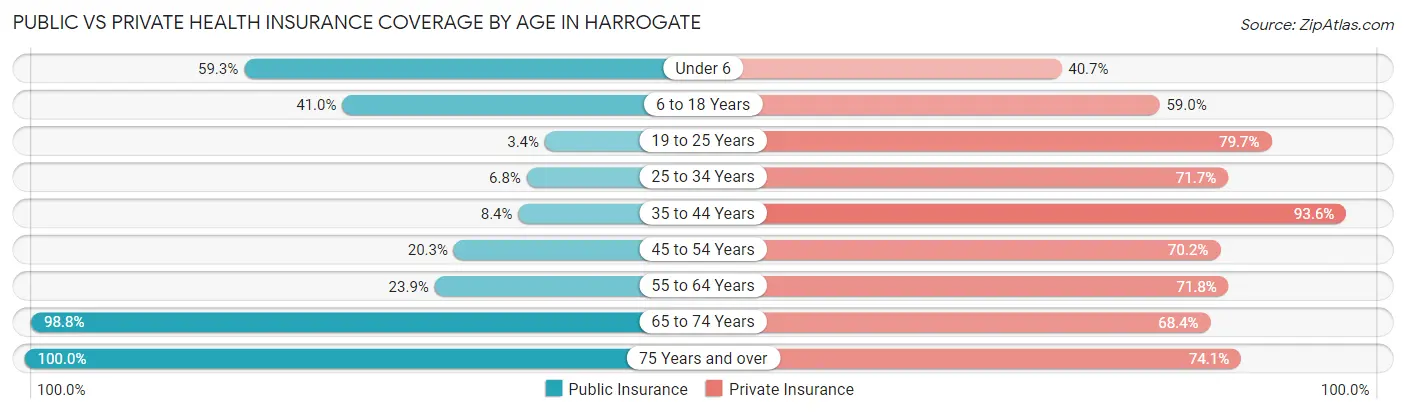
| Age Bracket | Public Insurance | Private Insurance |
| Under 6 | 144 (59.3%) | 99 (40.7%) |
| 6 to 18 Years | 160 (41.0%) | 230 (59.0%) |
| 19 to 25 Years | 33 (3.4%) | 766 (79.7%) |
| 25 to 34 Years | 19 (6.8%) | 200 (71.7%) |
| 35 to 44 Years | 34 (8.4%) | 381 (93.6%) |
| 45 to 54 Years | 84 (20.3%) | 290 (70.2%) |
| 55 to 64 Years | 183 (23.9%) | 550 (71.8%) |
| 65 to 74 Years | 491 (98.8%) | 340 (68.4%) |
| 75 Years and over | 305 (100.0%) | 226 (74.1%) |
| Total | 1,453 (34.1%) | 3,082 (72.3%) |
Disability Status by Sex by Age in Harrogate
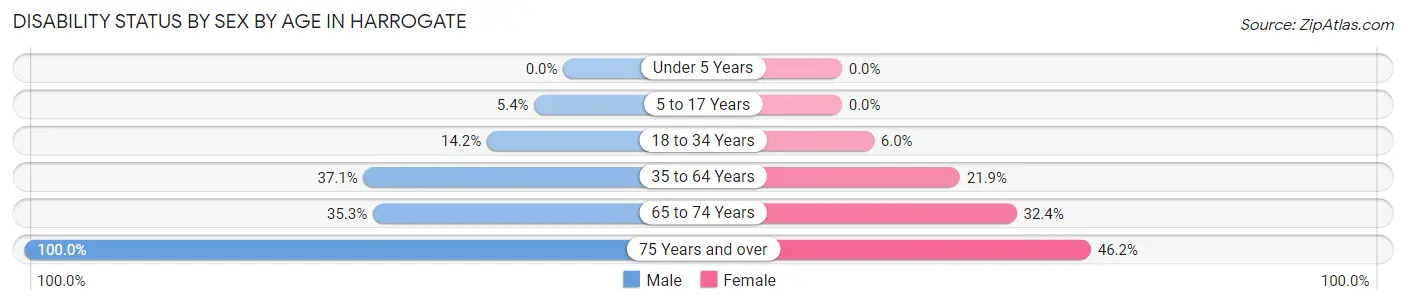
| Age Bracket | Male | Female |
| Under 5 Years | 0 (0.0%) | 0 (0.0%) |
| 5 to 17 Years | 13 (5.4%) | 0 (0.0%) |
| 18 to 34 Years | 68 (14.2%) | 50 (5.9%) |
| 35 to 64 Years | 280 (37.1%) | 182 (21.9%) |
| 65 to 74 Years | 71 (35.3%) | 96 (32.4%) |
| 75 Years and over | 186 (100.0%) | 55 (46.2%) |
Disability Class by Sex by Age in Harrogate
Disability Class: Hearing Difficulty
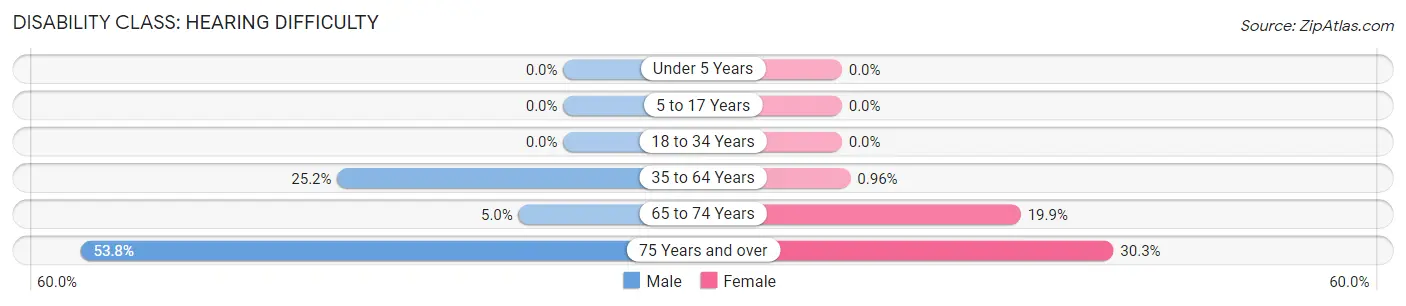
| Age Bracket | Male | Female |
| Under 5 Years | 0 (0.0%) | 0 (0.0%) |
| 5 to 17 Years | 0 (0.0%) | 0 (0.0%) |
| 18 to 34 Years | 0 (0.0%) | 0 (0.0%) |
| 35 to 64 Years | 190 (25.2%) | 8 (1.0%) |
| 65 to 74 Years | 10 (5.0%) | 59 (19.9%) |
| 75 Years and over | 100 (53.8%) | 36 (30.2%) |
Disability Class: Vision Difficulty
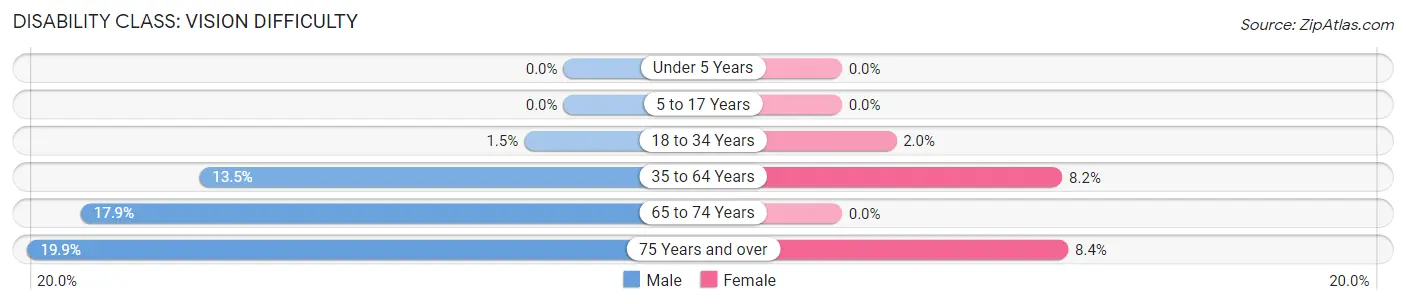
| Age Bracket | Male | Female |
| Under 5 Years | 0 (0.0%) | 0 (0.0%) |
| 5 to 17 Years | 0 (0.0%) | 0 (0.0%) |
| 18 to 34 Years | 7 (1.5%) | 17 (2.0%) |
| 35 to 64 Years | 102 (13.5%) | 68 (8.2%) |
| 65 to 74 Years | 36 (17.9%) | 0 (0.0%) |
| 75 Years and over | 37 (19.9%) | 10 (8.4%) |
Disability Class: Cognitive Difficulty
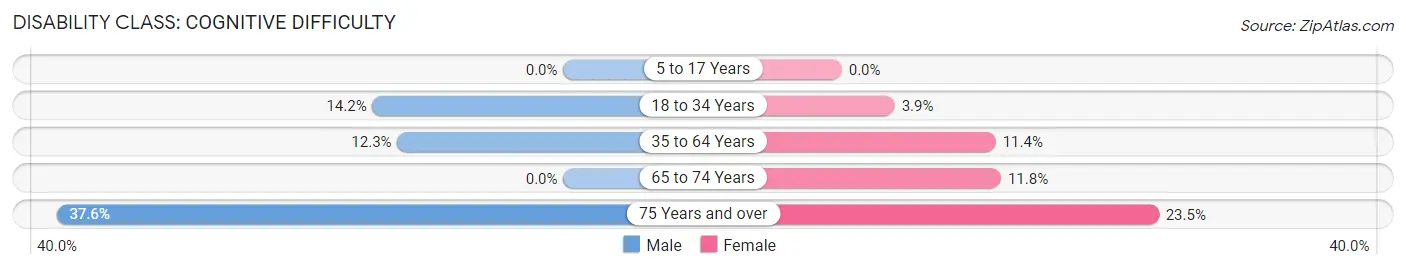
| Age Bracket | Male | Female |
| 5 to 17 Years | 0 (0.0%) | 0 (0.0%) |
| 18 to 34 Years | 68 (14.2%) | 33 (3.9%) |
| 35 to 64 Years | 93 (12.3%) | 95 (11.4%) |
| 65 to 74 Years | 0 (0.0%) | 35 (11.8%) |
| 75 Years and over | 70 (37.6%) | 28 (23.5%) |
Disability Class: Ambulatory Difficulty
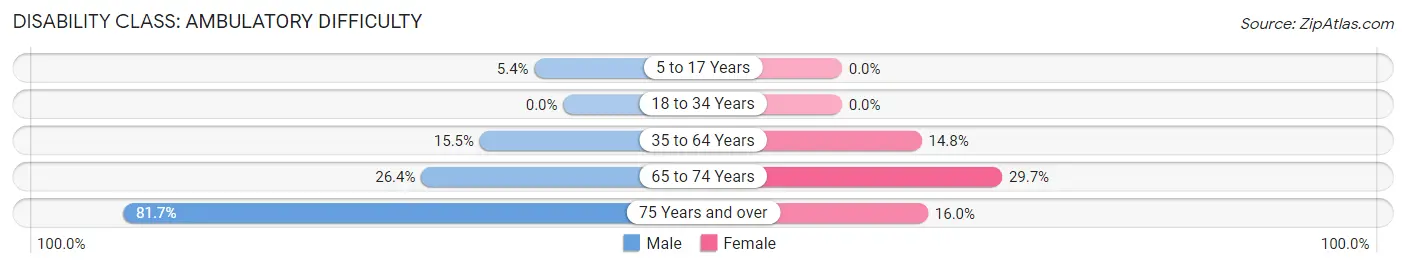
| Age Bracket | Male | Female |
| 5 to 17 Years | 13 (5.4%) | 0 (0.0%) |
| 18 to 34 Years | 0 (0.0%) | 0 (0.0%) |
| 35 to 64 Years | 117 (15.5%) | 123 (14.8%) |
| 65 to 74 Years | 53 (26.4%) | 88 (29.7%) |
| 75 Years and over | 152 (81.7%) | 19 (16.0%) |
Disability Class: Self-Care Difficulty
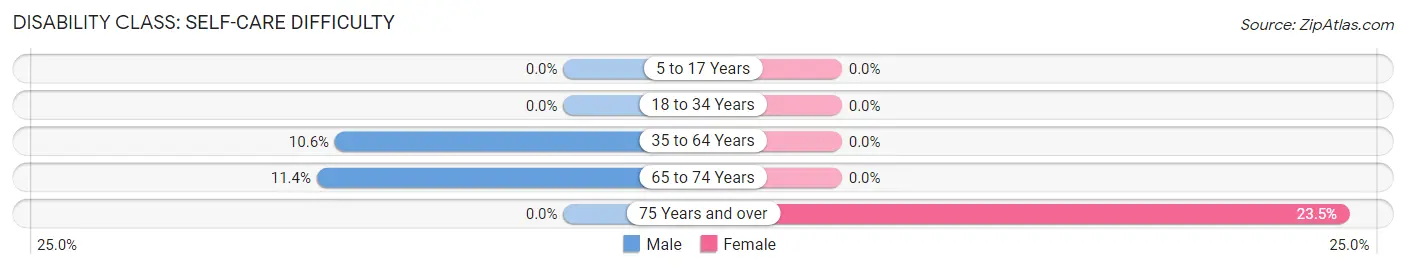
| Age Bracket | Male | Female |
| 5 to 17 Years | 0 (0.0%) | 0 (0.0%) |
| 18 to 34 Years | 0 (0.0%) | 0 (0.0%) |
| 35 to 64 Years | 80 (10.6%) | 0 (0.0%) |
| 65 to 74 Years | 23 (11.4%) | 0 (0.0%) |
| 75 Years and over | 0 (0.0%) | 28 (23.5%) |
Technology Access in Harrogate
Computing Device Access in Harrogate
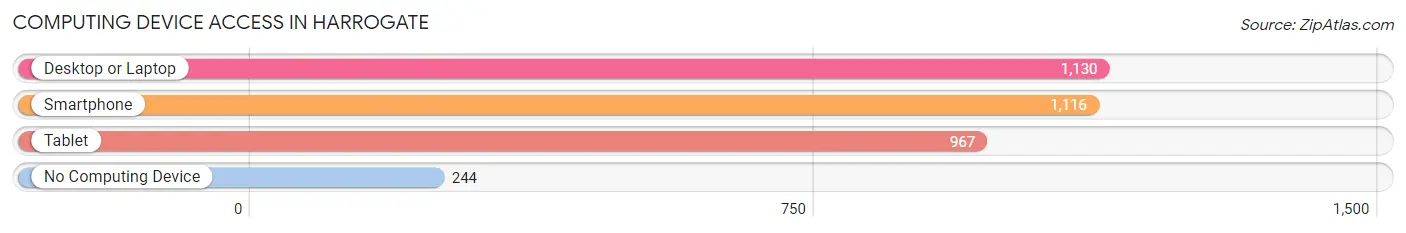
| Device Type | # Households | % Households |
| Desktop or Laptop | 1,130 | 71.1% |
| Smartphone | 1,116 | 70.2% |
| Tablet | 967 | 60.8% |
| No Computing Device | 244 | 15.3% |
| Total | 1,590 | 100.0% |
Internet Access in Harrogate
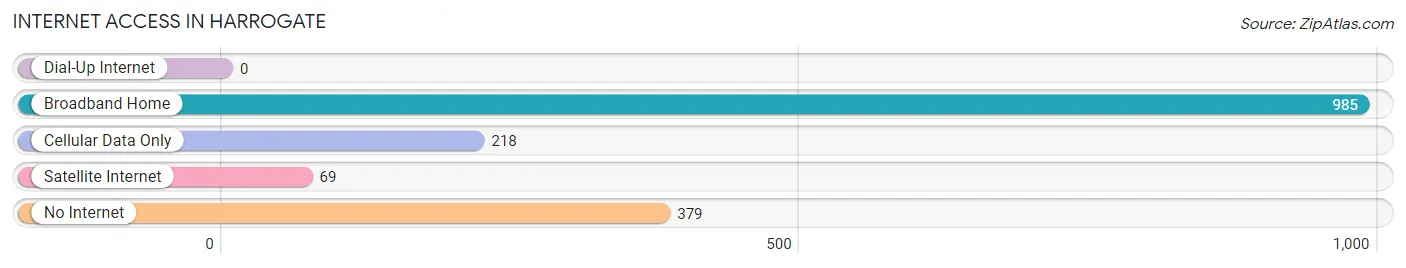
| Internet Type | # Households | % Households |
| Dial-Up Internet | 0 | 0.0% |
| Broadband Home | 985 | 62.0% |
| Cellular Data Only | 218 | 13.7% |
| Satellite Internet | 69 | 4.3% |
| No Internet | 379 | 23.8% |
| Total | 1,590 | 100.0% |
Harrogate Summary
Harrogate is a small town located in the state of Tennessee, United States. It is situated in the foothills of the Great Smoky Mountains, and is part of the Knoxville metropolitan area. The town has a population of approximately 8,000 people, and is known for its scenic beauty and outdoor recreation opportunities.
History
Harrogate was first settled in the late 1700s by settlers from North Carolina. The town was originally known as “Harrogate Springs” due to the numerous natural springs in the area. The town was officially incorporated in 1810, and was named after the town of Harrogate in England.
In the early 1800s, Harrogate was a popular destination for wealthy travelers from the East Coast. The town was known for its mineral springs, which were believed to have healing properties. The town also had several hotels and resorts, which attracted visitors from all over the country.
In the late 1800s, the town began to decline in popularity as a tourist destination. The mineral springs were no longer believed to have healing properties, and the hotels and resorts closed down. The town’s economy shifted to agriculture, and the population began to decline.
Geography
Harrogate is located in the foothills of the Great Smoky Mountains, and is part of the Knoxville metropolitan area. The town is situated at an elevation of 1,000 feet, and is surrounded by rolling hills and lush forests. The town is located near the Clinch River, which provides a variety of recreational opportunities.
The climate in Harrogate is mild and humid, with hot summers and cool winters. The average annual temperature is around 60 degrees Fahrenheit, and the average annual precipitation is around 45 inches.
Economy
The economy of Harrogate is largely based on agriculture and tourism. The town is home to several farms, which produce a variety of crops including corn, soybeans, and hay. The town also has several wineries, which attract visitors from all over the country.
The town is also home to several small businesses, including restaurants, shops, and galleries. The town is also home to a variety of outdoor recreation opportunities, including hiking, fishing, and camping.
Demographics
As of the 2010 census, the population of Harrogate was 8,000. The racial makeup of the town was 95.3% White, 1.2% African American, 0.3% Native American, 0.7% Asian, and 2.5% from other races. The median household income was $37,000, and the median home value was $150,000.
Conclusion
Harrogate is a small town located in the foothills of the Great Smoky Mountains in Tennessee. The town has a population of 8,000 people, and is known for its scenic beauty and outdoor recreation opportunities. The economy of Harrogate is largely based on agriculture and tourism, and the town is home to several small businesses. The racial makeup of the town is predominantly White, with a small percentage of African American, Native American, and Asian residents.
Common Questions
What is Per Capita Income in Harrogate?
Per Capita income in Harrogate is $28,981.
What is the Median Family Income in Harrogate?
Median Family Income in Harrogate is $75,147.
What is the Median Household income in Harrogate?
Median Household Income in Harrogate is $60,025.
What is Income or Wage Gap in Harrogate?
Income or Wage Gap in Harrogate is 59.8%.
Women in Harrogate earn 40.2 cents for every dollar earned by a man.
What is Inequality or Gini Index in Harrogate?
Inequality or Gini Index in Harrogate is 0.45.
What is the Total Population of Harrogate?
Total Population of Harrogate is 4,371.
What is the Total Male Population of Harrogate?
Total Male Population of Harrogate is 2,041.
What is the Total Female Population of Harrogate?
Total Female Population of Harrogate is 2,330.
What is the Ratio of Males per 100 Females in Harrogate?
There are 87.60 Males per 100 Females in Harrogate.
What is the Ratio of Females per 100 Males in Harrogate?
There are 114.16 Females per 100 Males in Harrogate.
What is the Median Population Age in Harrogate?
Median Population Age in Harrogate is 43.0 Years.
What is the Average Family Size in Harrogate
Average Family Size in Harrogate is 2.9 People.
What is the Average Household Size in Harrogate
Average Household Size in Harrogate is 2.3 People.
How Large is the Labor Force in Harrogate?
There are 1,941 People in the Labor Forcein in Harrogate.
What is the Percentage of People in the Labor Force in Harrogate?
49.8% of People are in the Labor Force in Harrogate.
What is the Unemployment Rate in Harrogate?
Unemployment Rate in Harrogate is 2.9%.