Zip Codes with the Highest Percentage of Population Employed in Real Estate, Rental & Leasing in Seneca, SC
RELATED REPORTS & OPTIONS
Real Estate, Rental & Leasing
Seneca
Compare Zip Codes
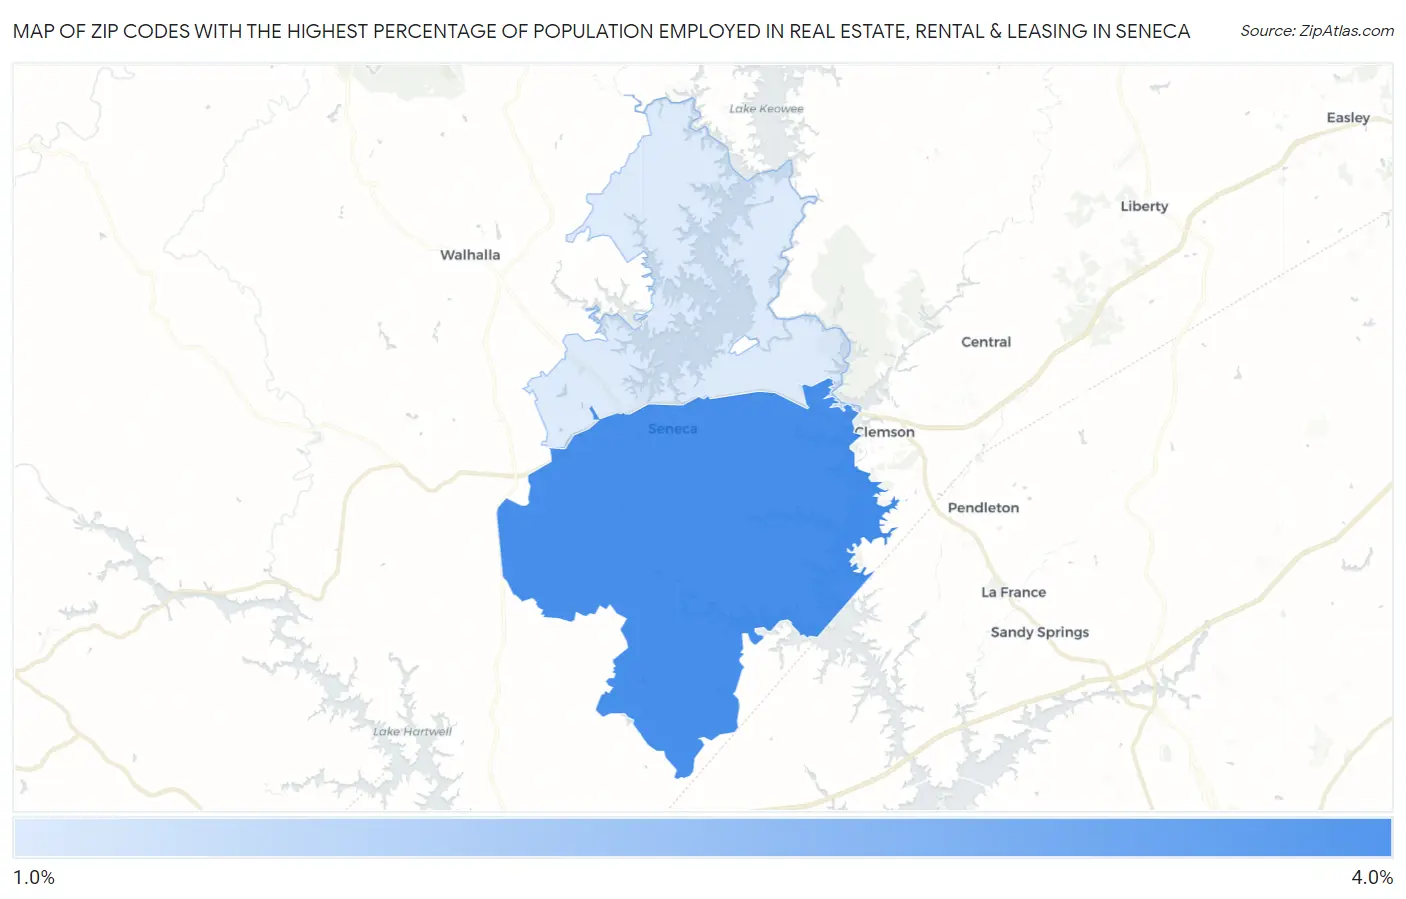
Map of Zip Codes with the Highest Percentage of Population Employed in Real Estate, Rental & Leasing in Seneca
1.1%
3.6%
Zip Codes with the Highest Percentage of Population Employed in Real Estate, Rental & Leasing in Seneca, SC
| Zip Code | % Employed | vs State | vs National | |
| 1. | 29678 | 3.6% | 2.0%(+1.66)#43 | 1.9%(+1.73)#2,637 |
| 2. | 29672 | 1.1% | 2.0%(-0.901)#195 | 1.9%(-0.831)#14,615 |
1
Common Questions
What are the Top Zip Codes with the Highest Percentage of Population Employed in Real Estate, Rental & Leasing in Seneca, SC?
Top Zip Codes with the Highest Percentage of Population Employed in Real Estate, Rental & Leasing in Seneca, SC are:
What zip code has the Highest Percentage of Population Employed in Real Estate, Rental & Leasing in Seneca, SC?
29678 has the Highest Percentage of Population Employed in Real Estate, Rental & Leasing in Seneca, SC with 3.6%.
What is the Percentage of Population Employed in Real Estate, Rental & Leasing in Seneca, SC?
Percentage of Population Employed in Real Estate, Rental & Leasing in Seneca is 2.6%.
What is the Percentage of Population Employed in Real Estate, Rental & Leasing in South Carolina?
Percentage of Population Employed in Real Estate, Rental & Leasing in South Carolina is 2.0%.
What is the Percentage of Population Employed in Real Estate, Rental & Leasing in the United States?
Percentage of Population Employed in Real Estate, Rental & Leasing in the United States is 1.9%.