Zip Codes with the Highest Percentage of Population Employed in Real Estate, Rental & Leasing in Spartanburg, SC

RELATED REPORTS & OPTIONS

Real Estate, Rental & Leasing
Population
Families and Households
Female Fertility
Female Fertility (Unmarried)
Race (Community Size)
Race (Percentage)
Ancestry (Community Size)
AfricanAlbanianAmericanArabArgentineanArmenianAustrianBahamianBangladeshiBhutaneseBlackfeetBrazilianBritishBulgarianBurmeseCanadianCentral AmericanCentral American IndianCherokeeChileanChippewaColombianCosta RicanCroatianCubanCzechCzechoslovakianDanishDominicanDutchEastern EuropeanEcuadorianEnglishEthiopianEuropeanFinnishFrenchFrench CanadianGermanGreekGuatemalanHaitianHonduranHungarianIndian (Asian)IrishItalianJamaicanJapaneseKenyanKoreanLebaneseLithuanianLumbeeMalaysianMexicanNative HawaiianNicaraguanNigerianNorthern EuropeanNorwegianPakistaniPolishPortuguesePuerto RicanRomanianRussianSalvadoranSamoanScandinavianScotch-IrishScottishSeminoleSiouxSlovakSouth AfricanSouth AmericanSpaniardSpanishSri LankanSubsaharan AfricanSwedishSwissThaiTrinidadian and TobagonianUgandanUkrainianVenezuelanWelshWest Indian
Ancestry (Percentage)
AfricanAlbanianAmericanArabArgentineanArmenianAustrianBahamianBangladeshiBhutaneseBlackfeetBrazilianBritishBulgarianBurmeseCanadianCentral AmericanCentral American IndianCherokeeChileanChippewaColombianCosta RicanCroatianCubanCzechCzechoslovakianDanishDominicanDutchEastern EuropeanEcuadorianEnglishEthiopianEuropeanFinnishFrenchFrench CanadianGermanGreekGuatemalanHaitianHonduranHungarianIndian (Asian)IrishItalianJamaicanJapaneseKenyanKoreanLebaneseLithuanianLumbeeMalaysianMexicanNative HawaiianNicaraguanNigerianNorthern EuropeanNorwegianPakistaniPolishPortuguesePuerto RicanRomanianRussianSalvadoranSamoanScandinavianScotch-IrishScottishSeminoleSiouxSlovakSouth AfricanSouth AmericanSpaniardSpanishSri LankanSubsaharan AfricanSwedishSwissThaiTrinidadian and TobagonianUgandanUkrainianVenezuelanWelshWest Indian
Immigrant Origin (Total)
Immigrant Origin (Percentage)
Income
Income (Families)
Income (Households)
Poverty
Poverty (Families)
Unemployment
Employment Occupations
Employment Industries
Employer Class
Commute Time
Commute Means
School Enrollment
Education by Degree Field
Occupancy
Finances
Physical Characteristics
Spartanburg
Compare Zip Codes
Comparison Subject

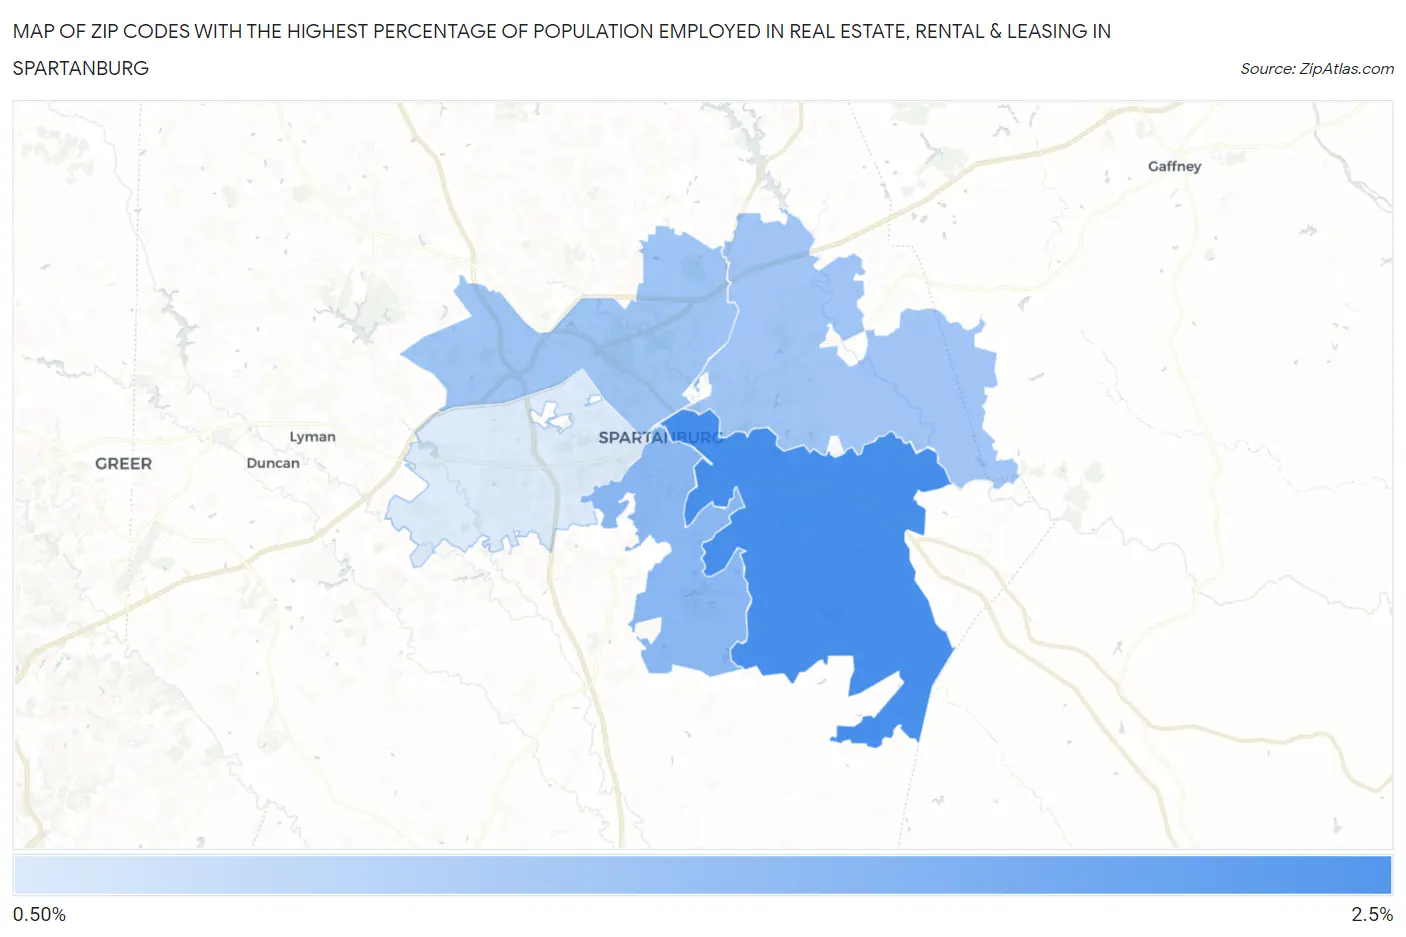
Map of Zip Codes with the Highest Percentage of Population Employed in Real Estate, Rental & Leasing in Spartanburg

0.0%
2.5%
Zip Codes with the Highest Percentage of Population Employed in Real Estate, Rental & Leasing in Spartanburg Map

Zip Codes with the Highest Percentage of Population Employed in Real Estate, Rental & Leasing in Spartanburg, SC

Zip Code % Employed vs State vs National
1.293022.1%2.0%(+0.107)#1041.9%(+0.177)#7,479
2.293061.4%2.0%(-0.512)#1571.9%(-0.442)#11,582
3.293031.3%2.0%(-0.696)#1711.9%(-0.626)#12,987
4.293071.2%2.0%(-0.721)#1731.9%(-0.651)#13,155
5.293010.69%2.0%(-1.27)#2311.9%(-1.20)#17,538

Common Questions

What are the Top 3 Zip Codes with the Highest Percentage of Population Employed in Real Estate, Rental & Leasing in Spartanburg, SC?
Top 3 Zip Codes with the Highest Percentage of Population Employed in Real Estate, Rental & Leasing in Spartanburg, SC are:
#1
2.1%
#2
1.4%
#3
1.3%
What zip code has the Highest Percentage of Population Employed in Real Estate, Rental & Leasing in Spartanburg, SC?
29302 has the Highest Percentage of Population Employed in Real Estate, Rental & Leasing in Spartanburg, SC with 2.1%.
What is the Percentage of Population Employed in Real Estate, Rental & Leasing in Spartanburg, SC?
Percentage of Population Employed in Real Estate, Rental & Leasing in Spartanburg is 1.6%.
What is the Percentage of Population Employed in Real Estate, Rental & Leasing in South Carolina?
Percentage of Population Employed in Real Estate, Rental & Leasing in South Carolina is 2.0%.
What is the Percentage of Population Employed in Real Estate, Rental & Leasing in the United States?
Percentage of Population Employed in Real Estate, Rental & Leasing in the United States is 1.9%.