Shoshone vs American Married-Couple Family Poverty
COMPARE
Shoshone
American
Married-Couple Family Poverty
Married-Couple Family Poverty Comparison
Shoshone
Americans
6.1%
MARRIED-COUPLE FAMILY POVERTY
0.3/ 100
METRIC RATING
262nd/ 347
METRIC RANK
5.3%
MARRIED-COUPLE FAMILY POVERTY
35.4/ 100
METRIC RATING
185th/ 347
METRIC RANK
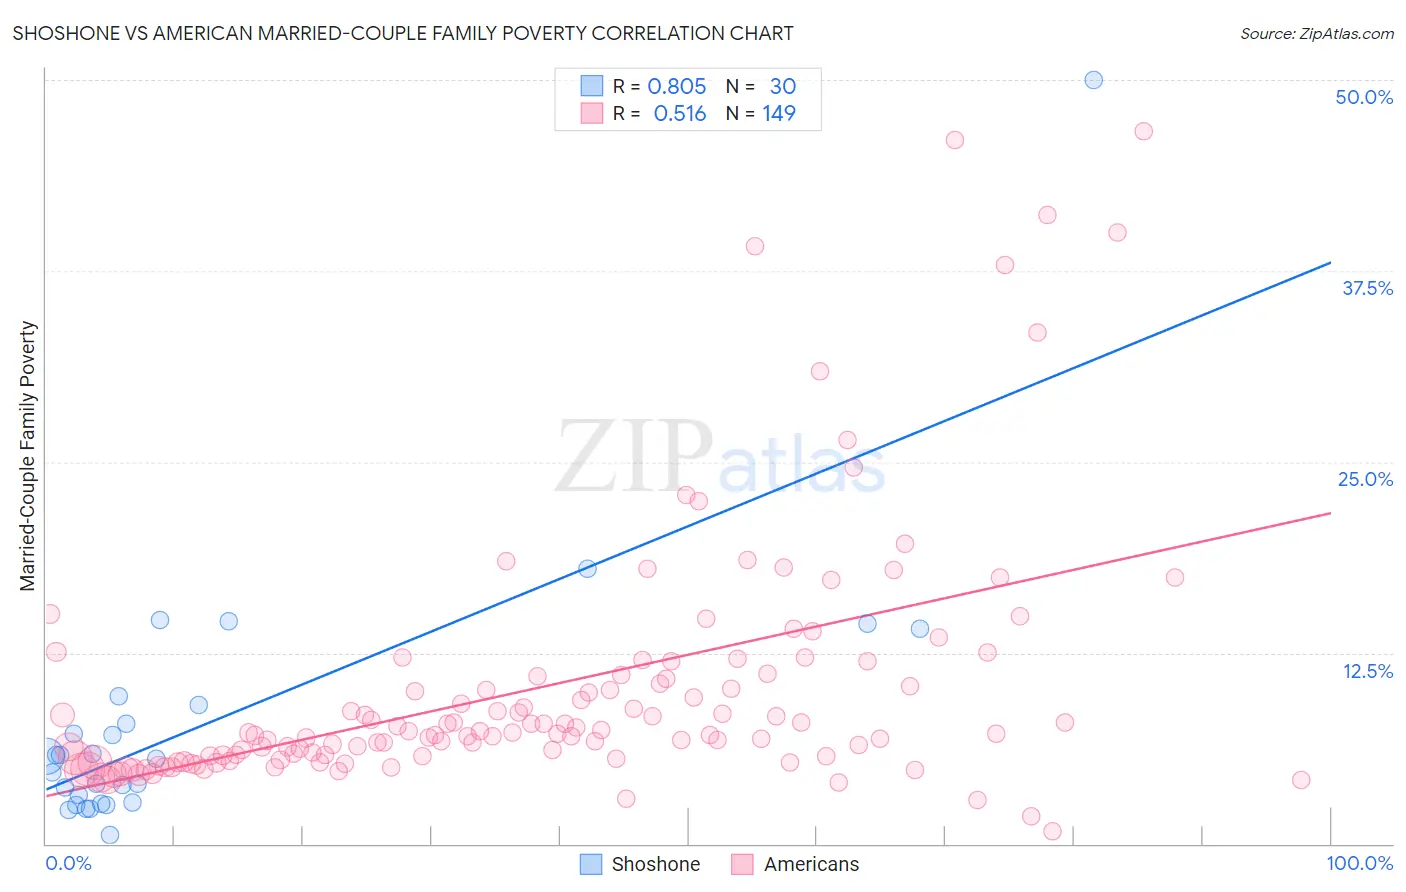
Shoshone vs American Married-Couple Family Poverty Correlation Chart
The statistical analysis conducted on geographies consisting of 66,505,445 people shows a very strong positive correlation between the proportion of Shoshone and poverty level among married-couple families in the United States with a correlation coefficient (R) of 0.805 and weighted average of 6.1%. Similarly, the statistical analysis conducted on geographies consisting of 565,642,626 people shows a substantial positive correlation between the proportion of Americans and poverty level among married-couple families in the United States with a correlation coefficient (R) of 0.516 and weighted average of 5.3%, a difference of 14.9%.
Married-Couple Family Poverty Correlation Summary
| Measurement | Shoshone | American |
| Minimum | 0.60% | 0.81% |
| Maximum | 50.0% | 46.7% |
| Range | 49.4% | 45.9% |
| Mean | 7.9% | 10.2% |
| Median | 5.6% | 7.2% |
| Interquartile 25% (IQ1) | 2.7% | 5.6% |
| Interquartile 75% (IQ3) | 9.1% | 11.0% |
| Interquartile Range (IQR) | 6.4% | 5.4% |
| Standard Deviation (Sample) | 9.2% | 8.4% |
| Standard Deviation (Population) | 9.0% | 8.3% |
Similar Demographics by Married-Couple Family Poverty
Demographics Similar to Shoshone by Married-Couple Family Poverty
In terms of married-couple family poverty, the demographic groups most similar to Shoshone are Senegalese (6.1%, a difference of 0.21%), Immigrants from Senegal (6.1%, a difference of 0.39%), Jamaican (6.1%, a difference of 0.40%), Alaskan Athabascan (6.1%, a difference of 0.61%), and Immigrants from Congo (6.1%, a difference of 0.62%).
| Demographics | Rating | Rank | Married-Couple Family Poverty |
| Comanche | 0.7 /100 | #255 | Tragic 6.0% |
| Bangladeshis | 0.5 /100 | #256 | Tragic 6.0% |
| Immigrants | Burma/Myanmar | 0.5 /100 | #257 | Tragic 6.0% |
| Immigrants | Immigrants | 0.5 /100 | #258 | Tragic 6.0% |
| Alaskan Athabascans | 0.4 /100 | #259 | Tragic 6.1% |
| Jamaicans | 0.3 /100 | #260 | Tragic 6.1% |
| Senegalese | 0.3 /100 | #261 | Tragic 6.1% |
| Shoshone | 0.3 /100 | #262 | Tragic 6.1% |
| Immigrants | Senegal | 0.3 /100 | #263 | Tragic 6.1% |
| Immigrants | Congo | 0.2 /100 | #264 | Tragic 6.1% |
| Blackfeet | 0.2 /100 | #265 | Tragic 6.2% |
| Creek | 0.2 /100 | #266 | Tragic 6.2% |
| Spanish Americans | 0.2 /100 | #267 | Tragic 6.2% |
| Alaska Natives | 0.2 /100 | #268 | Tragic 6.2% |
| Immigrants | West Indies | 0.1 /100 | #269 | Tragic 6.2% |
Demographics Similar to Americans by Married-Couple Family Poverty
In terms of married-couple family poverty, the demographic groups most similar to Americans are Nonimmigrants (5.3%, a difference of 0.060%), Hungarian (5.3%, a difference of 0.080%), Immigrants from Albania (5.3%, a difference of 0.19%), Peruvian (5.3%, a difference of 0.28%), and Israeli (5.3%, a difference of 0.28%).
| Demographics | Rating | Rank | Married-Couple Family Poverty |
| Immigrants | Ukraine | 44.9 /100 | #178 | Average 5.2% |
| Spanish | 41.4 /100 | #179 | Average 5.3% |
| Immigrants | Sierra Leone | 39.3 /100 | #180 | Fair 5.3% |
| Immigrants | Chile | 38.8 /100 | #181 | Fair 5.3% |
| Immigrants | Vietnam | 37.7 /100 | #182 | Fair 5.3% |
| Peruvians | 37.6 /100 | #183 | Fair 5.3% |
| Immigrants | Nonimmigrants | 35.8 /100 | #184 | Fair 5.3% |
| Americans | 35.4 /100 | #185 | Fair 5.3% |
| Hungarians | 34.7 /100 | #186 | Fair 5.3% |
| Immigrants | Albania | 33.8 /100 | #187 | Fair 5.3% |
| Israelis | 33.1 /100 | #188 | Fair 5.3% |
| South American Indians | 32.5 /100 | #189 | Fair 5.3% |
| Ugandans | 31.6 /100 | #190 | Fair 5.3% |
| Immigrants | Cabo Verde | 30.9 /100 | #191 | Fair 5.3% |
| Cape Verdeans | 30.7 /100 | #192 | Fair 5.3% |