Samoan Disability Age 5 to 17
COMPARE
Samoan
Select to Compare
Disability Age 5 to 17
Samoan Disability Age 5 to 17
5.5%
DISABILITY | AGE 5 TO 17
81.9/ 100
METRIC RATING
148th/ 347
METRIC RANK
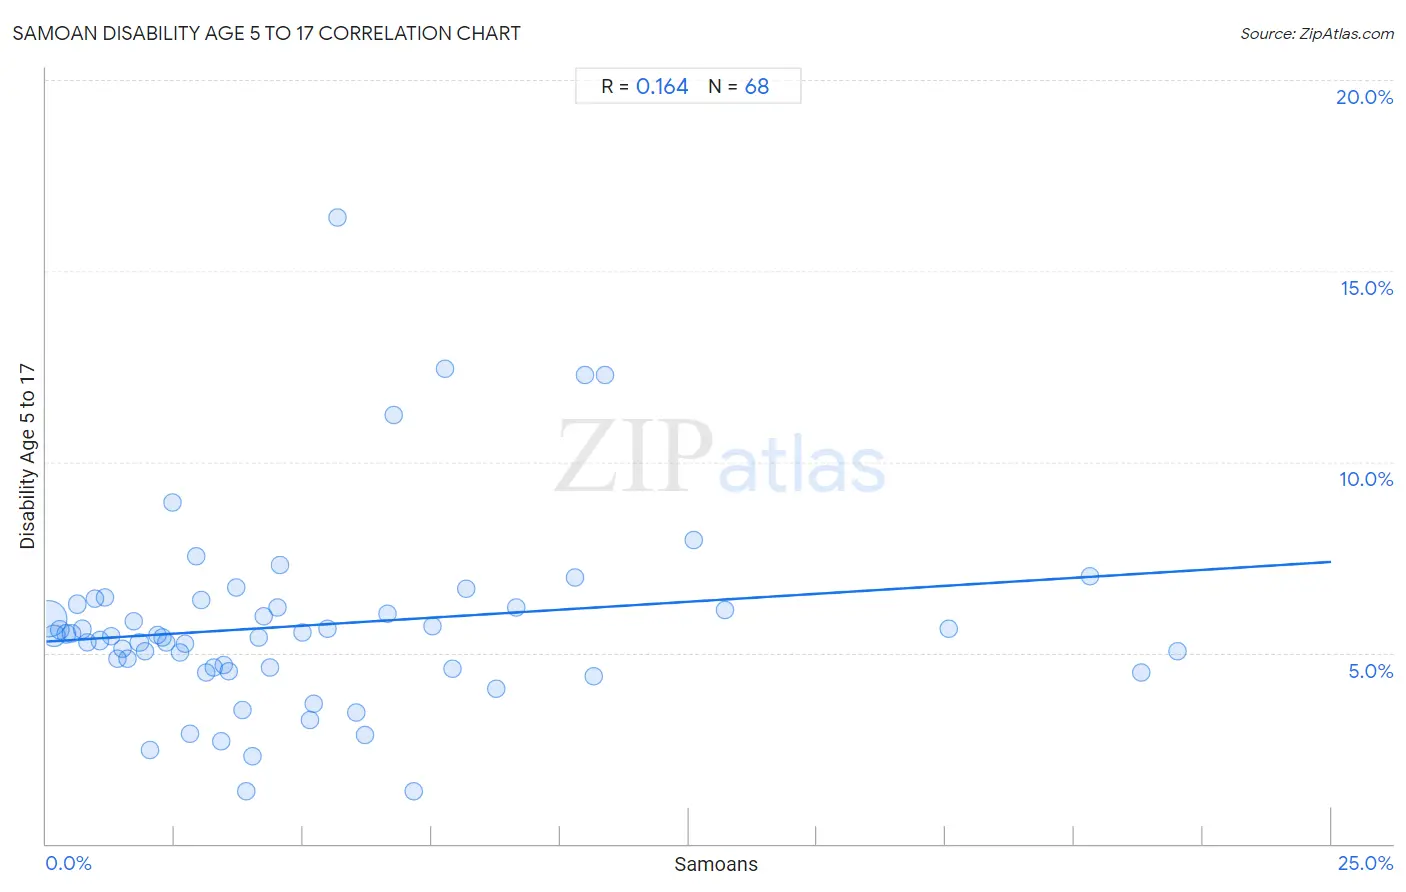
Samoan Disability Age 5 to 17 Correlation Chart
The statistical analysis conducted on geographies consisting of 224,375,903 people shows a poor positive correlation between the proportion of Samoans and percentage of population with a disability between the ages 5 and 17 in the United States with a correlation coefficient (R) of 0.164 and weighted average of 5.5%. On average, for every 1% (one percent) increase in Samoans within a typical geography, there is an increase of 0.083% in percentage of population with a disability between the ages 5 and 17.
It is essential to understand that the correlation between the percentage of Samoans and percentage of population with a disability between the ages 5 and 17 does not imply a direct cause-and-effect relationship. It remains uncertain whether the presence of Samoans influences an upward or downward trend in the level of percentage of population with a disability between the ages 5 and 17 within an area, or if Samoans simply ended up residing in those areas with higher or lower levels of percentage of population with a disability between the ages 5 and 17 due to other factors.
Demographics Similar to Samoans by Disability Age 5 to 17
In terms of disability age 5 to 17, the demographic groups most similar to Samoans are Central American (5.5%, a difference of 0.030%), Guatemalan (5.5%, a difference of 0.030%), Immigrants from Albania (5.5%, a difference of 0.10%), Estonian (5.5%, a difference of 0.10%), and Ute (5.5%, a difference of 0.11%).
| Demographics | Rating | Rank | Disability Age 5 to 17 |
| South American Indians | 89.3 /100 | #141 | Excellent 5.5% |
| Colombians | 88.0 /100 | #142 | Excellent 5.5% |
| Immigrants from Hungary | 87.9 /100 | #143 | Excellent 5.5% |
| Pakistanis | 87.3 /100 | #144 | Excellent 5.5% |
| Immigrants from Guatemala | 86.6 /100 | #145 | Excellent 5.5% |
| Albanians | 83.7 /100 | #146 | Excellent 5.5% |
| Immigrants from Albania | 83.1 /100 | #147 | Excellent 5.5% |
| Samoans | 81.9 /100 | #148 | Excellent 5.5% |
| Central Americans | 81.6 /100 | #149 | Excellent 5.5% |
| Guatemalans | 81.5 /100 | #150 | Excellent 5.5% |
| Estonians | 80.8 /100 | #151 | Excellent 5.5% |
| Ute | 80.6 /100 | #152 | Excellent 5.5% |
| Ecuadorians | 79.7 /100 | #153 | Good 5.5% |
| Australians | 78.8 /100 | #154 | Good 5.5% |
| Immigrants from Ecuador | 78.3 /100 | #155 | Good 5.5% |
Samoan Disability Age 5 to 17 Correlation Summary
| Measurement | Samoan Data | Disability Age 5 to 17 Data |
| Minimum | 0.040% | 1.4% |
| Maximum | 22.0% | 16.4% |
| Range | 22.0% | 15.0% |
| Mean | 5.2% | 5.7% |
| Median | 3.8% | 5.4% |
| Interquartile 25% (IQ1) | 1.9% | 4.6% |
| Interquartile 75% (IQ3) | 7.0% | 6.2% |
| Interquartile Range (IQR) | 5.1% | 1.6% |
| Standard Deviation (Sample) | 5.0% | 2.5% |
| Standard Deviation (Population) | 4.9% | 2.5% |
Correlation Details
| Samoan Percentile | Sample Size | Disability Age 5 to 17 |
[ 0.0% - 0.5% ] 0.040% | 145,209,822 | 5.9% |
[ 0.0% - 0.5% ] 0.15% | 35,575,539 | 5.4% |
[ 0.0% - 0.5% ] 0.26% | 12,834,071 | 5.6% |
[ 0.0% - 0.5% ] 0.38% | 8,634,123 | 5.5% |
[ 0.0% - 0.5% ] 0.49% | 5,554,750 | 5.5% |
[ 0.5% - 1.0% ] 0.60% | 3,126,846 | 6.3% |
[ 0.5% - 1.0% ] 0.71% | 2,372,842 | 5.6% |
[ 0.5% - 1.0% ] 0.81% | 2,030,678 | 5.3% |
[ 0.5% - 1.0% ] 0.94% | 1,410,168 | 6.4% |
[ 1.0% - 1.5% ] 1.05% | 1,086,224 | 5.3% |
[ 1.0% - 1.5% ] 1.14% | 839,900 | 6.5% |
[ 1.0% - 1.5% ] 1.27% | 682,015 | 5.4% |
[ 1.0% - 1.5% ] 1.38% | 685,649 | 4.8% |
[ 1.0% - 1.5% ] 1.49% | 267,548 | 5.1% |
[ 1.5% - 2.0% ] 1.58% | 435,350 | 4.9% |
[ 1.5% - 2.0% ] 1.70% | 376,224 | 5.8% |
[ 1.5% - 2.0% ] 1.81% | 308,793 | 5.3% |
[ 1.5% - 2.0% ] 1.93% | 247,842 | 5.1% |
[ 2.0% - 2.5% ] 2.01% | 164,145 | 2.4% |
[ 2.0% - 2.5% ] 2.16% | 197,089 | 5.5% |
[ 2.0% - 2.5% ] 2.26% | 445,646 | 5.4% |
[ 2.0% - 2.5% ] 2.35% | 44,337 | 5.3% |
[ 2.0% - 2.5% ] 2.46% | 78,160 | 8.9% |
[ 2.5% - 3.0% ] 2.61% | 373,000 | 5.0% |
[ 2.5% - 3.0% ] 2.69% | 168,635 | 5.3% |
[ 2.5% - 3.0% ] 2.80% | 23,970 | 2.9% |
[ 2.5% - 3.0% ] 2.91% | 60,518 | 7.5% |
[ 3.0% - 3.5% ] 3.02% | 68,537 | 6.4% |
[ 3.0% - 3.5% ] 3.11% | 55,856 | 4.5% |
[ 3.0% - 3.5% ] 3.26% | 103,784 | 4.6% |
[ 3.0% - 3.5% ] 3.40% | 39,480 | 2.7% |
[ 3.0% - 3.5% ] 3.46% | 117,983 | 4.7% |
[ 3.5% - 4.0% ] 3.56% | 61,753 | 4.5% |
[ 3.5% - 4.0% ] 3.69% | 46,670 | 6.7% |
[ 3.5% - 4.0% ] 3.82% | 41,455 | 3.5% |
[ 3.5% - 4.0% ] 3.90% | 13,392 | 1.4% |
[ 4.0% - 4.5% ] 4.02% | 27,942 | 2.3% |
[ 4.0% - 4.5% ] 4.13% | 73,906 | 5.4% |
[ 4.0% - 4.5% ] 4.23% | 41,733 | 6.0% |
[ 4.0% - 4.5% ] 4.36% | 15,480 | 4.6% |
[ 4.0% - 4.5% ] 4.49% | 5,905 | 6.2% |
[ 4.5% - 5.0% ] 4.55% | 13,705 | 7.3% |
[ 4.5% - 5.0% ] 4.99% | 23,108 | 5.5% |
[ 5.0% - 5.5% ] 5.13% | 36,331 | 3.2% |
[ 5.0% - 5.5% ] 5.21% | 57,907 | 3.7% |
[ 5.0% - 5.5% ] 5.47% | 25,427 | 5.6% |
[ 5.5% - 6.0% ] 5.67% | 7,903 | 16.4% |
[ 6.0% - 6.5% ] 6.04% | 72,324 | 3.4% |
[ 6.0% - 6.5% ] 6.21% | 11,276 | 2.9% |
[ 6.5% - 7.0% ] 6.65% | 7,551 | 6.0% |
[ 6.5% - 7.0% ] 6.76% | 281 | 11.2% |
[ 7.0% - 7.5% ] 7.14% | 5,743 | 1.4% |
[ 7.5% - 8.0% ] 7.51% | 17,628 | 5.7% |
[ 7.5% - 8.0% ] 7.76% | 2,564 | 12.4% |
[ 7.5% - 8.0% ] 7.90% | 51,367 | 4.6% |
[ 8.0% - 8.5% ] 8.17% | 465 | 6.7% |
[ 8.5% - 9.0% ] 8.74% | 10,042 | 4.0% |
[ 9.0% - 9.5% ] 9.14% | 38,142 | 6.2% |
[ 10.0% - 10.5% ] 10.30% | 4,555 | 7.0% |
[ 10.0% - 10.5% ] 10.49% | 391 | 12.3% |
[ 10.5% - 11.0% ] 10.66% | 5,921 | 4.4% |
[ 10.5% - 11.0% ] 10.88% | 377 | 12.3% |
[ 12.5% - 13.0% ] 12.61% | 3,593 | 7.9% |
[ 13.0% - 13.5% ] 13.21% | 12,370 | 6.1% |
[ 17.5% - 18.0% ] 17.56% | 5,713 | 5.6% |
[ 20.0% - 20.5% ] 20.32% | 2,274 | 7.0% |
[ 21.0% - 21.5% ] 21.30% | 5,774 | 4.5% |
[ 22.0% - 22.5% ] 22.01% | 5,411 | 5.0% |