Samoan Married-couple Households
COMPARE
Samoan
Select to Compare
Married-couple Households
Samoan Married-couple Households
48.7%
MARRIED-COUPLE HOUSEHOLDS
99.4/ 100
METRIC RATING
50th/ 347
METRIC RANK
Samoan Married-couple Households Correlation Chart
The statistical analysis conducted on geographies consisting of 225,069,551 people shows a slight positive correlation between the proportion of Samoans and percentage of married-couple family households in the United States with a correlation coefficient (R) of 0.091 and weighted average of 48.7%. On average, for every 1% (one percent) increase in Samoans within a typical geography, there is an increase of 0.14% in percentage of married-couple family households.
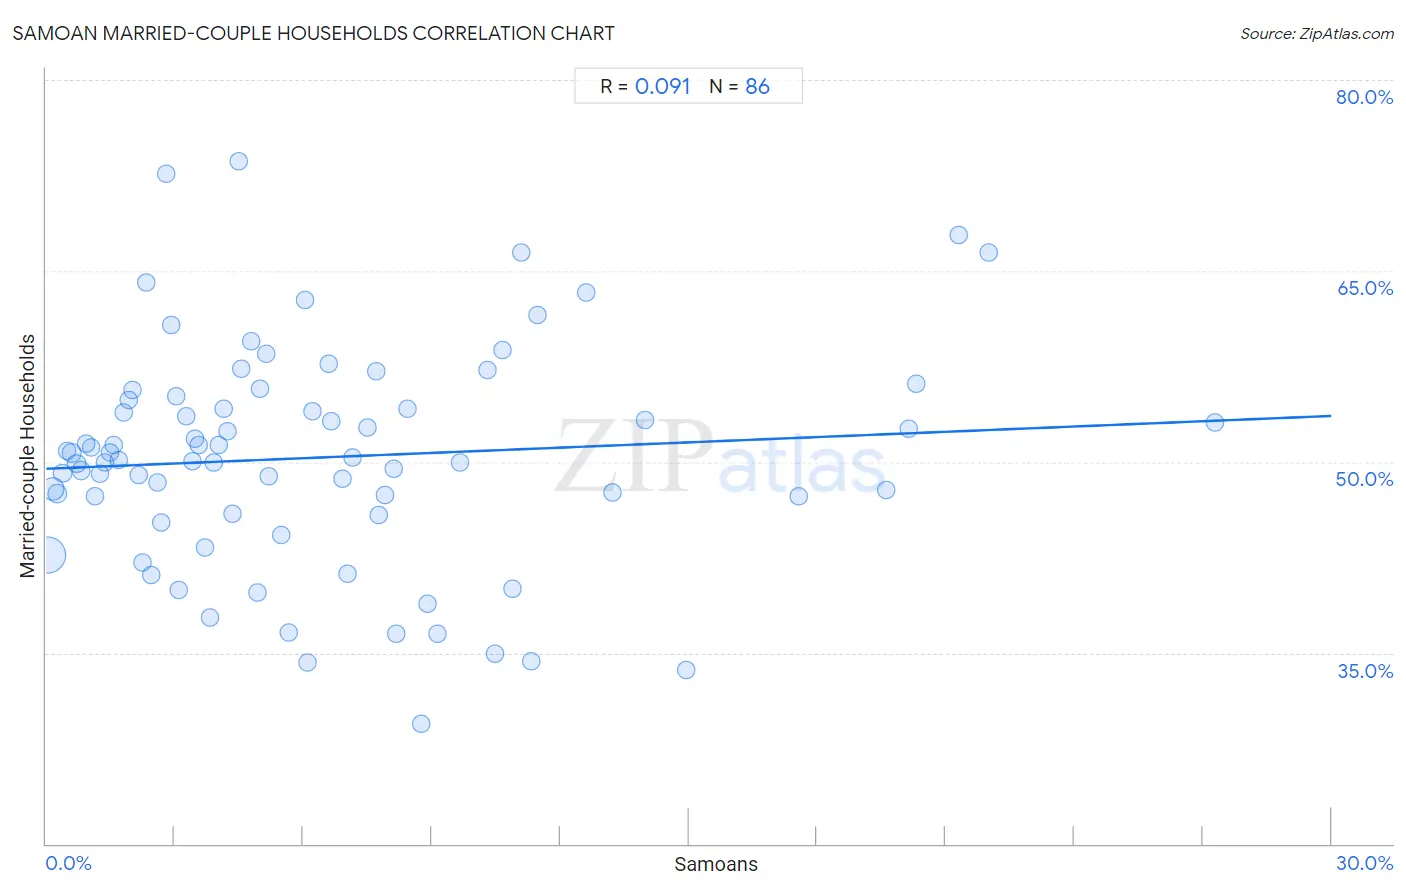
It is essential to understand that the correlation between the percentage of Samoans and percentage of married-couple family households does not imply a direct cause-and-effect relationship. It remains uncertain whether the presence of Samoans influences an upward or downward trend in the level of percentage of married-couple family households within an area, or if Samoans simply ended up residing in those areas with higher or lower levels of percentage of married-couple family households due to other factors.
Demographics Similar to Samoans by Married-couple Households
In terms of married-couple households, the demographic groups most similar to Samoans are Immigrants from Sri Lanka (48.7%, a difference of 0.040%), Eastern European (48.6%, a difference of 0.040%), Irish (48.6%, a difference of 0.080%), Indian (Asian) (48.7%, a difference of 0.10%), and White/Caucasian (48.6%, a difference of 0.13%).
| Demographics | Rating | Rank | Married-couple Households |
| Immigrants from Iran | 99.6 /100 | #43 | Exceptional 48.8% |
| Welsh | 99.5 /100 | #44 | Exceptional 48.8% |
| Immigrants from Eastern Asia | 99.5 /100 | #45 | Exceptional 48.8% |
| Tsimshian | 99.5 /100 | #46 | Exceptional 48.7% |
| British | 99.5 /100 | #47 | Exceptional 48.7% |
| Indians (Asian) | 99.4 /100 | #48 | Exceptional 48.7% |
| Immigrants from Sri Lanka | 99.4 /100 | #49 | Exceptional 48.7% |
| Samoans | 99.4 /100 | #50 | Exceptional 48.7% |
| Eastern Europeans | 99.3 /100 | #51 | Exceptional 48.6% |
| Irish | 99.3 /100 | #52 | Exceptional 48.6% |
| Whites/Caucasians | 99.3 /100 | #53 | Exceptional 48.6% |
| Immigrants from Lithuania | 99.3 /100 | #54 | Exceptional 48.6% |
| Austrians | 99.3 /100 | #55 | Exceptional 48.6% |
| Immigrants from Northern Europe | 99.3 /100 | #56 | Exceptional 48.6% |
| Poles | 99.2 /100 | #57 | Exceptional 48.5% |
Samoan Married-couple Households Correlation Summary
| Measurement | Samoan Data | Married-couple Households Data |
| Minimum | 0.040% | 29.5% |
| Maximum | 27.3% | 73.6% |
| Range | 27.2% | 44.2% |
| Mean | 6.5% | 50.4% |
| Median | 4.9% | 50.2% |
| Interquartile 25% (IQ1) | 2.3% | 45.9% |
| Interquartile 75% (IQ3) | 8.7% | 54.9% |
| Interquartile Range (IQR) | 6.4% | 9.0% |
| Standard Deviation (Sample) | 5.7% | 8.7% |
| Standard Deviation (Population) | 5.7% | 8.7% |
Correlation Details
| Samoan Percentile | Sample Size | Married-couple Households |
[ 0.0% - 0.5% ] 0.040% | 145,328,712 | 42.7% |
[ 0.0% - 0.5% ] 0.15% | 35,691,256 | 47.9% |
[ 0.0% - 0.5% ] 0.26% | 12,932,935 | 47.5% |
[ 0.0% - 0.5% ] 0.38% | 8,689,423 | 49.1% |
[ 0.0% - 0.5% ] 0.49% | 5,647,686 | 50.9% |
[ 0.5% - 1.0% ] 0.60% | 3,153,614 | 50.7% |
[ 0.5% - 1.0% ] 0.71% | 2,402,743 | 49.8% |
[ 0.5% - 1.0% ] 0.81% | 2,045,634 | 49.3% |
[ 0.5% - 1.0% ] 0.94% | 1,418,989 | 51.4% |
[ 1.0% - 1.5% ] 1.05% | 1,092,687 | 51.2% |
[ 1.0% - 1.5% ] 1.14% | 855,609 | 47.3% |
[ 1.0% - 1.5% ] 1.27% | 685,598 | 49.1% |
[ 1.0% - 1.5% ] 1.38% | 699,716 | 50.0% |
[ 1.0% - 1.5% ] 1.49% | 271,068 | 50.8% |
[ 1.5% - 2.0% ] 1.58% | 439,511 | 51.3% |
[ 1.5% - 2.0% ] 1.71% | 390,439 | 50.2% |
[ 1.5% - 2.0% ] 1.81% | 313,885 | 53.9% |
[ 1.5% - 2.0% ] 1.93% | 257,599 | 54.9% |
[ 2.0% - 2.5% ] 2.02% | 165,009 | 55.6% |
[ 2.0% - 2.5% ] 2.16% | 205,301 | 48.9% |
[ 2.0% - 2.5% ] 2.26% | 446,400 | 42.1% |
[ 2.0% - 2.5% ] 2.35% | 44,337 | 64.1% |
[ 2.0% - 2.5% ] 2.46% | 78,279 | 41.1% |
[ 2.5% - 3.0% ] 2.61% | 373,158 | 48.4% |
[ 2.5% - 3.0% ] 2.69% | 172,844 | 45.2% |
[ 2.5% - 3.0% ] 2.80% | 25,082 | 72.7% |
[ 2.5% - 3.0% ] 2.91% | 60,518 | 60.7% |
[ 3.0% - 3.5% ] 3.02% | 68,537 | 55.2% |
[ 3.0% - 3.5% ] 3.11% | 56,437 | 40.0% |
[ 3.0% - 3.5% ] 3.26% | 103,784 | 53.6% |
[ 3.0% - 3.5% ] 3.40% | 39,480 | 50.0% |
[ 3.0% - 3.5% ] 3.47% | 119,589 | 51.8% |
[ 3.5% - 4.0% ] 3.56% | 61,891 | 51.4% |
[ 3.5% - 4.0% ] 3.70% | 51,223 | 43.3% |
[ 3.5% - 4.0% ] 3.82% | 41,455 | 37.8% |
[ 3.5% - 4.0% ] 3.90% | 14,251 | 50.0% |
[ 4.0% - 4.5% ] 4.02% | 27,942 | 51.3% |
[ 4.0% - 4.5% ] 4.13% | 74,292 | 54.2% |
[ 4.0% - 4.5% ] 4.23% | 43,061 | 52.4% |
[ 4.0% - 4.5% ] 4.36% | 17,867 | 45.9% |
[ 4.0% - 4.5% ] 4.49% | 5,905 | 73.6% |
[ 4.5% - 5.0% ] 4.55% | 13,705 | 57.3% |
[ 4.5% - 5.0% ] 4.78% | 3,741 | 59.5% |
[ 4.5% - 5.0% ] 4.93% | 365 | 39.8% |
[ 4.5% - 5.0% ] 4.99% | 28,173 | 55.8% |
[ 5.0% - 5.5% ] 5.12% | 36,489 | 58.5% |
[ 5.0% - 5.5% ] 5.21% | 57,907 | 48.8% |
[ 5.0% - 5.5% ] 5.47% | 25,427 | 44.2% |
[ 5.5% - 6.0% ] 5.67% | 8,205 | 36.6% |
[ 6.0% - 6.5% ] 6.04% | 72,324 | 62.8% |
[ 6.0% - 6.5% ] 6.11% | 229 | 34.2% |
[ 6.0% - 6.5% ] 6.21% | 11,373 | 54.0% |
[ 6.5% - 7.0% ] 6.60% | 2,122 | 57.7% |
[ 6.5% - 7.0% ] 6.65% | 7,551 | 53.2% |
[ 6.5% - 7.0% ] 6.93% | 101 | 48.7% |
[ 7.0% - 7.5% ] 7.04% | 696 | 41.2% |
[ 7.0% - 7.5% ] 7.14% | 5,743 | 50.3% |
[ 7.5% - 8.0% ] 7.51% | 17,628 | 52.7% |
[ 7.5% - 8.0% ] 7.69% | 182 | 57.1% |
[ 7.5% - 8.0% ] 7.76% | 2,744 | 45.8% |
[ 7.5% - 8.0% ] 7.90% | 51,367 | 47.4% |
[ 8.0% - 8.5% ] 8.11% | 3,909 | 49.5% |
[ 8.0% - 8.5% ] 8.17% | 465 | 36.5% |
[ 8.0% - 8.5% ] 8.44% | 237 | 54.1% |
[ 8.5% - 9.0% ] 8.74% | 10,042 | 29.5% |
[ 8.5% - 9.0% ] 8.91% | 3,188 | 38.8% |
[ 9.0% - 9.5% ] 9.14% | 38,142 | 36.5% |
[ 9.5% - 10.0% ] 9.67% | 331 | 50.0% |
[ 10.0% - 10.5% ] 10.30% | 4,555 | 57.2% |
[ 10.0% - 10.5% ] 10.48% | 620 | 35.0% |
[ 10.5% - 11.0% ] 10.66% | 6,606 | 58.8% |
[ 10.5% - 11.0% ] 10.88% | 377 | 40.0% |
[ 11.0% - 11.5% ] 11.09% | 649 | 66.4% |
[ 11.0% - 11.5% ] 11.33% | 256 | 34.3% |
[ 11.0% - 11.5% ] 11.46% | 759 | 61.6% |
[ 12.5% - 13.0% ] 12.61% | 3,593 | 63.3% |
[ 13.0% - 13.5% ] 13.21% | 12,370 | 47.6% |
[ 13.5% - 14.0% ] 13.99% | 143 | 53.3% |
[ 14.5% - 15.0% ] 14.96% | 341 | 33.7% |
[ 17.5% - 18.0% ] 17.56% | 5,713 | 47.3% |
[ 19.5% - 20.0% ] 19.60% | 1,949 | 47.8% |
[ 20.0% - 20.5% ] 20.14% | 1,897 | 52.6% |
[ 20.0% - 20.5% ] 20.32% | 2,274 | 56.1% |
[ 21.0% - 21.5% ] 21.30% | 5,774 | 67.8% |
[ 22.0% - 22.5% ] 22.01% | 5,411 | 66.5% |
[ 27.0% - 27.5% ] 27.27% | 132 | 53.1% |