Paiute 1 or more Vehicles in Household

COMPARE

Paiute
Race
Ancestry
AfghanAfricanAlaska NativeAlaskan AthabascanAlbanianAleutAlsatianAmericanApacheArabArapahoArgentineanArmenianAssyrian/Chaldean/SyriacAustralianAustrianBahamianBangladeshiBarbadianBasqueBelgianBelizeanBermudanBhutaneseBlackfeetBolivianBrazilianBritishBritish West IndianBulgarianBurmeseCajunCambodianCanadianCape VerdeanCarpatho RusynCelticCentral AmericanCentral American IndianCherokeeCheyenneChickasawChileanChineseChippewaChoctawColombianColvilleComancheCosta RicanCreeCreekCroatianCrowCubanCypriotCzechCzechoslovakianDanishDelawareDominicanDutchDutch West IndianEastern EuropeanEcuadorianEgyptianEnglishEstonianEthiopianEuropeanFijianFilipinoFinnishFrenchFrench American IndianFrench CanadianGermanGerman RussianGhanaianGreekGuamanian/ChamorroGuatemalanGuyaneseHaitianHmongHonduranHopiHoumaHungarianIcelanderIndian (Asian)IndonesianInupiatIranianIraqiIrishIroquoisIsraeliItalianJamaicanJapaneseJordanianKenyanKiowaKoreanLaotianLatvianLebaneseLiberianLithuanianLumbeeLuxembourgerMacedonianMalaysianMalteseMarshalleseMenomineeMexicanMexican American IndianMongolianMoroccanNative HawaiianNavajoNepaleseNew ZealanderNicaraguanNigerianNorthern EuropeanNorwegianOkinawanOsageOttawaPaiutePakistaniPalestinianPanamanianParaguayanPennsylvania GermanPeruvianPimaPolishPortuguesePotawatomiPuebloPuerto RicanPuget Sound SalishRomanianRussianSalvadoranSamoanScandinavianScotch-IrishScottishSeminoleSenegaleseSerbianShoshoneSierra LeoneanSiouxSlavicSlovakSloveneSomaliSouth AfricanSouth AmericanSouth American IndianSoviet UnionSpaniardSpanishSpanish AmericanSpanish American IndianSri LankanSubsaharan AfricanSudaneseSwedishSwissSyrianTaiwaneseThaiTlingit-HaidaTohono O'OdhamTonganTrinidadian and TobagonianTsimshianTurkishU.S. Virgin IslanderUgandanUkrainianUruguayanUteVenezuelanVietnameseWelshWest IndianYakamaYaquiYugoslavianYumanYup'ikZimbabwean
Immigration
NonimmigrantsImmigrantsAfghanistanAfricaAlbaniaArgentinaArmeniaAsiaAustraliaAustriaBahamasBangladeshBarbadosBelarusBelgiumBelizeBoliviaBosnia and HerzegovinaBrazilBulgariaBurma/MyanmarCabo VerdeCambodiaCameroonCanadaCaribbeanCentral AmericaChileChinaColombiaCongoCosta RicaCroatiaCubaCzechoslovakiaDenmarkDominicaDominican RepublicEastern AfricaEastern AsiaEastern EuropeEcuadorEgyptEl SalvadorEnglandEritreaEthiopiaEuropeFijiFranceGermanyGhanaGreeceGrenadaGuatemalaGuyanaHaitiHondurasHong KongHungaryIndiaIndonesiaIranIraqIrelandIsraelItalyJamaicaJapanJordanKazakhstanKenyaKoreaKuwaitLaosLatin AmericaLatviaLebanonLiberiaLithuaniaMalaysiaMexicoMicronesiaMiddle AfricaMoldovaMoroccoNepalNetherlandsNicaraguaNigeriaNorth AmericaNorth MacedoniaNorthern AfricaNorthern EuropeNorwayOceaniaPakistanPanamaPeruPhilippinesPolandPortugalRomaniaRussiaSaudi ArabiaScotlandSenegalSerbiaSierra LeoneSingaporeSomaliaSouth AfricaSouth AmericaSouth Central AsiaSouth Eastern AsiaSouthern EuropeSpainSri LankaSt. Vincent and the GrenadinesSudanSwedenSwitzerlandSyriaTaiwanThailandTrinidad and TobagoTurkeyUgandaUkraineUruguayUzbekistanVenezuelaVietnamWest IndiesWestern AfricaWestern AsiaWestern EuropeYemenZaireZimbabweAzores
Select to Compare
Race
Ancestry
AfghanAfricanAlaska NativeAlaskan AthabascanAlbanianAleutAlsatianAmericanApacheArabArapahoArgentineanArmenianAssyrian/Chaldean/SyriacAustralianAustrianBahamianBangladeshiBarbadianBasqueBelgianBelizeanBermudanBhutaneseBlackfeetBolivianBrazilianBritishBritish West IndianBulgarianBurmeseCajunCambodianCanadianCape VerdeanCarpatho RusynCelticCentral AmericanCentral American IndianCherokeeCheyenneChickasawChileanChineseChippewaChoctawColombianColvilleComancheCosta RicanCreeCreekCroatianCrowCubanCypriotCzechCzechoslovakianDanishDelawareDominicanDutchDutch West IndianEastern EuropeanEcuadorianEgyptianEnglishEstonianEthiopianEuropeanFijianFilipinoFinnishFrenchFrench American IndianFrench CanadianGermanGerman RussianGhanaianGreekGuamanian/ChamorroGuatemalanGuyaneseHaitianHmongHonduranHopiHoumaHungarianIcelanderIndian (Asian)IndonesianInupiatIranianIraqiIrishIroquoisIsraeliItalianJamaicanJapaneseJordanianKenyanKiowaKoreanLaotianLatvianLebaneseLiberianLithuanianLumbeeLuxembourgerMacedonianMalaysianMalteseMarshalleseMenomineeMexicanMexican American IndianMongolianMoroccanNative HawaiianNavajoNepaleseNew ZealanderNicaraguanNigerianNorthern EuropeanNorwegianOkinawanOsageOttawaPakistaniPalestinianPanamanianParaguayanPennsylvania GermanPeruvianPimaPolishPortuguesePotawatomiPuebloPuerto RicanPuget Sound SalishRomanianRussianSalvadoranSamoanScandinavianScotch-IrishScottishSeminoleSenegaleseSerbianShoshoneSierra LeoneanSiouxSlavicSlovakSloveneSomaliSouth AfricanSouth AmericanSouth American IndianSoviet UnionSpaniardSpanishSpanish AmericanSpanish American IndianSri LankanSubsaharan AfricanSudaneseSwedishSwissSyrianTaiwaneseThaiTlingit-HaidaTohono O'OdhamTonganTrinidadian and TobagonianTsimshianTurkishU.S. Virgin IslanderUgandanUkrainianUruguayanUteVenezuelanVietnameseWelshWest IndianYakamaYaquiYugoslavianYumanYup'ikZimbabwean
Immigration
NonimmigrantsImmigrantsAfghanistanAfricaAlbaniaArgentinaArmeniaAsiaAustraliaAustriaBahamasBangladeshBarbadosBelarusBelgiumBelizeBoliviaBosnia and HerzegovinaBrazilBulgariaBurma/MyanmarCabo VerdeCambodiaCameroonCanadaCaribbeanCentral AmericaChileChinaColombiaCongoCosta RicaCroatiaCubaCzechoslovakiaDenmarkDominicaDominican RepublicEastern AfricaEastern AsiaEastern EuropeEcuadorEgyptEl SalvadorEnglandEritreaEthiopiaEuropeFijiFranceGermanyGhanaGreeceGrenadaGuatemalaGuyanaHaitiHondurasHong KongHungaryIndiaIndonesiaIranIraqIrelandIsraelItalyJamaicaJapanJordanKazakhstanKenyaKoreaKuwaitLaosLatin AmericaLatviaLebanonLiberiaLithuaniaMalaysiaMexicoMicronesiaMiddle AfricaMoldovaMoroccoNepalNetherlandsNicaraguaNigeriaNorth AmericaNorth MacedoniaNorthern AfricaNorthern EuropeNorwayOceaniaPakistanPanamaPeruPhilippinesPolandPortugalRomaniaRussiaSaudi ArabiaScotlandSenegalSerbiaSierra LeoneSingaporeSomaliaSouth AfricaSouth AmericaSouth Central AsiaSouth Eastern AsiaSouthern EuropeSpainSri LankaSt. Vincent and the GrenadinesSudanSwedenSwitzerlandSyriaTaiwanThailandTrinidad and TobagoTurkeyUgandaUkraineUruguayUzbekistanVenezuelaVietnamWest IndiesWestern AfricaWestern AsiaWestern EuropeYemenZaireZimbabweAzores
1 or more Vehicles in Household
Income
Poverty
Unemployment
Labor Participation
Family Structure
Vehicle Availability
Education Level
Disability

Paiute 1 or more Vehicles in Household
Tragic

88.6%
1+ VEHICLES AVAILABLE
4.6/ 100
METRIC RATING
235th/ 347
METRIC RANK

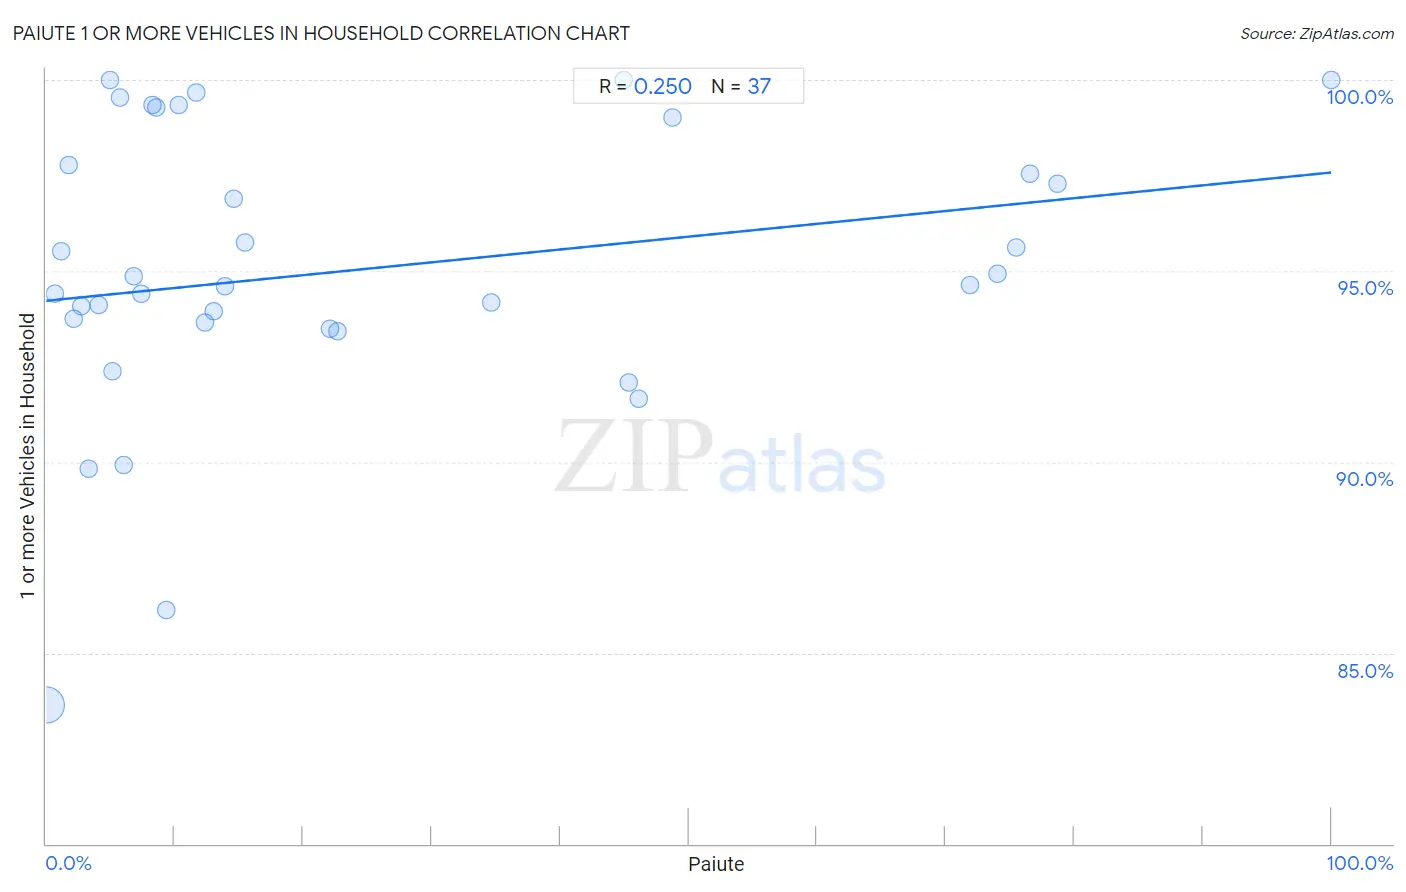
Paiute 1 or more Vehicles in Household Correlation Chart

The statistical analysis conducted on geographies consisting of 58,397,300 people shows a weak positive correlation between the proportion of Paiute and percentage of households with 1 or more vehicles available in the United States with a correlation coefficient (R) of 0.250 and weighted average of 88.6%. On average, for every 1% (one percent) increase in Paiute within a typical geography, there is an increase of 0.034% in percentage of households with 1 or more vehicles available.
Paiute 1 or more Vehicles in Household
It is essential to understand that the correlation between the percentage of Paiute and percentage of households with 1 or more vehicles available does not imply a direct cause-and-effect relationship. It remains uncertain whether the presence of Paiute influences an upward or downward trend in the level of percentage of households with 1 or more vehicles available within an area, or if Paiute simply ended up residing in those areas with higher or lower levels of percentage of households with 1 or more vehicles available due to other factors.

Demographics Similar to Paiute by 1 or more Vehicles in Household

In terms of 1 or more vehicles in household, the demographic groups most similar to Paiute are Immigrants from Peru (88.6%, a difference of 0.0%), Houma (88.6%, a difference of 0.010%), Immigrants from Pakistan (88.6%, a difference of 0.010%), Immigrants from Turkey (88.6%, a difference of 0.020%), and Russian (88.7%, a difference of 0.030%).
DemographicsRating | Rank1 or more Vehicles in Household
Immigrants from Norway
5.5
/100
|
#228
Tragic
88.7%
Immigrants from Romania
5.4
/100
|
#229
Tragic
88.7%
Immigrants from Sierra Leone
5.2
/100
|
#230
Tragic
88.7%
Russians
5.0
/100
|
#231
Tragic
88.7%
Immigrants from Japan
4.9
/100
|
#232
Tragic
88.7%
Houma
4.8
/100
|
#233
Tragic
88.6%
Immigrants from Peru
4.7
/100
|
#234
Tragic
88.6%
Paiute
4.6
/100
|
#235
Tragic
88.6%
Immigrants from Pakistan
4.5
/100
|
#236
Tragic
88.6%
Immigrants from Turkey
4.4
/100
|
#237
Tragic
88.6%
Immigrants from Somalia
4.2
/100
|
#238
Tragic
88.6%
Kiowa
3.8
/100
|
#239
Tragic
88.6%
Eastern Europeans
3.0
/100
|
#240
Tragic
88.5%
Taiwanese
2.6
/100
|
#241
Tragic
88.4%
Turks
2.5
/100
|
#242
Tragic
88.4%

Paiute 1 or more Vehicles in Household Correlation Summary

MeasurementPaiute Data1 or more Vehicles in Household Data
Minimum0.030%83.6%
Maximum100.0%100.0%
Range100.0%16.4%
Mean24.6%95.0%
Median11.7%94.6%
Interquartile 25% (IQ1)5.0%93.6%
Interquartile 75% (IQ3)45.2%98.4%
Interquartile Range (IQR)40.1%4.8%
Standard Deviation (Sample)28.1%3.8%
Standard Deviation (Population)27.7%3.7%

Correlation Details

Paiute PercentileSample Size1 or more Vehicles in Household
[
0.0%
-
0.5%
]
0.030%
57,646,62583.6%
[
0.5%
-
1.0%
]
0.68%
501,25994.4%
[
1.0%
-
1.5%
]
1.21%
145,16595.5%
[
1.5%
-
2.0%
]
1.75%
29,12597.8%
[
2.0%
-
2.5%
]
2.12%
8,78093.8%
[
2.5%
-
3.0%
]
2.74%
9,32894.1%
[
3.0%
-
3.5%
]
3.28%
57989.8%
[
4.0%
-
4.5%
]
4.04%
15,90194.1%
[
4.5%
-
5.0%
]
4.92%
1,565100.0%
[
5.0%
-
5.5%
]
5.12%
6,29592.4%
[
5.5%
-
6.0%
]
5.74%
1,13399.5%
[
6.0%
-
6.5%
]
6.02%
3,10889.9%
[
6.5%
-
7.0%
]
6.80%
8,47294.9%
[
7.0%
-
7.5%
]
7.39%
1,70594.4%
[
8.0%
-
8.5%
]
8.24%
72899.3%
[
8.5%
-
9.0%
]
8.52%
77599.3%
[
9.0%
-
9.5%
]
9.38%
1,88686.1%
[
10.0%
-
10.5%
]
10.35%
3,03499.3%
[
11.5%
-
12.0%
]
11.70%
77899.7%
[
12.0%
-
12.5%
]
12.31%
1,64993.7%
[
12.5%
-
13.0%
]
12.99%
1,56394.0%
[
13.5%
-
14.0%
]
13.90%
37494.6%
[
14.5%
-
15.0%
]
14.63%
1,03296.9%
[
15.0%
-
15.5%
]
15.43%
36395.7%
[
22.0%
-
22.5%
]
22.05%
25493.5%
[
22.5%
-
23.0%
]
22.68%
31393.4%
[
34.5%
-
35.0%
]
34.61%
39394.2%
[
44.5%
-
45.0%
]
44.98%
887100.0%
[
45.0%
-
45.5%
]
45.35%
17292.1%
[
46.0%
-
46.5%
]
46.15%
16991.7%
[
48.5%
-
49.0%
]
48.76%
1,00799.0%
[
71.5%
-
72.0%
]
71.85%
13594.6%
[
73.5%
-
74.0%
]
74.00%
89694.9%
[
75.0%
-
75.5%
]
75.46%
1,08495.6%
[
76.5%
-
77.0%
]
76.59%
39397.5%
[
78.5%
-
79.0%
]
78.74%
34897.3%
[
99.5%
-
100.0%
]
100.00%
27100.0%