Paiute Married-couple Households
COMPARE
Paiute
Select to Compare
Married-couple Households
Paiute Married-couple Households
42.1%
MARRIED-COUPLE HOUSEHOLDS
0.0/ 100
METRIC RATING
291st/ 347
METRIC RANK
Paiute Married-couple Households Correlation Chart
The statistical analysis conducted on geographies consisting of 58,392,111 people shows a significant negative correlation between the proportion of Paiute and percentage of married-couple family households in the United States with a correlation coefficient (R) of -0.622 and weighted average of 42.1%. On average, for every 1% (one percent) increase in Paiute within a typical geography, there is a decrease of 0.35% in percentage of married-couple family households.
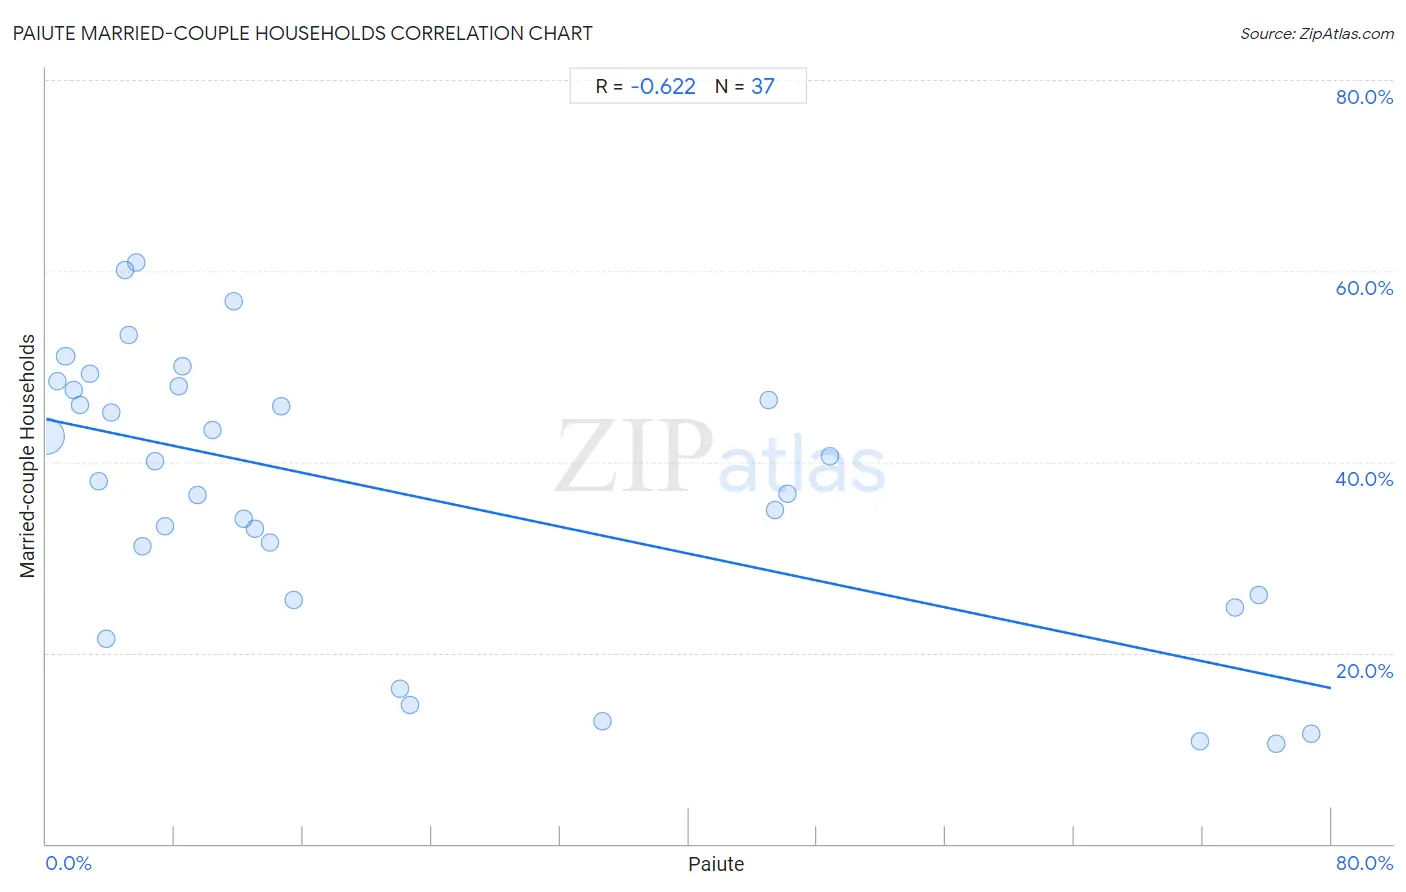
It is essential to understand that the correlation between the percentage of Paiute and percentage of married-couple family households does not imply a direct cause-and-effect relationship. It remains uncertain whether the presence of Paiute influences an upward or downward trend in the level of percentage of married-couple family households within an area, or if Paiute simply ended up residing in those areas with higher or lower levels of percentage of married-couple family households due to other factors.
Demographics Similar to Paiute by Married-couple Households
In terms of married-couple households, the demographic groups most similar to Paiute are Honduran (42.1%, a difference of 0.010%), Indonesian (42.0%, a difference of 0.050%), Sudanese (42.1%, a difference of 0.060%), Immigrants from Eritrea (42.1%, a difference of 0.11%), and Menominee (42.0%, a difference of 0.16%).
| Demographics | Rating | Rank | Married-couple Households |
| Cheyenne | 0.0 /100 | #284 | Tragic 42.3% |
| Ghanaians | 0.0 /100 | #285 | Tragic 42.2% |
| Belizeans | 0.0 /100 | #286 | Tragic 42.2% |
| Chippewa | 0.0 /100 | #287 | Tragic 42.1% |
| Immigrants from Eritrea | 0.0 /100 | #288 | Tragic 42.1% |
| Sudanese | 0.0 /100 | #289 | Tragic 42.1% |
| Hondurans | 0.0 /100 | #290 | Tragic 42.1% |
| Paiute | 0.0 /100 | #291 | Tragic 42.1% |
| Indonesians | 0.0 /100 | #292 | Tragic 42.0% |
| Menominee | 0.0 /100 | #293 | Tragic 42.0% |
| Immigrants from Yemen | 0.0 /100 | #294 | Tragic 42.0% |
| Kiowa | 0.0 /100 | #295 | Tragic 42.0% |
| Immigrants from Sudan | 0.0 /100 | #296 | Tragic 41.9% |
| Arapaho | 0.0 /100 | #297 | Tragic 41.8% |
| Immigrants from Middle Africa | 0.0 /100 | #298 | Tragic 41.8% |
Paiute Married-couple Households Correlation Summary
| Measurement | Paiute Data | Married-couple Households Data |
| Minimum | 0.030% | 10.5% |
| Maximum | 78.7% | 60.9% |
| Range | 78.7% | 50.4% |
| Mean | 22.0% | 36.7% |
| Median | 10.3% | 38.0% |
| Interquartile 25% (IQ1) | 4.5% | 25.8% |
| Interquartile 75% (IQ3) | 39.8% | 47.7% |
| Interquartile Range (IQR) | 35.3% | 21.9% |
| Standard Deviation (Sample) | 25.3% | 14.3% |
| Standard Deviation (Population) | 24.9% | 14.1% |
Correlation Details
| Paiute Percentile | Sample Size | Married-couple Households |
[ 0.0% - 0.5% ] 0.030% | 57,644,571 | 42.7% |
[ 0.5% - 1.0% ] 0.68% | 496,781 | 48.5% |
[ 1.0% - 1.5% ] 1.21% | 145,165 | 51.1% |
[ 1.5% - 2.0% ] 1.75% | 29,125 | 47.5% |
[ 2.0% - 2.5% ] 2.12% | 8,780 | 46.0% |
[ 2.5% - 3.0% ] 2.74% | 9,328 | 49.2% |
[ 3.0% - 3.5% ] 3.28% | 579 | 38.0% |
[ 3.5% - 4.0% ] 3.76% | 1,916 | 21.4% |
[ 4.0% - 4.5% ] 4.04% | 15,901 | 45.1% |
[ 4.5% - 5.0% ] 4.92% | 1,565 | 60.1% |
[ 5.0% - 5.5% ] 5.12% | 6,295 | 53.3% |
[ 5.5% - 6.0% ] 5.62% | 587 | 60.9% |
[ 6.0% - 6.5% ] 6.02% | 3,108 | 31.2% |
[ 6.5% - 7.0% ] 6.80% | 8,472 | 40.0% |
[ 7.0% - 7.5% ] 7.39% | 1,705 | 33.3% |
[ 8.0% - 8.5% ] 8.24% | 728 | 47.9% |
[ 8.5% - 9.0% ] 8.52% | 775 | 50.0% |
[ 9.0% - 9.5% ] 9.38% | 1,886 | 36.5% |
[ 10.0% - 10.5% ] 10.35% | 3,034 | 43.4% |
[ 11.5% - 12.0% ] 11.70% | 778 | 56.8% |
[ 12.0% - 12.5% ] 12.31% | 1,649 | 34.1% |
[ 12.5% - 13.0% ] 12.99% | 1,563 | 33.0% |
[ 13.5% - 14.0% ] 13.90% | 374 | 31.5% |
[ 14.5% - 15.0% ] 14.63% | 1,032 | 45.9% |
[ 15.0% - 15.5% ] 15.43% | 363 | 25.5% |
[ 22.0% - 22.5% ] 22.05% | 254 | 16.3% |
[ 22.5% - 23.0% ] 22.68% | 313 | 14.5% |
[ 34.5% - 35.0% ] 34.61% | 393 | 12.8% |
[ 44.5% - 45.0% ] 44.98% | 887 | 46.5% |
[ 45.0% - 45.5% ] 45.35% | 172 | 34.9% |
[ 46.0% - 46.5% ] 46.15% | 169 | 36.7% |
[ 48.5% - 49.0% ] 48.76% | 1,007 | 40.5% |
[ 71.5% - 72.0% ] 71.85% | 135 | 10.7% |
[ 73.5% - 74.0% ] 74.00% | 896 | 24.8% |
[ 75.0% - 75.5% ] 75.46% | 1,084 | 26.0% |
[ 76.5% - 77.0% ] 76.59% | 393 | 10.5% |
[ 78.5% - 79.0% ] 78.74% | 348 | 11.6% |