Paiute 4 or more Vehicles in Household
COMPARE
Paiute
Select to Compare
4 or more Vehicles in Household
Paiute 4 or more Vehicles in Household
9.0%
4+ VEHICLES AVAILABLE
100.0/ 100
METRIC RATING
10th/ 347
METRIC RANK
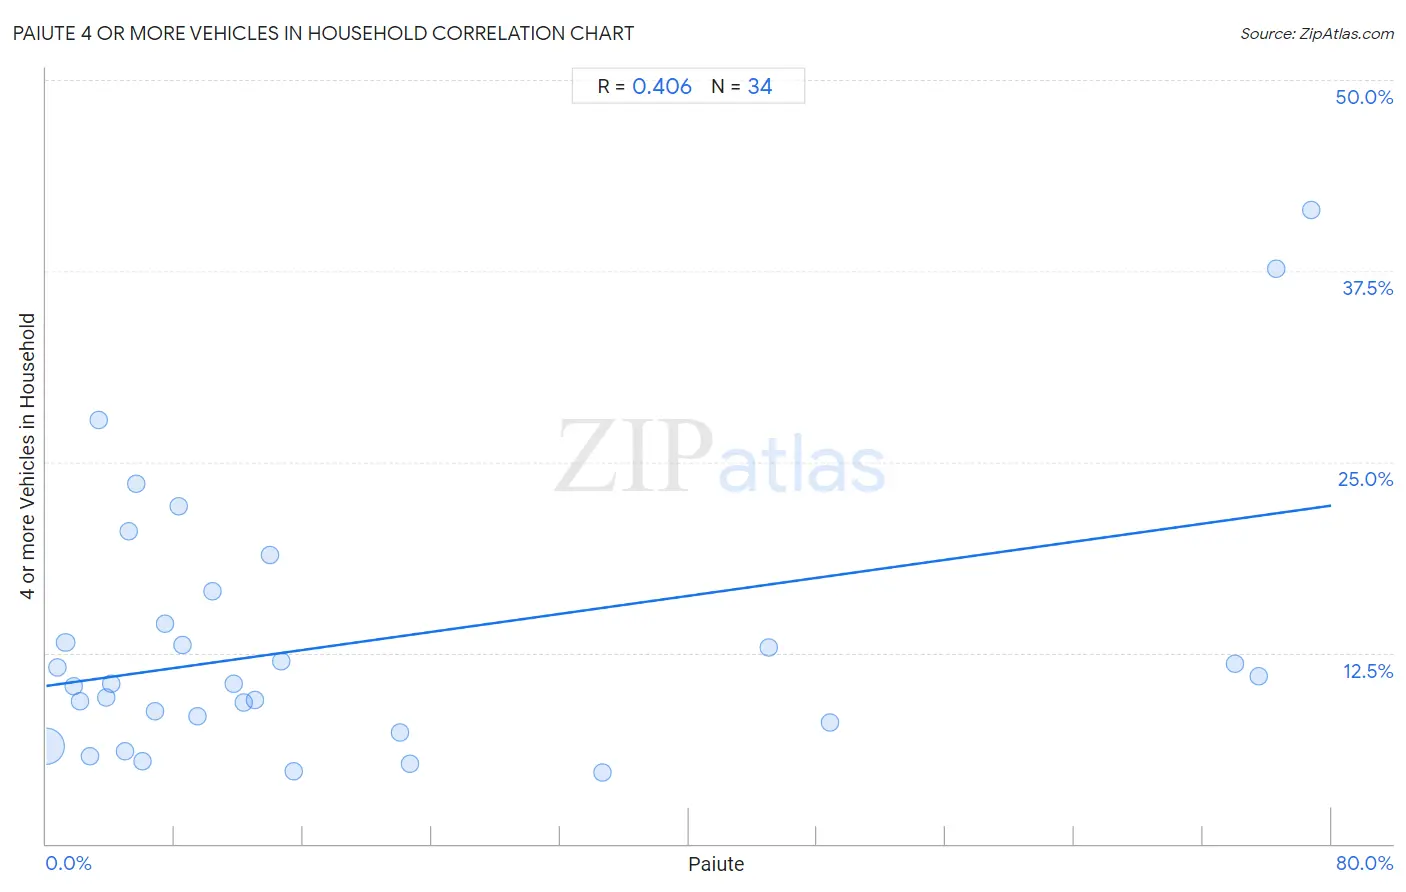
Paiute 4 or more Vehicles in Household Correlation Chart
The statistical analysis conducted on geographies consisting of 58,379,000 people shows a moderate positive correlation between the proportion of Paiute and percentage of households with 4 or more vehicles available in the United States with a correlation coefficient (R) of 0.406 and weighted average of 9.0%. On average, for every 1% (one percent) increase in Paiute within a typical geography, there is an increase of 0.15% in percentage of households with 4 or more vehicles available.
It is essential to understand that the correlation between the percentage of Paiute and percentage of households with 4 or more vehicles available does not imply a direct cause-and-effect relationship. It remains uncertain whether the presence of Paiute influences an upward or downward trend in the level of percentage of households with 4 or more vehicles available within an area, or if Paiute simply ended up residing in those areas with higher or lower levels of percentage of households with 4 or more vehicles available due to other factors.
Demographics Similar to Paiute by 4 or more Vehicles in Household
In terms of 4 or more vehicles in household, the demographic groups most similar to Paiute are Immigrants from Mexico (9.0%, a difference of 0.12%), Mexican (8.9%, a difference of 0.80%), Hawaiian (8.9%, a difference of 0.81%), Chinese (8.8%, a difference of 1.8%), and Shoshone (8.8%, a difference of 1.8%).
| Demographics | Rating | Rank | 4 or more Vehicles in Household |
| Spanish American Indians | 100.0 /100 | #3 | Exceptional 10.8% |
| Tongans | 100.0 /100 | #4 | Exceptional 10.0% |
| Immigrants from Fiji | 100.0 /100 | #5 | Exceptional 9.6% |
| Puget Sound Salish | 100.0 /100 | #6 | Exceptional 9.4% |
| Native Hawaiians | 100.0 /100 | #7 | Exceptional 9.4% |
| Arapaho | 100.0 /100 | #8 | Exceptional 9.4% |
| Samoans | 100.0 /100 | #9 | Exceptional 9.2% |
| Paiute | 100.0 /100 | #10 | Exceptional 9.0% |
| Immigrants from Mexico | 100.0 /100 | #11 | Exceptional 9.0% |
| Mexicans | 100.0 /100 | #12 | Exceptional 8.9% |
| Hawaiians | 100.0 /100 | #13 | Exceptional 8.9% |
| Chinese | 100.0 /100 | #14 | Exceptional 8.8% |
| Shoshone | 100.0 /100 | #15 | Exceptional 8.8% |
| Lumbee | 100.0 /100 | #16 | Exceptional 8.8% |
| Ute | 100.0 /100 | #17 | Exceptional 8.8% |
Paiute 4 or more Vehicles in Household Correlation Summary
| Measurement | Paiute Data | 4 or more Vehicles in Household Data |
| Minimum | 0.030% | 4.7% |
| Maximum | 78.7% | 41.5% |
| Range | 78.7% | 36.8% |
| Mean | 19.1% | 13.2% |
| Median | 9.0% | 10.5% |
| Interquartile 25% (IQ1) | 4.0% | 7.9% |
| Interquartile 75% (IQ3) | 22.0% | 14.4% |
| Interquartile Range (IQR) | 18.0% | 6.5% |
| Standard Deviation (Sample) | 24.1% | 8.7% |
| Standard Deviation (Population) | 23.7% | 8.6% |
Correlation Details
| Paiute Percentile | Sample Size | 4 or more Vehicles in Household |
[ 0.0% - 0.5% ] 0.030% | 57,634,739 | 6.3% |
[ 0.5% - 1.0% ] 0.68% | 494,641 | 11.5% |
[ 1.0% - 1.5% ] 1.21% | 145,165 | 13.1% |
[ 1.5% - 2.0% ] 1.75% | 29,125 | 10.3% |
[ 2.0% - 2.5% ] 2.12% | 8,780 | 9.3% |
[ 2.5% - 3.0% ] 2.74% | 9,328 | 5.7% |
[ 3.0% - 3.5% ] 3.28% | 579 | 27.8% |
[ 3.5% - 4.0% ] 3.75% | 1,253 | 9.5% |
[ 4.0% - 4.5% ] 4.04% | 15,901 | 10.4% |
[ 4.5% - 5.0% ] 4.92% | 1,565 | 6.0% |
[ 5.0% - 5.5% ] 5.12% | 6,295 | 20.4% |
[ 5.5% - 6.0% ] 5.62% | 587 | 23.6% |
[ 6.0% - 6.5% ] 6.02% | 3,108 | 5.4% |
[ 6.5% - 7.0% ] 6.80% | 8,472 | 8.7% |
[ 7.0% - 7.5% ] 7.39% | 1,705 | 14.4% |
[ 8.0% - 8.5% ] 8.24% | 728 | 22.1% |
[ 8.5% - 9.0% ] 8.52% | 775 | 13.0% |
[ 9.0% - 9.5% ] 9.38% | 1,886 | 8.3% |
[ 10.0% - 10.5% ] 10.35% | 3,034 | 16.6% |
[ 11.5% - 12.0% ] 11.70% | 778 | 10.5% |
[ 12.0% - 12.5% ] 12.31% | 1,649 | 9.2% |
[ 12.5% - 13.0% ] 12.99% | 1,563 | 9.4% |
[ 13.5% - 14.0% ] 13.90% | 374 | 18.9% |
[ 14.5% - 15.0% ] 14.63% | 1,032 | 11.9% |
[ 15.0% - 15.5% ] 15.43% | 363 | 4.8% |
[ 22.0% - 22.5% ] 22.05% | 254 | 7.3% |
[ 22.5% - 23.0% ] 22.68% | 313 | 5.3% |
[ 34.5% - 35.0% ] 34.61% | 393 | 4.7% |
[ 44.5% - 45.0% ] 44.98% | 887 | 12.9% |
[ 48.5% - 49.0% ] 48.76% | 1,007 | 7.9% |
[ 73.5% - 74.0% ] 74.00% | 896 | 11.7% |
[ 75.0% - 75.5% ] 75.46% | 1,084 | 11.0% |
[ 76.5% - 77.0% ] 76.59% | 393 | 37.7% |
[ 78.5% - 79.0% ] 78.74% | 348 | 41.5% |