Northern European 2 or more Vehicles in Household
COMPARE
Northern European
Select to Compare
2 or more Vehicles in Household
Northern European 2 or more Vehicles in Household
59.9%
2+ VEHICLES AVAILABLE
100.0/ 100
METRIC RATING
41st/ 347
METRIC RANK
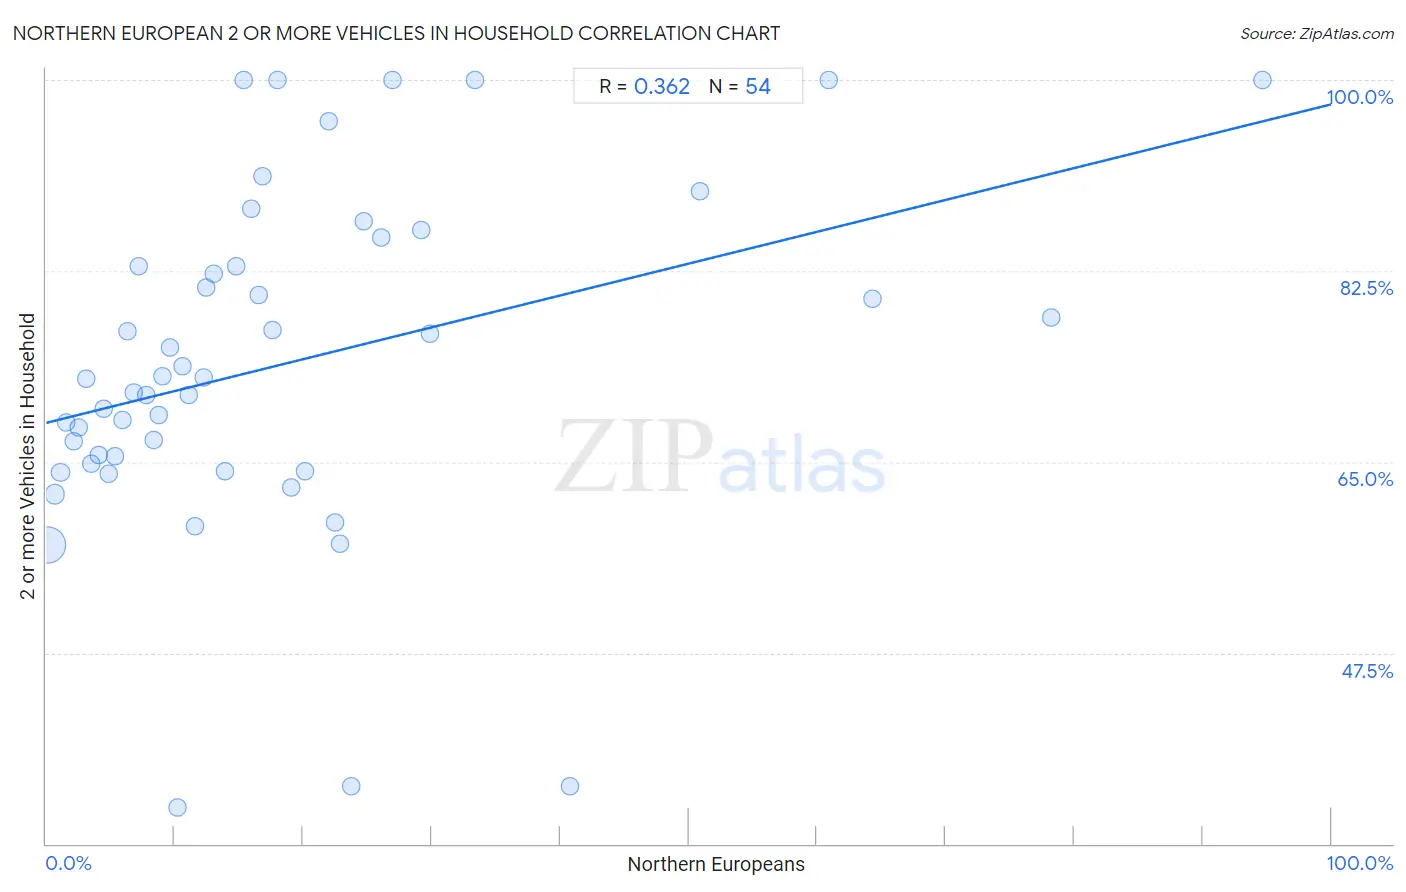
Northern European 2 or more Vehicles in Household Correlation Chart
The statistical analysis conducted on geographies consisting of 405,957,597 people shows a mild positive correlation between the proportion of Northern Europeans and percentage of households with 2 or more vehicles available in the United States with a correlation coefficient (R) of 0.362 and weighted average of 59.9%. On average, for every 1% (one percent) increase in Northern Europeans within a typical geography, there is an increase of 0.29% in percentage of households with 2 or more vehicles available.
It is essential to understand that the correlation between the percentage of Northern Europeans and percentage of households with 2 or more vehicles available does not imply a direct cause-and-effect relationship. It remains uncertain whether the presence of Northern Europeans influences an upward or downward trend in the level of percentage of households with 2 or more vehicles available within an area, or if Northern Europeans simply ended up residing in those areas with higher or lower levels of percentage of households with 2 or more vehicles available due to other factors.
Demographics Similar to Northern Europeans by 2 or more Vehicles in Household
In terms of 2 or more vehicles in household, the demographic groups most similar to Northern Europeans are Malaysian (59.8%, a difference of 0.010%), Cherokee (59.9%, a difference of 0.020%), Czechoslovakian (59.8%, a difference of 0.090%), French (59.8%, a difference of 0.15%), and Immigrants from Taiwan (59.7%, a difference of 0.19%).
| Demographics | Rating | Rank | 2 or more Vehicles in Household |
| Spanish | 100.0 /100 | #34 | Exceptional 60.2% |
| Immigrants from Philippines | 100.0 /100 | #35 | Exceptional 60.1% |
| Chinese | 100.0 /100 | #36 | Exceptional 60.1% |
| Irish | 100.0 /100 | #37 | Exceptional 60.1% |
| Americans | 100.0 /100 | #38 | Exceptional 60.0% |
| British | 100.0 /100 | #39 | Exceptional 60.0% |
| Cherokee | 100.0 /100 | #40 | Exceptional 59.9% |
| Northern Europeans | 100.0 /100 | #41 | Exceptional 59.9% |
| Malaysians | 100.0 /100 | #42 | Exceptional 59.8% |
| Czechoslovakians | 100.0 /100 | #43 | Exceptional 59.8% |
| French | 100.0 /100 | #44 | Exceptional 59.8% |
| Immigrants from Taiwan | 100.0 /100 | #45 | Exceptional 59.7% |
| Immigrants from South Eastern Asia | 100.0 /100 | #46 | Exceptional 59.6% |
| Yaqui | 99.9 /100 | #47 | Exceptional 59.3% |
| Immigrants from India | 99.9 /100 | #48 | Exceptional 59.3% |
Northern European 2 or more Vehicles in Household Correlation Summary
| Measurement | Northern European Data | 2 or more Vehicles in Household Data |
| Minimum | 0.15% | 33.3% |
| Maximum | 94.6% | 100.0% |
| Range | 94.5% | 66.7% |
| Mean | 18.6% | 74.0% |
| Median | 12.7% | 72.7% |
| Interquartile 25% (IQ1) | 6.3% | 64.8% |
| Interquartile 75% (IQ3) | 22.9% | 83.0% |
| Interquartile Range (IQR) | 16.6% | 18.1% |
| Standard Deviation (Sample) | 19.4% | 15.6% |
| Standard Deviation (Population) | 19.2% | 15.5% |
Correlation Details
| Northern European Percentile | Sample Size | 2 or more Vehicles in Household |
[ 0.0% - 0.5% ] 0.15% | 366,466,917 | 57.4% |
[ 0.5% - 1.0% ] 0.64% | 31,277,839 | 62.0% |
[ 1.0% - 1.5% ] 1.12% | 5,041,122 | 64.0% |
[ 1.5% - 2.0% ] 1.60% | 1,807,588 | 68.6% |
[ 2.0% - 2.5% ] 2.09% | 512,931 | 66.8% |
[ 2.5% - 3.0% ] 2.55% | 275,913 | 68.1% |
[ 3.0% - 3.5% ] 3.07% | 150,643 | 72.7% |
[ 3.5% - 4.0% ] 3.54% | 137,621 | 64.8% |
[ 4.0% - 4.5% ] 4.07% | 100,180 | 65.7% |
[ 4.0% - 4.5% ] 4.47% | 35,166 | 69.8% |
[ 4.5% - 5.0% ] 4.91% | 42,516 | 64.0% |
[ 5.0% - 5.5% ] 5.37% | 35,982 | 65.5% |
[ 5.5% - 6.0% ] 5.96% | 8,232 | 68.8% |
[ 6.0% - 6.5% ] 6.33% | 4,405 | 76.9% |
[ 6.5% - 7.0% ] 6.79% | 9,600 | 71.4% |
[ 7.0% - 7.5% ] 7.19% | 4,894 | 82.9% |
[ 7.5% - 8.0% ] 7.76% | 3,262 | 71.2% |
[ 8.0% - 8.5% ] 8.38% | 5,073 | 67.0% |
[ 8.5% - 9.0% ] 8.74% | 4,464 | 69.3% |
[ 9.0% - 9.5% ] 9.08% | 3,027 | 72.8% |
[ 9.5% - 10.0% ] 9.62% | 2,548 | 75.4% |
[ 10.0% - 10.5% ] 10.22% | 2,045 | 33.3% |
[ 10.5% - 11.0% ] 10.56% | 4,234 | 73.8% |
[ 11.0% - 11.5% ] 11.10% | 3,207 | 71.1% |
[ 11.5% - 12.0% ] 11.60% | 3,077 | 59.1% |
[ 12.0% - 12.5% ] 12.23% | 327 | 72.8% |
[ 12.0% - 12.5% ] 12.45% | 1,807 | 81.0% |
[ 12.5% - 13.0% ] 12.99% | 485 | 82.2% |
[ 13.5% - 14.0% ] 13.88% | 1,189 | 64.2% |
[ 14.5% - 15.0% ] 14.83% | 445 | 83.0% |
[ 15.0% - 15.5% ] 15.38% | 156 | 100.0% |
[ 15.5% - 16.0% ] 15.93% | 1,067 | 88.2% |
[ 16.0% - 16.5% ] 16.50% | 1,370 | 80.3% |
[ 16.5% - 17.0% ] 16.85% | 178 | 91.2% |
[ 17.5% - 18.0% ] 17.61% | 1,198 | 77.1% |
[ 18.0% - 18.5% ] 18.03% | 61 | 100.0% |
[ 19.0% - 19.5% ] 19.06% | 1,039 | 62.7% |
[ 20.0% - 20.5% ] 20.14% | 422 | 64.1% |
[ 22.0% - 22.5% ] 22.03% | 454 | 96.2% |
[ 22.5% - 23.0% ] 22.51% | 1,777 | 59.4% |
[ 22.5% - 23.0% ] 22.89% | 249 | 57.4% |
[ 23.5% - 24.0% ] 23.73% | 118 | 35.3% |
[ 24.5% - 25.0% ] 24.74% | 194 | 87.0% |
[ 26.0% - 26.5% ] 26.05% | 906 | 85.6% |
[ 26.5% - 27.0% ] 26.92% | 78 | 100.0% |
[ 29.0% - 29.5% ] 29.20% | 565 | 86.2% |
[ 29.5% - 30.0% ] 29.83% | 352 | 76.7% |
[ 33.0% - 33.5% ] 33.33% | 12 | 100.0% |
[ 40.5% - 41.0% ] 40.74% | 54 | 35.3% |
[ 50.5% - 51.0% ] 50.88% | 340 | 89.8% |
[ 60.5% - 61.0% ] 60.87% | 23 | 100.0% |
[ 64.0% - 64.5% ] 64.29% | 14 | 80.0% |
[ 78.0% - 78.5% ] 78.22% | 101 | 78.2% |
[ 94.5% - 95.0% ] 94.62% | 130 | 100.0% |