Northern European Disability
COMPARE
Northern European
Select to Compare
Disability
Northern European Disability
12.1%
DISABILITY
4.2/ 100
METRIC RATING
221st/ 347
METRIC RANK
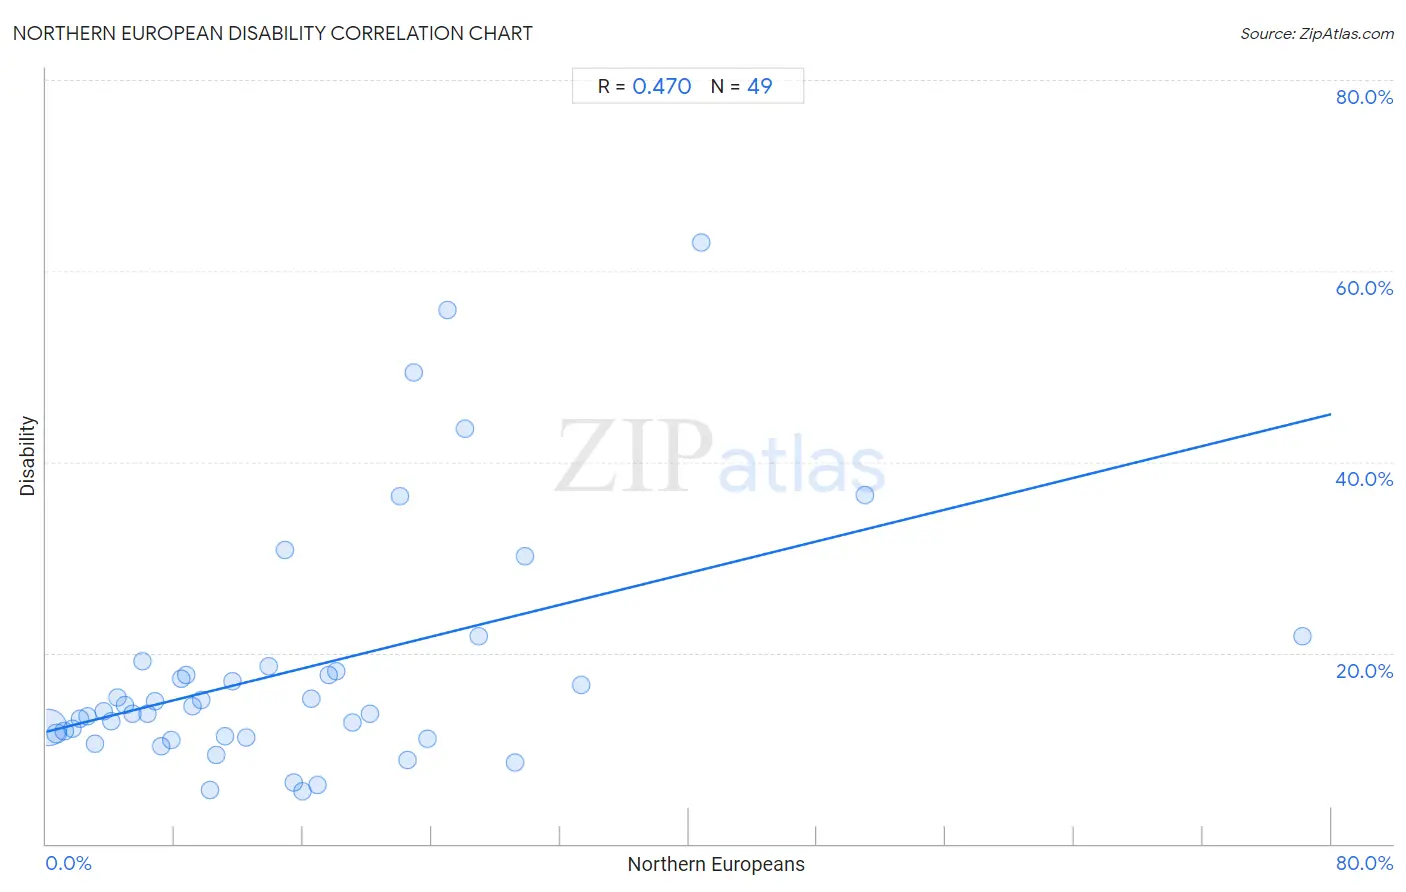
Northern European Disability Correlation Chart
The statistical analysis conducted on geographies consisting of 406,050,412 people shows a moderate positive correlation between the proportion of Northern Europeans and percentage of population with a disability in the United States with a correlation coefficient (R) of 0.470 and weighted average of 12.1%. On average, for every 1% (one percent) increase in Northern Europeans within a typical geography, there is an increase of 0.42% in percentage of population with a disability.
It is essential to understand that the correlation between the percentage of Northern Europeans and percentage of population with a disability does not imply a direct cause-and-effect relationship. It remains uncertain whether the presence of Northern Europeans influences an upward or downward trend in the level of percentage of population with a disability within an area, or if Northern Europeans simply ended up residing in those areas with higher or lower levels of percentage of population with a disability due to other factors.
Demographics Similar to Northern Europeans by Disability
In terms of disability, the demographic groups most similar to Northern Europeans are Spanish American Indian (12.1%, a difference of 0.040%), Hispanic or Latino (12.1%, a difference of 0.070%), Immigrants from Bahamas (12.1%, a difference of 0.12%), Mexican (12.1%, a difference of 0.14%), and Croatian (12.1%, a difference of 0.16%).
| Demographics | Rating | Rank | Disability |
| Immigrants from Somalia | 6.8 /100 | #214 | Tragic 12.0% |
| Immigrants from Canada | 6.1 /100 | #215 | Tragic 12.1% |
| Panamanians | 5.4 /100 | #216 | Tragic 12.1% |
| Immigrants from North America | 5.3 /100 | #217 | Tragic 12.1% |
| Immigrants from Jamaica | 5.0 /100 | #218 | Tragic 12.1% |
| Croatians | 4.9 /100 | #219 | Tragic 12.1% |
| Immigrants from Bahamas | 4.7 /100 | #220 | Tragic 12.1% |
| Northern Europeans | 4.2 /100 | #221 | Tragic 12.1% |
| Spanish American Indians | 4.1 /100 | #222 | Tragic 12.1% |
| Hispanics or Latinos | 3.9 /100 | #223 | Tragic 12.1% |
| Mexicans | 3.7 /100 | #224 | Tragic 12.1% |
| Senegalese | 3.5 /100 | #225 | Tragic 12.1% |
| Jamaicans | 3.3 /100 | #226 | Tragic 12.1% |
| Alsatians | 3.3 /100 | #227 | Tragic 12.1% |
| West Indians | 2.9 /100 | #228 | Tragic 12.2% |
Northern European Disability Correlation Summary
| Measurement | Northern European Data | Disability Data |
| Minimum | 0.15% | 5.4% |
| Maximum | 78.2% | 63.0% |
| Range | 78.1% | 57.5% |
| Mean | 15.5% | 18.2% |
| Median | 11.6% | 13.8% |
| Interquartile 25% (IQ1) | 5.7% | 11.2% |
| Interquartile 75% (IQ3) | 22.2% | 18.3% |
| Interquartile Range (IQR) | 16.6% | 7.1% |
| Standard Deviation (Sample) | 14.3% | 12.6% |
| Standard Deviation (Population) | 14.1% | 12.5% |
Correlation Details
| Northern European Percentile | Sample Size | Disability |
[ 0.0% - 0.5% ] 0.15% | 366,543,013 | 12.2% |
[ 0.5% - 1.0% ] 0.64% | 31,297,984 | 11.5% |
[ 1.0% - 1.5% ] 1.12% | 5,041,028 | 11.8% |
[ 1.5% - 2.0% ] 1.60% | 1,807,860 | 12.1% |
[ 2.0% - 2.5% ] 2.09% | 513,187 | 13.1% |
[ 2.5% - 3.0% ] 2.55% | 275,116 | 13.4% |
[ 3.0% - 3.5% ] 3.07% | 150,255 | 10.5% |
[ 3.5% - 4.0% ] 3.54% | 137,506 | 13.8% |
[ 4.0% - 4.5% ] 4.07% | 100,180 | 12.9% |
[ 4.0% - 4.5% ] 4.47% | 35,053 | 15.3% |
[ 4.5% - 5.0% ] 4.91% | 42,516 | 14.6% |
[ 5.0% - 5.5% ] 5.37% | 35,982 | 13.7% |
[ 5.5% - 6.0% ] 5.96% | 8,232 | 19.2% |
[ 6.0% - 6.5% ] 6.33% | 4,405 | 13.6% |
[ 6.5% - 7.0% ] 6.79% | 9,600 | 15.0% |
[ 7.0% - 7.5% ] 7.19% | 4,894 | 10.2% |
[ 7.5% - 8.0% ] 7.76% | 3,262 | 10.9% |
[ 8.0% - 8.5% ] 8.38% | 4,822 | 17.3% |
[ 8.5% - 9.0% ] 8.74% | 4,464 | 17.7% |
[ 9.0% - 9.5% ] 9.08% | 3,027 | 14.4% |
[ 9.5% - 10.0% ] 9.62% | 2,548 | 15.0% |
[ 10.0% - 10.5% ] 10.22% | 2,045 | 5.7% |
[ 10.5% - 11.0% ] 10.56% | 4,234 | 9.2% |
[ 11.0% - 11.5% ] 11.10% | 3,127 | 11.3% |
[ 11.5% - 12.0% ] 11.60% | 3,077 | 17.0% |
[ 12.0% - 12.5% ] 12.45% | 1,807 | 11.2% |
[ 13.5% - 14.0% ] 13.88% | 1,189 | 18.6% |
[ 14.5% - 15.0% ] 14.86% | 276 | 30.8% |
[ 15.0% - 15.5% ] 15.38% | 156 | 6.4% |
[ 15.5% - 16.0% ] 15.93% | 1,067 | 5.4% |
[ 16.0% - 16.5% ] 16.50% | 1,370 | 15.2% |
[ 16.5% - 17.0% ] 16.92% | 130 | 6.2% |
[ 17.5% - 18.0% ] 17.61% | 1,198 | 17.6% |
[ 18.0% - 18.5% ] 18.03% | 61 | 18.0% |
[ 19.0% - 19.5% ] 19.07% | 813 | 12.7% |
[ 20.0% - 20.5% ] 20.14% | 422 | 13.6% |
[ 22.0% - 22.5% ] 22.03% | 454 | 36.4% |
[ 22.0% - 22.5% ] 22.47% | 1,286 | 8.7% |
[ 22.5% - 23.0% ] 22.89% | 249 | 49.4% |
[ 23.5% - 24.0% ] 23.73% | 118 | 11.0% |
[ 25.0% - 25.5% ] 25.00% | 68 | 55.9% |
[ 26.0% - 26.5% ] 26.05% | 906 | 43.5% |
[ 26.5% - 27.0% ] 26.92% | 78 | 21.8% |
[ 29.0% - 29.5% ] 29.20% | 565 | 8.5% |
[ 29.5% - 30.0% ] 29.83% | 352 | 30.1% |
[ 33.0% - 33.5% ] 33.33% | 12 | 16.7% |
[ 40.5% - 41.0% ] 40.74% | 54 | 63.0% |
[ 50.5% - 51.0% ] 50.95% | 263 | 36.5% |
[ 78.0% - 78.5% ] 78.22% | 101 | 21.8% |