Northern European vs Immigrants from Afghanistan Married-Couple Family Poverty
COMPARE
Northern European
Immigrants from Afghanistan
Married-Couple Family Poverty
Married-Couple Family Poverty Comparison
Northern Europeans
Immigrants from Afghanistan
4.3%
MARRIED-COUPLE FAMILY POVERTY
99.8/ 100
METRIC RATING
41st/ 347
METRIC RANK
5.8%
MARRIED-COUPLE FAMILY POVERTY
2.1/ 100
METRIC RATING
245th/ 347
METRIC RANK
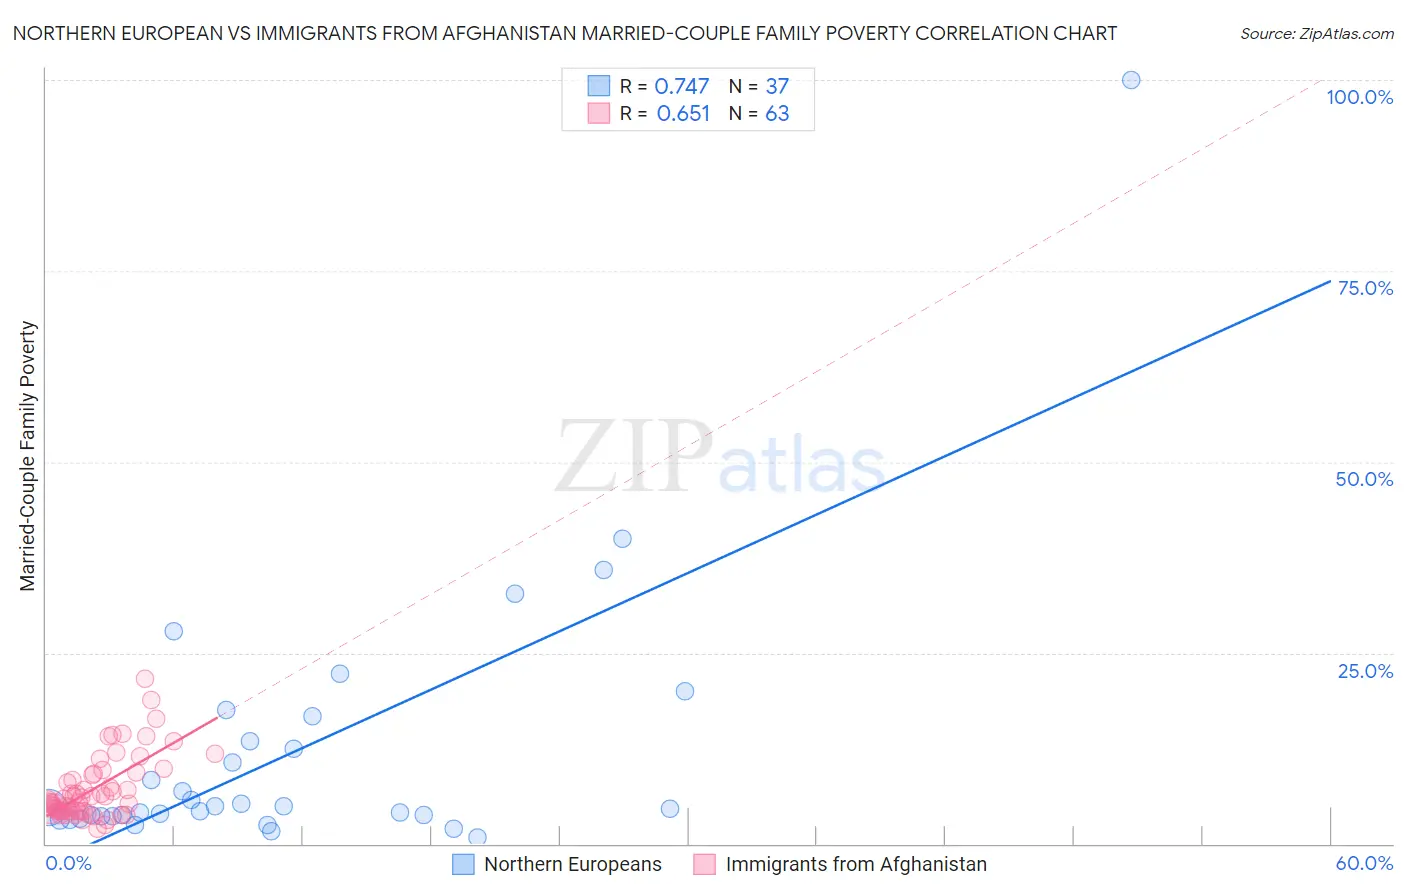
Northern European vs Immigrants from Afghanistan Married-Couple Family Poverty Correlation Chart
The statistical analysis conducted on geographies consisting of 401,488,886 people shows a strong positive correlation between the proportion of Northern Europeans and poverty level among married-couple families in the United States with a correlation coefficient (R) of 0.747 and weighted average of 4.3%. Similarly, the statistical analysis conducted on geographies consisting of 147,133,206 people shows a significant positive correlation between the proportion of Immigrants from Afghanistan and poverty level among married-couple families in the United States with a correlation coefficient (R) of 0.651 and weighted average of 5.8%, a difference of 36.1%.
Married-Couple Family Poverty Correlation Summary
| Measurement | Northern European | Immigrants from Afghanistan |
| Minimum | 0.82% | 1.9% |
| Maximum | 100.0% | 21.6% |
| Range | 99.2% | 19.6% |
| Mean | 12.1% | 7.2% |
| Median | 4.8% | 5.6% |
| Interquartile 25% (IQ1) | 3.6% | 4.3% |
| Interquartile 75% (IQ3) | 15.0% | 9.2% |
| Interquartile Range (IQR) | 11.4% | 4.9% |
| Standard Deviation (Sample) | 18.0% | 4.1% |
| Standard Deviation (Population) | 17.8% | 4.1% |
Similar Demographics by Married-Couple Family Poverty
Demographics Similar to Northern Europeans by Married-Couple Family Poverty
In terms of married-couple family poverty, the demographic groups most similar to Northern Europeans are Scottish (4.3%, a difference of 0.16%), French Canadian (4.2%, a difference of 0.25%), Immigrants from Northern Europe (4.2%, a difference of 0.53%), Swiss (4.3%, a difference of 0.60%), and Belgian (4.2%, a difference of 0.66%).
| Demographics | Rating | Rank | Married-Couple Family Poverty |
| Dutch | 99.9 /100 | #34 | Exceptional 4.2% |
| Europeans | 99.9 /100 | #35 | Exceptional 4.2% |
| English | 99.9 /100 | #36 | Exceptional 4.2% |
| Iranians | 99.9 /100 | #37 | Exceptional 4.2% |
| Belgians | 99.9 /100 | #38 | Exceptional 4.2% |
| Immigrants | Northern Europe | 99.8 /100 | #39 | Exceptional 4.2% |
| French Canadians | 99.8 /100 | #40 | Exceptional 4.2% |
| Northern Europeans | 99.8 /100 | #41 | Exceptional 4.3% |
| Scottish | 99.8 /100 | #42 | Exceptional 4.3% |
| Swiss | 99.8 /100 | #43 | Exceptional 4.3% |
| Immigrants | Japan | 99.8 /100 | #44 | Exceptional 4.3% |
| Serbians | 99.8 /100 | #45 | Exceptional 4.3% |
| British | 99.8 /100 | #46 | Exceptional 4.3% |
| Immigrants | South Central Asia | 99.8 /100 | #47 | Exceptional 4.3% |
| Australians | 99.7 /100 | #48 | Exceptional 4.3% |
Demographics Similar to Immigrants from Afghanistan by Married-Couple Family Poverty
In terms of married-couple family poverty, the demographic groups most similar to Immigrants from Afghanistan are Chickasaw (5.8%, a difference of 0.15%), Somali (5.8%, a difference of 0.16%), Immigrants from Western Africa (5.8%, a difference of 0.31%), Immigrants from Panama (5.8%, a difference of 0.40%), and Fijian (5.8%, a difference of 0.43%).
| Demographics | Rating | Rank | Married-Couple Family Poverty |
| Cherokee | 2.7 /100 | #238 | Tragic 5.8% |
| Venezuelans | 2.7 /100 | #239 | Tragic 5.8% |
| Fijians | 2.5 /100 | #240 | Tragic 5.8% |
| Immigrants | Panama | 2.5 /100 | #241 | Tragic 5.8% |
| Immigrants | Western Africa | 2.4 /100 | #242 | Tragic 5.8% |
| Somalis | 2.3 /100 | #243 | Tragic 5.8% |
| Chickasaw | 2.3 /100 | #244 | Tragic 5.8% |
| Immigrants | Afghanistan | 2.1 /100 | #245 | Tragic 5.8% |
| Immigrants | Venezuela | 1.8 /100 | #246 | Tragic 5.8% |
| Iraqis | 1.4 /100 | #247 | Tragic 5.9% |
| Cree | 1.2 /100 | #248 | Tragic 5.9% |
| Tsimshian | 1.1 /100 | #249 | Tragic 5.9% |
| Immigrants | Eritrea | 1.1 /100 | #250 | Tragic 5.9% |
| Immigrants | Ghana | 1.0 /100 | #251 | Tragic 5.9% |
| Immigrants | Western Asia | 0.7 /100 | #252 | Tragic 6.0% |