Immigrants vs Black/African American Married-Couple Family Poverty
COMPARE
Immigrants
Black/African American
Married-Couple Family Poverty
Married-Couple Family Poverty Comparison
Immigrants
Blacks/African Americans
6.0%
MARRIED-COUPLE FAMILY POVERTY
0.5/ 100
METRIC RATING
258th/ 347
METRIC RANK
6.5%
MARRIED-COUPLE FAMILY POVERTY
0.0/ 100
METRIC RATING
285th/ 347
METRIC RANK
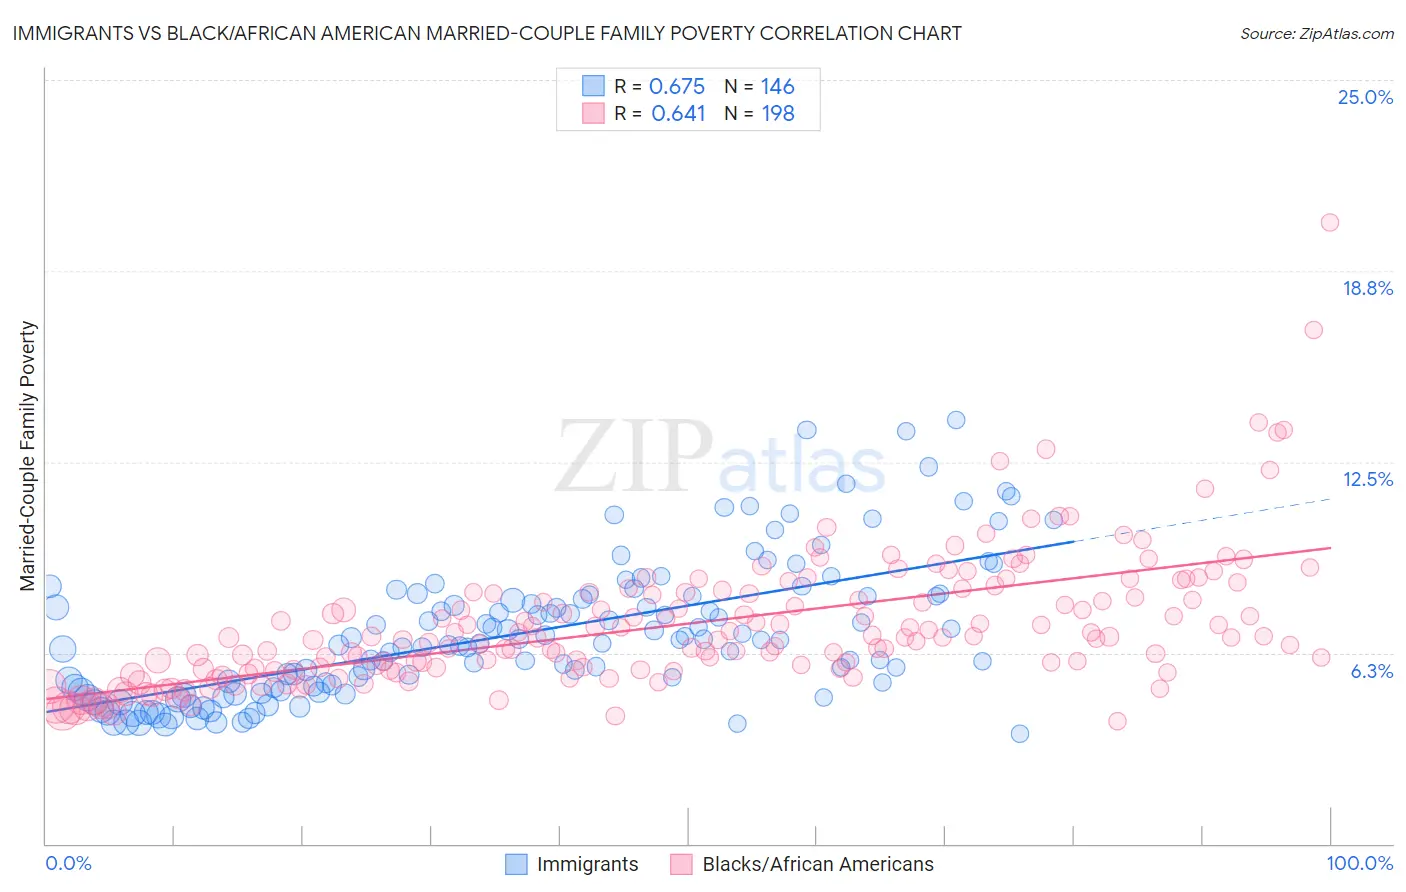
Immigrants vs Black/African American Married-Couple Family Poverty Correlation Chart
The statistical analysis conducted on geographies consisting of 562,504,380 people shows a significant positive correlation between the proportion of Immigrants and poverty level among married-couple families in the United States with a correlation coefficient (R) of 0.675 and weighted average of 6.0%. Similarly, the statistical analysis conducted on geographies consisting of 553,220,282 people shows a significant positive correlation between the proportion of Blacks/African Americans and poverty level among married-couple families in the United States with a correlation coefficient (R) of 0.641 and weighted average of 6.5%, a difference of 7.4%.
Married-Couple Family Poverty Correlation Summary
| Measurement | Immigrants | Black/African American |
| Minimum | 3.6% | 4.0% |
| Maximum | 13.9% | 20.4% |
| Range | 10.3% | 16.3% |
| Mean | 6.9% | 7.2% |
| Median | 6.6% | 6.8% |
| Interquartile 25% (IQ1) | 5.1% | 5.7% |
| Interquartile 75% (IQ3) | 8.1% | 8.2% |
| Interquartile Range (IQR) | 3.0% | 2.5% |
| Standard Deviation (Sample) | 2.2% | 2.2% |
| Standard Deviation (Population) | 2.2% | 2.2% |
Similar Demographics by Married-Couple Family Poverty
Demographics Similar to Immigrants by Married-Couple Family Poverty
In terms of married-couple family poverty, the demographic groups most similar to Immigrants are Immigrants from Burma/Myanmar (6.0%, a difference of 0.13%), Bangladeshi (6.0%, a difference of 0.37%), Alaskan Athabascan (6.1%, a difference of 0.58%), Jamaican (6.1%, a difference of 0.79%), and Comanche (6.0%, a difference of 0.87%).
| Demographics | Rating | Rank | Married-Couple Family Poverty |
| Immigrants | Ghana | 1.0 /100 | #251 | Tragic 5.9% |
| Immigrants | Western Asia | 0.7 /100 | #252 | Tragic 6.0% |
| Africans | 0.7 /100 | #253 | Tragic 6.0% |
| Immigrants | Somalia | 0.7 /100 | #254 | Tragic 6.0% |
| Comanche | 0.7 /100 | #255 | Tragic 6.0% |
| Bangladeshis | 0.5 /100 | #256 | Tragic 6.0% |
| Immigrants | Burma/Myanmar | 0.5 /100 | #257 | Tragic 6.0% |
| Immigrants | Immigrants | 0.5 /100 | #258 | Tragic 6.0% |
| Alaskan Athabascans | 0.4 /100 | #259 | Tragic 6.1% |
| Jamaicans | 0.3 /100 | #260 | Tragic 6.1% |
| Senegalese | 0.3 /100 | #261 | Tragic 6.1% |
| Shoshone | 0.3 /100 | #262 | Tragic 6.1% |
| Immigrants | Senegal | 0.3 /100 | #263 | Tragic 6.1% |
| Immigrants | Congo | 0.2 /100 | #264 | Tragic 6.1% |
| Blackfeet | 0.2 /100 | #265 | Tragic 6.2% |
Demographics Similar to Blacks/African Americans by Married-Couple Family Poverty
In terms of married-couple family poverty, the demographic groups most similar to Blacks/African Americans are Guyanese (6.5%, a difference of 0.10%), Ecuadorian (6.5%, a difference of 0.47%), Dutch West Indian (6.4%, a difference of 0.51%), Ute (6.4%, a difference of 0.63%), and Salvadoran (6.5%, a difference of 0.66%).
| Demographics | Rating | Rank | Married-Couple Family Poverty |
| Immigrants | Trinidad and Tobago | 0.1 /100 | #278 | Tragic 6.4% |
| Houma | 0.0 /100 | #279 | Tragic 6.4% |
| West Indians | 0.0 /100 | #280 | Tragic 6.4% |
| Mexican American Indians | 0.0 /100 | #281 | Tragic 6.4% |
| Seminole | 0.0 /100 | #282 | Tragic 6.4% |
| Ute | 0.0 /100 | #283 | Tragic 6.4% |
| Dutch West Indians | 0.0 /100 | #284 | Tragic 6.4% |
| Blacks/African Americans | 0.0 /100 | #285 | Tragic 6.5% |
| Guyanese | 0.0 /100 | #286 | Tragic 6.5% |
| Ecuadorians | 0.0 /100 | #287 | Tragic 6.5% |
| Salvadorans | 0.0 /100 | #288 | Tragic 6.5% |
| Nepalese | 0.0 /100 | #289 | Tragic 6.5% |
| Immigrants | Barbados | 0.0 /100 | #290 | Tragic 6.5% |
| Belizeans | 0.0 /100 | #291 | Tragic 6.5% |
| Immigrants | Lebanon | 0.0 /100 | #292 | Tragic 6.6% |