Immigrants vs Yuman Married-Couple Family Poverty
COMPARE
Immigrants
Yuman
Married-Couple Family Poverty
Married-Couple Family Poverty Comparison
Immigrants
Yuman
6.0%
MARRIED-COUPLE FAMILY POVERTY
0.5/ 100
METRIC RATING
258th/ 347
METRIC RANK
9.7%
MARRIED-COUPLE FAMILY POVERTY
0.0/ 100
METRIC RATING
340th/ 347
METRIC RANK
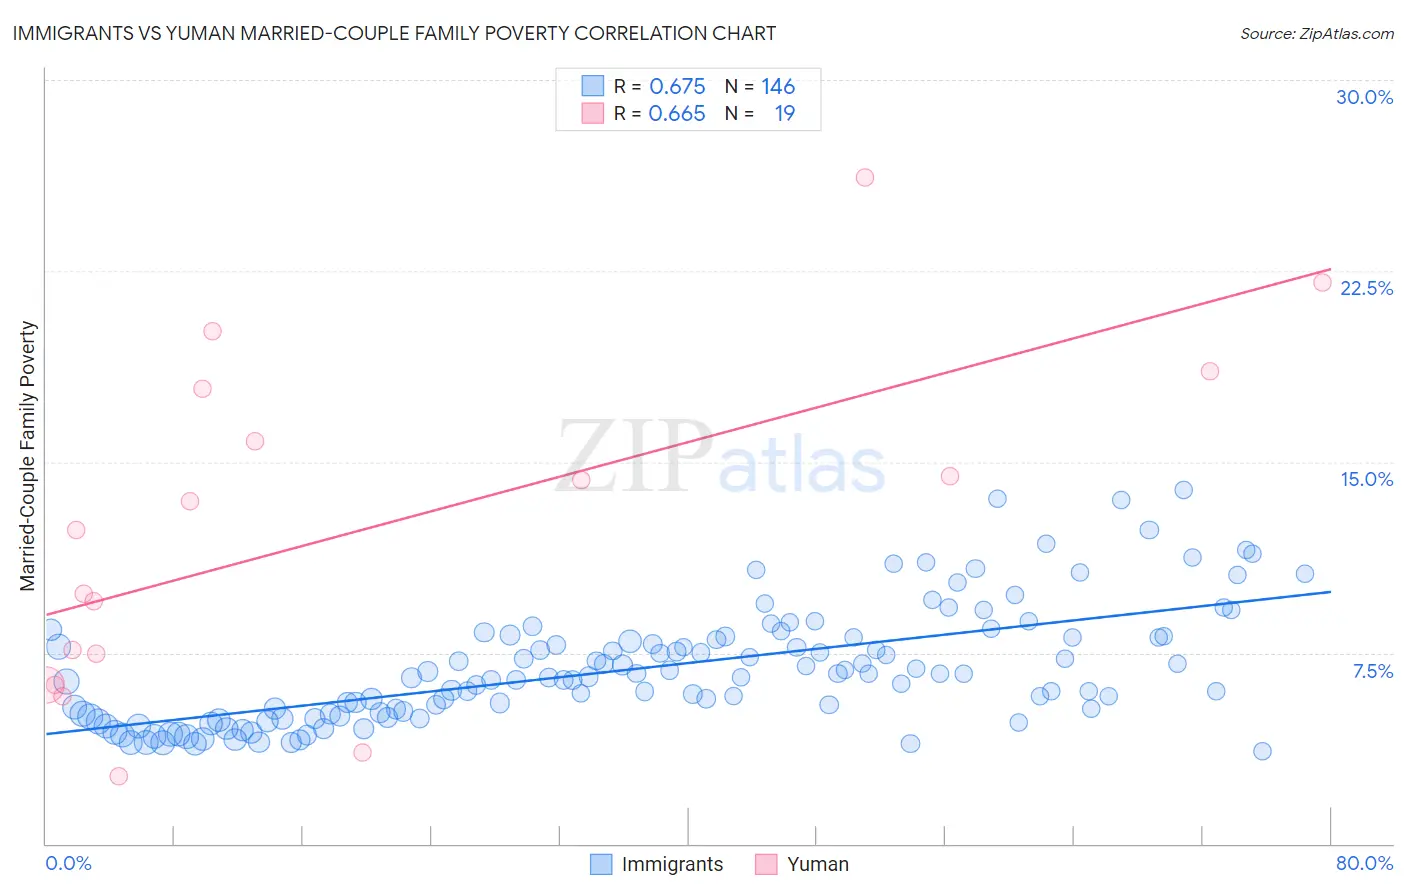
Immigrants vs Yuman Married-Couple Family Poverty Correlation Chart
The statistical analysis conducted on geographies consisting of 562,504,380 people shows a significant positive correlation between the proportion of Immigrants and poverty level among married-couple families in the United States with a correlation coefficient (R) of 0.675 and weighted average of 6.0%. Similarly, the statistical analysis conducted on geographies consisting of 40,644,577 people shows a significant positive correlation between the proportion of Yuman and poverty level among married-couple families in the United States with a correlation coefficient (R) of 0.665 and weighted average of 9.7%, a difference of 61.4%.
Married-Couple Family Poverty Correlation Summary
| Measurement | Immigrants | Yuman |
| Minimum | 3.6% | 2.7% |
| Maximum | 13.9% | 26.2% |
| Range | 10.3% | 23.5% |
| Mean | 6.9% | 12.3% |
| Median | 6.6% | 12.3% |
| Interquartile 25% (IQ1) | 5.1% | 6.2% |
| Interquartile 75% (IQ3) | 8.1% | 17.9% |
| Interquartile Range (IQR) | 3.0% | 11.6% |
| Standard Deviation (Sample) | 2.2% | 6.6% |
| Standard Deviation (Population) | 2.2% | 6.4% |
Similar Demographics by Married-Couple Family Poverty
Demographics Similar to Immigrants by Married-Couple Family Poverty
In terms of married-couple family poverty, the demographic groups most similar to Immigrants are Immigrants from Burma/Myanmar (6.0%, a difference of 0.13%), Bangladeshi (6.0%, a difference of 0.37%), Alaskan Athabascan (6.1%, a difference of 0.58%), Jamaican (6.1%, a difference of 0.79%), and Comanche (6.0%, a difference of 0.87%).
| Demographics | Rating | Rank | Married-Couple Family Poverty |
| Immigrants | Ghana | 1.0 /100 | #251 | Tragic 5.9% |
| Immigrants | Western Asia | 0.7 /100 | #252 | Tragic 6.0% |
| Africans | 0.7 /100 | #253 | Tragic 6.0% |
| Immigrants | Somalia | 0.7 /100 | #254 | Tragic 6.0% |
| Comanche | 0.7 /100 | #255 | Tragic 6.0% |
| Bangladeshis | 0.5 /100 | #256 | Tragic 6.0% |
| Immigrants | Burma/Myanmar | 0.5 /100 | #257 | Tragic 6.0% |
| Immigrants | Immigrants | 0.5 /100 | #258 | Tragic 6.0% |
| Alaskan Athabascans | 0.4 /100 | #259 | Tragic 6.1% |
| Jamaicans | 0.3 /100 | #260 | Tragic 6.1% |
| Senegalese | 0.3 /100 | #261 | Tragic 6.1% |
| Shoshone | 0.3 /100 | #262 | Tragic 6.1% |
| Immigrants | Senegal | 0.3 /100 | #263 | Tragic 6.1% |
| Immigrants | Congo | 0.2 /100 | #264 | Tragic 6.1% |
| Blackfeet | 0.2 /100 | #265 | Tragic 6.2% |
Demographics Similar to Yuman by Married-Couple Family Poverty
In terms of married-couple family poverty, the demographic groups most similar to Yuman are Crow (9.6%, a difference of 1.8%), Cheyenne (9.4%, a difference of 3.2%), Yakama (9.0%, a difference of 8.7%), Apache (9.0%, a difference of 8.7%), and Sioux (8.7%, a difference of 11.9%).
| Demographics | Rating | Rank | Married-Couple Family Poverty |
| Lumbee | 0.0 /100 | #333 | Tragic 8.3% |
| Immigrants | Dominican Republic | 0.0 /100 | #334 | Tragic 8.4% |
| Sioux | 0.0 /100 | #335 | Tragic 8.7% |
| Apache | 0.0 /100 | #336 | Tragic 9.0% |
| Yakama | 0.0 /100 | #337 | Tragic 9.0% |
| Cheyenne | 0.0 /100 | #338 | Tragic 9.4% |
| Crow | 0.0 /100 | #339 | Tragic 9.6% |
| Yuman | 0.0 /100 | #340 | Tragic 9.7% |
| Pueblo | 0.0 /100 | #341 | Tragic 11.1% |
| Tohono O'odham | 0.0 /100 | #342 | Tragic 11.2% |
| Pima | 0.0 /100 | #343 | Tragic 11.4% |
| Navajo | 0.0 /100 | #344 | Tragic 11.9% |
| Puerto Ricans | 0.0 /100 | #345 | Tragic 12.6% |
| Immigrants | Yemen | 0.0 /100 | #346 | Tragic 12.8% |
| Yup'ik | 0.0 /100 | #347 | Tragic 13.4% |