Immigrants Wage/Income Gap
COMPARE
Immigrants
Select to Compare
Wage/Income Gap
Immigrants Wage/Income Gap
25.1%
WAGE/INCOME GAP
82.3/ 100
METRIC RATING
150th/ 347
METRIC RANK
Immigrants Wage/Income Gap Correlation Chart
The statistical analysis conducted on geographies consisting of 574,033,804 people shows a moderate negative correlation between the proportion of Immigrants and wage/income gap percentage in the United States with a correlation coefficient (R) of -0.445 and weighted average of 25.1%. On average, for every 1% (one percent) increase in Immigrants within a typical geography, there is a decrease of 0.078% in wage/income gap percentage.
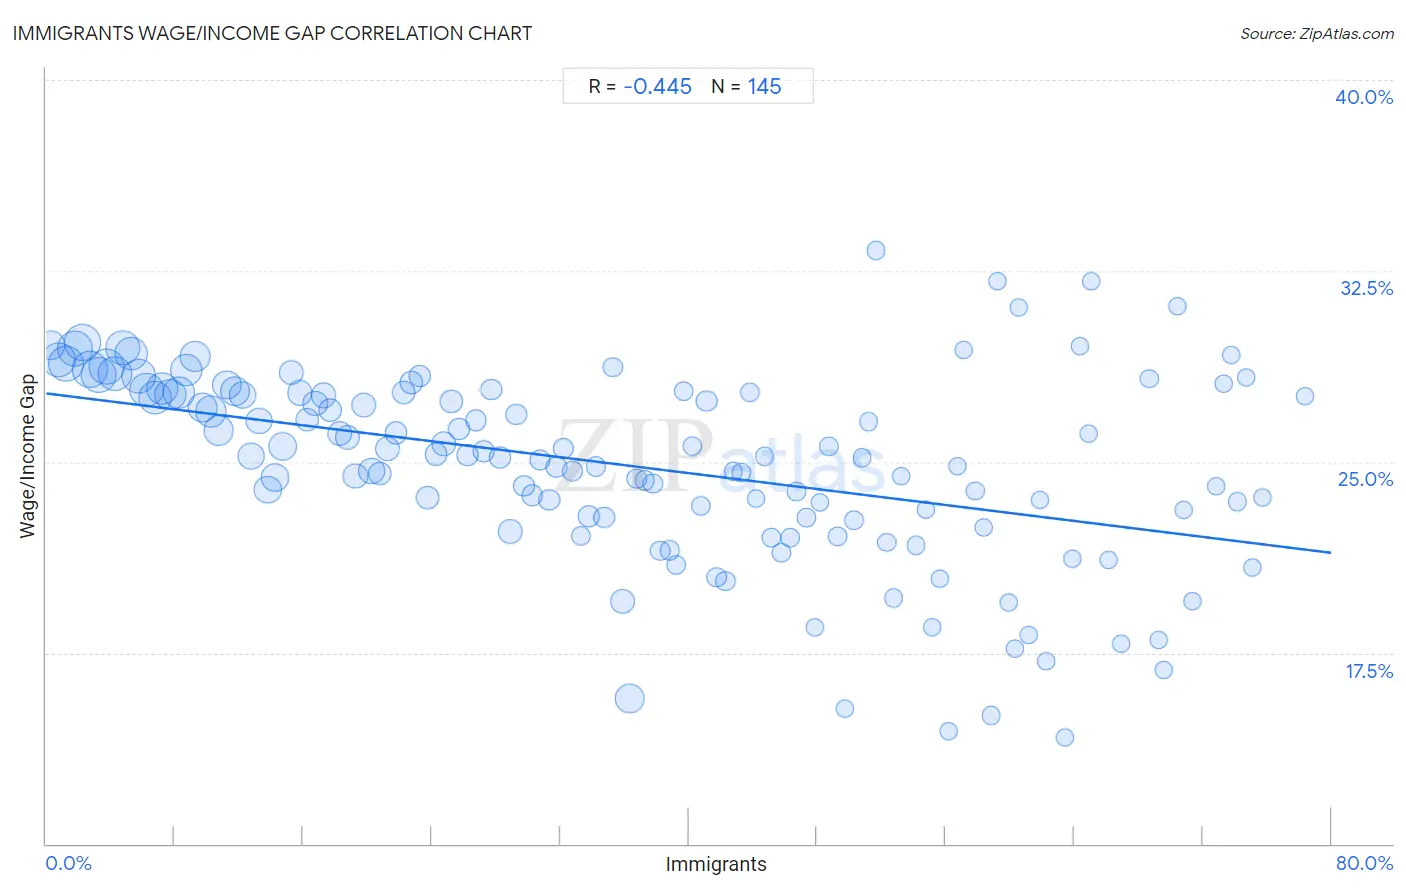
It is essential to understand that the correlation between the percentage of Immigrants and wage/income gap percentage does not imply a direct cause-and-effect relationship. It remains uncertain whether the presence of Immigrants influences an upward or downward trend in the level of wage/income gap percentage within an area, or if Immigrants simply ended up residing in those areas with higher or lower levels of wage/income gap percentage due to other factors.
Demographics Similar to Immigrants by Wage/Income Gap
In terms of wage/income gap, the demographic groups most similar to Immigrants are Immigrants from Peru (25.1%, a difference of 0.040%), Taiwanese (25.1%, a difference of 0.080%), Uruguayan (25.2%, a difference of 0.11%), Iroquois (25.1%, a difference of 0.19%), and Malaysian (25.0%, a difference of 0.33%).
| Demographics | Rating | Rank | Wage/Income Gap |
| Immigrants from Uganda | 88.0 /100 | #143 | Excellent 24.9% |
| Chippewa | 86.9 /100 | #144 | Excellent 25.0% |
| Comanche | 85.2 /100 | #145 | Excellent 25.0% |
| South Americans | 85.2 /100 | #146 | Excellent 25.0% |
| Malaysians | 84.9 /100 | #147 | Excellent 25.0% |
| Iroquois | 83.9 /100 | #148 | Excellent 25.1% |
| Immigrants from Peru | 82.6 /100 | #149 | Excellent 25.1% |
| Immigrants | 82.3 /100 | #150 | Excellent 25.1% |
| Taiwanese | 81.6 /100 | #151 | Excellent 25.1% |
| Uruguayans | 81.3 /100 | #152 | Excellent 25.2% |
| Blackfeet | 78.1 /100 | #153 | Good 25.2% |
| Immigrants from Northern Africa | 78.1 /100 | #154 | Good 25.2% |
| Immigrants from Vietnam | 77.7 /100 | #155 | Good 25.2% |
| Immigrants from Mexico | 76.4 /100 | #156 | Good 25.3% |
| Costa Ricans | 75.8 /100 | #157 | Good 25.3% |
Immigrants Wage/Income Gap Correlation Summary
| Measurement | Immigrants Data | Wage/Income Gap Data |
| Minimum | 0.28% | 14.2% |
| Maximum | 78.4% | 33.3% |
| Range | 78.1% | 19.1% |
| Mean | 36.7% | 24.8% |
| Median | 36.3% | 25.2% |
| Interquartile 25% (IQ1) | 18.0% | 22.8% |
| Interquartile 75% (IQ3) | 55.0% | 27.7% |
| Interquartile Range (IQR) | 37.0% | 5.0% |
| Standard Deviation (Sample) | 21.7% | 3.8% |
| Standard Deviation (Population) | 21.6% | 3.8% |
Correlation Details
| Immigrants Percentile | Sample Size | Wage/Income Gap |
[ 0.0% - 0.5% ] 0.28% | 9,576,019 | 29.6% |
[ 0.5% - 1.0% ] 0.76% | 14,635,650 | 29.0% |
[ 1.0% - 1.5% ] 1.25% | 15,674,815 | 28.9% |
[ 1.5% - 2.0% ] 1.75% | 15,546,507 | 29.5% |
[ 2.0% - 2.5% ] 2.24% | 16,554,334 | 29.7% |
[ 2.5% - 3.0% ] 2.74% | 15,618,831 | 28.6% |
[ 3.0% - 3.5% ] 3.24% | 15,616,225 | 28.4% |
[ 3.5% - 4.0% ] 3.75% | 14,804,319 | 28.7% |
[ 4.0% - 4.5% ] 4.25% | 14,569,606 | 28.5% |
[ 4.5% - 5.0% ] 4.75% | 13,869,481 | 29.5% |
[ 5.0% - 5.5% ] 5.26% | 13,438,595 | 29.3% |
[ 5.5% - 6.0% ] 5.75% | 14,423,810 | 28.4% |
[ 6.0% - 6.5% ] 6.24% | 13,659,933 | 27.8% |
[ 6.5% - 7.0% ] 6.75% | 13,048,756 | 27.5% |
[ 7.0% - 7.5% ] 7.24% | 12,585,640 | 27.9% |
[ 7.5% - 8.0% ] 7.74% | 11,569,052 | 27.6% |
[ 8.0% - 8.5% ] 8.23% | 11,924,394 | 27.7% |
[ 8.5% - 9.0% ] 8.74% | 12,065,327 | 28.6% |
[ 9.0% - 9.5% ] 9.25% | 10,767,960 | 29.1% |
[ 9.5% - 10.0% ] 9.76% | 9,874,522 | 27.1% |
[ 10.0% - 10.5% ] 10.26% | 11,667,508 | 27.0% |
[ 10.5% - 11.0% ] 10.74% | 10,230,203 | 26.2% |
[ 11.0% - 11.5% ] 11.24% | 8,893,068 | 28.0% |
[ 11.5% - 12.0% ] 11.76% | 9,949,604 | 27.8% |
[ 12.0% - 12.5% ] 12.22% | 7,638,192 | 27.6% |
[ 12.5% - 13.0% ] 12.75% | 7,927,271 | 25.2% |
[ 13.0% - 13.5% ] 13.25% | 7,126,333 | 26.6% |
[ 13.5% - 14.0% ] 13.80% | 8,290,965 | 23.9% |
[ 14.0% - 14.5% ] 14.24% | 8,794,424 | 24.4% |
[ 14.5% - 15.0% ] 14.73% | 8,569,941 | 25.6% |
[ 15.0% - 15.5% ] 15.23% | 5,429,752 | 28.5% |
[ 15.5% - 16.0% ] 15.77% | 5,906,748 | 27.7% |
[ 16.0% - 16.5% ] 16.23% | 4,988,419 | 26.7% |
[ 16.5% - 17.0% ] 16.74% | 6,083,847 | 27.3% |
[ 17.0% - 17.5% ] 17.25% | 5,942,753 | 27.6% |
[ 17.5% - 18.0% ] 17.70% | 4,118,538 | 27.0% |
[ 18.0% - 18.5% ] 18.25% | 5,981,144 | 26.1% |
[ 18.5% - 19.0% ] 18.78% | 5,658,687 | 26.0% |
[ 19.0% - 19.5% ] 19.26% | 5,931,655 | 24.4% |
[ 19.5% - 20.0% ] 19.74% | 5,464,271 | 27.2% |
[ 20.0% - 20.5% ] 20.27% | 7,104,037 | 24.6% |
[ 20.5% - 21.0% ] 20.77% | 4,826,370 | 24.6% |
[ 21.0% - 21.5% ] 21.23% | 5,550,061 | 25.5% |
[ 21.5% - 22.0% ] 21.77% | 3,708,485 | 26.1% |
[ 22.0% - 22.5% ] 22.23% | 4,418,513 | 27.7% |
[ 22.5% - 23.0% ] 22.73% | 4,302,152 | 28.1% |
[ 23.0% - 23.5% ] 23.24% | 3,753,333 | 28.4% |
[ 23.5% - 24.0% ] 23.76% | 4,192,139 | 23.6% |
[ 24.0% - 24.5% ] 24.28% | 3,606,299 | 25.3% |
[ 24.5% - 25.0% ] 24.75% | 5,515,520 | 25.7% |
[ 25.0% - 25.5% ] 25.25% | 4,171,291 | 27.4% |
[ 25.5% - 26.0% ] 25.69% | 2,914,263 | 26.3% |
[ 26.0% - 26.5% ] 26.24% | 3,197,642 | 25.3% |
[ 26.5% - 27.0% ] 26.76% | 2,750,551 | 26.6% |
[ 27.0% - 27.5% ] 27.27% | 3,313,784 | 25.4% |
[ 27.5% - 28.0% ] 27.73% | 2,967,445 | 27.8% |
[ 28.0% - 28.5% ] 28.24% | 3,345,054 | 25.2% |
[ 28.5% - 29.0% ] 28.86% | 5,102,442 | 22.3% |
[ 29.0% - 29.5% ] 29.27% | 3,115,214 | 26.9% |
[ 29.5% - 30.0% ] 29.76% | 2,777,196 | 24.1% |
[ 30.0% - 30.5% ] 30.27% | 2,696,651 | 23.7% |
[ 30.5% - 31.0% ] 30.74% | 2,237,746 | 25.1% |
[ 31.0% - 31.5% ] 31.31% | 2,412,502 | 23.5% |
[ 31.5% - 32.0% ] 31.75% | 2,831,307 | 24.8% |
[ 32.0% - 32.5% ] 32.21% | 2,885,198 | 25.5% |
[ 32.5% - 33.0% ] 32.75% | 2,360,360 | 24.6% |
[ 33.0% - 33.5% ] 33.27% | 1,733,854 | 22.1% |
[ 33.5% - 34.0% ] 33.74% | 3,244,831 | 22.9% |
[ 34.0% - 34.5% ] 34.23% | 1,747,997 | 24.8% |
[ 34.5% - 35.0% ] 34.74% | 2,389,278 | 22.8% |
[ 35.0% - 35.5% ] 35.26% | 1,581,483 | 28.7% |
[ 35.5% - 36.0% ] 35.91% | 5,380,274 | 19.5% |
[ 36.0% - 36.5% ] 36.32% | 10,443,886 | 15.7% |
[ 36.5% - 37.0% ] 36.77% | 1,321,623 | 24.4% |
[ 37.0% - 37.5% ] 37.26% | 1,594,041 | 24.3% |
[ 37.5% - 38.0% ] 37.76% | 1,535,090 | 24.1% |
[ 38.0% - 38.5% ] 38.23% | 1,926,717 | 21.5% |
[ 38.5% - 39.0% ] 38.81% | 1,608,627 | 21.5% |
[ 39.0% - 39.5% ] 39.23% | 1,153,771 | 21.0% |
[ 39.5% - 40.0% ] 39.69% | 1,208,757 | 27.8% |
[ 40.0% - 40.5% ] 40.25% | 1,247,639 | 25.6% |
[ 40.5% - 41.0% ] 40.76% | 1,730,431 | 23.3% |
[ 41.0% - 41.5% ] 41.11% | 2,636,733 | 27.4% |
[ 41.5% - 42.0% ] 41.73% | 1,523,960 | 20.5% |
[ 42.0% - 42.5% ] 42.28% | 1,498,492 | 20.3% |
[ 42.5% - 43.0% ] 42.78% | 813,133 | 24.6% |
[ 43.0% - 43.5% ] 43.26% | 889,554 | 24.6% |
[ 43.5% - 44.0% ] 43.79% | 1,287,360 | 27.7% |
[ 44.0% - 44.5% ] 44.20% | 368,068 | 23.6% |
[ 44.5% - 45.0% ] 44.72% | 858,196 | 25.2% |
[ 45.0% - 45.5% ] 45.14% | 864,566 | 22.0% |
[ 45.5% - 46.0% ] 45.75% | 709,591 | 21.4% |
[ 46.0% - 46.5% ] 46.30% | 775,770 | 22.0% |
[ 46.5% - 47.0% ] 46.72% | 703,197 | 23.8% |
[ 47.0% - 47.5% ] 47.30% | 841,252 | 22.8% |
[ 47.5% - 48.0% ] 47.83% | 277,496 | 18.5% |
[ 48.0% - 48.5% ] 48.14% | 168,845 | 23.4% |
[ 48.5% - 49.0% ] 48.74% | 845,241 | 25.6% |
[ 49.0% - 49.5% ] 49.28% | 847,079 | 22.1% |
[ 49.5% - 50.0% ] 49.69% | 163,809 | 15.3% |
[ 50.0% - 50.5% ] 50.28% | 640,490 | 22.7% |
[ 50.5% - 51.0% ] 50.79% | 730,358 | 25.2% |
[ 51.0% - 51.5% ] 51.18% | 319,766 | 26.6% |
[ 51.5% - 52.0% ] 51.67% | 305,356 | 33.3% |
[ 52.0% - 52.5% ] 52.32% | 204,872 | 21.8% |
[ 52.5% - 53.0% ] 52.76% | 236,458 | 19.7% |
[ 53.0% - 53.5% ] 53.23% | 136,298 | 24.5% |
[ 54.0% - 54.5% ] 54.17% | 373,431 | 21.7% |
[ 54.5% - 55.0% ] 54.78% | 593,586 | 23.1% |
[ 55.0% - 55.5% ] 55.18% | 482,691 | 18.5% |
[ 55.5% - 56.0% ] 55.61% | 148,280 | 20.4% |
[ 56.0% - 56.5% ] 56.17% | 91,247 | 14.4% |
[ 56.5% - 57.0% ] 56.71% | 75,557 | 24.8% |
[ 57.0% - 57.5% ] 57.13% | 110,375 | 29.4% |
[ 57.5% - 58.0% ] 57.84% | 597,246 | 23.9% |
[ 58.0% - 58.5% ] 58.34% | 98,125 | 22.4% |
[ 58.5% - 59.0% ] 58.80% | 221,458 | 15.0% |
[ 59.0% - 59.5% ] 59.19% | 85,497 | 32.1% |
[ 59.5% - 60.0% ] 59.92% | 15,483 | 19.5% |
[ 60.0% - 60.5% ] 60.30% | 153,212 | 17.7% |
[ 60.5% - 61.0% ] 60.53% | 35,967 | 31.1% |
[ 61.0% - 61.5% ] 61.13% | 58,079 | 18.2% |
[ 61.5% - 62.0% ] 61.88% | 128,561 | 23.5% |
[ 62.0% - 62.5% ] 62.28% | 93,794 | 17.2% |
[ 63.0% - 63.5% ] 63.43% | 26,419 | 14.2% |
[ 63.5% - 64.0% ] 63.91% | 115,520 | 21.2% |
[ 64.0% - 64.5% ] 64.33% | 109,357 | 29.5% |
[ 64.5% - 65.0% ] 64.88% | 104,741 | 26.1% |
[ 65.0% - 65.5% ] 65.08% | 51,333 | 32.1% |
[ 66.0% - 66.5% ] 66.17% | 152,851 | 21.2% |
[ 66.5% - 67.0% ] 66.91% | 109,218 | 17.9% |
[ 68.5% - 69.0% ] 68.68% | 119,624 | 28.3% |
[ 69.0% - 69.5% ] 69.26% | 90,791 | 18.0% |
[ 69.5% - 70.0% ] 69.58% | 766 | 16.8% |
[ 70.0% - 70.5% ] 70.39% | 115,169 | 31.1% |
[ 70.5% - 71.0% ] 70.79% | 137,895 | 23.1% |
[ 71.0% - 71.5% ] 71.37% | 45,620 | 19.5% |
[ 72.5% - 73.0% ] 72.85% | 57,066 | 24.0% |
[ 73.0% - 73.5% ] 73.31% | 29,830 | 28.1% |
[ 73.5% - 74.0% ] 73.75% | 19,399 | 29.2% |
[ 74.0% - 74.5% ] 74.15% | 257,738 | 23.4% |
[ 74.5% - 75.0% ] 74.68% | 46,798 | 28.3% |
[ 75.0% - 75.5% ] 75.10% | 71,088 | 20.9% |
[ 75.5% - 76.0% ] 75.74% | 1,018 | 23.6% |
[ 78.0% - 78.5% ] 78.37% | 42,081 | 27.6% |