Immigrants from Thailand 3 or more Vehicles in Household
COMPARE
Immigrants from Thailand
Select to Compare
3 or more Vehicles in Household
Immigrants from Thailand 3 or more Vehicles in Household
20.5%
3+ VEHICLES AVAILABLE
93.8/ 100
METRIC RATING
121st/ 347
METRIC RANK
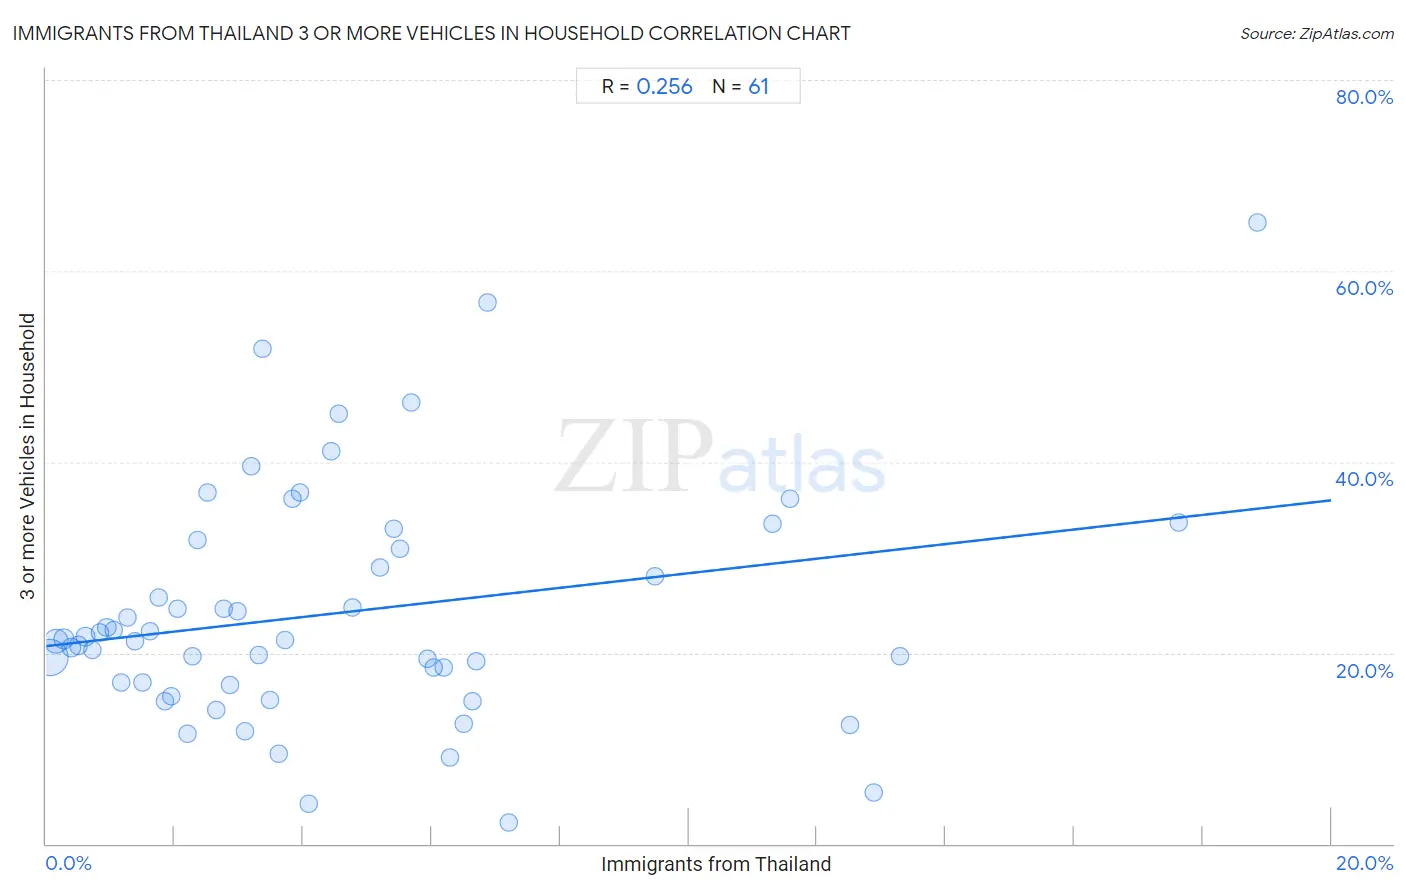
Immigrants from Thailand 3 or more Vehicles in Household Correlation Chart
The statistical analysis conducted on geographies consisting of 316,892,438 people shows a weak positive correlation between the proportion of Immigrants from Thailand and percentage of households with 3 or more vehicles available in the United States with a correlation coefficient (R) of 0.256 and weighted average of 20.5%. On average, for every 1% (one percent) increase in Immigrants from Thailand within a typical geography, there is an increase of 0.76% in percentage of households with 3 or more vehicles available.
It is essential to understand that the correlation between the percentage of Immigrants from Thailand and percentage of households with 3 or more vehicles available does not imply a direct cause-and-effect relationship. It remains uncertain whether the presence of Immigrants from Thailand influences an upward or downward trend in the level of percentage of households with 3 or more vehicles available within an area, or if Immigrants from Thailand simply ended up residing in those areas with higher or lower levels of percentage of households with 3 or more vehicles available due to other factors.
Demographics Similar to Immigrants from Thailand by 3 or more Vehicles in Household
In terms of 3 or more vehicles in household, the demographic groups most similar to Immigrants from Thailand are Maltese (20.5%, a difference of 0.010%), German Russian (20.5%, a difference of 0.040%), Immigrants from Korea (20.5%, a difference of 0.050%), Immigrants from Latin America (20.5%, a difference of 0.21%), and Central American (20.5%, a difference of 0.22%).
| Demographics | Rating | Rank | 3 or more Vehicles in Household |
| Burmese | 95.8 /100 | #114 | Exceptional 20.6% |
| French Canadians | 95.0 /100 | #115 | Exceptional 20.6% |
| Italians | 94.9 /100 | #116 | Exceptional 20.6% |
| Croatians | 94.9 /100 | #117 | Exceptional 20.6% |
| Costa Ricans | 94.6 /100 | #118 | Exceptional 20.6% |
| Immigrants from Latin America | 94.5 /100 | #119 | Exceptional 20.5% |
| Maltese | 93.9 /100 | #120 | Exceptional 20.5% |
| Immigrants from Thailand | 93.8 /100 | #121 | Exceptional 20.5% |
| German Russians | 93.7 /100 | #122 | Exceptional 20.5% |
| Immigrants from Korea | 93.7 /100 | #123 | Exceptional 20.5% |
| Central Americans | 93.1 /100 | #124 | Exceptional 20.5% |
| Immigrants from Netherlands | 92.9 /100 | #125 | Exceptional 20.4% |
| Slavs | 92.1 /100 | #126 | Exceptional 20.4% |
| Immigrants from Bolivia | 92.0 /100 | #127 | Exceptional 20.4% |
| New Zealanders | 91.3 /100 | #128 | Exceptional 20.4% |
Immigrants from Thailand 3 or more Vehicles in Household Correlation Summary
| Measurement | Immigrants from Thailand Data | 3 or more Vehicles in Household Data |
| Minimum | 0.054% | 2.3% |
| Maximum | 18.8% | 65.1% |
| Range | 18.8% | 62.9% |
| Mean | 4.6% | 24.2% |
| Median | 3.4% | 21.4% |
| Interquartile 25% (IQ1) | 1.7% | 16.7% |
| Interquartile 75% (IQ3) | 6.1% | 31.3% |
| Interquartile Range (IQR) | 4.4% | 14.6% |
| Standard Deviation (Sample) | 4.1% | 12.3% |
| Standard Deviation (Population) | 4.1% | 12.2% |
Correlation Details
| Immigrants from Thailand Percentile | Sample Size | 3 or more Vehicles in Household |
[ 0.0% - 0.5% ] 0.054% | 196,950,156 | 19.5% |
[ 0.0% - 0.5% ] 0.16% | 66,521,770 | 21.2% |
[ 0.0% - 0.5% ] 0.27% | 23,640,795 | 21.4% |
[ 0.0% - 0.5% ] 0.38% | 11,969,017 | 20.6% |
[ 0.0% - 0.5% ] 0.50% | 6,066,749 | 20.8% |
[ 0.5% - 1.0% ] 0.61% | 3,112,035 | 21.7% |
[ 0.5% - 1.0% ] 0.72% | 2,376,855 | 20.3% |
[ 0.5% - 1.0% ] 0.83% | 1,154,456 | 22.1% |
[ 0.5% - 1.0% ] 0.94% | 684,903 | 22.6% |
[ 1.0% - 1.5% ] 1.06% | 833,117 | 22.5% |
[ 1.0% - 1.5% ] 1.16% | 473,993 | 16.9% |
[ 1.0% - 1.5% ] 1.27% | 358,573 | 23.7% |
[ 1.0% - 1.5% ] 1.39% | 519,302 | 21.3% |
[ 1.5% - 2.0% ] 1.51% | 439,683 | 16.8% |
[ 1.5% - 2.0% ] 1.61% | 197,779 | 22.3% |
[ 1.5% - 2.0% ] 1.76% | 249,706 | 25.8% |
[ 1.5% - 2.0% ] 1.84% | 109,699 | 14.9% |
[ 1.5% - 2.0% ] 1.95% | 76,754 | 15.4% |
[ 2.0% - 2.5% ] 2.04% | 165,531 | 24.6% |
[ 2.0% - 2.5% ] 2.19% | 124,686 | 11.5% |
[ 2.0% - 2.5% ] 2.27% | 87,426 | 19.6% |
[ 2.0% - 2.5% ] 2.35% | 18,735 | 31.8% |
[ 2.5% - 3.0% ] 2.52% | 18,268 | 36.8% |
[ 2.5% - 3.0% ] 2.65% | 317,962 | 14.0% |
[ 2.5% - 3.0% ] 2.75% | 23,718 | 24.6% |
[ 2.5% - 3.0% ] 2.85% | 47,949 | 16.6% |
[ 2.5% - 3.0% ] 2.97% | 61,569 | 24.3% |
[ 3.0% - 3.5% ] 3.08% | 45,062 | 11.8% |
[ 3.0% - 3.5% ] 3.18% | 1,414 | 39.6% |
[ 3.0% - 3.5% ] 3.30% | 16,289 | 19.8% |
[ 3.0% - 3.5% ] 3.37% | 2,584 | 51.9% |
[ 3.0% - 3.5% ] 3.49% | 85,478 | 15.1% |
[ 3.5% - 4.0% ] 3.63% | 17,681 | 9.4% |
[ 3.5% - 4.0% ] 3.71% | 6,065 | 21.4% |
[ 3.5% - 4.0% ] 3.83% | 3,496 | 36.2% |
[ 3.5% - 4.0% ] 3.95% | 380 | 36.8% |
[ 4.0% - 4.5% ] 4.08% | 834 | 4.3% |
[ 4.0% - 4.5% ] 4.44% | 540 | 41.1% |
[ 4.5% - 5.0% ] 4.55% | 88 | 45.0% |
[ 4.5% - 5.0% ] 4.76% | 987 | 24.8% |
[ 5.0% - 5.5% ] 5.19% | 289 | 28.9% |
[ 5.0% - 5.5% ] 5.41% | 296 | 33.1% |
[ 5.5% - 6.0% ] 5.51% | 399 | 30.9% |
[ 5.5% - 6.0% ] 5.69% | 879 | 46.3% |
[ 5.5% - 6.0% ] 5.93% | 58,959 | 19.4% |
[ 6.0% - 6.5% ] 6.03% | 564 | 18.4% |
[ 6.0% - 6.5% ] 6.18% | 1,035 | 18.4% |
[ 6.0% - 6.5% ] 6.28% | 557 | 9.1% |
[ 6.5% - 7.0% ] 6.51% | 1,045 | 12.6% |
[ 6.5% - 7.0% ] 6.63% | 19,613 | 15.0% |
[ 6.5% - 7.0% ] 6.70% | 19,501 | 19.1% |
[ 6.5% - 7.0% ] 6.87% | 262 | 56.7% |
[ 7.0% - 7.5% ] 7.20% | 2,332 | 2.3% |
[ 9.0% - 9.5% ] 9.47% | 1,035 | 28.1% |
[ 11.0% - 11.5% ] 11.30% | 478 | 33.5% |
[ 11.5% - 12.0% ] 11.57% | 1,132 | 36.1% |
[ 12.0% - 12.5% ] 12.50% | 32 | 12.5% |
[ 12.5% - 13.0% ] 12.87% | 404 | 5.4% |
[ 13.0% - 13.5% ] 13.29% | 948 | 19.6% |
[ 17.5% - 18.0% ] 17.62% | 403 | 33.6% |
[ 18.5% - 19.0% ] 18.85% | 191 | 65.1% |