Immigrants from Norway vs Taiwanese Married-Couple Family Poverty
COMPARE
Immigrants from Norway
Taiwanese
Married-Couple Family Poverty
Married-Couple Family Poverty Comparison
Immigrants from Norway
Taiwanese
4.6%
MARRIED-COUPLE FAMILY POVERTY
98.4/ 100
METRIC RATING
92nd/ 347
METRIC RANK
4.8%
MARRIED-COUPLE FAMILY POVERTY
94.8/ 100
METRIC RATING
115th/ 347
METRIC RANK
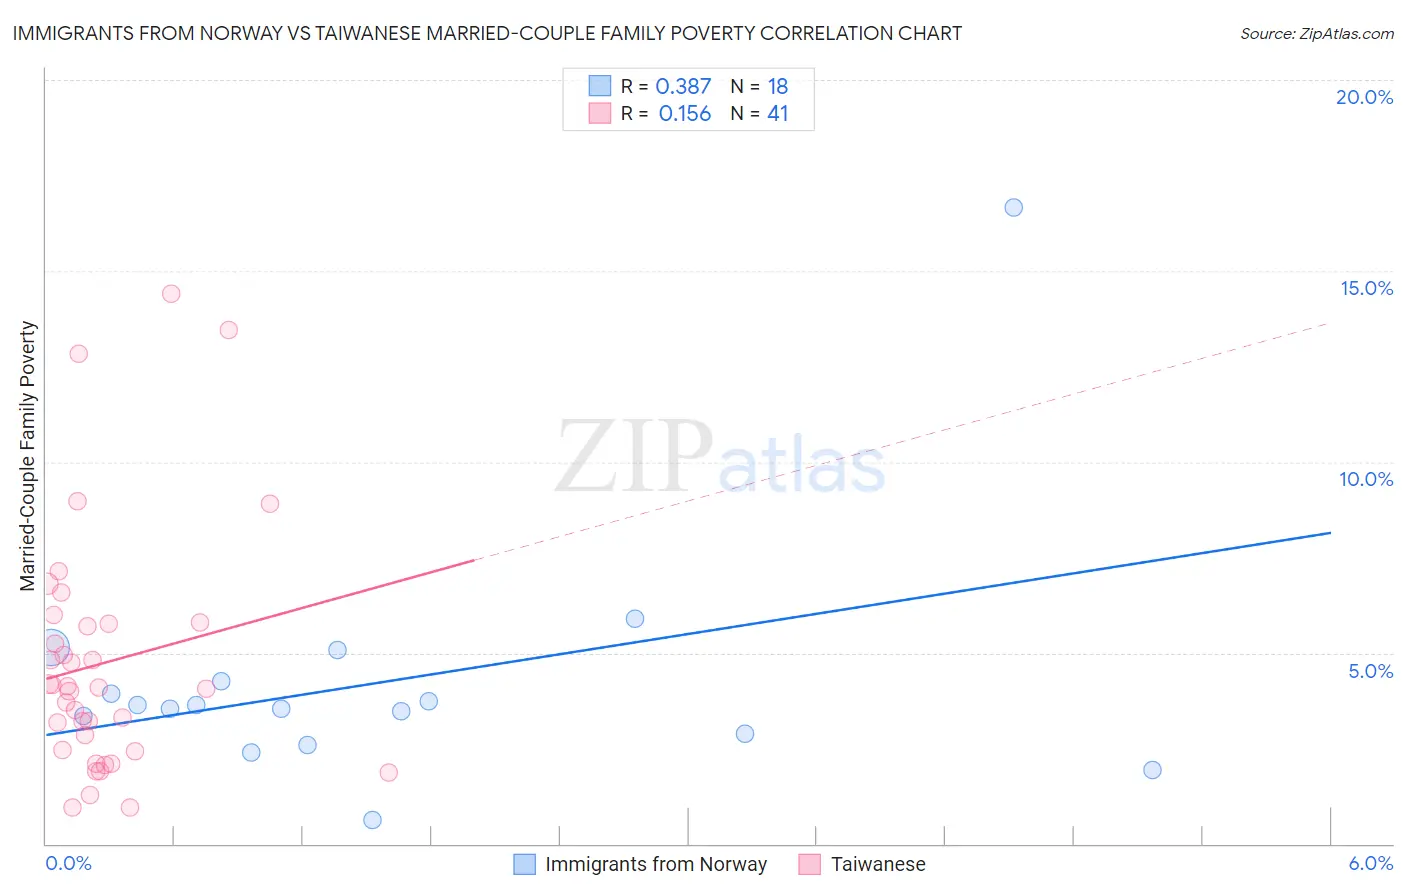
Immigrants from Norway vs Taiwanese Married-Couple Family Poverty Correlation Chart
The statistical analysis conducted on geographies consisting of 116,278,414 people shows a mild positive correlation between the proportion of Immigrants from Norway and poverty level among married-couple families in the United States with a correlation coefficient (R) of 0.387 and weighted average of 4.6%. Similarly, the statistical analysis conducted on geographies consisting of 31,702,060 people shows a poor positive correlation between the proportion of Taiwanese and poverty level among married-couple families in the United States with a correlation coefficient (R) of 0.156 and weighted average of 4.8%, a difference of 4.1%.
Married-Couple Family Poverty Correlation Summary
| Measurement | Immigrants from Norway | Taiwanese |
| Minimum | 0.62% | 0.94% |
| Maximum | 16.7% | 14.4% |
| Range | 16.1% | 13.5% |
| Mean | 4.2% | 4.7% |
| Median | 3.6% | 4.1% |
| Interquartile 25% (IQ1) | 2.9% | 2.4% |
| Interquartile 75% (IQ3) | 4.2% | 5.8% |
| Interquartile Range (IQR) | 1.4% | 3.3% |
| Standard Deviation (Sample) | 3.3% | 3.2% |
| Standard Deviation (Population) | 3.2% | 3.1% |
Similar Demographics by Married-Couple Family Poverty
Demographics Similar to Immigrants from Norway by Married-Couple Family Poverty
In terms of married-couple family poverty, the demographic groups most similar to Immigrants from Norway are Basque (4.6%, a difference of 0.080%), Immigrants from Switzerland (4.6%, a difference of 0.11%), Immigrants from Czechoslovakia (4.6%, a difference of 0.18%), Korean (4.6%, a difference of 0.18%), and Immigrants from Italy (4.6%, a difference of 0.23%).
| Demographics | Rating | Rank | Married-Couple Family Poverty |
| South Africans | 98.7 /100 | #85 | Exceptional 4.6% |
| Immigrants | Turkey | 98.6 /100 | #86 | Exceptional 4.6% |
| Immigrants | North Macedonia | 98.6 /100 | #87 | Exceptional 4.6% |
| Bolivians | 98.6 /100 | #88 | Exceptional 4.6% |
| Immigrants | Czechoslovakia | 98.5 /100 | #89 | Exceptional 4.6% |
| Immigrants | Switzerland | 98.5 /100 | #90 | Exceptional 4.6% |
| Basques | 98.5 /100 | #91 | Exceptional 4.6% |
| Immigrants | Norway | 98.4 /100 | #92 | Exceptional 4.6% |
| Koreans | 98.3 /100 | #93 | Exceptional 4.6% |
| Immigrants | Italy | 98.3 /100 | #94 | Exceptional 4.6% |
| Portuguese | 98.3 /100 | #95 | Exceptional 4.6% |
| Immigrants | Poland | 98.3 /100 | #96 | Exceptional 4.6% |
| Immigrants | Belgium | 98.2 /100 | #97 | Exceptional 4.6% |
| Native Hawaiians | 98.0 /100 | #98 | Exceptional 4.6% |
| Immigrants | Europe | 97.9 /100 | #99 | Exceptional 4.6% |
Demographics Similar to Taiwanese by Married-Couple Family Poverty
In terms of married-couple family poverty, the demographic groups most similar to Taiwanese are Celtic (4.8%, a difference of 0.010%), Kenyan (4.8%, a difference of 0.11%), Immigrants from Philippines (4.8%, a difference of 0.13%), Immigrants from Indonesia (4.8%, a difference of 0.15%), and Immigrants from Eastern Asia (4.8%, a difference of 0.50%).
| Demographics | Rating | Rank | Married-Couple Family Poverty |
| Laotians | 96.6 /100 | #108 | Exceptional 4.7% |
| Immigrants | Hong Kong | 96.4 /100 | #109 | Exceptional 4.7% |
| Immigrants | Bolivia | 96.2 /100 | #110 | Exceptional 4.7% |
| Pakistanis | 96.2 /100 | #111 | Exceptional 4.7% |
| Tongans | 95.9 /100 | #112 | Exceptional 4.7% |
| Immigrants | Nepal | 95.9 /100 | #113 | Exceptional 4.7% |
| Immigrants | Indonesia | 95.1 /100 | #114 | Exceptional 4.8% |
| Taiwanese | 94.8 /100 | #115 | Exceptional 4.8% |
| Celtics | 94.8 /100 | #116 | Exceptional 4.8% |
| Kenyans | 94.7 /100 | #117 | Exceptional 4.8% |
| Immigrants | Philippines | 94.6 /100 | #118 | Exceptional 4.8% |
| Immigrants | Eastern Asia | 94.0 /100 | #119 | Exceptional 4.8% |
| Immigrants | Southern Europe | 93.4 /100 | #120 | Exceptional 4.8% |
| Indians (Asian) | 93.2 /100 | #121 | Exceptional 4.8% |
| Whites/Caucasians | 93.1 /100 | #122 | Exceptional 4.8% |