Immigrants from Norway vs Zimbabwean Married-Couple Family Poverty
COMPARE
Immigrants from Norway
Zimbabwean
Married-Couple Family Poverty
Married-Couple Family Poverty Comparison
Immigrants from Norway
Zimbabweans
4.6%
MARRIED-COUPLE FAMILY POVERTY
98.4/ 100
METRIC RATING
92nd/ 347
METRIC RANK
4.1%
MARRIED-COUPLE FAMILY POVERTY
99.9/ 100
METRIC RATING
21st/ 347
METRIC RANK
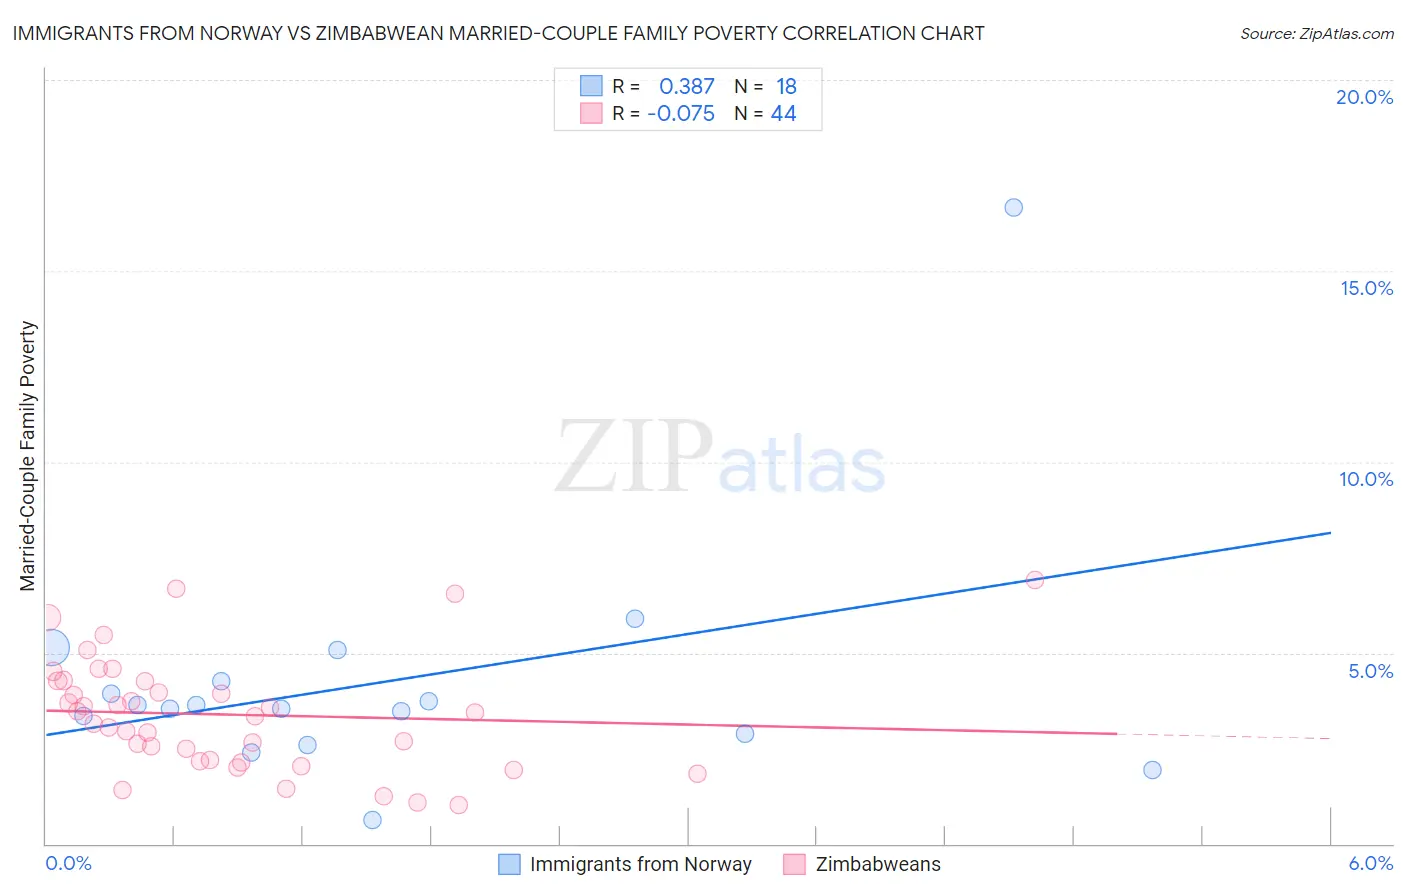
Immigrants from Norway vs Zimbabwean Married-Couple Family Poverty Correlation Chart
The statistical analysis conducted on geographies consisting of 116,278,414 people shows a mild positive correlation between the proportion of Immigrants from Norway and poverty level among married-couple families in the United States with a correlation coefficient (R) of 0.387 and weighted average of 4.6%. Similarly, the statistical analysis conducted on geographies consisting of 69,119,087 people shows a slight negative correlation between the proportion of Zimbabweans and poverty level among married-couple families in the United States with a correlation coefficient (R) of -0.075 and weighted average of 4.1%, a difference of 12.5%.
Married-Couple Family Poverty Correlation Summary
| Measurement | Immigrants from Norway | Zimbabwean |
| Minimum | 0.62% | 1.0% |
| Maximum | 16.7% | 6.9% |
| Range | 16.1% | 5.9% |
| Mean | 4.2% | 3.4% |
| Median | 3.6% | 3.4% |
| Interquartile 25% (IQ1) | 2.9% | 2.2% |
| Interquartile 75% (IQ3) | 4.2% | 4.3% |
| Interquartile Range (IQR) | 1.4% | 2.1% |
| Standard Deviation (Sample) | 3.3% | 1.5% |
| Standard Deviation (Population) | 3.2% | 1.5% |
Similar Demographics by Married-Couple Family Poverty
Demographics Similar to Immigrants from Norway by Married-Couple Family Poverty
In terms of married-couple family poverty, the demographic groups most similar to Immigrants from Norway are Basque (4.6%, a difference of 0.080%), Immigrants from Switzerland (4.6%, a difference of 0.11%), Immigrants from Czechoslovakia (4.6%, a difference of 0.18%), Korean (4.6%, a difference of 0.18%), and Immigrants from Italy (4.6%, a difference of 0.23%).
| Demographics | Rating | Rank | Married-Couple Family Poverty |
| South Africans | 98.7 /100 | #85 | Exceptional 4.6% |
| Immigrants | Turkey | 98.6 /100 | #86 | Exceptional 4.6% |
| Immigrants | North Macedonia | 98.6 /100 | #87 | Exceptional 4.6% |
| Bolivians | 98.6 /100 | #88 | Exceptional 4.6% |
| Immigrants | Czechoslovakia | 98.5 /100 | #89 | Exceptional 4.6% |
| Immigrants | Switzerland | 98.5 /100 | #90 | Exceptional 4.6% |
| Basques | 98.5 /100 | #91 | Exceptional 4.6% |
| Immigrants | Norway | 98.4 /100 | #92 | Exceptional 4.6% |
| Koreans | 98.3 /100 | #93 | Exceptional 4.6% |
| Immigrants | Italy | 98.3 /100 | #94 | Exceptional 4.6% |
| Portuguese | 98.3 /100 | #95 | Exceptional 4.6% |
| Immigrants | Poland | 98.3 /100 | #96 | Exceptional 4.6% |
| Immigrants | Belgium | 98.2 /100 | #97 | Exceptional 4.6% |
| Native Hawaiians | 98.0 /100 | #98 | Exceptional 4.6% |
| Immigrants | Europe | 97.9 /100 | #99 | Exceptional 4.6% |
Demographics Similar to Zimbabweans by Married-Couple Family Poverty
In terms of married-couple family poverty, the demographic groups most similar to Zimbabweans are Maltese (4.1%, a difference of 0.030%), Immigrants from Ireland (4.1%, a difference of 0.27%), Immigrants from Singapore (4.1%, a difference of 0.37%), Bhutanese (4.1%, a difference of 0.39%), and Eastern European (4.1%, a difference of 0.62%).
| Demographics | Rating | Rank | Married-Couple Family Poverty |
| Slovaks | 100.0 /100 | #14 | Exceptional 4.0% |
| Poles | 100.0 /100 | #15 | Exceptional 4.0% |
| Germans | 100.0 /100 | #16 | Exceptional 4.0% |
| Filipinos | 100.0 /100 | #17 | Exceptional 4.0% |
| Italians | 100.0 /100 | #18 | Exceptional 4.0% |
| Immigrants | Ireland | 99.9 /100 | #19 | Exceptional 4.1% |
| Maltese | 99.9 /100 | #20 | Exceptional 4.1% |
| Zimbabweans | 99.9 /100 | #21 | Exceptional 4.1% |
| Immigrants | Singapore | 99.9 /100 | #22 | Exceptional 4.1% |
| Bhutanese | 99.9 /100 | #23 | Exceptional 4.1% |
| Eastern Europeans | 99.9 /100 | #24 | Exceptional 4.1% |
| Immigrants | Taiwan | 99.9 /100 | #25 | Exceptional 4.1% |
| Cypriots | 99.9 /100 | #26 | Exceptional 4.1% |
| Danes | 99.9 /100 | #27 | Exceptional 4.1% |
| Scandinavians | 99.9 /100 | #28 | Exceptional 4.1% |