Immigrants from Norway vs Asian Married-Couple Family Poverty
COMPARE
Immigrants from Norway
Asian
Married-Couple Family Poverty
Married-Couple Family Poverty Comparison
Immigrants from Norway
Asians
4.6%
MARRIED-COUPLE FAMILY POVERTY
98.4/ 100
METRIC RATING
92nd/ 347
METRIC RANK
4.7%
MARRIED-COUPLE FAMILY POVERTY
97.6/ 100
METRIC RATING
102nd/ 347
METRIC RANK
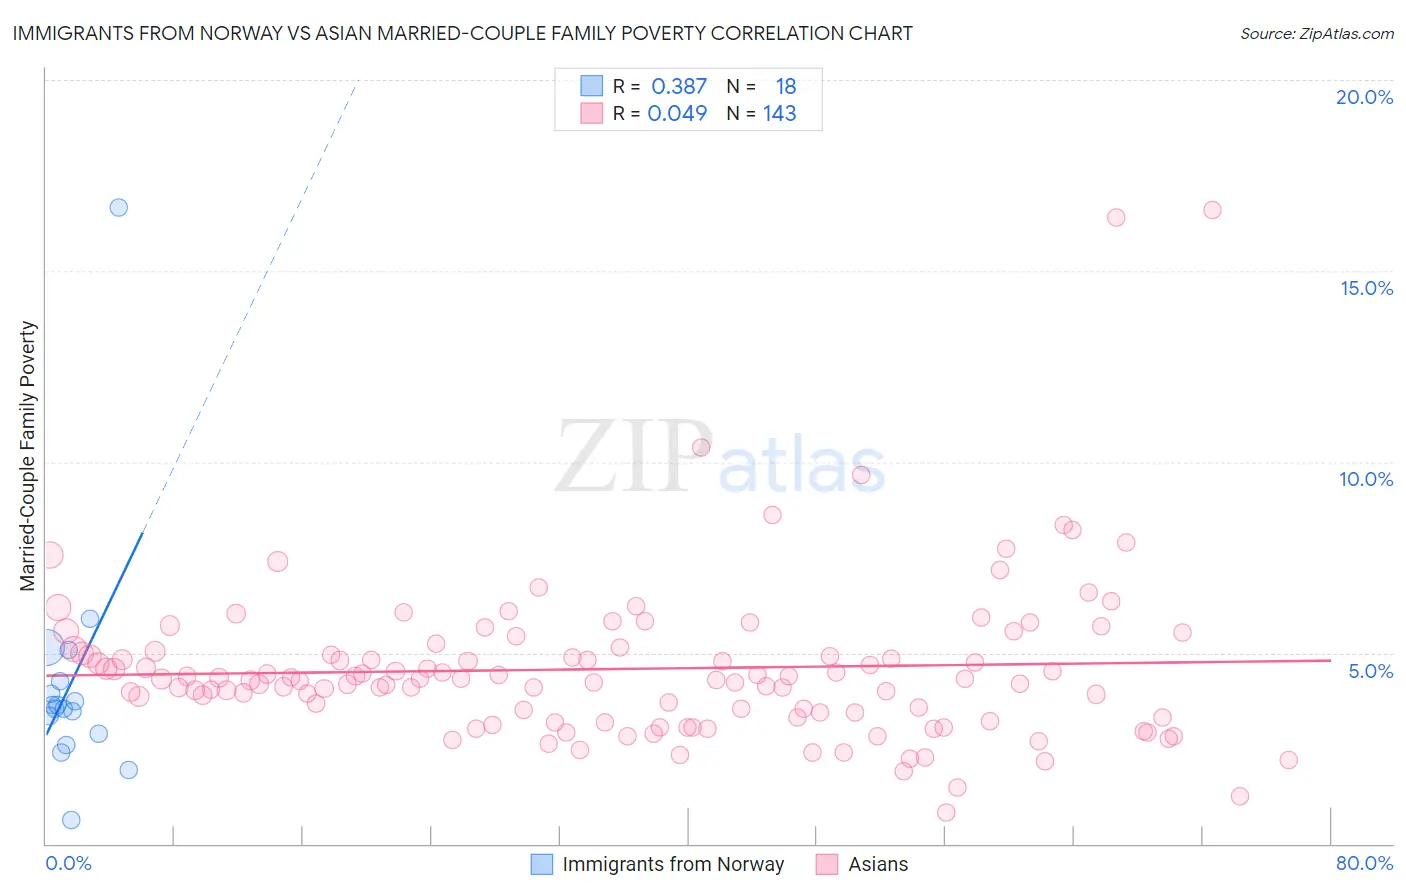
Immigrants from Norway vs Asian Married-Couple Family Poverty Correlation Chart
The statistical analysis conducted on geographies consisting of 116,278,414 people shows a mild positive correlation between the proportion of Immigrants from Norway and poverty level among married-couple families in the United States with a correlation coefficient (R) of 0.387 and weighted average of 4.6%. Similarly, the statistical analysis conducted on geographies consisting of 539,455,145 people shows no correlation between the proportion of Asians and poverty level among married-couple families in the United States with a correlation coefficient (R) of 0.049 and weighted average of 4.7%, a difference of 1.5%.
Married-Couple Family Poverty Correlation Summary
| Measurement | Immigrants from Norway | Asian |
| Minimum | 0.62% | 0.82% |
| Maximum | 16.7% | 16.6% |
| Range | 16.1% | 15.8% |
| Mean | 4.2% | 4.6% |
| Median | 3.6% | 4.3% |
| Interquartile 25% (IQ1) | 2.9% | 3.3% |
| Interquartile 75% (IQ3) | 4.2% | 5.1% |
| Interquartile Range (IQR) | 1.4% | 1.7% |
| Standard Deviation (Sample) | 3.3% | 2.1% |
| Standard Deviation (Population) | 3.2% | 2.1% |
Demographics Similar to Immigrants from Norway and Asians by Married-Couple Family Poverty
In terms of married-couple family poverty, the demographic groups most similar to Immigrants from Norway are Basque (4.6%, a difference of 0.080%), Immigrants from Switzerland (4.6%, a difference of 0.11%), Immigrants from Czechoslovakia (4.6%, a difference of 0.18%), Korean (4.6%, a difference of 0.18%), and Immigrants from Italy (4.6%, a difference of 0.23%). Similarly, the demographic groups most similar to Asians are Immigrants from Romania (4.7%, a difference of 0.29%), Yugoslavian (4.6%, a difference of 0.40%), Immigrants from Western Europe (4.6%, a difference of 0.42%), Immigrants from Europe (4.6%, a difference of 0.53%), and Immigrants from Moldova (4.7%, a difference of 0.63%).
| Demographics | Rating | Rank | Married-Couple Family Poverty |
| Immigrants | North Macedonia | 98.6 /100 | #87 | Exceptional 4.6% |
| Bolivians | 98.6 /100 | #88 | Exceptional 4.6% |
| Immigrants | Czechoslovakia | 98.5 /100 | #89 | Exceptional 4.6% |
| Immigrants | Switzerland | 98.5 /100 | #90 | Exceptional 4.6% |
| Basques | 98.5 /100 | #91 | Exceptional 4.6% |
| Immigrants | Norway | 98.4 /100 | #92 | Exceptional 4.6% |
| Koreans | 98.3 /100 | #93 | Exceptional 4.6% |
| Immigrants | Italy | 98.3 /100 | #94 | Exceptional 4.6% |
| Portuguese | 98.3 /100 | #95 | Exceptional 4.6% |
| Immigrants | Poland | 98.3 /100 | #96 | Exceptional 4.6% |
| Immigrants | Belgium | 98.2 /100 | #97 | Exceptional 4.6% |
| Native Hawaiians | 98.0 /100 | #98 | Exceptional 4.6% |
| Immigrants | Europe | 97.9 /100 | #99 | Exceptional 4.6% |
| Immigrants | Western Europe | 97.9 /100 | #100 | Exceptional 4.6% |
| Yugoslavians | 97.8 /100 | #101 | Exceptional 4.6% |
| Asians | 97.6 /100 | #102 | Exceptional 4.7% |
| Immigrants | Romania | 97.3 /100 | #103 | Exceptional 4.7% |
| Immigrants | Moldova | 97.1 /100 | #104 | Exceptional 4.7% |
| Aleuts | 97.0 /100 | #105 | Exceptional 4.7% |
| Immigrants | France | 96.9 /100 | #106 | Exceptional 4.7% |
| Immigrants | Germany | 96.8 /100 | #107 | Exceptional 4.7% |